

Abstract
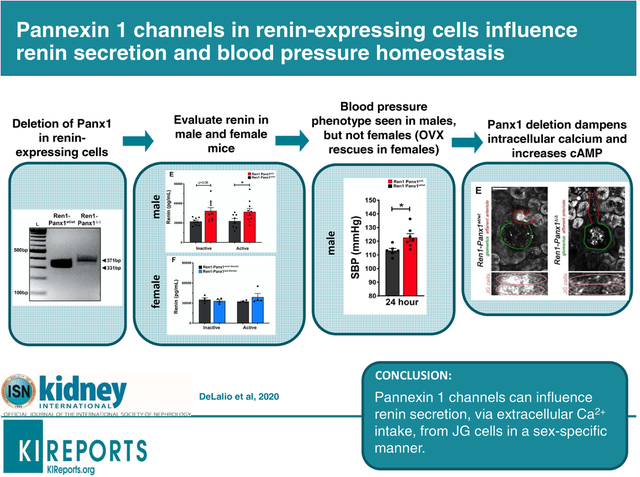
Kidney function and blood pressure homeostasis are regulated by purinergic signaling mechanisms. These autocrine/paracrine signaling pathways are initiated by the release of cellular ATP, which influences kidney hemodynamics and steady-state renin secretion from juxtaglomerular cells. However, the mechanism responsible for ATP release that supports tonic inputs to juxtaglomerular cells and regulates renin secretion remains unclear. Pannexin 1 (Panx1) channels localize to both afferent arterioles and juxtaglomerular cells, and provide a transmembrane conduit for ATP release and ion permeability in the kidney and the vasculature. We hypothesized that Panx1 channels in renin-expressing cells regulate renin secretion in vivo. Using a renin cell-specific Panx1 knockout model, we found that male Panx1 deficient mice exhibiting a heightened activation of the renin-angiotensin-aldosterone system have markedly increased plasma renin and aldosterone concentrations, and elevated mean arterial pressure with altered peripheral hemodynamics. Following ovariectomy, female mice mirrored the male phenotype. Furthermore, constitutive Panx1 channel activity was observed in As4.1 renin-secreting cells, whereby Panx1 knockdown reduced extracellular ATP accumulation, lowered basal intracellular calcium concentrations and recapitulated a hyper-secretory renin phenotype. Moreover, in response to stress stimuli that lower blood pressure, Panx1-deficient mice exhibited aberrant “renin recruitment” as evidenced by reactivation of renin expression in pre-glomerular arteriolar smooth muscle cells. Thus, renin-cell Panx1 channels suppress renin secretion and influence adaptive renin responses when blood pressure homeostasis is threatened.
Keywords: Pannexin 1, blood pressure, renin, RAAS, kidney, purinergic
Graphical Abstract
INTRODUCTION:
The renin-angiotensin-aldosterone system (RAAS) plays a preeminent role in long-term blood pressure control. This complex system is controlled by overlapping hormonal, neural, and physical stimuli, which maintain fluid/electrolyte balance, intravascular fluid volume, and stable arterial blood pressure (ABP)1–4. Control of RAAS activity is mediated at the level of renin secreting juxtaglomerular (JG) cells in the afferent arteriole5. JG cells synthesize and secrete renin, an aspartyl protease that executes the rate-limiting step for production of angiotensin-derived pressor peptides6. JG cells localize to the preglomerular afferent arterioles and release renin in response to acute stimuli7–10. When homeostasis is threatened and a persistent demand to elevate ABP exists, preglomerular smooth muscle cells re-engage their fetal renin gene programs to bolster renin production– termed renin recruitment11–13. However, the role of purinergic signaling in JG cell function are not understood.
In the kidney, purinergic signaling events are initiated by extracellular ATP and its metabolic products14. The renal tubules and vasculature express a wide array of purinergic receptors that include the P2 and P1 family of receptors14–16. In the renal vasculature, P2 receptor agonism increases renal vascular resistance17–19 and promotes renin secretion from JG cells20–24. In contrast, P1 receptor agonism mediates tubuloglomerular feedback and suppression of renin secretion in a calcium-dependent manner25–30. Thus, ATP accumulation and degradation controls differential actions on renin secretion. The mechanisms that promote extracellular ATP accumulation in the renal vasculature remain enigmatic.
Pannexin 1 (Panx1) channels have emerged as a primary mode of transmembrane ATP efflux31–33. Panx1-mediated ATP release occurs in diverse cell types and organ systems32, 34, 35, and is capable of mediating physiological and pathological processes in the kidney15, 36, 37 and the vasculature38–41. Work from our laboratory and others have shown that Panx1 is expressed within the murine kidney39, 42 and co-localizes with α-actin positive smooth muscle cells in the afferent arteriole37.
Given the cellular localization of Panx1 and the functional importance of purinergic signaling in regulating renin secretion and renin recruitment, we hypothesized that Panx1 deletion from renin expressing cells would enhance renin secretion and recruitment. To test this hypothesis, we generated a renin cell-specific constitutive knockout model to delete Panx1 selectively from renin-expressing cells of the juxtaglomerular apparatus. Using this model, we provide evidence for an unidentified and sex-specific role for Panx1 channels in the renal vasculature to regulate RAAS and ABP.
RESULTS
We generated a renin-cell specific Panx1 knockout mouse (Ren1-Panx1Δ/Δ) using the Ren1d-Cre recombinase43 (Fig. 1A). Recombination of loxP sites flanking Panx1 was analyzed by PCR and yielded an amplicon of predicted size (371bp) for the deletion of exon 3 from Panx1 (Fig. 1B). Additionally, Ren1-Panx1Δ/Δ and Ren1-Panx1fl/fl control animals were bred with mice harboring a stop-flox EYFP R26R reporter allele (Ren1-Panx1Δ/Δ (EYFP)) to assess the distribution of renovascular cells. In Ren1-Panx1Δ/Δ (EYFP) mice, EYFP fluorescence was detected in the juxtaglomerular apparatus, renal arterioles, and a subset of proximal tubular cells as previously described43 and absent in Cre negative mice (Fig. 1C). Compared to controls, Ren1-Panx1Δ/Δ mice had a significant reduction of Panx1 (Fig. 1D). Deletion of Panx1 did not alter glomerular or tubular morphology (Supplemental Fig. 1), or kidney function (Table 1).
Figure 1. Deletion of Pannexin 1 from renin expressing cells causes enhanced renin secretion in a sex-specific manner.
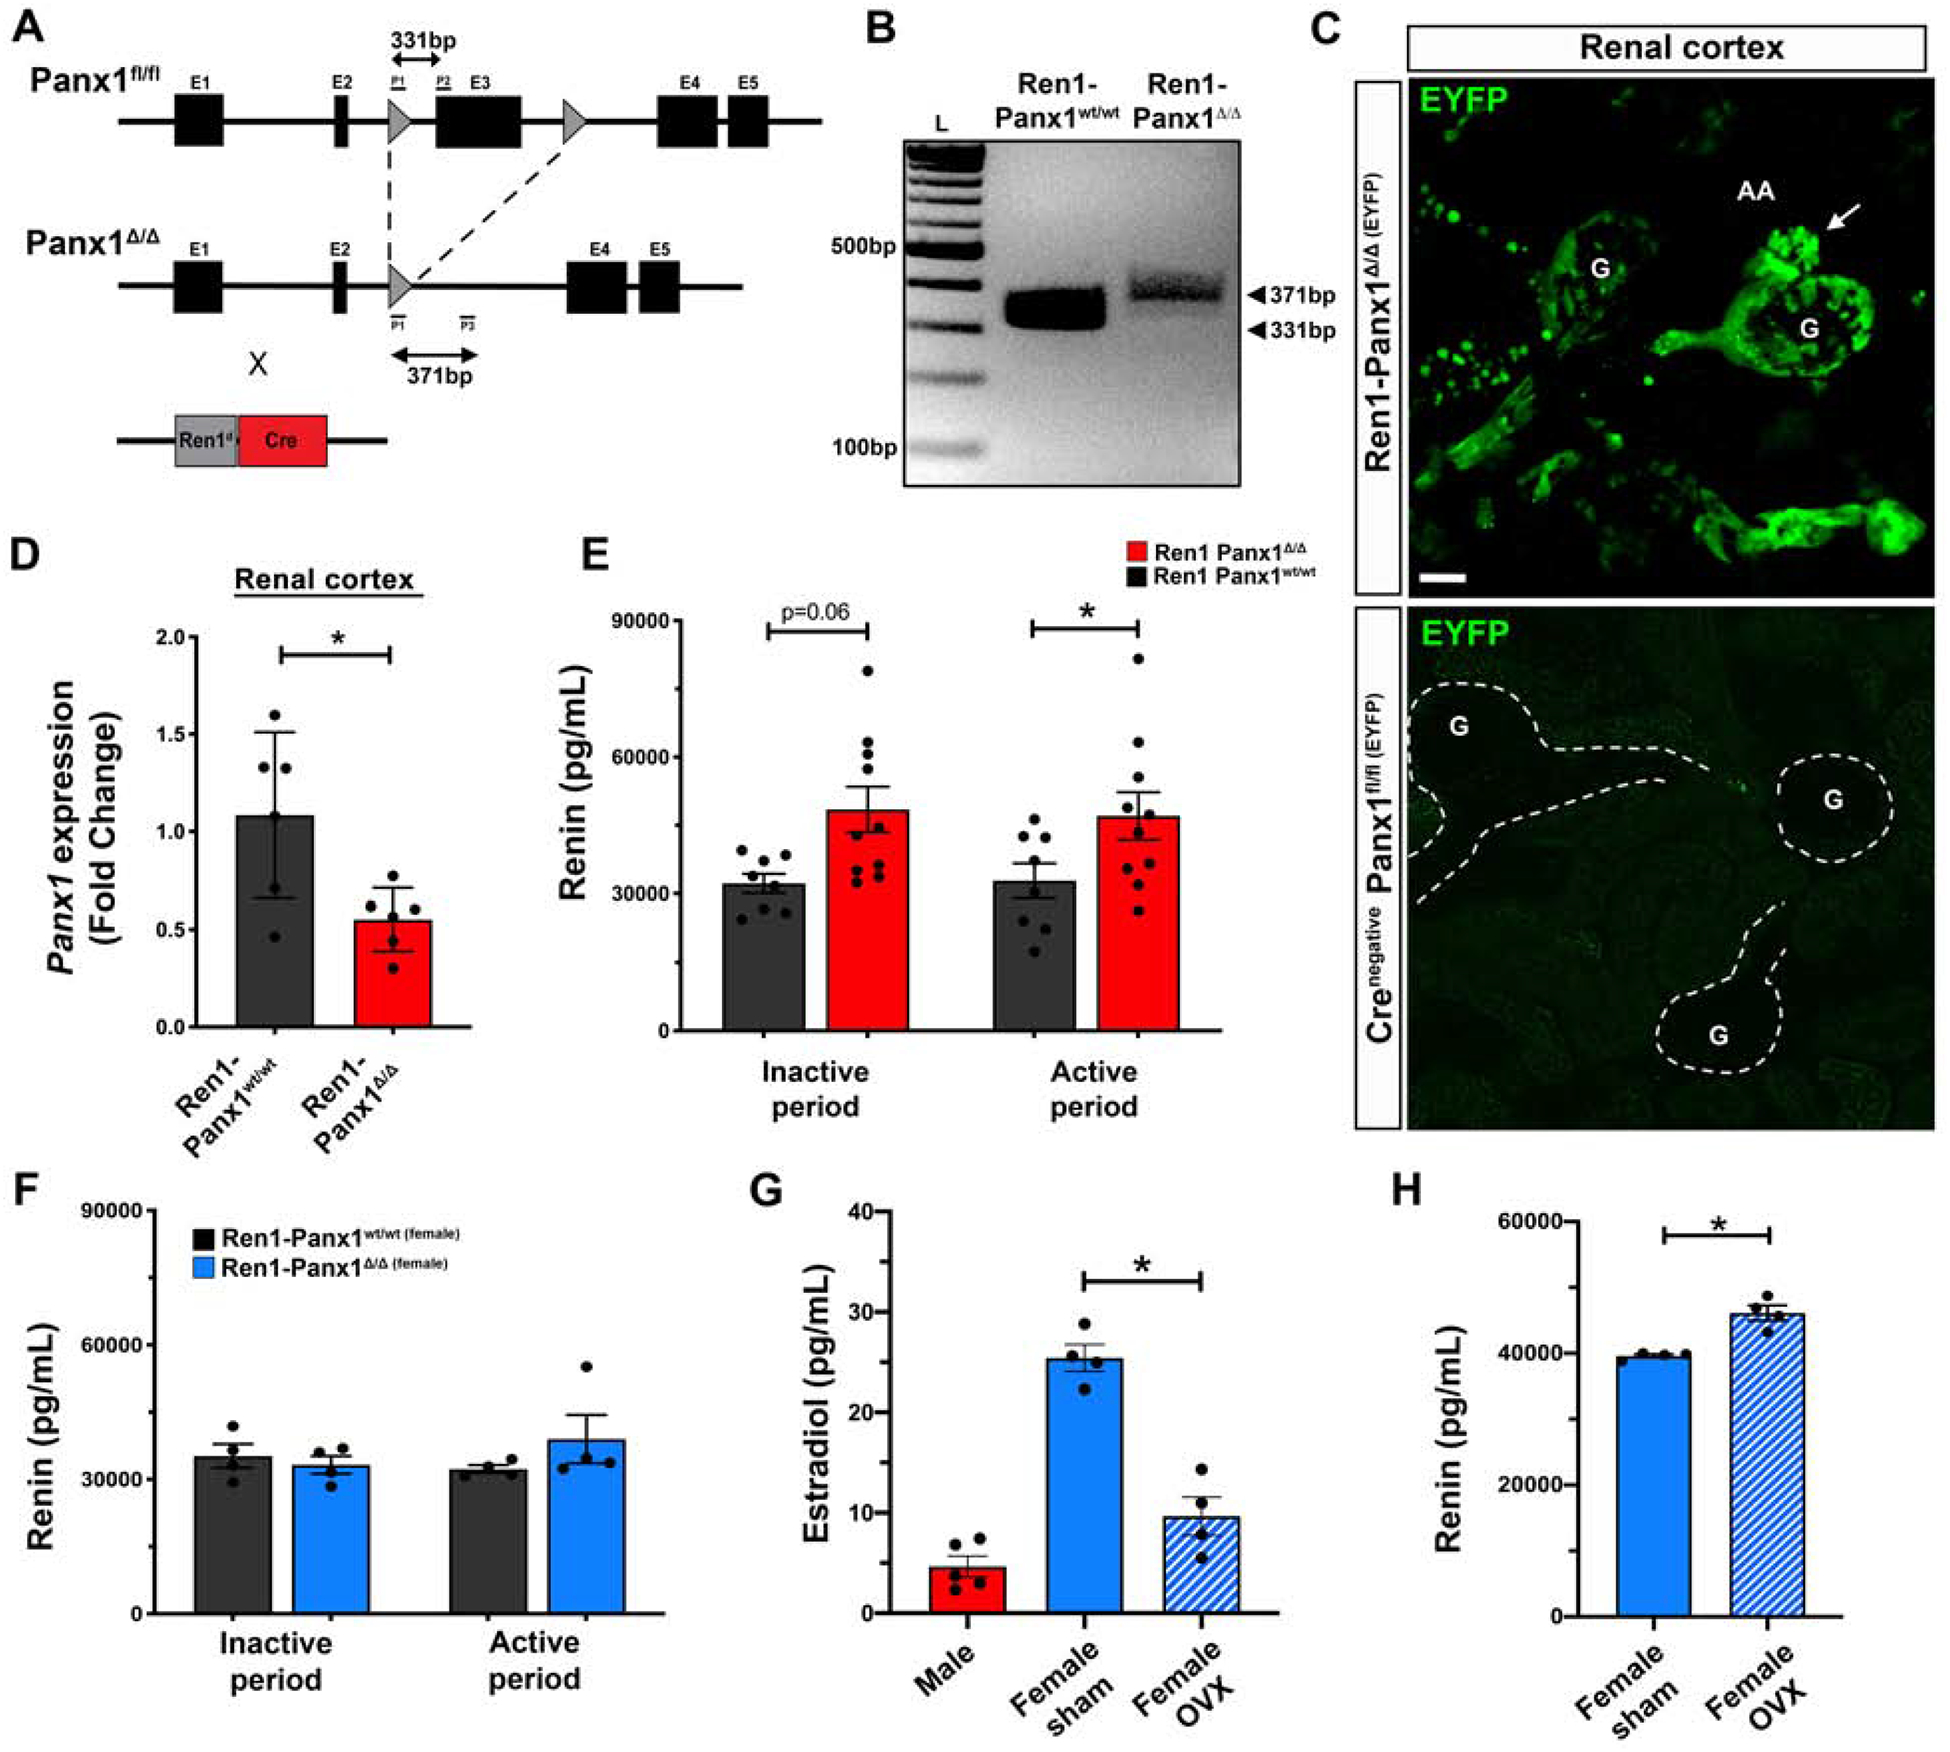
(A) Gene map indicating recombination sites flanking Panx1 exon 3. Deletion of Panx1 achieved using animals harboring one allele for Cre recombinase (Ren1d) and one wildtype allele. (B) Validation of recombination from PCR amplification products run on agarose gel from Ren1-Panx1wt/wt control (331bp) and Ren1-Panx1Δ/Δ knockout mouse (371bp). (C) Whole mount kidney renal cortical slices from renin lineage cells in juxtaglomerular apparatus labeled with EYFP after breeding R26R-EYFP (Gt(ROSA)26Sortm1(EYFP)Cos) with Ren1-Panx1Δ/Δ. A Cre-negative Panx1fl/fl(EYFP) was assessed as a control. Glomerulus (G), afferent arteriole (AA), efferent arteriole (EA); Scale bar=20μm. Arrow indicates cluster of preglomerular renin cells. (D) qRT-PCR analysis of Panx1 expression from micro-dissected renal cortex. Data presented as mean fold change ± s.e.m.; N=6. Student’s t-test was performed, significance indicated by asterisk *p<0.05. (E) Male total plasma renin concentration measured using Ren1-specific ELISA and collected during the inactive period (Day; 09:00–10:00) and the active period (Night; 16:00–17:00). Data displayed as mean ± s.e.m.; N=8 control, N=10 knockout. Two-way ANOVA with Bonferroni post-hoc test performed for significance; *p<0.05. (F) Female plasma renin concentrations measured using Ren1-specific ELISA and collected during the inactive period (Day; 09:00–10:00) and the active period (Night; 16:00–17:00). Data displayed as mean ± s.e.m.; N=4 control; N=4 knockout. Two-way ANOVA with repeated measures performed for significance. (G) Plasma estradiol concentration measured during the active period (Night; 16:00–17:00) from male (N=5), female (N=4), and ovariectomized (OVX) female mice (N=4). Data presented as mean ± s.e.m. One-way ANOVA performed for significance, *p<0.05. (H) Total plasma renin concentration of female Ren1-Panx1Δ/Δ and ovariectomized Ren1-Panx1Δ/Δ mice collected during the active period. Data displayed as mean ± s.e.m. N=4. Student’s t-test was performed for significance; *p<0.05.
Table 1. Metabolic blood analysis of Ren1-Panx1wt/wt control and Ren1-Panx1Δ/Δ mice.
Blood samples were collected from male mice by cardiac puncture into EDTA- or Li-heparin collection tubes and stored on ice. Blood metrics were analyzed at the University of Virginia Pathology Laboratory.
| Parameter | Ren1-Panx1wt/wt | Ren1-Panx1Δ/Δ | p-value | ||
|---|---|---|---|---|---|
| Na+ (mM) | 150.6 | ±0.57 | 151.5 | ±1.28 | 0.53 |
| K+ (mM) | 5.6 | ±0.24 | 5.9 | ±0.22 | 0.42 |
| Cl−(mM) | 115.6 | ±0.77 | 115.9 | ±0.77 | 0.83 |
| Ca2+ (mM) | 10.0 | ±0.22 | 10.0 | ±0.21 | 0.63 |
| BUN (mg/dL) | 25.5 | ±1.00 | 24.0 | ±0.65 | 0.20 |
| Creatinine (mM) | 0.39 | ±0.03 | 0.38 | ±0.02 | 0.77 |
| Glucose (mg/dL) | 237.0 | ±22.0 | 225.8 | ±13.8 | 0.65 |
| Male heart mass:BW ratio (mg/g) | 5.8 | ±0.06 | 6.2* | ±0.07 | 0.03 |
| Female heart mass:BW ratio (mg/g) | 5.8 | ±0.11 | 5.8 | ±0.14 | ND |
Results shown are mean ± SEM. A student’s t-test was performed to test statistical significance for plasma ion levels. A two-way ANOVA with Boneferroni post-hoc test performed for significance between heart mass:body weight ratio (sex vs genotype),
p<0.05.
Next, we quantified total plasma renin concentrations from male and female Ren1-Panx1Δ/Δ and control mice (Fig. 1E–F). Blood samples were collected during the active period (night; 20:00–22:00h) and inactive period (day; 08:00–10:00h). Renin levels trended to increase during the inactive period in male Ren1-Panx1Δ/Δ mice (32.20 ng/mL compared to 48.48 ng/mL; 50.52% increase from control) and were significantly increased (32.82 ng/mL to 47.03 ng/mL; 43.30% from control) during the active period. We assessed plasma aldosterone levels from male mice (Supplemental Fig. 2A). Plasma aldosterone levels were found to be significantly increased in male Ren1-Panx1Δ/Δ mice during the inactive (165.5 pg/mL compared to 77.7 pg/mL; 112.9% increase from control) and active sampling periods (221.9 pg/mL compared to 65.8 pg/mL; 237.6% increase from control). Interestingly, the enhanced RAAS phenotype was sex-specific. Female Ren1-Panx1Δ/Δ mice did not exhibit differences in total plasma renin levels (Fig. 1F), or aldosterone (Supplemental Fig. 2B). The sex-specific enhancement of plasma renin was confirmed in female Ren1-Panx1Δ/Δ in which ovariectomy (OVX) was performed and estradiol levels were significantly reduced (Fig. 1G). Ovariectomized female Ren1-Panx1Δ/Δ mice exhibited elevated total plasma renin levels during the active period (46.12 ng/mL compared to 39.61 ng/mL; 14.11% increase from controls) compared with female Ren1-Panx1Δ/Δ mice (Fig. 1H). We did not detect differences in Panx1 mRNA between male and female kidneys or TDAs (Supplemental Fig. 3).
Because plasma renin and aldosterone levels were significantly elevated in male Ren1-Panx1Δ/Δ mice, we measured ABP in both sexes using telemetry (Fig. 2A–C). The 24hr MAP of male Ren1-Panx1Δ/Δ mice was 104.2 ± 2.4 mmHg versus 97.2 ± 1.5 mmHg for controls, and was significantly elevated during the active period (108.4 ± 2.3 mmHg compared to 99.86 ± 1.2 mmHg) (Fig. 2A). Male Ren1-Panx1Δ/Δ mice also displayed significantly increased systolic (127.3 ± 3.2 mmHg compared to 116.3 ± 1.2 mmHg) (Fig. 2A) and diastolic ABP (92.8 ± 2.9 mmHg compared to 81.2 ± 3.5 mmHg) during the active period (Supplemental Fig. 4A). In contrast, female Ren1-Panx1Δ/Δ mice did not exhibit differences in mean (24hr ABP: 95.0 ± 0.9 mmHg versus 94.6 ± 2.9 mmHg) or systolic ABP (24hr ABP: 107.7 ± 2.3 mmHg versus 102.6 ± 1.7 mmHg) (Figure 2B), nor differences in diastolic ABP (Supplemental Fig. 4B) or heart rate for either sex (Supplemental Fig. 4C–D). Heart mass was significantly increased in male mice (Table1). Sex-specific ABP elevations were confirmed in ovariectomized female Ren1-Panx1Δ/Δ. Mean and systolic ABP were significantly elevated during the active period in ovariectomized Ren1-Panx1Δ/Δ mice versus female sham Ren1-Panx1Δ/Δ (MAP: 107.2 ± 1.0 mmHg versus 92.8 ± 2.0 mmHg; SBB: 123.8 ± 2.9 mmHg versus 106.4 ± 3.0 mmHg) (Fig. 2C).
Figure 2. Deletion of renin-cell Pannexin 1 causes sex-dependent increase in blood pressure.
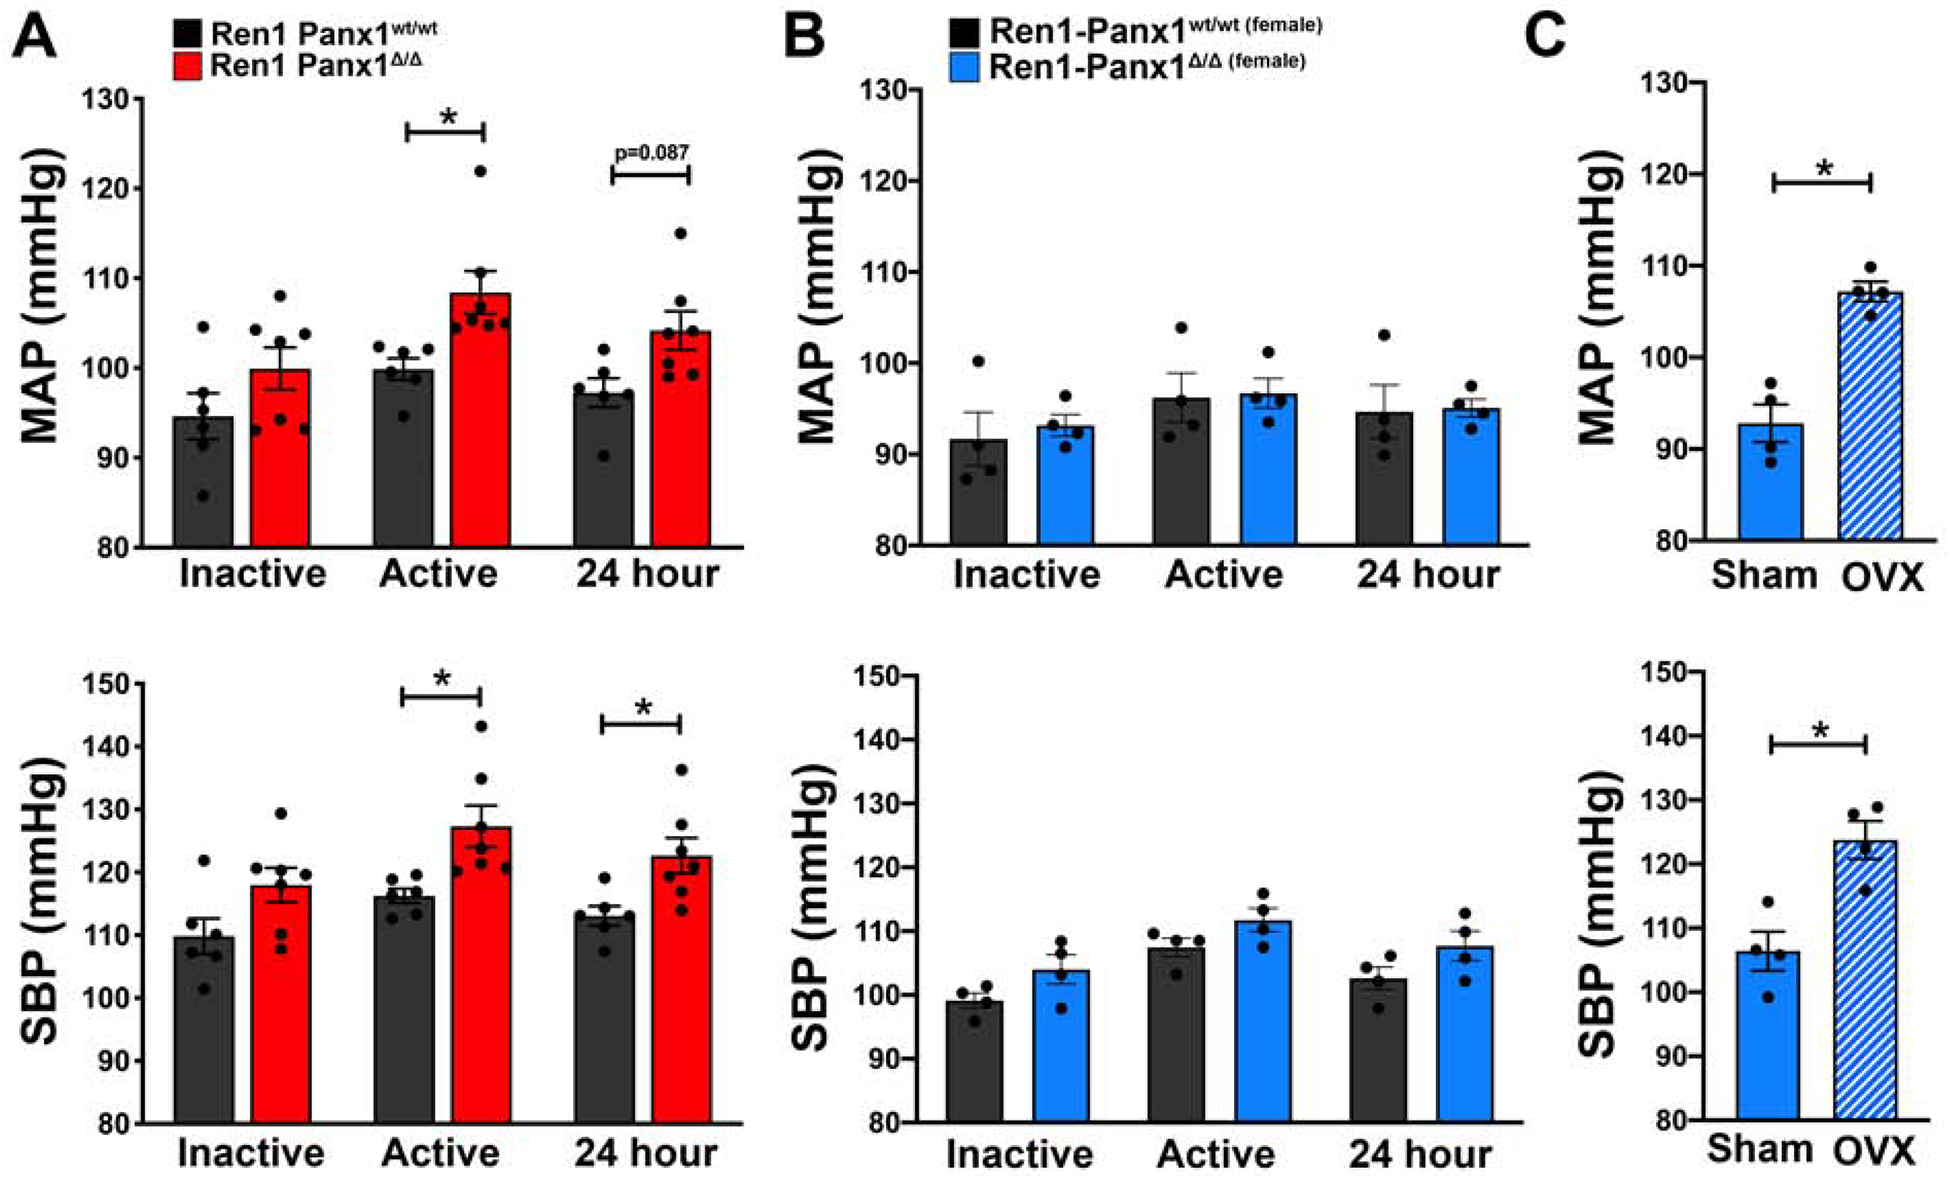
Mean arterial blood pressure (MAP) and systolic blood pressure (SBP) of male and female Ren1-Panx1Δ/Δ and Ren1-Panx1wt/wt control mice continuously measured using telemetry. Blood pressure was assessed during the inactive period (12hr light: 06:00–17:59) and active period (12hr dark: 18:00–05:59). (A) MAP and SBP of male mice; N=6 control, N=7 knockout. Data presented as mean ± s.e.m. (B) MAP and SBP of female mice; N=4 control, N=4 knockout. Data presented as mean ± s.e.m. Two-way ANOVA with repeated measures and Bonferroni post-hoc test was performed for significance; *p<0.05. (C) MAP and SBP of sham and ovariectomized female knockout mice. N=4 control; N=4 knockout. Data presented as mean ± s.e.m. Student’s t-test was performed for significance; *p< 0.05.
Due to elevated male Ren1-Panx1Δ/Δ ABP, we also tested sex-dependent vasoreactivity using pressure myography. Male Ren1-Panx1Δ/Δ mice exhibited enhanced vasoconstriction responses to phenylephrine stimulation compared to male control and female Ren1-Panx1Δ/Δ mice (Fig. 3A). No differences were observed in vasodilation responses to acetylcholine for either sex (Fig. 3B). Male constriction responses to KCl were enhanced (Fig. 3C), but no differences were observed using NS309 (Fig. 3D). We next tested male Ren1-Panx1Δ/Δ arteries for structural alterations, which exhibited significantly reduced outer and inner diameters within maximally dilated thoracodorsal arteries, yet no change in medial area (Fig. 3E–G). Importantly, Cre recombinase activity was not detected in the medial layer of the resistance arteries from Ren1-Panx1Δ/Δ mice (Supplemental Fig. 5A–B) and no change was observed in kidney cortical connexin 40 (Cx40) mRNA expression (Supplemental Fig. 6A). Thus, the altered vasoreactivity is due to elevated RAAS and ABP.
Figure 3. Effects of renovascular Panx1 deletion on vasoconstriction responses in resistance arteries.
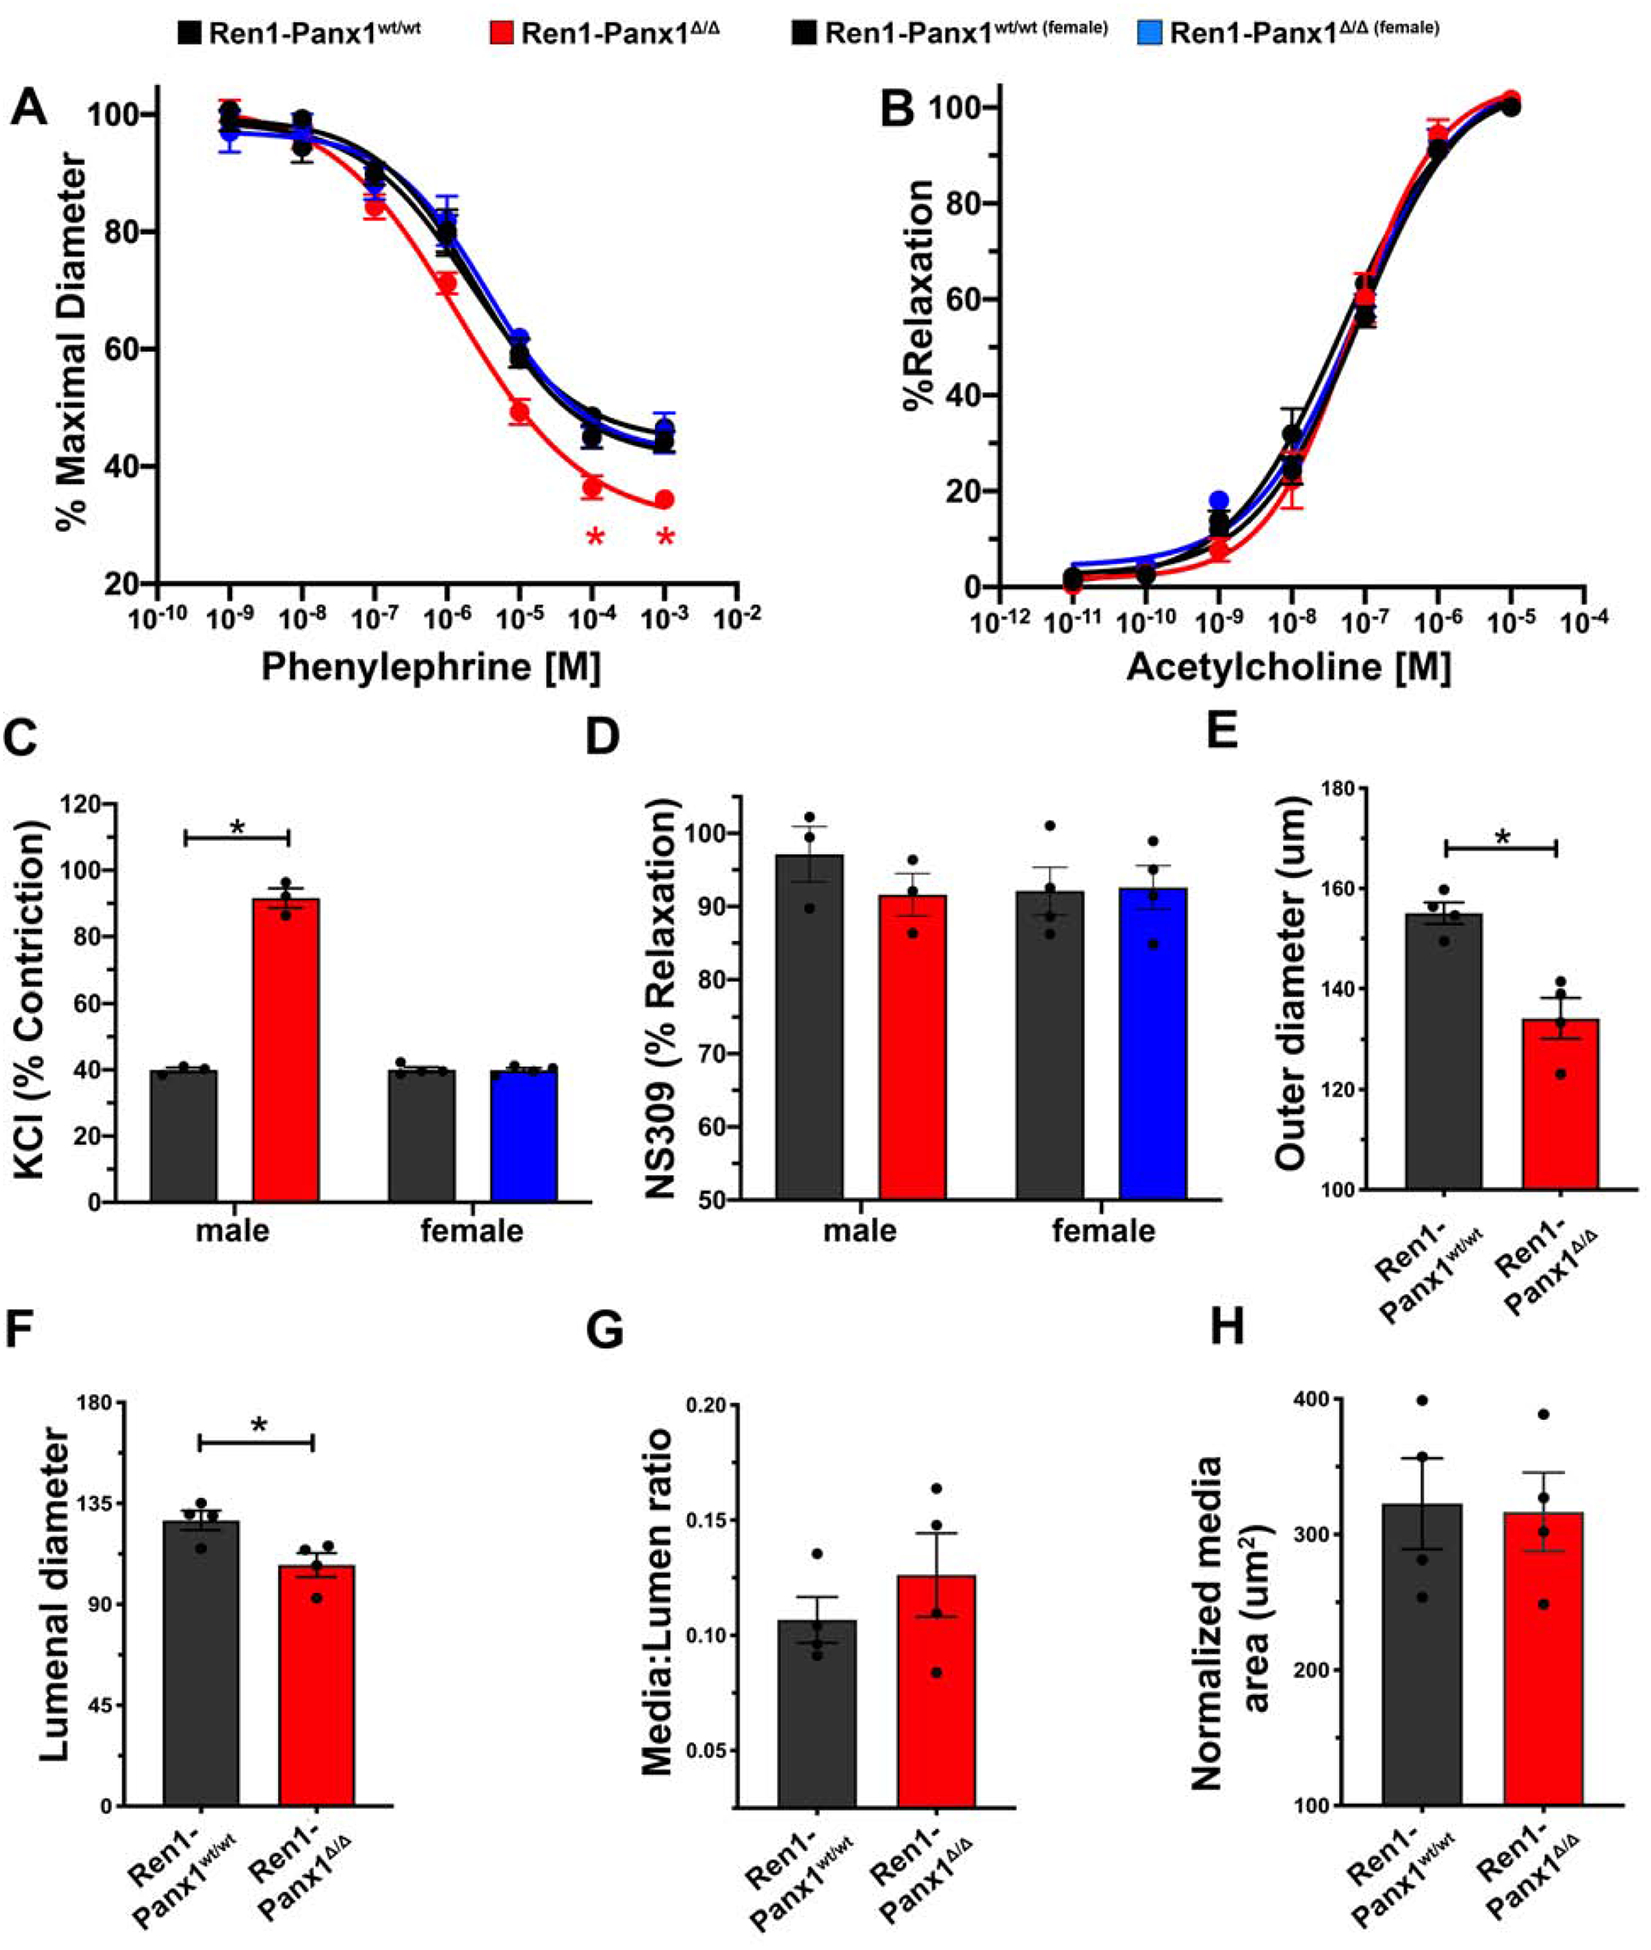
(A) Contractile responses to increasing concentrations of phenylephrine and (B) endothelial-dependent vasodilation to increasing acetylcholine concentrations in TDAs from Ren1-Panx1wt/wt and Ren1-Panx1Δ/Δ male (Control black line; N=4. Knockout red line; N=4) and female mice (Control black line; N=4. Knockout blue line; N=4). Concentration-effect curves were fitted to the data using four-parameter, non-linear regression curve. Data assessed by two-way ANOVA with Bonferroni post-hoc test; *p<0.05. (C) Maximum contractile response to 30mmol/L KCl in male and female mice. Data presented as mean ± s.e.m.; N=4. Two-way ANOVA with Bonferroni post-hoc test performed for significance; *p<0.05. (D) NS309-induced vascular relaxation of male and female TDAs. Data presented as mean ± s.e.m.; N=4. Two-way ANOVA performed for significance. (E-H) Male TDA structural properties indicating inward eutrophic remodeling. Data presented as mean ± s.e.m.; N=4. A student’s t-test was performed for significance; *p<0.05.
Since basal renin levels are elevated in male Ren1-Panx1Δ/Δ, we tested whether Ang-II mediated renin suppression was also dysregulated in male mice. Mice were implanted with Ang-II (10 ng kg−1 min−1) or saline infusion pumps to measure RAAS hormones and ABP (Fig. 4A–C). At baseline, renin, ABP, and aldosterone were significantly elevated in Ren1-Panx1Δ/Δ mice versus controls. Infusion of Ang-II (constant infusion rate of 1 μg/kg/min) suppressed renin to similar levels in Ren1-Panx1Δ/Δ and control mice during the inactive (4.3 ± 0.8 versus 4.8 ± 0.6 ng/mL) and active periods (3.8 ± 0.8 versus 4.7± 0.6 ng/mL) (Fig. 4A). Aldosterone and ABP were similarly elevated in Ren1-Panx1Δ/Δ and control mice infused with Ang-II (Fig. 4B–C).
Figure 4. Angiotensin-II induced renin suppression is normal in male Ren1-Panx1 knockout mice.
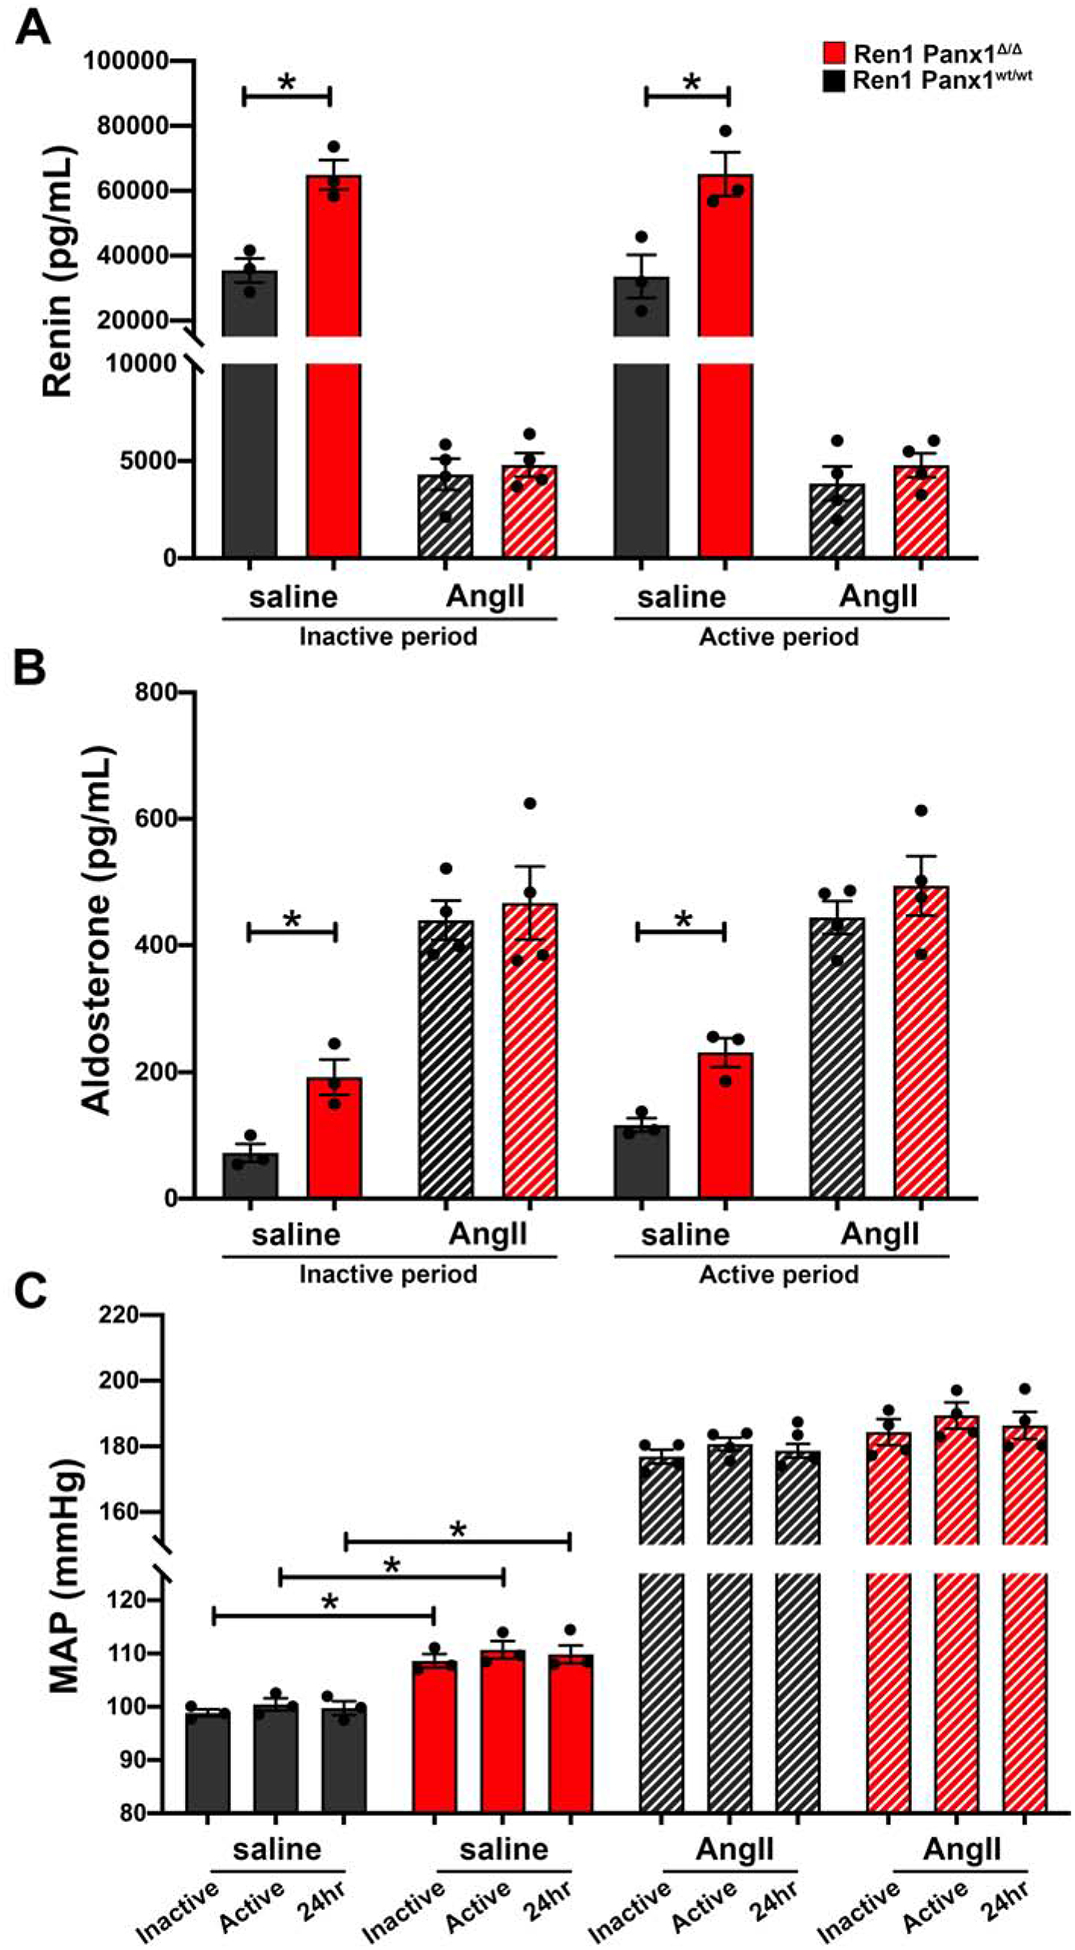
Ren1-Panx1wt/wt and Ren1-Panx1Δ/Δ male mice were implanted with infusion minipumps (saline or Ang-II 10 ng kg−1 min−1) and blood pressure was monitored using telemetry. Plasma samples were collected during the inactive period (12hr light: 06:00–17:59) and active period (12hr dark: 18:00–05:59). (A) Total plasma renin concentration of Ren1-Panx1wt/wt and Ren1-Panx1Δ/Δ male mice infused with saline (N=3) or angiotensin-II (N=4). Data presented as mean ± s.e.m. Two-way ANOVA with repeated measures and Bonferroni post-hoc test performed for significance; *p<0.05. (B) Plasma aldosterone concentration of Ren1-Panx1wt/wt and Ren1-Panx1Δ/Δ male mice infused with saline (N=3) or angiotensin-II (N=4). Data presented as mean ± s.e.m. Two-way ANOVA with repeated measures and Bonferroni post-hoc test performed for significance; *p<0.05. (C) Mean arterial blood pressure (MAP) of Ren1-Panx1wt/wt and Ren1-Panx1Δ/Δ male mice infused with saline (N=3) or angiotensin-II (N=4). Data presented as mean ± s.e.m. Two-way ANOVA with repeated measures and Bonferroni post-hoc test performed for significance; *p<0.05.
To test renin cell recruitment, we lowered ABP for 10 days using low sodium diet (0.05%) and captopril (0.5 g/L) in drinking water as previously described43. ABP was significantly reduced in both Ren1-Panx1Δ/Δ and control mice (Fig. 5A), and genotype-dependent differences in ABP were eliminated. This normalizing effect is consistent with a preeminent role for RAAS in mediating the elevated ABP in Ren1-Panx1Δ/Δ mice. To assess renin recruitment capacity after ABP lowering total plasma renin levels (Fig. 5B) and cortical tissue renin mRNA levels (Fig. 5C) were measured. In Ren1-Panx1Δ/Δ mice, baseline plasma renin levels were again elevated with no effect on tissue renin mRNA. After ABP lowering, plasma renin concentrations and tissue renin mRNA were elevated to comparable levels in both Ren1-Panx1Δ/Δ and controls.
Figure 5. Renin recruitment is impaired upon deletion of Panx1 from renin expressing cells.
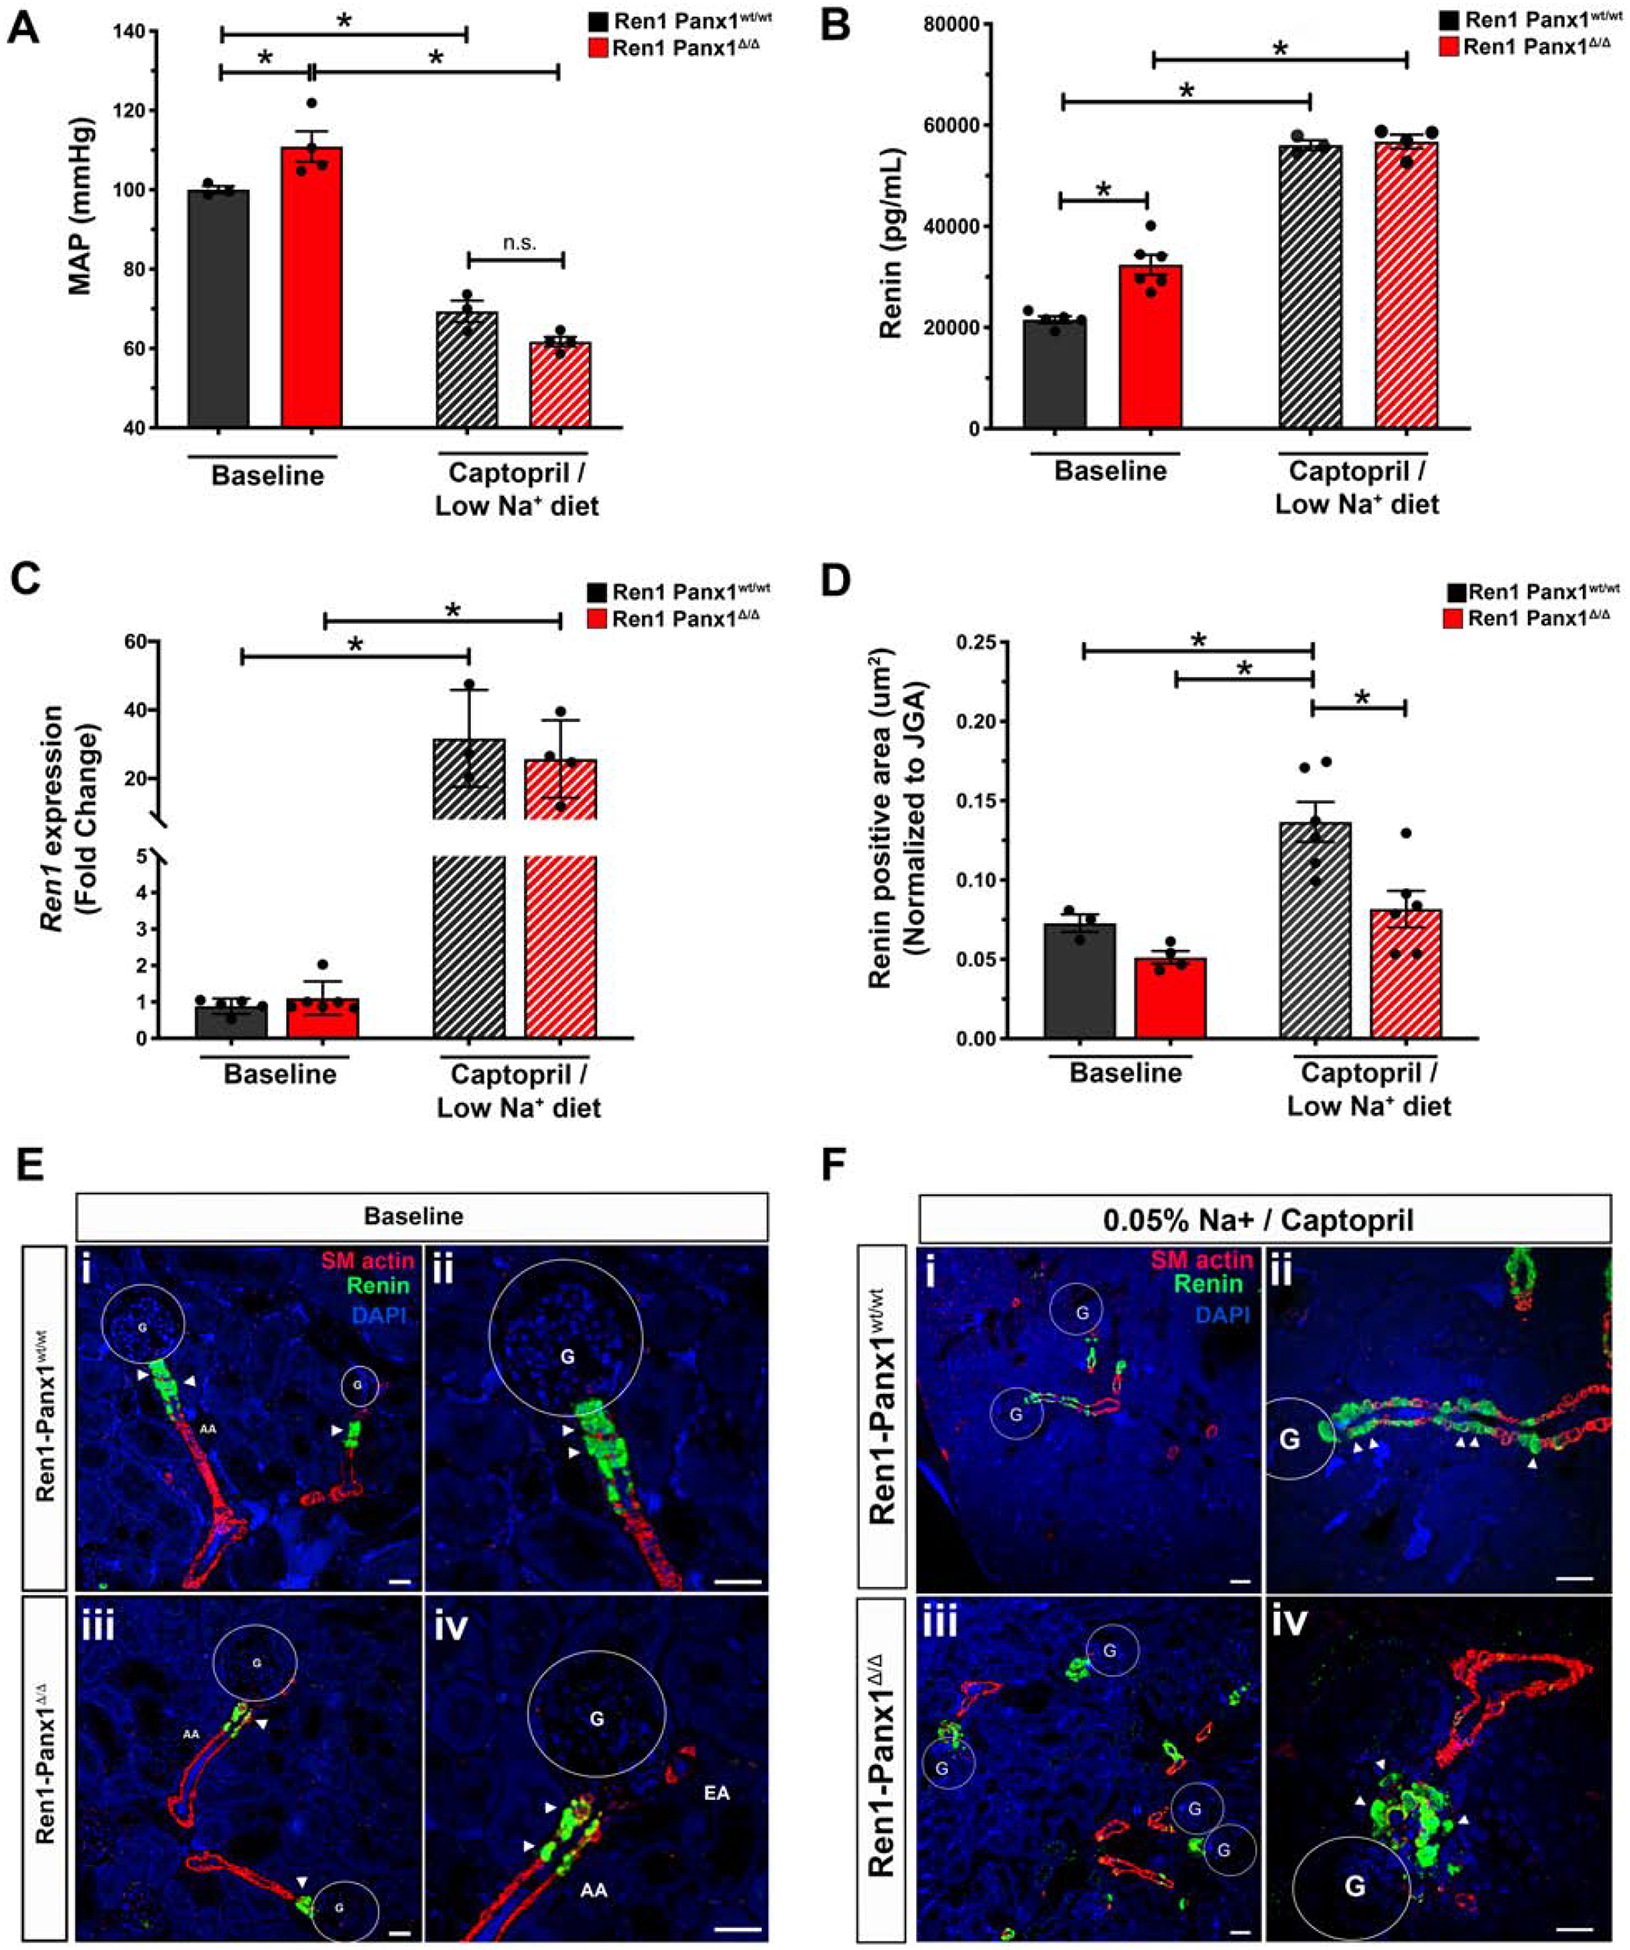
(A) 24hr MAP of Ren1-Panx1Δ/Δ and Ren1-Panx1wt/wt male mice. MAP during the inactive period (12hr light: 06:00–17:59) and active period (12hr dark: 18:00–05:59) were averaged together and represented as mean ± s.e.m. N=3 control; 4 knockout mice. A Two-way ANOVA and a Bonferroni post-hoc test was performed for significance; *p< 0.05. (B) Plasma renin concentration measured by ELISA before (N=5 control; 6 knockout) and after (N=3 control; 4 knockout) ABP lowering. Data presented as mean ± s.e.m. A Two-way ANOVA and a Bonferroni post-hoc test performed for significance; *p<0.05. (C) qRT-PCR analysis of renin mRNA isolated from total cortex RNA at baseline and after ABP lowering. Baseline: N=5 control, 6 knockout mice; Captopril / low sodium (0.05%): N=3 control, 4 knockout. Data presented as mean fold change ± S.D. A Two-way ANOVA with Bonferroni post-hoc test was performed for significance; *p<0.05. (D) Double-blinded quantification of renin positive area normalized to JGA area from non-consecutive tissue sections. N=4 control; 6 knockout mice. Data represented as mean ± s.e.m. A two-way ANOVA with Bonferroni post-hoc test was performed for significance; *p<0.05. (E) Tissue distribution of renin expression in renal cortex slices assessed by immunofluorescence in control (i & ii) and knockout mice (iii & iv) at baseline. Immunostaining for renin (green), α-SMactin (red), and nuclei stained with DAPI (blue). Circles denote glomeruli (G), afferent arterioles (AA), efferent arterioles (EA), arrows indicate renin positive cells, scale bar; 40 μm. High magnification image (ii & iv). Arrows indicate renin cells, scale bar; 20 μm. (F) Tissue distribution of renin expression after ABP lowering with low sodium (0.05%) diet and captopril (5g/L) in drinking water. Control (i & ii) and knockout (iii & iv). Renin (green), α-SMactin (red), nuclei are stained with DAPI (blue), circles indicate glomeruli (G); Scale bar=40μm. High magnification image (ii & iv), arrows demarcate renin cells; Scale bar=20μm.
Next, renin cell populations were assessed by immunofluorescence with αSMactin to mark arterioles (Fig. 5D–F). At baseline, Ren1-Panx1Δ/Δ and control mice displayed similar patterns of renin positive cells, co-localized with smooth muscle actin at the glomerular entrance of preglomerular afferent arterioles (Fig. 5D–E). After ABP lowering, control mice exhibited a typical recruitment response- i.e., renin positive cells extend further distally in the arteriolar media from glomerulus (Fig. 5F). In stark contrast, Ren1-Panx1Δ/Δ mice exhibited a limited capacity of distal αSMactin positive cells to express renin. Expansion of renin positive cells was restricted around the preglomerular afferent arteriole (Fig. 5F). Quantification of renin positive area reflects a limited capacity to engage the renin recruitment. (Fig. 5D). These results show that renin cell Panx1 influences afferent arteriolar cells to properly recruitment renin when ABP is lowered.
To test if Panx1 is capable of altering renin secretion in a cell-autonomous manner, we tested Panx1 channel activity in As4.1 renin-secreting cells44. In whole-cell patch clamp recordings we observed robust constitutive currents that were sensitive to carbenoxolone (CBX, 50 μmol/L; Fig. 6A), similar to previous Panx1 recordings32, 35, 41. We knocked down Panx1 using siRNA, which resulted in reduced Panx1 protein and extracellular ATP (Fig 6B–D). We assessed renin expression and secretion in Panx1 knockdown and control cells. No difference in cellular renin expression was observed (Fig. 6E), but a significant enhancement in renin levels was detected in the cell media (Fig. 6F). Interestingly, the enhanced renin levels from Panx1 siRNA treated cells was comparable to EGTA-induced renin secretion from control cells. Lastly, As4.1 cells were stimulated with Ang-II (1 nmol/L) to test the dependence of ATP release by angiotensin receptor activation. Ang-II stimulation failed to alter exogenous ATP accumulation in control and Panx1 siRNA treated cells, despite siRNA treated cells having lower levels of exogenous ATP (Fig. 6G). These results support a hyperreninemia phenotype observed in renin cell-specific Panx1 knockouts in vivo.
Figure 6. Knockdown of Panx1 from As4.1 cells promotes autonomous renin secretion.
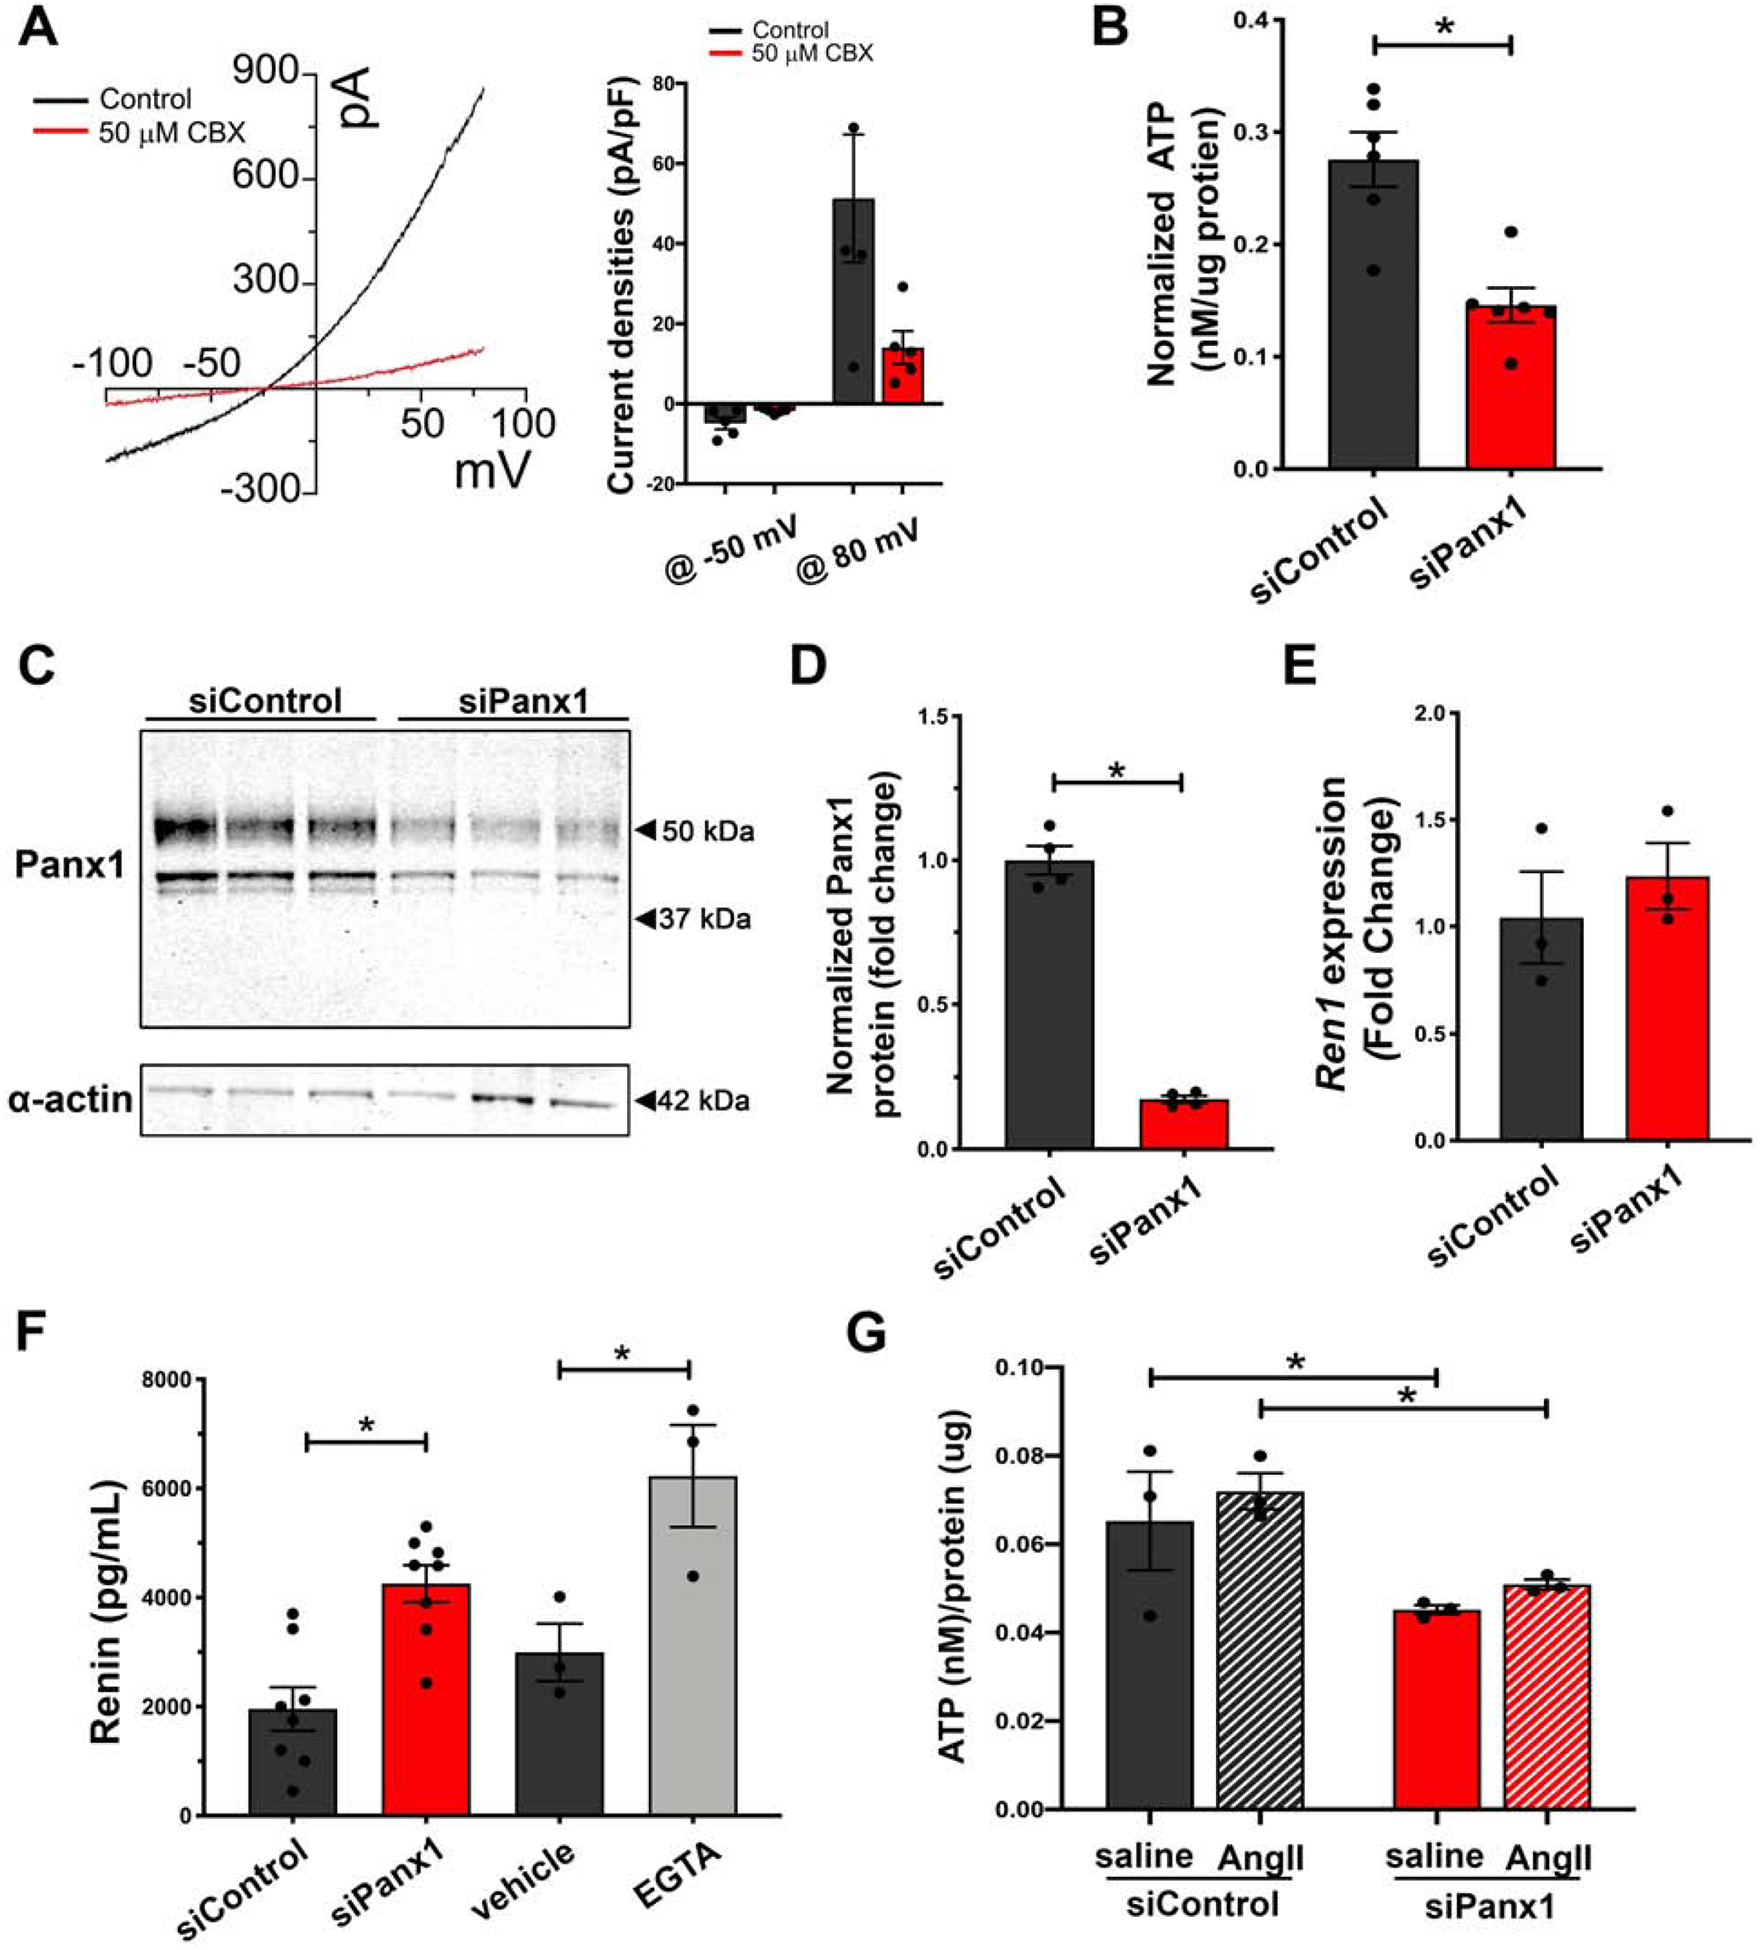
(A) Whole-cell patch recordings and representative current-voltage relationship from As4.1 cells of carbenoxolone sensitive currents. Voltage ramp (−100 to 100mV). Quantification of current densities from voltage ramp at −50mV and 80mV. n=5 cells. (B) Basal ATP release from As4.1 cells treated with Panx1 siRNA or scramble control. N=6. Data presented as mean ± s.e.m. A students t-test was performed for significance; *p<0.05. (C) Representative western blot of Panx1 expression in As4.1 cells treated with control siRNA or Panx1 siRNA. (D) Quantification of Panx1 knockdown efficiency from western analysis. N=4. Panx1 signal normalized to smooth muscle actin and represented as mean ± s.e.m. A students t-test was performed for significance; *p<0.05. (E) Renin expression analysis from control and Panx1 siRNA treated As4.1 cells. N=3. Data presented as mean fold change ± s.e.m. A students t-test was performed for significance. (F) Total renin concentration of cell media from control treated (N=6), Panx1 siRNA treated (N=6), naïve (N=3), or EGTA treated (N=3) As4.1 cells measured using Ren1 ELISA. Data presented as mean ± s.e.m. A One-way ANOVA was performed for significance; *p<0.05. (G) Angiotensin-II stimulated ATP release from As4.1 cells treated with Panx1 siRNA or scramble control. N=3. Data presented as mean ± s.e.m. A two-way ANOVA with repeated measures and Bonferroni post-hoc test performed for significance; *p<0.05.
Reduced calcium concentrations inversely raise renin secretion levels via regulation of adenylyl cyclase and cAMP45. We hypothesized that autonomous renin secretion might be mechanistically regulated by altered intracellular calcium homeostasis since (1) Panx1 has been suggested to alter intracellular calcium levels46–48, (2) we showed in Fig 6F an enhanced renin secretory response to EGTA, and (3) because decreased intracellular calcium enhances renin secretion5, 49, 50. To test if intracellular calcium levels rely on extracellular ATP, we measured Fluo-4 loaded As4.1 cells in the presence of the ectoenzyme apyrase (Fig. 7A). No differences were observed between control or enzyme treated As4.1 cells, which express Panx1Sand have low levels of estradiol (Supplemental Fig. 7A–B). Cells treated with the Panx1-specific intracellular loop inhibitory peptide (PxIL2P) or Panx1-specific siRNA resulted in a significant reduction of calcium-dependent fluorescence intensity, indicative of reduced intracellular calcium concentrations (Fig. 7B–C). Panx1 knockdown also resulted in reduced intracellular calcium concentrations at baseline with a blunted response to thapsigargin treatment (Fig 7D). In addition, Ren1-Panx1Δ/Δ mice exhibited reduced Fluo-4 fluorescence in afferent arterioles from whole mount kidney slices(Fig. 7E). Lastly, cAMP was measured to confirm dysregulated intracellular calcium. As4.1 cells treated with PxIL2P or Panx1-specific siRNA had significantly increased intracellular cAMP levels compared to scramble control peptide (Fig. 7F) or control siRNA (Fig. 7G). We conclude that Panx1 channels in renin-producing cells negatively regulate renin secretion, likely by controlling intracellular calcium, and not necessarily via ATP.
Figure 7. Knockdown of Panx1 in As4.1 cells reduces intracellular calcium ion concentration and increases cAMP levels.
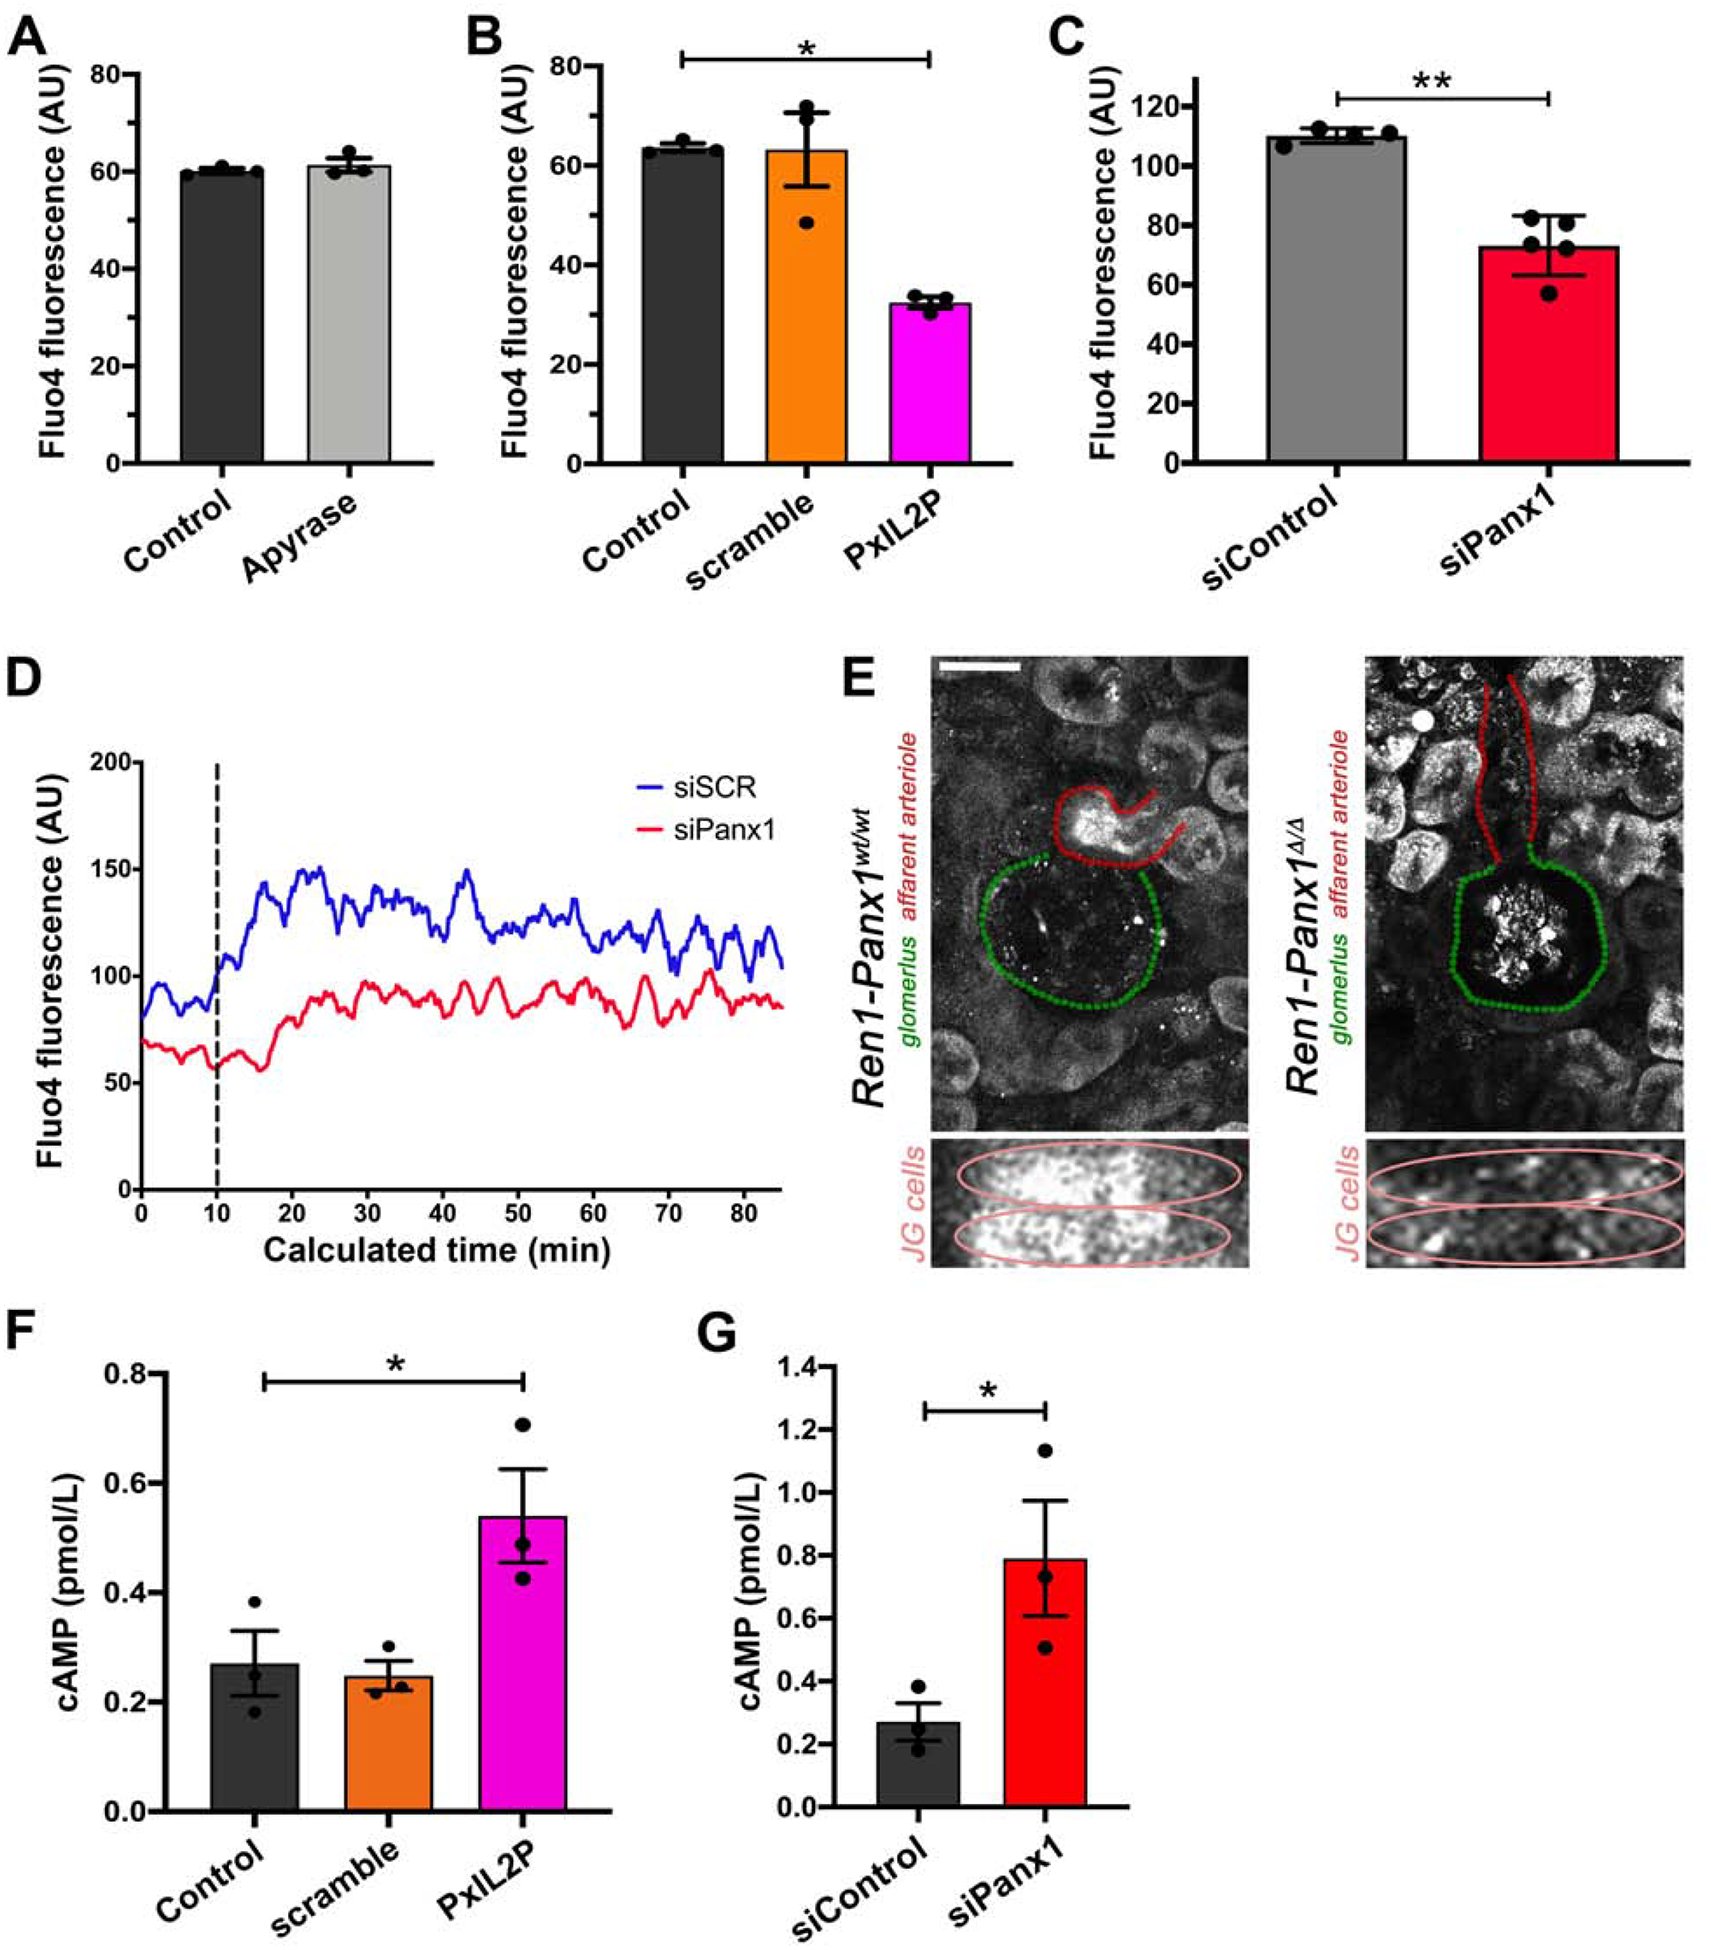
(A) Relative calcium (Fluo-4 fluorescence) was measured in As4.1 cells treated with the ectoenzyme apyrase. Data presented as mean ± s.e.m., N=3. A Student’s t-test was performed for significance; *p<0.05. (B) Relative calcium (Fluo-4 fluorescence) was measured in As4.1 cells treated with Panx1-specific intracellular loop inhibitory peptide (10 μmol/L; PxIL2P), scramble peptide (10 μmol/L), or vehicle. Data presented as mean ± s.e.m., N=3. A One-way ANOVA was performed with a Dunnett’s post-hoc test for significance; *p<0.05. (C) Relative calcium (Fluo-4 fluorescence) was measured in 5 separate experiments (FSC by SSC gating) by flow cytometry. Data represented as mean ± s.e.m and tested for significance using Student’s t-test; *p<0.05. (D) Representative Fluo-4 fluorescence (FL1-H) trace from three separate experiments of baseline calcium flux following baseline (T0–T10) and after thapsigargin treatment (dotted line; T10), averaged fluorescence (FL1-H) over calculated time was determined using the FlowJo kinetics platform. (E) Representative ex vivo renal-slice confocal calcium imaging from male Ren1-Panx1wt/wt and Ren1-Panx1Δ/Δ mice. Afferent arteriole (red), glomerulus (green), 20X images. Smooth muscle cells of afferent arteriole are shown underneath. Scale bar=25 μm. (F) Intracellular cAMP concentration from As4.1 cells treated with Panx1 inhibitory peptide PxIL2P (10μmol/L), scramble peptide (10 μmol/L), or vehicle. Data presented as mean ± s.e.m., N=3. A one-way ANOVA was performed for significance with Dunnett’s post-hoc test; *p<0.05. (G) Intracellular cAMP concentration from As4.1 cells treated with Panx1 siRNA or scramble control. Data presented as mean ± s.e.m., N=3. A students t-test was performed for significance; *p<0.05.
DISCUSSION
Panx1 channels have emerged as novel regulators of ABP. We and others previously demonstrated inducible smooth muscle cell (SMMHC) Panx1 deletion leads to an overall hypotensive effect mediated by impaired adrenergic-mediated ATP release and local vasoconstriction in the peripheral vasculature40, 41. SMMHC expression is not limited to peripheral smooth muscle cells, but is observed in afferent arteriolar smooth muscle cells and renin secreting cells maintaining a dual myo-endocrine phenotype51–53. The long-term hypotensive effects of smooth muscle Panx1 deletion led us hypothesize a unusual role for Panx1 in the renal vasculature considering the effects purinergic signals, especially adenosine, have on renin secretion28, 29. We targeted Panx1 in renin-expressing cells using a Ren1-Cre43, which was not expressed in peripheral vascular smooth muscle cells, thus allowing us to separate renin-expressing cells from peripheral smooth muscle cells. In contrast to Panx1 null models, renin cell Panx1 deletion elevated ABP and RAAS hormone levels. Our results suggest kidney Panx1 influences renin secretion to increase ABP, without altering adrenergic-mediated vasoconstriction. We tested vasoconstriction responses in resistance arteries and observed enhanced, phenylephrine-mediated vasoconstriction in Panx1-deficient mice. Inward eutrophic vascular alterations and increased cardiac mass were also observed in male knockout mice and are consistent with a well-documented role for enhanced ABP and RAAS54, 55. Global deletion or vascular endothelial Panx1 deletion do not exhibit overt ABP phenotypes56,57. Thus, our previous and current studies highlight distinct roles for Panx1 channels in the peripheral and renal vasculature that differentially modulate ABP; these studies demonstrate that cell-type specific knockout animals, especially with Panx1, are essential for dissecting complex physiological mechanisms.
Our study demonstrates that female Panx1 knockout mice did not exhibit RAAS hormone dysregulation, elevated ABP, nor peripheral hemodynamic dysfunction, whereas male mice did. Sex-specific differences were confirmed by ovariectomy, which lowered estradiol levels and recapitulated elevated male ABP and RAAS hormone phenotypes in female knockouts. Thus, murine estradiol may cooperate in Panx1-mediated suppression of steady-state renin secretion. In support of these findings female humans and animals taking estrogen replacement therapy exhibit reduced renin levels compared to age-matched controls and males, as well as evidence that estrogen suppresses renin secretion58–61. By contrast though, evidence also exists in which exogenous estrogen promote RAAS activity and renin secretion62–66. RAAS activity fluctuates with menstrual cycle- showing more activity during the high estrogen luteal phase67- and signaling through the alpha estrogen-receptor binds renin enhancer elements necessary for renin expression68. It our murine model it is unclear how sex modifies Panx1-mediated renin suppression. Clearly how estrogen affects RAAS warrants future attention.
A restricted population JG cells express renin in unstressed adult mice69, 70. However, renin-lineage cells in vascular media, which expressed renin during development, retain the capacity to activate renin gene programs in response to hypotensive challenges43. We predicted that coordination of renin recruitment by Panx1 would be exaggerated in afferent arteriolar smooth muscle cells. We tested this by administering sodium restriction with captopril treatment and observed a significant impairment in cellular distribution of renin cells from Panx1-deficient mice, despite a preserved ability to increase renin mRNA and plasma levels. One limitation in our study is the constitutive nature of the Ren1-Cre recombinase, which is also active in the renal vascular media during development. Thus, smooth muscle cell mechanisms could influence Panx1-dependent renin recruitment phenotypes. Activation of P2-receptors on smooth muscle cells can increase intrarenal cAMP-mediated signaling, which critically regulates initiation and maintenance of renin recruitment phenotypes71, 72. P2Y receptors support cAMP-dependent renin expression and cell differentiation20, 73. We attribute Panx1 control of mature JG cell renin secretion in our model to calcium regulation, but contend that aberrant recruitment phenotypes of adjacent smooth muscle cells could be resultant of reduced Panx1-derived signals. The effect of Panx1 deletion specifically in mature renovascular smooth muscle cells remains to be tested.
In this study, Panx1 deletion from renin expressing cells resulted in a distinct high renin-high ABP phenotype, which was mechanistically supported by autonomous renin secretion, reduced intracellular calcium levels, and increase cAMP levels in vitro. Published reports demonstrate a link between Panx1 channels and direct increases in intracellular calcium using ionophores74, as well as indirectly through receptor-mediated modes of channel activation75–77. Using electrophysiological recordings, we observed basal activity of relatively non-selective Panx1 channels in As4.1 cells, suggesting that Panx1 activity could provide a conduit for calcium entry. Our data from thapsigargin-treated cells demonstrates a lower average intracellular calcium concentration after Panx1 knockdown and blunted responses to thapsigargin stimulation. Alternatively, Panx1 channel activity could produce a depolarizing bias in renin-secreting JG cells, where depolarization causes L-type calcium channel activation and suppression of renin secretion45. However, this remains to be specifically tested. Loss of Panx1 may also influence extracellular purine balance, adenosine accumulation, and A1R-mediated calcium entry that supports renin phenotypes in our model30. Adenosine inhibits renin secretion through A1R activation28, 29 and deletion of A1Rs in mice exhibit an enhanced and unsuppressed renin secretion phenotype78. Our results in As4.1 cells show reduced basal calcium levels when Panx1 activity is pharmacologically blocked or genetically knocked down, as well as negative findings that ATP degradation by apyrase did not alter intracellular calcium levels. The accumulation of in vitro data and renin secretion data supports in vivo measurements of elevated plasma hormone levels.
Overall, our data demonstrate the importance of renin-cell Panx1 channels on RAAS activity and arterial pressure (Figure 8). We found that deletion of Panx1 from a subset of renal cells has a profound sex-specific influence on renin secretion, ABP, and peripheral hemodynamics. Our analysis demonstrates a role for Panx1 channels within the renal vasculature influence adaptive renin-cell differentiation to assist in renin recruitment, and that Panx1 channels may be novel regulators of intracellular calcium.
Figure 8. Renin-cell Pannexin 1 channels can regulate renin secretion.
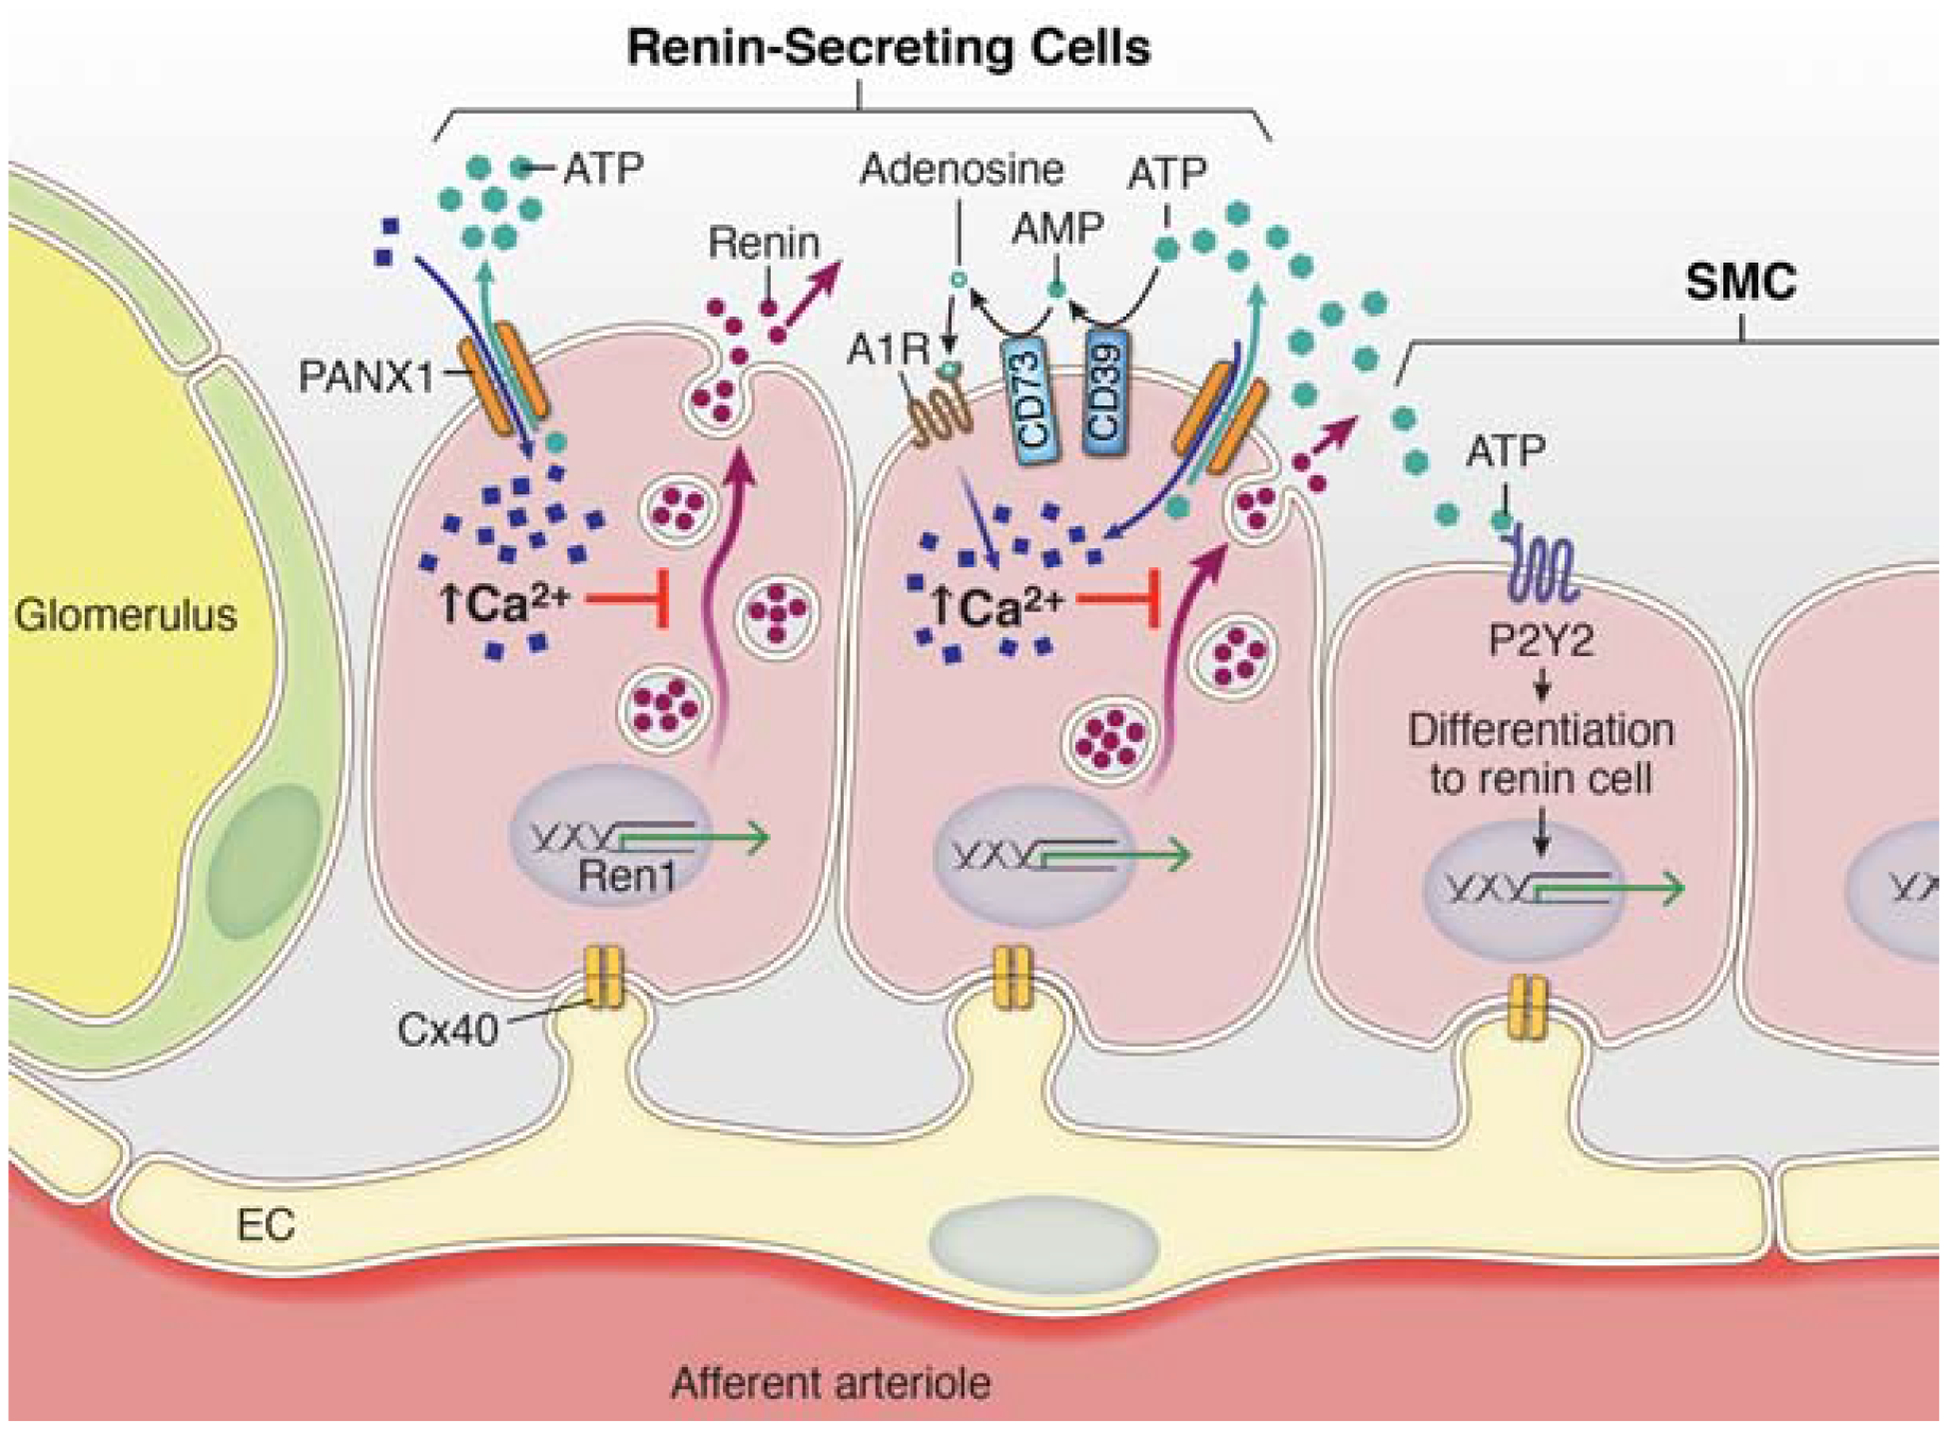
The regulated release of renin from juxtaglomerular cells in the afferent arteriole is tightly controlled by a balance between stimulatory increases in cAMP production and inhibitory signals mediated by increased intracellular calcium ion concentrations. This balance is functionally regulated by calcium-sensitive adenylyl cyclase enzymes (AC5/6), which are active when Ca2+ concentration is reduced. Pannexin 1 channels are non-selective ATP release channels that act as conduits for both ions (e.g. Ca2+) and metabolites. Opening of Pannexin 1 channels by physiological stimuli allows for rapid accumulation of extracellular ATP which initiates purinergic signaling cascades. ATP on its own can interact with membrane receptors (P2Y) or be broken down by extracellular enzymes (CD73 & CD39) to adenosine, which has potent renal and renovascular effects. Pannexin 1 channels on their own, or through activation of downstream purinergic receptors or changes in vascular pressure, act as a purinergic brake to reduce steady-state secretion of renin by altering intracellular calcium concentration.
METHODS:
Animals.
All animals were cared for under the provisions of the University of Virginia Animal Care and Use Committee. Mice, 10–25 weeks old, were fed normal mouse chow (0.3% sodium; (Envigo, Cat#7012). Renin Cre recombinase (Ren1d-Cre) mice43, were mated with mice harboring lox-P recombination sites flanking exon 3 of Pannexin 1 (Panx1fl/fl) or wildtype alleles (Panx1wt/wt)79 to produce conditional Pannexin 1 knockout mice (Ren1-Panx1Δ/Δ) and Cre-containing control animals (Ren1-Panx1wt/wt). Panx1 animals were mated with R26R-EYFP transgene (B6.Cg-Gt(ROSA)26Sortm3(CAG-EYFP)Hze/J) mice purchased from Jackson Laboratory (Stock No: 007903) to create Ren1-Panx1Δ/Δ (EYFP) mice.
Ovariectomy.
Ovariectomy (OVX) was performed on female mice 10–20 weeks old and transmitters for telemetry were inserted 2 weeks post OVX surgery.
Cell Culture.
As4.1 mouse kidney cells (ATCC, CRL-2193) were maintained in Dulbecco’s modified Eagle’s medium (DMEM, Gibco; Cat# 1196b 092) supplemented with 10% fetal bovine serum (VWR; Cat#97069–085) and penicillin-streptomycin (ThermoFisher; Cat# 15140122). 70% confluent cells were transfected with either negative control siRNA (ThermoFisher; Cat# 4390843) or silencer select mouse Panx1 siRNA (ThermoFisher; Cat# S79965) using Lipofectamine 3000 (ThermoFisher; Cat# L3000008). Cells were also treated with apyrase 1U/mL (Sigma-Aldrich; Cat# A6535), angiotensin-II 1nM (Tocris; Cat# 1158), and Panx1 inhibitory peptide 10μΜ (PxIL2P)41. cAMP was measured using direct Immunoassay Kit (Millipore; Cat# 116811).
qRT-PCR:
Total RNA was extracted using Aurum Total RNA Fatty and Fibrous Tissue extraction kit (BioRad; Cat# 732–6870). RNA concentration was measured using NanoDrop1000 spectrophotometer (ThermoFisher). For FACS sorted cells total RNA was extracted using Arcturus PicoPure RNA Isolation Kit (ThermoFisher; Cat# 12204–01). RNA was stored at −70°C or reverse transcribed using SuperScript III First-Strand Synthesis System (ThermoFisher; Cat# 18080051) using random hexamer primers. qRT-PCR was performed using PowerUp SYBR Green Master Mix (ThermoFisher; Cat# A25742) and optimized primers for REN1: Fwd- 5’ATGCCTCTCTGGGCACTCTT; Rev- 5’GTCAAACTTGGCCAGCATGA; Beta-2-microglbulin (Sigma; ID# M_B2m_1).
Pannexin expression was analyzed using TaqMan Gene Expression Master Mix (2x) (ThermoFisher; Cat# 4369016) and TaqMan Real-Time PCR assays, Panx1: Mm00450900_m1, B2m: Mm00437762, Agtr1a: Mm00450900_m1, Agtr1b: Mm00450900_m1, and Agtr2: Mm00450900_m1. A CFX Real-Time Detection System (Applied BioSystems) was used and threshold cycle number (CT) was used in combination with the 2−ΔΔCT method to calculate mean fold change from control.
Flow cytometry of Fluo-4 loaded As4.1 cells:
Confluent As4.1 cells were labelled with Fluo-4 (1μM, ThermoFisher: Cat# F14201) for 45 minutes at 37°C. Cells were trypsinized and resuspended in DMEM media containing 10% FBS. For EGTA-AM treatments, resuspended cells were incubated with EGTA-AM (10μM) for 25 minutes prior to analysis. Relative calcium (Fluo-4 fluorescence) was measured (FSC by SSC gating) by flow cytometry (BD FacsCalibur). For thapsigargen, a 1minute baseline was collected, the tube removed from the flow cytometer, thapsigargin (10μM) added, mixed and measurements continued for further 4 minutes. Approximately 30,000 gated cells were measured in each thapsigargin experiment. Data were represented as individual cell Fluo-4 fluorescence (FL1-H) for baseline calcium. Averaged fluorescence (FL1-H) over calculated time was determined using the FlowJo kinetics platform and presented as representative traces from 3 experiments.
Electrophysiology.
Whole cell voltage clamp recordings of As4.1 cells were performed as previously described44.
Blood Sampling.
Blood collection was performed during the inactive (08:00-10:00h) and active period (20:00–22:00h). Mice were anesthetized using methoxyflurane (ThermoFisher; #76-38-0). 80–100μl of whole blood was collected from mouse tail veins using Lithium-heparin-coated capillary tubes. Repeat sampling was performed at one-week intervals. Blood was centrifugation (1500rpm × 15min) at 4°C and the plasma flash frozen and stored at −80°C. For metabolic analyses, blood was terminally collected by cardiac puncturein Na-EDTA or Li-Heparin blood collection tubes, and analyzed at the University of Virginia Clinical Pathology Core facilities.
Hormone measurements:
Plasma renin levels were measured using a total renin ELISA (RayBio; #ELM-Ren1) using a 1:20 dilution of mouse plasma samples measured in duplicate according to manufacturer’s instructions. Absorbance was measured at 450nm using the a FLUOstar Omega (BMG Labtech) plate reader. Plasma aldosterone concentrations were measured using solid-phase Aldosterone RIA (CT) (IBL International; MG13051). Collected plasma was diluted 1:10 fold in supplied zero calibrator buffer and incubated for 16hrs according to manufacturer’s instructions. Radioactivity was measured at 37 °C for samples, calibrators, and the standard curve using a Gamma Counter. For calculating results, the blank values were subtracted from each sample value and was multiplied by the dilution factor.
Renin-recruitment.
To elicit recruitment of renin-expressing cells, mice were fed a low-sodium diet (0.05% sodium, Envigo) and angiotensin-converting enzyme (ACE) inhibitor, captopril (0.5g/L) (Sigma; Cat# C4042) administered in the drinking water and assessed after 10 days, as previously described43, 72.
Histological procedures.
Paraffin sections (5–8 μm) of kidney were processed and stained with hematoxylin-eosin and Masons Trichrome at the University of Virginia Research Histology Core.
Immunofluorescence.
Mice were transcardially perfused with heparinized saline followed by 4% paraformaldehyde in PBS. Organs were cleaned of surrounding adipose tissue post-fixed overnight, paraffin embedded, and sectioned (5–8μm). For imaging, slides had antigen retrieval (Vector Lab Cat# H-3301) and were blocked with 10% normal serum, 3% BSA, 0.5% SDS in TBS. Samples were incubated overnight in primary antibodies, including; anti-Renin mAb (abcam# ab212197; 1:500 dilution), and anti-alpha SMactin mAb (Acta2; Sigma# A2547, 1:500 dilution). Secondary antibodies included: anti-rabbit Alexa Fluor 647 F(ab’)2 (Cat# A21246), anti-mouse Alexa Fluor 594 F(ab’)2 (Cat# A11020), or Streptavidin Alexa Fluor conjugated 594 and 488 (Cat# S11277; Cat# S32354) diluted (1:400). Alexa Fluor 647 all with tyramide SuperBoost Kit (ThermoFisher; Cat# B40926).
Western blot.
Mouse As4.1 cells and tissues were homogenized in ice-cold RIPA extraction buffer (10mmol/L Tris-HCL pH 8.0, 150mmol/L NaCl, 1mmol/L EDTA, 0.5% SDS, 1% Triton-X100) containing protease inhibitor cocktail (Sigma; Cat# 8340) and P2 / P3 phosphatase inhibitor cocktail (Sigma; Cat# P5725 & P0044). Protein concentration was determined using BCA (Pierce; ThermoFisher; Cat# 23225). Primary antibodies used: rabbit anti-Pannexin 1 (Cell Signaling Technology #91137 (D9M1C); 1:1000 dilution), mouse anti-αSMactin (ACTA2; Sigma #A2547, 1:1000 dilution), LiCOR IR Dye secondary antibodies (diluted 1:15,000). Images were viewed/quantified using the LiCOR Odyssey with Image Studio software.
Pressure myography.
Pressure myography was performed on thoracodorsal arteries (TDA) as previously described38.
Blood pressure telemetry.
ABP was measured using telemetry as previously described41. Diurnal (inactive period) ABP was measured during light cycle: 6:00 a.m. to 5:59 p.m. Nocturnal (active period) ABP was measured during the dark cycle: 6:00 p.m. to 5:59 a.m. Angiotensin-II (10 ng kg−1 min−1) was infused for XX using osmotic mini pumps (Alzet; Durect Coporation) to test renin negative feedback.
Cohort Information:
Experiment 1. A cohort of male mice (n=8 control; 10 knockout) was used to assess baseline measurements for qPCR, RAAS hormones, and ABP. Sample sizes for each experiment are listed in figure legends and differences reflect availability of telemeter number, plasma volume from a single blood collection, and harvested tissue. Female baseline data (i.e., renin, aldosterone, and ABP) was generated from an initial cohort (n=4 control; 4 knockout). A second cohort of sham (n=4) and ovariectomized (n=4) female knockout mice was used to assess estradiol effect on renin and ABP and compared to male knockout (n=5). Experiment 2. Vascular hemodynamics were assessed in male (n=4) and female (n=4) control and knockout mice. Experiment 3. The effect of angiotensin II was assessed on RAAS hormone levels and ABP in sham control male (n=3 control; n=3 knockout) and infusion pump implanted (n=4 control; n=4 knockout) mice. Experiment 4. ABP, renin, and Ren1 expression was assessed in a cohort of male mice given sham (n=5 control; n=6 knockout) or low salt/captopril drinking water (control n=4; knockout n=4). One captopril treated control animal was excluded due to telemeter complications resulting in death. A second group of male animals was evaluated for histological differences in renin given sham (n=3 control; n=4 knockout) or low salt/captopril drinking water (n=6 control; n=6 knockout). Experiment 5. Expression analysis of murine kidneys and thoracodorsal arteries from wildtype male (n=3) and female (n=3) mice.
Statistics.
All data were analyzed using GraphPad Prism v7.0 software. A Shapiro-Wilk test was performed to determine normality. Brown-Forsthe/Barlett’s tests were used to determine equal variance for ANOVA and F-test was used to determine equal variance for t-test in GraphPad Prism v7.0 software. Data that passed normality tests and equal variance tests were analyzed by t-test for two groups or ANOVA (one-way and two-way) for three or more groups. Data that were not normally distributed were analyzed by Kruskal-Wallis test (three or more groups). Post-hoc analysis for multiple comparisons were selected when appropriate to correct for multiple comparison error and test for statistical significance; * p<0.05. Results are presented as mean ± s.e.m. except for qPCR results which are presented as mean fold change ± SD.
DISCLOSURE
The authors have no disclosures (financial or otherwise) related to this work.
Supplementary Material
SUPPLEMENTARY MATERIAL
Supplemental Figure 1: Ren1-Panx1Δ/Δ mice have normal renal tissue morphology.
Supplemental Figure 2: Plasma aldosterone levels are enhanced in male Ren1-Panx1 knockout mice.
Supplemental Figure 3: Male and female expression analysis of Panx1 and angiotensin-II receptors. Supplementary Figure 4:
Supplemental Figure 4: Diastolic blood pressure and heart rate from male and female
Supplemental Figure 5: Ren1d-Cre is active in reno-vascular smooth muscle cells and not peripheral vascular smooth muscle cells.
Supplemental Figure 6: Loss of Panx1 does not alter Cx40 transcription.
Supplemental Figure 7: As4.1 expression analysis and estradiol levels.
TRANSLATIONAL STATEMENT:
We find that renin-cell Panx1 channels control steady-state renin secretion under physiological conditions, and are necessary for renal cells to undergo phenotypic switching during hypotensive challenge important for cardiovascular and arterial blood pressure (ABP) stability. These data define a previously unappreciated role for Panx1 channels in regulating RAAS and ABP homeostasis. The study is clinically relevant in that the newly identified Panx1 mechanism can be potentially targeted in future therapeutic strategies for blood pressure control and glomerular diseases.
ACKNOWLEDGEMENTS
We thank Anita Impagliazzo for illustration, and Robert Carey and Mark Okusa for helpful discussions. We also thank UVA Histology Core and Advanced Microscopy Facility. Support for this work came from National Institute of Health grants F31 NS089107 (L.J.D.), HL (B.E.I.) and HL120840 (B.E.I., K.R., D.A.B., B.D.).
Footnotes
Publisher's Disclaimer: This is a PDF file of an unedited manuscript that has been accepted for publication. As a service to our customers we are providing this early version of the manuscript. The manuscript will undergo copyediting, typesetting, and review of the resulting proof before it is published in its final form. Please note that during the production process errors may be discovered which could affect the content, and all legal disclaimers that apply to the journal pertain.
Supplementary information is available on Kidney International’s website.
REFERENCES
- 1.Carey RM, Siragy HM. Newly recognized components of the renin-angiotensin system: potential roles in cardiovascular and renal regulation. Endocrine reviews 2003; 24: 261–271. [DOI] [PubMed] [Google Scholar]
- 2.Atlas SA. The renin-angiotensin aldosterone system: pathophysiological role and pharmacologic inhibition. Journal of managed care pharmacy 2007; 13: 9–20. [DOI] [PMC free article] [PubMed] [Google Scholar]
- 3.Carey RM. The intrarenal renin-angiotensin system in hypertension. Advances in chronic kidney disease 2015; 22: 204–210. [DOI] [PubMed] [Google Scholar]
- 4.Kumar R, Singh VP, Baker KM. The intracellular renin-angiotensin system: a new paradigm. Trends in Endocrinology & Metabolism 2007; 18: 208–214. [DOI] [PubMed] [Google Scholar]
- 5.Friis UG, Madsen K, Stubbe J, et al. Regulation of renin secretion by renal juxtaglomerular cells. Pflügers Archiv - European Journal of Physiology 2013; 465: 25–37. [DOI] [PubMed] [Google Scholar]
- 6.Kurtz A Renin Release: Sites, Mechanisms, and Control. Annual review of physiology 2011; 73: 377–399. [DOI] [PubMed] [Google Scholar]
- 7.Kopp U, Aurell M, Nilsson M, et al. The role of beta-1-adrenoceptors in the renin release response to graded renal sympathetic nerve stimulation. Pflügers Archiv 1980; 387: 107–113. [DOI] [PubMed] [Google Scholar]
- 8.Scholz H, Vogel U, Kurtz A. Interrelation between baroreceptor and macula densa mechanisms in the control of renin secretion. The Journal of physiology 1993; 469: 511–524. [DOI] [PMC free article] [PubMed] [Google Scholar]
- 9.Gomez RA, Lopez MLSS. Who and where is the renal baroreceptor?: the connexin hypothesis. Kidney international 2009; 75: 460–462. [DOI] [PMC free article] [PubMed] [Google Scholar]
- 10.Peti-Peterdi J, Harris RC. Macula densa sensing and signaling mechanisms of renin release. Journal of the American Society of Nephrology 2010: ASN. 2009070759. [DOI] [PMC free article] [PubMed] [Google Scholar]
- 11.Gomez RA, Lopez MLSS. Plasticity of Renin Cells in the Kidney Vasculature. Current Hypertension Reports 2017; 19: 81–84. [DOI] [PMC free article] [PubMed] [Google Scholar]
- 12.Lin EE, Sequeira-Lopez MLS, Gomez RA. RBP-J in FOXD1+ renal stromal progenitors is crucial for the proper development and assembly of the kidney vasculature and glomerular mesangial cells. AJP: Renal Physiology 2014; 306: F249–F258. [DOI] [PMC free article] [PubMed] [Google Scholar]
- 13.Gomez RA, Belyea B, Medrano S, et al. Fate and plasticity of renin precursors in development and disease. Pediatric Nephrology 2013; 29: 721–726. [DOI] [PMC free article] [PubMed] [Google Scholar]
- 14.Burnstock G, Evans LC, Bailey MA. Purinergic signalling in the kidney in health and disease. Purinergic signalling 2014; 10: 71–101. [DOI] [PMC free article] [PubMed] [Google Scholar]
- 15.Solini A, Usuelli V, Fiorina P. The dark side of extracellular ATP in kidney diseases. Journal of the American Society of Nephrology : JASN 2015; 26: 1007–1016. [DOI] [PMC free article] [PubMed] [Google Scholar]
- 16.Vallon V, Stockand J, Rieg T. P2Y receptors and kidney function. Wiley Interdisciplinary Reviews: Membrane Transport and Signaling 2012; 1: 731–742. [DOI] [PMC free article] [PubMed] [Google Scholar]
- 17.Guan Z, Inscho EW. Role of adenosine 5’-triphosphate in regulating renal microvascular function and in hypertension. Hypertension 2011; 58: 333–340. [DOI] [PMC free article] [PubMed] [Google Scholar]
- 18.Inscho EW, Cook AK, Navar LG. Pressure-mediated vasoconstriction of juxtamedullary afferent arterioles involves P2-purinoceptor activation. American Journal of Physiology-Renal Physiology 1996; 271: F1077–F1085. [DOI] [PubMed] [Google Scholar]
- 19.Inscho EW, Ohishi K, Navar L. Effects of ATP on pre-and postglomerular juxtamedullary microvasculature. American Journal of Physiology-Renal Physiology 1992; 263: F886–F893. [DOI] [PubMed] [Google Scholar]
- 20.Churchill PC, Ellis VR. Purinergic P2y receptors stimulate renin secretion by rat renal cortical slices. Journal of Pharmacology and Experimental … 1993. [PubMed] [Google Scholar]
- 21.van der Weyden L, Adams DJ, Morris BJ. Capacity for purinergic control of renin promoter via P2Y(11) receptor and cAMP pathways. Hypertension 2000; 36: 1093–1098. [DOI] [PubMed] [Google Scholar]
- 22.Toering TJ, Gant CM, Visser FW, et al. Sex differences in renin-angiotensin-aldosterone system affect extracellular volume in healthy subjects. American journal of physiology Renal physiology 2018; 314: F873–F878. [DOI] [PubMed] [Google Scholar]
- 23.Bührle C, Scholz H, Nobiling R, et al. Junctional transmission in renin-containing and smooth muscle cells of the afferent arteriole. Pflügers Archiv 1986; 406: 578–586. [DOI] [PubMed] [Google Scholar]
- 24.Yao J, Suwa M, Li B, et al. ATP-dependent mechanism for coordination of intercellular Ca2+ signaling and renin secretion in rat juxtaglomerular cells. Circulation Research 2003; 93: 338–345. [DOI] [PubMed] [Google Scholar]
- 25.Franco M, Bell PD, Navar LG. Effect of adenosine A1 analogue on tubuloglomerular feedback mechanism. American Journal of Physiology-Renal Physiology 1989; 257: F231–F236. [DOI] [PubMed] [Google Scholar]
- 26.Shirley DG, Vekaria RM, Sévigny J. Ectonucleotidases in the kidney. Purinergic Signalling 2009; 5: 501. [DOI] [PMC free article] [PubMed] [Google Scholar]
- 27.Castrop H, Huang Y, Hashimoto S, et al. Impairment of tubuloglomerular feedback regulation of GFR in ecto-5′-nucleotidase/CD73–deficient mice. The Journal of clinical investigation 2004; 114: 634–642. [DOI] [PMC free article] [PubMed] [Google Scholar]
- 28.Murray RD, Churchill PC. Effects of adenosine receptor agonists in the isolated, perfused rat kidney. American Journal of Physiology-Heart and Circulatory Physiology 1984; 247: H343–H348. [DOI] [PubMed] [Google Scholar]
- 29.Churchill PC, Churchill MC. A1 and A2 adenosine receptor activation inhibits and stimulates renin secretion of rat renal cortical slices. Journal of Pharmacology and Experimental Therapeutics 1985; 232: 589–594. [PubMed] [Google Scholar]
- 30.Ortiz-Capisano MC, Atchison DK, Harding P, et al. Adenosine inhibits renin release from juxtaglomerular cells via an A1 receptor-TRPC-mediated pathway. American Journal of Physiology-Renal Physiology 2013; 305: F1209–F1219. [DOI] [PMC free article] [PubMed] [Google Scholar]
- 31.Lohman AW, Billaud M, Isakson BE. Mechanisms of ATP release and signalling in the blood vessel wall. Cardiovascular Research 2012; 95: 269–280. [DOI] [PMC free article] [PubMed] [Google Scholar]
- 32.Chekeni FB, Elliott MR, Sandilos JK, et al. Pannexin 1 channels mediate ‘find-me’ signal release and membrane permeability during apoptosis. Nature 2010; 467: 863–867. [DOI] [PMC free article] [PubMed] [Google Scholar]
- 33.Bao L, Locovei S, Dahl G. Pannexin membrane channels are mechanosensitive conduits for ATP. FEBS letters 2004; 572: 65–68. [DOI] [PubMed] [Google Scholar]
- 34.Adamson SE, Leitinger N. The role of pannexin1 in the induction and resolution of inflammation. FEBS letters 2014; 588: 1416–1422. [DOI] [PMC free article] [PubMed] [Google Scholar]
- 35.Sandilos JK, Chiu YH, Chekeni FB, et al. Pannexin 1, an ATP release channel, is activated by caspase cleavage of its pore-associated C-terminal autoinhibitory region. J Biol Chem 2012; 287: 11303–11311. [DOI] [PMC free article] [PubMed] [Google Scholar]
- 36.Jankowski J, Perry HM, Medina CB, et al. Epithelial and Endothelial Pannexin1 Channels Mediate AKI. Journal of the American Society of Nephrology 2018: ASN. 2017121306. [DOI] [PMC free article] [PubMed] [Google Scholar]
- 37.Hanner F, Lam L, Nguyen MTX, et al. Intrarenal localization of the plasma membrane ATP channel pannexin1. AJP: Renal Physiology 2012; 303: F1454–F1459. [DOI] [PMC free article] [PubMed] [Google Scholar]
- 38.Billaud M, Lohman AW, Straub AC, et al. Characterization of the Thoracodorsal Artery: Morphology and Reactivity. Microcirculation 2012; 19: 360–372. [DOI] [PMC free article] [PubMed] [Google Scholar]
- 39.Lohman AW, Billaud M, Straub AC, et al. Expression of pannexin isoforms in the systemic murine arterial network. Journal of vascular research 2012; 49: 405–416. [DOI] [PMC free article] [PubMed] [Google Scholar]
- 40.Billaud M, Lohman AW, Straub AC, et al. Pannexin1 regulates α1-adrenergic receptor-mediated vasoconstriction. Circulation Research 2011; 109: 80–85. [DOI] [PMC free article] [PubMed] [Google Scholar]
- 41.Billaud M, Chiu Y-H, Lohman AW, et al. A molecular signature in the Pannexin 1 intracellular loop confers channel activation by the α1-adrenergic receptor in smooth muscle cells. Science Signaling 2015: 1–63. [DOI] [PMC free article] [PubMed] [Google Scholar]
- 42.Penuela S, Gehi R, Laird DW. The biochemistry and function of pannexin channels. Biochimica et biophysica acta 2013; 1828: 15–22. [DOI] [PubMed] [Google Scholar]
- 43.López MLSS, Pentz ES, Nomasa T, et al. Renin cells are precursors for multiple cell types that switch to the renin phenotype when homeostasis is threatened. Developmental cell 2004; 6: 719–728. [DOI] [PubMed] [Google Scholar]
- 44.Jones CA, Petrovic N, Novak EK, et al. Biosynthesis of renin in mouse kidney tumor As4.1 cells. European journal of biochemistry / FEBS 1997; 243: 181–190. [DOI] [PubMed] [Google Scholar]
- 45.Kurtz A Control of renin synthesis and secretion. American journal of hypertension 2012; 25: 839–847. [DOI] [PubMed] [Google Scholar]
- 46.Abeele FV, Bidaux G, Gordienko D, et al. Functional implications of calcium permeability of the channel formed by pannexin 1. J Cell Biol 2006; 174: 535–546. [DOI] [PMC free article] [PubMed] [Google Scholar]
- 47.Momboisse F, Olivares MJ, Báez-Matus X, et al. Pannexin 1 channels: new actors in the regulation of catecholamine release from adrenal chromaffin cells. Frontiers in Cellular Neuroscience 2014; 8: 270. [DOI] [PMC free article] [PubMed] [Google Scholar]
- 48.Trinkaus-Randall V, Lee Y, Kim MT, et al. Sustained Ca2+ mobilizations: a quantitative approach to predict their importance in cell-cell communication and wound healing. BioRxiv 2019: 558320. [DOI] [PMC free article] [PubMed] [Google Scholar]
- 49.Grünberger C, Obermayer B, Klar Jr, et al. The calcium paradoxon of renin release: calcium suppresses renin exocytosis by inhibition of calcium-dependent adenylate cyclases AC5 and AC6. Circulation research 2006; 99: 1197–1206. [DOI] [PubMed] [Google Scholar]
- 50.Klar J, Sigl M, Obermayer B, et al. Calcium inhibits renin gene expression by transcriptional and posttranscriptional mechanisms. Hypertension 2005; 46: 1340–1346. [DOI] [PubMed] [Google Scholar]
- 51.Xin H-B, Deng K-Y, Rishniw M, et al. Smooth muscle expression of Cre recombinase and eGFP in transgenic mice. Physiological genomics 2002; 10: 211–215. [DOI] [PubMed] [Google Scholar]
- 52.Burcklé CA, Jan Danser A, Müller DN, et al. Elevated blood pressure and heart rate in human renin receptor transgenic rats. Hypertension 2006; 47: 552–556. [DOI] [PubMed] [Google Scholar]
- 53.Martinez MF, Medrano S, Brown EA, et al. Super-enhancers maintain renin-expressing cell identity and memory to preserve multisystem homeostasis. The Journal of clinical investigation 2018. [DOI] [PMC free article] [PubMed] [Google Scholar]
- 54.Intengan HD, Schiffrin EL. Vascular remodeling in hypertension: roles of apoptosis, inflammation, and fibrosis. Hypertension 2001; 38: 581–587. [DOI] [PubMed] [Google Scholar]
- 55.Schiffrin EL. Vascular remodeling in hypertension: mechanisms and treatment. Hypertension 2012; 59: 367–374. [DOI] [PubMed] [Google Scholar]
- 56.Good ME, Chiu Y-H, Poon IK, et al. Pannexin 1 Channels as an Unexpected New Target of the Anti-Hypertensive Drug Spironolactone. Circulation research 2017: CIRCRESAHA. 117.312380. [DOI] [PMC free article] [PubMed] [Google Scholar]
- 57.Novielli-Kuntz NM, Jelen M, Barr K, et al. Ablation of both Cx40 and Panx1 results in similar cardiovascular phenotypes exhibited in Cx40 knockout mice. Bioscience Reports 2019: BSR20182350. [DOI] [PMC free article] [PubMed] [Google Scholar]
- 58.Schunkert H, Danser AJ, Hense H-W, et al. Effects of estrogen replacement therapy on the renin-angiotensin system in postmenopausal women. Circulation 1997; 95: 39–45. [DOI] [PubMed] [Google Scholar]
- 59.Xu X, Xiao J-C, Luo L-F, et al. Effects of ovariectomy and 17β-estradiol treatment on the renin–angiotensin system, blood pressure, and endothelial ultrastructure. Int J Cardiol 2008; 130: 196–204. [DOI] [PubMed] [Google Scholar]
- 60.Wang Y, Shoemaker R, Thatcher SE, et al. Administration of 17β-estradiol to ovariectomized obese female mice reverses obesity-hypertension through an ACE2-dependent mechanism. American Journal of Physiology-Endocrinology and Metabolism 2015; 308: E1066–E1075. [DOI] [PMC free article] [PubMed] [Google Scholar]
- 61.Scammell JG, Fregly MJ. Attenuation of isoproterenol-stimulated plasma renin activity by chronic estrogen treatment. Proceedings of the Society for Experimental Biology and Medicine 1981; 167: 117–121. [DOI] [PubMed] [Google Scholar]
- 62.CRANE MG, HEITSCH J, HARRIS JJ, et al. Effect of ethinyl estradiol (Estinyl) on plasma renin activity. The Journal of Clinical Endocrinology & Metabolism 1966; 26: 1403–1406. [DOI] [PubMed] [Google Scholar]
- 63.Sealey JE, Itskovitz-Eldor J, Rubattu S, et al. Estradiol-and progesterone-related increases in the renin-aldosterone system: studies during ovarian stimulation and early pregnancy. The Journal of Clinical Endocrinology & Metabolism 1994; 79: 258–264. [DOI] [PubMed] [Google Scholar]
- 64.Oelkers WK. Effects of estrogens and progestogens on the renin-aldosterone system and blood pressure. Steroids 1996; 61: 166–171. [DOI] [PubMed] [Google Scholar]
- 65.Brosnihan K, Senanayake P, Li P, et al. Bi-directional actions of estrogen on the renin-angiotensin system. Brazilian journal of medical and biological research 1999; 32: 373–381. [DOI] [PubMed] [Google Scholar]
- 66.Brosnihan KB, Weddle D, Anthony MS, et al. Effects of chronic hormone replacement on the renin-angiotensin system in cynomolgus monkeys. Journal of hypertension 1997; 15: 719–726. [DOI] [PubMed] [Google Scholar]
- 67.Chidambaram M, Duncan JA, Lai VS, et al. Variation in the renin angiotensin system throughout the normal menstrual cycle. Journal of the American Society of Nephrology 2002; 13: 446–452. [DOI] [PubMed] [Google Scholar]
- 68.Lu K-T, Keen HL, Weatherford ET, et al. Estrogen receptor α is required for maintaining baseline renin expression. Hypertension 2016; 67: 992–999. [DOI] [PMC free article] [PubMed] [Google Scholar]
- 69.Sequeira Lopez ML, Pentz ES, Robert B, et al. Embryonic origin and lineage of juxtaglomerular cells. AJP: Renal Physiology 2001; 281: F345–356. [DOI] [PubMed] [Google Scholar]
- 70.Gomez RA, Lynch KR, Sturgill BC, et al. Distribution of renin mRNA and its protein in the developing kidney. The American journal of physiology 1989; 257: F850–858. [DOI] [PubMed] [Google Scholar]
- 71.Pentz ES, Moyano MA, Thornhill BA, et al. Ablation of renin-expressing juxtaglomerular cells results in a distinct kidney phenotype. American Journal of Physiology-Regulatory, Integrative and Comparative Physiology 2004; 286: R474–483. [DOI] [PubMed] [Google Scholar]
- 72.Pentz ES, López M, Cordaillat M. Identity of the renin cell is mediated by cAMP and chromatin remodeling: an in vitro model for studying cell recruitment and plasticity. American Journal of … 2008. [DOI] [PubMed] [Google Scholar]
- 73.Zippel N, Limbach CA, Ratajski N, et al. Purinergic receptors influence the differentiation of human mesenchymal stem cells. Stem cells and development 2011; 21: 884–900. [DOI] [PubMed] [Google Scholar]
- 74.Locovei S, Wang J, Dahl G. Activation of pannexin 1 channels by ATP through P2Y receptors and by cytoplasmic calcium. FEBS letters 2006; 580: 239–244. [DOI] [PubMed] [Google Scholar]
- 75.Murali S, Zhang M, Nurse CA. Evidence that 5 - HT stimulates intracellular Ca2+ signalling and activates pannexin - 1 currents in type II cells of the rat carotid body. The Journal of physiology 2017; 595: 4261–4277. [DOI] [PMC free article] [PubMed] [Google Scholar]
- 76.Seminario-Vidal L, Kreda S, Jones L, et al. Thrombin promotes release of ATP from lung epithelial cells through coordinated activation of rho-and Ca2+-dependent signaling pathways. Journal of Biological Chemistry 2009: jbc. M109. 004762. [DOI] [PMC free article] [PubMed] [Google Scholar]
- 77.Gödecke S, Roderigo C, Rose CR, et al. Thrombin-induced ATP release from human umbilical vein endothelial cells. American Journal of Physiology-Cell Physiology 2011; 302: C915–C923. [DOI] [PubMed] [Google Scholar]
- 78.Schweda F, Segerer F, Castrop H, et al. Blood Pressure–Dependent Inhibition of Renin Secretion Requires A1 Adenosine Receptors. Hypertension 2005; 46: 780–786. [DOI] [PubMed] [Google Scholar]
- 79.Poon IKH, Chiu Y-H, Armstrong AJ, et al. Unexpected link between an antibiotic, pannexin channels and apoptosis. Nature 2014; 507: 329–334. [DOI] [PMC free article] [PubMed] [Google Scholar]
Associated Data
This section collects any data citations, data availability statements, or supplementary materials included in this article.
Supplementary Materials
SUPPLEMENTARY MATERIAL
Supplemental Figure 1: Ren1-Panx1Δ/Δ mice have normal renal tissue morphology.
Supplemental Figure 2: Plasma aldosterone levels are enhanced in male Ren1-Panx1 knockout mice.
Supplemental Figure 3: Male and female expression analysis of Panx1 and angiotensin-II receptors. Supplementary Figure 4:
Supplemental Figure 4: Diastolic blood pressure and heart rate from male and female
Supplemental Figure 5: Ren1d-Cre is active in reno-vascular smooth muscle cells and not peripheral vascular smooth muscle cells.
Supplemental Figure 6: Loss of Panx1 does not alter Cx40 transcription.
Supplemental Figure 7: As4.1 expression analysis and estradiol levels.