

SUMMARY
The ribosome-associated protein quality control (RQC) system that resolves stalled translation events is activated when ribosomes collide and form disome, trisome or higher order complexes. However, it is unclear whether this system distinguishes collision complexes formed on defective mRNAs from those with functional roles on endogenous transcripts. Here, we performed disome and trisome footprint profiling in yeast and found collisions were enriched on diverse sequence motifs known to slow translation. When 60S recycling was inhibited, disomes accumulated at stop codons and could move into the 3’UTR to reinitiate translation. The ubiquitin ligase and RQC factor Hel2/ZNF598 generally recognized collisions but did not trigger degradation of endogenous transcripts. However, loss of Hel2 triggered the integrated stress response, via phosphorylation of eIF2α, thus linking these pathways. Our results suggest that Hel2 has a role in sensing ribosome collisions on endogenous mRNAs and such events may be important for cellular homeostasis.
eTOC Blurb
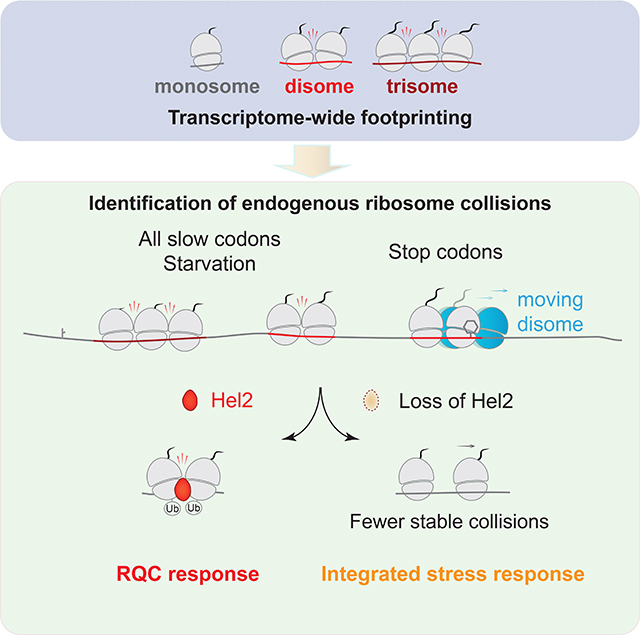
By global footprinting of collided ribosomes (disomes and trisomes), Meydan and Guydosh report that ribosomes collide on most endogenous mRNAs. These collisions are recognized by multiple stress response pathways but do not trigger substantial mRNA decay. Collisions at strategic locations of some mRNAs may play functional roles in co-translational events.
Graphical Abstract
INTRODUCTION
One mechanism the cell can use to monitor the quality of protein and mRNA is to sense the state of the translating ribosome. A stalled translation cycle could indicate an mRNA defect and directly lead to synthesis of aberrant proteins or a shortage of ribosomes. Therefore, organisms have evolved dedicated pathways to detect and resolve stalled ribosomes, such as the RQC system in eukaryotes (Brandman and Hegde, 2016; Ikeuchi et al., 2018; Joazeiro, 2019). Defects in the RQC pathway result in proteotoxicity (Choe et al., 2016; Izawa et al., 2017; Yonashiro et al., 2016) and neurodegenerative diseases (Chu et al., 2009; Ishimura et al., 2014), suggesting that rescue of stalled ribosomes is critical for maintaining cellular homeostasis.
Ribosomes are known to stall upon encountering certain mRNA sequences, such as unfavorable codons (Gamble et al., 2016; Letzring et al., 2013), poly(A) tracts that encode poly-Lys (Dimitrova et al., 2009), damaged mRNAs (Simms et al., 2014), or secondary structures (Doma and Parker, 2006). Recognition of stalled ribosomes has been observed to trigger branches of the RQC system and this process is thought to begin with the E3 ubiquitin ligase, Hel2(Rqt1) (yeast)/ZNF598 (mammals), ubiquitinating 40S ribosomal proteins within the stalled ribosome (Brandman et al., 2012; Garzia et al., 2017; Sundaramoorthy et al., 2017). The collision complex formed by two ribosomes (referred to as a disome) was shown to be the key signal recognized by Hel2 since the sensitivity of reporter mRNAs to RQC-mediated degradation scaled with ribosome loading (translational efficiency) (Simms et al., 2017). Disomes protect a defined footprint (Guydosh and Green, 2014; Guydosh et al., 2017; Wolin and Walter, 1988) and form a distinct structure revealed by cryo-electron microscopy (Ikeuchi et al., 2019; Juszkiewicz et al., 2018). Biochemical and structural data have also suggested that trisomes may serve as a unique signal of ribosome collision (Ikeuchi et al., 2019; Matsuo et al., 2020).
The ubiquitinated disome has been proposed to recruit an RQC-trigger (RQT) complex composed of Slh1(Rqt2)/ASCC3, Cue3(Rqt3) and Rqt4 (Matsuo et al., 2017) that, in turn, sets off a cascade of events leading to degradation of the mRNA and nascent peptide, and separation of the stalled ribosomes into 40S and 60S subunits (Joazeiro, 2019). The degradation of the mRNA, a process also referred to as no-go decay (NGD), was shown to involve multiple endonucleolytic cleavage events in both the A-site of the leading ribosome and further upstream (D’Orazio et al., 2019; Doma and Parker, 2006; Glover et al., 2020; Guydosh and Green, 2017; Guydosh et al., 2017; Ikeuchi et al., 2019; Simms et al., 2018). The effect of Hel2 was tested by expressing reporter mRNAs comprising a stretch of tandem AAA or CGA codons known to slow translation (by encoding poly-Lys or poly-Arg requiring an I-A base pair with tRNA, respectively) sandwiched between two reporter genes (Brandman et al., 2012; Dimitrova et al., 2009; Letzring et al., 2013). Deletion of HEL2 increased the relative level of protein encoded by the gene positioned after the stall site, suggesting that disomes eventually resume translation if they are not removed from the mRNA during the RQC process. Similar findings were reported in mammalian cells (Juszkiewicz and Hegde, 2017; Sundaramoorthy et al., 2017). These results are consistent with data from ribosome profiling of reporter mRNAs, where low footprint levels downstream of the stall-inducing sequence were restored in a hel2Δ strain (Matsuo et al., 2017). However, footprint peaks derived from stalled ribosomes at these sites do not substantially increase in the absence of Hel2 (Sitron et al., 2017), as might be expected if stalled ribosomes persist without RQC-mediated ribosome rescue. This suggests that the kinetics of disome formation and RQC-mediated rescue versus translation resumption are not fully understood.
While the RQC pathway and related processes detect translation of aberrant mRNAs, it is unclear whether such quality control factors sense likely innocuous disomes that form stochastically on non-aberrant transcripts or during programmed stalling events with functional roles, such as localization of membrane proteins or promotion of protein folding (Collart and Weiss, 2019). Data from disome profiling, which is a modified ribosome profiling method (Ingolia et al., 2009) based on sequencing of disome-protected mRNA fragments (Guydosh and Green, 2014), show that disomes are frequently associated with yeast transcripts (Diament et al., 2018). Theoretical modeling has suggested that disomes should stochastically form on highly translated mRNAs (Juszkiewicz et al., 2018; Park and Subramaniam, 2019). This prediction therefore highlights the question of whether the RQC pathway is able to distinguish between functional and harmful disomes.
Here, by optimizing our previously-reported disome profiling approach, and expanding it to include trisomes, we investigated the distribution of ribosome collisions in the cell. We found that collisions are enriched at stop codons and at many stall-inducing motifs, including but not limited to, canonical RQC-recognition motifs such as polybasic sequences. Loss of Hel2 or expression of an E3 ligase-inactive Hel2 caused a global decrease at sites most strongly enriched for disomes and trisomes, consistent with a model where Hel2 stabilizes collisions. Engagement of Hel2 with disome-bound mRNA did not trigger its selective degradation. Interestingly, Hel2 deletion stimulated the integrated stress response (ISR) via phosphorylation of eIF2α and amino-acid starvation (canonically considered a trigger of the ISR) increased ubiquination of disomes by Hel2, suggesting possible crosstalk between the RQC and ISR pathways. We further suggest that disome formation at strategic locations, where ribosome stalling could mediate co-translational events, may be important for cellular homeostasis.
RESULTS
Disome and trisome profiling reveal transcriptome-wide ribosome collisions
To monitor the distribution of ribosome collisions throughout the yeast transcriptome, we performed disome footprint profiling (Guydosh and Green, 2014; Ingolia et al., 2009; McGlincy and Ingolia, 2017) (Figure 1A). We obtained monosome- and disome-protected mRNAs by digesting yeast lysate with RNase I and then isolating nuclease-resistant footprints from the monosome and disome peaks in a sucrose gradient (Figure S1A) (Diament et al., 2018; Guydosh and Green, 2014). We also isolated the fraction corresponding to RNase I-resistant trisomes (Figures 1A and S1A). We selected monosome footprints measuring 25 to 34 nucleotide (nt) in length, disome footprints of 40 to 80 nt in length or, in some datasets, 54 to 68 nt to reduce rRNA and tRNA contamination (Figure S1B), and trisome footprints of 80 to 100 nt. As expected, our mapped monosome reads measured 27 to 29 nt in length. Disome footprints were 57 to 63 nt long, consistent with the approximate size of the mRNA protected in a yeast disome structure (Ikeuchi et al., 2019) and roughly double the monosome footprint length. Trisome footprints, which were primarily 87 to 95 nt in length, increased the length of the footprint by 30 nt due to the addition of a third ribosome into the collision complex (Figures 1B and S1B).
Figure 1: Disome and trisome profiling capture the distribution of collided ribosomes.

A. Schematic representation of monosome, disome and trisome profiling experiments. RNase I treatment of yeast lysate results in monosome-, disome-, and trisome-protected mRNAs, which are then separated by sucrose gradient. RNAs at the indicated size ranges are then selected by gel electrophoresis.
B. Length distribution of monosome (left), disome (middle) and trisome profiling (right) reads. Distinct peaks corresponding to 58- and 61 nt-long disome footprints, and 88-, 91- and 94 nt-long trisome footprints are indicated by arrows. The cartoons represent possible arrangement of collisions. Other replicates are shown in Figure S1B.
C. Average monosome (gray), disome (red) and trisome (dark red) reads per million (rpm) mapped to ORFs aligned by their stop codons (metagene plots). Both 5’ (top) and 3’ (bottom) end alignment of footprints from WT cells are shown. Schematic at top drawn to scale to match peaks in plots below. Other replicates are shown in Figure S1C. Figure S1D shows the plot of the disome profiling data matching the conditions of the trisome profiling.
D. Average monosome (gray), disome (red) and trisome (dark red) rpm mapped to ORFs aligned by their start codons. Note first disome/trisome reads appear ~12 nt further into ORF than monosome reads in the upper plot. On bottom plot, this ~12 nt distance is extended by the footprint size of the disome or trisome, as expected.
See also Figure S1.
Curiously, the disome footprint length distribution showed two major peaks at 58 and 61 nt (Figures 1B and S1B). To determine whether these footprints differed due to variability at their 5’ or 3’ ends, we plotted the average occupancy of 5’ and 3’ ends obtained from genes aligned by their stop codons (Figures 1C and S1C). This metagene analysis illustrated that the 5’ ends of monosome footprints (Figure 1C, top) exhibited a peak 19 nt upstream of the stop codon, corresponding to the terminating ribosome. The disome peak appeared 31 nt (approximately 1 ribosome length) further upstream (at position −50), consistent with a disome formed by a translating ribosome colliding with a terminating ribosome. We also observed a small peak further upstream (at position −80), suggesting that a partially digested trisome was captured in our disome profiling experiment. Our trisome profiling experiment directly detected this complex (Figure 1C, at position −80). The trisome peak at position −110 suggested that a partially digested “tetrasome” (4 queued ribosomes) was also captured in our trisome profiling experiment (Figure 1C). As expected, monosome, disome and trisome peaks at stop codons were exactly aligned since the 3’ end in all cases is created by a terminating ribosome (Figure 1C, bottom). We noted that peaks in the disome metagene data consisted of a doublet in the 5’-mapped data, but only a singlet peak in the 3’-mapped data (Figures 1C and S1C). This difference suggests that the two disome footprint sizes differ at their 5’ ends, potentially due to differential packing between collided ribosomes. Consistent with distinct types of collisions, we observed three major footprint lengths in trisome profiling data (88, 91 and 94 nt) due primarily to variability at the 5’ ends (Figures 1B, 1C and S1D).
We also performed a metagene analysis on footprints from genes aligned by their start codons. In line with the previous observations that the initiating monosome may need additional downstream space at the beginning of ORFs (Guydosh and Green, 2014), the first ~12 nt of the ORFs were free of disomes and trisomes (Figure 1D). Overall, the distinct 3-nt periodicity throughout the metagene plots strongly indicates that our approach predominantly captures ribosome collisions rather than other molecular complexes.
Induction of ribosome stalling varies disome architecture
Having established the disome profiling as a tool to study distinct types of collisions, we next explored whether disome footprint sizes change in response to global induction of stalling. We first addressed this question by treating the cells with anisomycin (ANS), which prevents peptidyl transfer and was shown to stall ribosomes with an open A-site and generate a footprint measuring ~21 nt in length due to reduced protection from the nuclease on the 3’ end of the footprint (Lareau et al., 2014; Wu et al., 2019). Consistent with this prediction, disome profiling of ANS-treated cells yielded a population of footprints that averaged 51 nt in length (Figure S2A). The 51 nt disome footprints are consistent with an 80S ribosome, presumably in the hybrid state (protecting ~30 nt), queued behind an ANS-stalled ribosome with an open A-site (protecting ~21 nt). The persistence of some 58-nt footprints likely results from tRNA and antibiotic exchange in the lysate (Wu et al., 2019).
To further test our assignment of the disome peaks, we conducted disome profiling in cells treated with 3-Amino-1,2,4-triazole (3-AT), which is known to inhibit His biosynthesis and therefore to cause ribosome stalling at His codons due to a decrease in the acylated His tRNA pool (Klopotowski and Wiater, 1965). As expected, the average disome occupancy on His codons in 3-AT-treated cells showed a disome peak that was absent in mock-treated cells (Figure 2A). We also noted an upstream peak that was likely formed by a partially-digested trisome. Interestingly, 3-AT treatment caused accumulation of only 58mers whereas 61mers were no longer observed (Figure S2B). These data suggest that strong stalling could allow for more tightly packed disomes.
Figure 2: Cellular stress and ribosome recycling failure perturb disome distribution.

A. Average of normalized disome reads mapped to His codons in mock-treated (red) and 3-AT treated cells (orange). A queued ribosome 30 nt upstream of the main disome peak is indicated.
B. Average disome rpm mapped to ORFs aligned by their stop codons in WT (red) and hcr1Δ (purple) cells. 3’ end alignment of the footprints is shown. In hcr1Δ cells, disome occupancy is higher around the stop codon than in WT cells. Dashed lines and schematics depict individual peaks corresponding to ribosomes stacked behind the unrecycled ribosome. The stop codon is indicated in red and cartoon representations of Hcr1 and Rli1 (60S dissociation factor) are shown. Inset shows a magnified view of the 3’UTR. Distinct disome occupancy 30 nt downstream of the stop codon corresponds to a disome unit composed of an unrecycled ribosome pushed by an upstream ribosome (short arrow) (note 3-nt periodicity). These ribosomes eventually re-initiate, translate 3’UTR and form disomes further downstream in the 3’UTR (long arrow). Re-initiating monosome is shown in a lighter shade. A biological replicate is shown in Figure S2C.
See also Figure S2.
Together, these results imply that disome footprint sizes are consistent with our understanding of monosome footprints and disome profiling can capture altered architectures of ribosome collisions.
Disomes reveal steps in post-termination reinitiation
As an additional control for our assignment of disome peaks near stop codons, we next performed disome profiling in a strain defective in ribosome recycling. In previous monosome profiling experiments, we found that monosomes queued at stop codons when we impaired ribosome recycling (Young and Guydosh, 2019; Young et al., 2015; Young et al., 2018). To see whether impaired recycling also increased disome accumulation near stop codons, we conducted disome profiling in cells lacking Hcr1 (hcr1Δ), which is an accessory factor for the initial phase of ribosome recycling (removal of the 60S subunit) after translation termination (Young and Guydosh, 2019). Loss of Hcr1 causes unrecycled 80S ribosomes to accumulate at stop codons. Consistent with this prediction, queues of at least 3 ribosomes in hcr1Δ cells were enriched compared to WT cells behind stop codons (Figures 2B and S2C).
It was shown that if ribosomes are not immediately recycled following peptide release, they reinitiate translation (producing peptides and ribosome-protected footprints) in the 3’UTR, after a period of presumed “80S scanning” to find a reinitiation site (Young and Guydosh, 2019; Young et al., 2015). However, the evidence for this scanning 80S intermediate was indirect. Here, close inspection of the 3’ ends of disome footprints in the hcr1Δ metagene plot revealed an enrichment in the ~30 nt region immediately downstream of the peak corresponding to the terminal disome, a region free of disomes in WT data (Figure 2B, inset). We suggest that this density is created by a moving disome made up of an unrecycled (scanning) 80S ribosome in the lead position and a translating (or terminating) ribosome in the trailing position (Figure 2B). Disome peaks in this region were reproducible and appeared more distinct in data aligned by 5’ ends (Figure S2C). Therefore, these data offer direct evidence of scanning 80S ribosomes being “pushed” into the 3’UTR by upstream ribosomes. A sharp decrease in the disome occupancy at the 3’ end of this region suggests that once the trailing ribosome terminates translation, the disome then formed by two scanning ribosomes becomes unstable. Disome peaks appear downstream in the 3’UTR after sufficient distance allows for reinitiation and ribosome queuing to occur (Figure 2B).
Disome peaks are enriched on many known stalling motifs
After establishing the distribution of collided ribosomes at the beginning and end of ORFs, we next asked where disomes are enriched within coding regions. To answer this question, we used 3’ alignment for all subsequent analysis since we found peaks appear as singlets rather than doublets (Figure 1).
It has been proposed that disomes should stochastically form within highly translated mRNAs due to elevated ribosome traffic (Juszkiewicz et al., 2018). If true, we would expect that highly translated mRNAs have frequent ribosome collisions, which will be reflected by high disome to monosome relative occupancy. To test this idea, we compared the translation efficiency () of every gene with a ribosome “collision score” (). We did not observe, however, strong correlation between TE and the collision score (Figure S3A and Discussion). Given that ribosome loading appeared to be non-predictive of disome formation, we next investigated whether specific sequence motifs known to slow translation led to disome formation.
Numerous studies in yeast have shown that consecutive Lys or Arg amino acids induce translation arrest as well as protein degradation (Brandman et al., 2012; Dimitrova et al., 2009; Guydosh and Green, 2017; Letzring et al., 2013; Matsuo et al., 2017) and therefore represent potential sites of ribosome collision and substrates for RQC. Indeed, we observed isolated disome peaks within coding regions at consecutive Lys or Arg codons (Figure 3A, bottom). In contrast, monosome profiling data did not show distinct stalling peaks in the corresponding regions (Figure 3A, top), demonstrating the sensitivity of the disome profiling method in detecting ribosome collisions. Averaging disome occupancy normalized to a defined window around Lys or Arg codons further showed that disome reads were globally enriched in regions that included poly-Lys and, with less specificity for position within the ribosome, poly-Arg. Enrichment also scaled with the number of consecutive codons, as expected (Figure 3B). Synonymous codon composition (AAA vs AAG) of the Lys-coding regions had little effect on the average disome peak height (Figure S3B) while peaks on poly-Arg were enhanced by the inclusion of CGA codons (Figure S3C), consistent with evidence that CGA codons promote stalling due to wobble decoding by an inosine base (Letzring et al., 2010).
Figure 3: Disomes are enriched on a wide range of stalling motifs.

A. Monosome (gray, top) and disome (red, bottom) profiles of HHO1, PWP1 and ASR1 genes in WT cells. mRNA and amino acid sequences mapping to the disome peaks are shown in red.
B. Average, normalized monosome (gray) and disome (red) rpm mapped to single, double or triple Lys (left) and Arg (right) motifs. The positions corresponding to where the 3’ codon would be for the A, P or E site of the lead ribosome is indicated at top.
C. Monosome (gray, top) and disome (red, bottom) profiles of SPN1 and TFG1 genes.
D. Average pause scores of 6267 tripeptide motifs plotted for disome versus monosome data. Each point represents a tripeptide motif. Pause scores were calculated by applying a shift value of 18 nt from the 3’ end of the disome footprint, placing the first codon of the tripeptide motif in the E site. Some example stalling motifs are labeled on the graph.
See also Figure S3.
During further examination of the data, we observed disome peaks at codons that do not encode basic amino acids, usually a stronger peak than that evident in corresponding monosome profiling data (Figure 3C). To globally quantify this apparent disome enrichment, we computed a disome and monosome “pausescore” metric (see STAR methods) for every tri-peptide motif (Figure 3D). Although monosome and disome pause scores were generally correlated (Spearman r = 0.50), we noticed that for certain motifs, the disome pause scores were substantially higher than the monosome pause scores. Interestingly, some of these motifs, rich in Pro, Gly, and Asp, are known to generally slow the ribosome and require the activity of eIF5A for efficient translation (Schuller et al., 2017) (Figure 3D). Disomes were also strongly enriched on the 17 codon pairs that were previously identified to inhibit translation due to interaction between adjacent tRNAs (Gamble et al., 2016) (Figure S3D). These findings showed that disome formation is not simply triggered by polybasic sequences, but can also occur at other slow sequences that have not been widely shown to elicit the RQC pathway (Brandman et al., 2012; Dimitrova et al., 2009).
Disome peak intensity is globally decreased in the absence of Hel2
It is known that long (>12 aa) poly-Lys and poly-Arg repeats in reporter genes trigger translation arrest and RQC (Bengtson and Joazeiro, 2010; Brandman et al., 2012; Dimitrova et al., 2009). We therefore asked whether endogenous mRNAs encoding shorter polybasic stretches are also detected by the RQC pathway. Loss of Hel2 has been shown to allow ribosomes to more efficiently read through long polybasic sequences (Letzring et al., 2013; Matsuo et al., 2017; Sitron et al., 2017), presumably because they are no longer removed (rescued) from the mRNA as part of the RQC process (Ikeuchi et al., 2019; Simms et al., 2017). If Hel2 directly triggers rescue of ribosomes, then we would expect an accumulation of disomes in hel2Δ cells at RQC-targeted sites. We tested this hypothesis by performing disome profiling in the absence of the HEL2 gene. We found that the average disome occupancy at Lys3 motifs was lower in hel2Δ compared to WT cells (Figures 4A and S4A). While a decrease, rather than an increase, in disome occupancy was unanticipated (see Discussion), this result confirms that disomes on endogenous mRNAs are detected by the RQC pathway. In addition, we saw a similar trend in pausing levels for Gly- and Pro-rich sequences (Figure S4A), suggesting that the RQC pathway also affects ribosome stalling on motifs that have not been typically categorized as RQC targets (Dimitrova et al., 2009).
Figure 4: Loss of Hel2 decreases disome and trisome formation at various motifs.

A. Top panels: Disome profiles of HHO1 and PWP1 genes in WT (red) and hel2Δ (black) cells. The disome peak that is sensitive to Hel2 loss is shown by a black arrow. mRNA and amino acid sequences mapping to the disome peaks are shown in red. Bottom: Average, normalized disome reads mapped to Lys3 motifs from WT (red) and hel2Δ (black) cells. The box plot shows the distribution of individual pause scores from Lys3-coding sites (n=202) in the transcriptome.
B. Average disome pause scores of 261 tripeptide motifs plotted for WT (red) and hel2Δ (black). Each point represents a tripeptide motif that was filtered for having a pause score greater than 5 in WT. The black line inside each distribution represents the mean of the corresponding data. The full distribution of all 6267 motifs is shown in Figure S4B.
C. Top left/center panels: Trisome profiles of HHO1 and PWP1 genes in WT (dark red) and hel2Δ (black) cells. Arrow indicates the trisome peak that is sensitive to Hel2 loss (disome formed at this position shown in A). Top right panel: As shown for disome data in B, average trisome pause scores of 391 tripeptide motifs plotted for WT (dark red), hel2Δ (black) show loss of Hel2 reduces pause scores. The unfiltered distribution of all 6267 motifs is shown in Figure S4B. Bottom panel: Average, normalized trisome reads mapped to Lys3 motifs from WT (dark red) and hel2Δ (black) cells. The box plot shows the distribution of individual pause scores from Lys3-coding sites (n=173).
D. Model of Hel2 action on collisions formed on endogenous mRNAs. In WT cells, upon ribosome stalling, disomes and trisomes are transiently formed (encounter complexes). This encounter complex is recognized and possibly stabilized by Hel2. Ubiquitination activity of Hel2 is important for maintaining these disomes. In the absence of Hel2, the disomes/trisomes are no longer stable and presumably continue translation downstream of the stall site.
See also Figure S4.
To assess how Hel2 affects disome levels globally, we next computed pause scores across tri-peptide motifs and observed that the disome pauses were reproducibly lower in the absence of Hel2 for those motifs that most strongly induce disome formation (Figures 4B and S4B). These peaks were restored when we expressed HEL2 in hel2Δ cells (hel2Δ HEL2) from a single-copy plasmid, compared to WT cells that carry an empty vector (WT EV) (Figure S4B). To test if ubiquitination of ribosomal proteins by Hel2 has any effect on disome peaks, we expressed a mutant form of Hel2 (C64A/C67A), which carries alanine substitutions at the key cysteine residues in its RING domain responsible for the ubiquitin ligase activity. These mutations impair the E3 ligase activity of Hel2 without affecting its expression level or its binding to ribosomes (Ikeuchi et al., 2019; Matsuo et al., 2017). Mutant Hel2 expressed in hel2Δ cells (hel2Δ hel2-mut) failed to restore disome levels and mirrored the phenotype observed with hel2Δ EV cells (Figure S4B). These results suggest that, by ubiqutinating stalled ribosomes, Hel2 plays an important role in regulating the stability and/or formation of disomes.
Decreased disome abundance in hel2Δ cells could also be explained by increased ribosome queuing in the absence of Hel2, leading to fewer disomes in exchange for more higher order species (such as trisomes or tetrasomes) that are not directly detected by disome profiling. To test this possibility, we conducted trisome profiling in hel2Δ cells. Strikingly, formation of trisomes on prominent stalling motifs was also significantly reduced in the absence of Hel2 (Figures 4C and S4B), suggesting that the reduction in the disome peaks in the hel2Δ strain is not due to the formation of higher order queued complexes.
We note that the collisions were not completely abolished in hel2Δ cells and generally not reduced for the weakest stalling motifs (Figures 4 and S4B). These trends suggest that other translation factors contribute to the stability of collisions or that transient collisions can still be isolated for footprinting. Since Slh1 and Hel2 physically interact with each other and deletion of either factor results in enhanced readthrough of sequences that induce ribosome stalling in reporter experiments (Matsuo et al., 2017; Matsuo et al., 2020; Sitron et al., 2017), we also tested if Slh1 plays a role in recognition of disomes. Although the effect was not as strong, knockout of Slh1 also decreased disome formation, hinting that the interaction of Hel2 and Slh1 may be important (Figure S4C). To rule out the possibility that disome reduction was due to pleiotropic effects or reduced fitness in these strains, we also performed the analysis on three other strains lacking proteins involved in translation: the initiation/recycling factor Hcr1, the ribosomal protein uL5 (encoded by RPL11B gene), or another E3 ligase, Not4, that has been proposed to be important for signaling on ribosomes stalled upstream of disomes (Ikeuchi et al., 2019) (Figure S4C). In all cases, we noted no systematic change in global disome pause scores, suggesting the observed effects are specific to Hel2 and Slh1.
These findings can be explaned by an initial model (Figure 4D and Discussion) where collisions frequently occur within endogenous mRNAs, leading to an unstable disome (or a trisome) intermediate. In WT cells, the disomes and trisomes are stabilized by Hel2, and possibly by other interacting partners, to prevent them from rapidly resuming translation and perhaps to allow time for a slower rescue process. In the absence of an active Hel2, the collision intermediate may be transient and, as reported before (Brandman et al., 2012; Letzring et al., 2013; Matsuo et al., 2017; Matsuo et al., 2020), quickly resumes translation downstream of the stall-inducing motif.
Recognition of disomes does not trigger decay of target mRNAs
Having established that disomes we detected are recognized by Hel2, we next wanted to test whether mRNAs with strong disome peaks are subject to degradation. To test this idea, we assayed for changes in mRNA levels between WT and hel2Δ cells with RNA-seq. Strikingly, we observed that the levels of most mRNAs were unchanged (Spearman r=0.99) (Figure 5A). This result suggests that even though disome enrichment on many transcripts was sensitive to the presence of Hel2, this enrichment was not a strong trigger for mRNA degradation. Similarly, it was recently reported that deletion of HEL2 resulted in no significant change in the abundance of mRNAs that harbor likely stall-inducing motifs (Park and Subramaniam, 2019).
Figure 5: Deletion of Hel2 activates eIF2α phosphorylation.

A. Correlation plot of rpkm values for WT and hel2Δ mRNA-seq data. Each dot represents the data for one gene. The identity of the mRNAs that have fold change greater than 2 is marked in blue.
B. Fold change of hel2Δ/WT RNA-seq rpkm values plotted against the name of the genes. To obtain these genes, False Discovery Rate (FDR, or Padj output of DESeq2) is chosen as <0.05. Top Gcn4 target mRNAs are marked in blue.
C. Expression of GCN4 in monosome profiling data of WT and hel2Δ replicates, illustrating that GCN4 is translationally upregulated in the absence of Hel2. Each dot represents TE (monosome rpkm/RNA-seq rpkm) value of the GCN4 gene in a biological replicate.
D. Western blot showing increased eIF2α phosphorylation in hel2Δ vs WT cells. Expression of WT Hel2 (hel2Δ HEL2) restores phosphorylation levels, whereas mutant Hel2 (hel2Δ hel2-mut) is unable to do so, suggesting that ubiquitination is necessary to prevent phosphorylation. Note that eIF2α levels do not change. H3 (histone protein) serves as a loading control. Molecular weights of the markers (kDa) are indicated. The quantification of the western blot is shown at right. The replicate for this western blot and a separate blot showing the difference between WT and hel2Δ cells without the plasmids is shown in Figure S5A.
See also Figure S5.
Curiously, we noticed that 14 out of 19 transcripts that were significantly upregulated in hel2Δ cells correspond to a group of mRNAs that are under control of the Gcn4 transcription factor (Figure 5B and Supplementary Table S4, analyzed by DESeq2). The GCN4 gene is translationally activated, leading to increased TE, in response to cellular stress, such as amino acid starvation (Hinnebusch, 2005). Higher levels of Gcn4 protein upregulate genes that are part of the integrated stress response (ISR) (Rawal et al., 2018). Our monosome profiling data showed that the TE of GCN4 was upregulated in hel2Δ cells (Figure 5C), consistent with the observation that loss of Hel2 modestly activates Gcn4 targets. GCN4 is usually activated when eIF2α is phosphorylated by the Gcn2 protein kinase (Dever et al., 1992). To test whether hel2Δ upregulates GCN4 translation via eIF2α phosphorylation, we checked the levels of phosphorylated eIF2α in WT and hel2Δ cells. We found that eIF2α phosphorylation increased, suggesting that the ISR is somewhat activated when Hel2 is not present (Figure S5A). Consistent with this, expression of HEL2 in the hel2Δ background restored basal levels of eIF2α phosphorylation (Figure 5D). As in the knockout, expression of the mutant Hel2, which cannot ubiquitinate ribosomal proteins or stabilize disomes (Figure S4B), also induced eIF2α phosphorylation at levels similar to those in hel2Δ cells (Figures 5D and S5A). These results suggest that eIF2α phosphorylation may occur when a functional Hel2 is not present to recognize disomes, raising the possibility that the “Gcn” and RQC pathways are linked. Consistent with this idea, mass spectrometry data show that Hel2 strongly interacts with Gcn2, as well as Gcn1 and Gcn20 (Sitron et al., 2017) (Figure S5B), two other proteins that bind Gcn2 and promote its kinase activity (Garcia-Barrio et al., 2000; Hinnebusch, 2005).
Early sucrose gradient experiments hinted that the Gcn pathway could detect ribosome collisions by showing Gcn1 and Gcn20 are present in disome fractions (Marton et al., 1997). More recent studies have also concluded that a stalled ribosome can activate Gcn2, either alone or as part of a “Gcn complex” including Gcn2, Gcn1 and Gcn20 (Garcia-Barrio et al., 2000; Harding et al., 2019; Inglis et al., 2019; Ishimura et al., 2016; Visweswaraiah et al., 2012). It is conceivable that the absence of Hel2 increases the number of transient collisions that can be detected by the Gcn complex, leading to increased eIF2α phosphorylation. If such competition between these pathways exists, then we might also expect Hel2 to recognize collisions that are primarily handled by the Gcn pathway, such as those induced by 3-AT. Indeed, using mass spectrometry, we found that disomes isolated from 3-AT treated cells have ~7-fold higher ubiquitination of the K212 residue of the uS3 ribosomal protein, a known Hel2 target (Figures S5C and S5D) (Matsuo et al., 2017; Simms et al., 2017). In the absence of Hel2, we detected the ubiquitinated uS3 fragment at very low levels, as expected (Figure S5D, top panel), while levels of non-ubiquitinated uS3 and other disome-associated proteins were similar between WT, hel2Δ and WT+3-AT samples (Figure S5D, bottom panel and Supplementary Tables S5 and S6). These results imply that the RQC and Gcn pathways share and possibly compete for collided ribosome substrates (Figure S5E and Discussion).
Disomes could mediate co-translational events
Since disomes did not appear to trigger RNA decay yet were recognized by multiple surveillance pathways, we wondered whether disomes on endogenous mRNAs may serve functional roles instead of signaling aberrant translation. Indeed, we found evidence of disome formation at sites where translation arrest was previously shown to be important for function. For example, we identified a strong disome peak corresponding to a programmed translation arrest event in the regulatory uORF of the CPA1 gene (Wang et al., 1999) (Figure S6A). Similarly, we observed disome formation on the OAZ1 ORF, which contains a +1 programmed ribosomal frameshift (PRF) site that is favored under high polyamine levels present in our media (Palanimurugan et al., 2004) (Figure S6B). Interestingly, disome accumulation was even more apparent in hcr1Δ cells where termination may be slow (Beznoskova et al., 2013; Young and Guydosh, 2019) (Figure S6B, note the scale differences), suggesting disome formation may result from particularly slow termination that is thought to be key to the frameshift. This observation suggests that our disome data may offer a useful tool for detection of slow translation events associated with PRF events at stop codons. Although a second stalling site towards the 3’ region of the OAZ1 ORF was proposed (Kurian et al., 2011), we did not observe disomes in that region.
We then looked for enrichment of disome reads on other known frameshift genes, including EST3 and ABP140 (Atkins et al., 2016). We observed peaks at the +1 PRF site in EST3 and, indicative of longer ribosome queues, further upstream as well (Figure S6B). Interestingly, data from the +1 PRF site in ABP140 revealed the main collision event 30 nt upstream of the PRF, particularly in hcr1Δ cells (Figure S6B). This peak likely represents a disome within an extended queue of ribosomes. We also noted disome accumulation events even further upstream and downstream of the PRF site, suggestive of additional functional stalling events. We further looked at the −1 PRF encoded in the L-A virus RNA (Dinman et al., 1991; Wickner et al., 2013), which was present in our cells, but did not observe localized peaks of disome occupancy near the PRF (Figure S6C). This suggests that localized disome build-up does not occur at all PRFs.
It has been shown that ribosome pausing can be an important factor in modulating co-translational processes (Collart and Weiss, 2019). One possible role of ribosome stalling is proper co-translational processing of ubiquitin peptides (Baker et al., 1992; Grou et al., 2015; Reyes-Turcu and Wilkinson, 2009). Ubiquitin in yeast is coded as a fusion with the ribosomal protein eL40 (RPL40A and RPL40B) or as a tandem array of five fused copies encoded by the pro-ubiquitin gene (UBI4). It has been proposed that individual ubiquitin peptides are co-translationally cleaved from the pro-ubiquitin protein (Baker et al., 1992; Reyes-Turcu and Wilkinson, 2009). Strikingly, we observed that disome profiling data of the UBI4 gene exhibited periodic peaks positioned at proline-rich motifs downstream of the junction between each copy of ubiquitin (Figure 6A). Since the disome peaks were located ~126–129 nt (42–43 amino acids) downstream of the known ubiquitin cleavage sites, these disomes would form exactly when the ubiquitin nascent peptide fully emerged from the (~40 aa) ribosomal exit tunnel. We observed a similar peak at the same distance downstream of the ubiquitin ORFs in RPL40A and RPL40B (Figure 6B). These observed disomes could conceivably facilitate the proposed co-translational processing mechanism. Overall, these observations illustrate the power of disome profiling as a tool to capture underexplored, potentially functional stalling events involved in recoding and co-translational processing.
Figure 6: Disome profiling shows a unique stalling event in ubiquitin coding genes.

A. Monosome (gray, top) and disome (red, bottom) profiles of the UBI4 gene, which encodes the pro-ubiquitin peptide. Pro-ubiquitin is shown as a bar and the ubiquitin cleavage sites are indicated by dashed lines. Disome peaks at PPD motifs are periodically present downstream of the cleavage sites. Stalling places the cleavage site just outside the peptide exit tunnel, suggesting these sites may be functionally important.
B. Monosome (gray, top) and disome (red, bottom) profiles of RPL40A and RPL40B genes, which both code for translationally fused ubiquitin and eL40 protein. Ubiquitin cleavage sites are shown with dashed lines. Disome peaks at the indicated motifs could be important for co-translational processing of ubiquitin from its fusion with eL40.
See also Figure S6.
DISCUSSION
Building off our previous work (Guydosh and Green, 2014), we carried out enhanced disome profiling and trisome profiling, which detected widespread formation of ribosome collisions on endogenous mRNAs across the transcriptome. We further showed that disomes, in general, can be recognized by both the RQC (sensed by Hel2) and ISR (sensed by Gcn2) surveillance pathways. However, collision-associated mRNAs appear to escape degradation. These data imply that Hel2 recognition may not always result in further activation of the RQC pathway, perhaps facilitating functional outcomes for the nascent protein.
In yeast, the structure of the disome was shown to encompass ~60 nt (Ikeuchi et al., 2019). Given our observation of distinct disome populations (Figure 1), we predict that the disome unit includes a variable interface between ribosomes that allows sampling of compact (58 nt) and relaxed (61 nt) conformations. Consistent with this model, three major trisome footprint sizes of 88, 91 and 94 nt were observed. These presumably arise from compact + compact, compact + relaxed (or relaxed + compact), and relaxed + relaxed interfaces, respectively (Figure 1B). A recent cryo-EM structure of a trisome revealed differences in the two monosome-monosome interfaces, consistent with the view that multiple interfaces change the size of the disome footprint (Matsuo et al., 2020). Interestingly, 61 nt disome footprints were abolished when severe stalling was induced by either ANS or 3-AT (Figures S2A and S2B), perhaps allowing time for a more compact interface to form between the ribosomes. Our data from an hcr1Δ strain also revealed an unusual disome species formed by a translating ribosome and a post-termination “scanning” ribosome that appears to move into the 3’UTR (Figure 2B). Our findings therefore offer new insights on how efficient ribosome recycling is critical to prevent this non-canonical, disome-mediated process that leads to 3’UTR translation.
Our data also allow us to consider how the frequency of disome formation is affected by the kinetics of translation. One prediction that emerges from models of translation (Juszkiewicz et al., 2018) is that increased rates of initiation lead to a higher density of ribosomes along transcripts and therefore a higher probability that ribosomes will collide with each other (Figure S3A). Ribosomes collide (forming a disome) whenever the leading ribosome does not elongate fast enough through the “inter-ribosomal distance” (IRD), which depends on the initiation and average elongation rates. For an IRD of ~60 aa, thought to be true in mammalian cells (Ingolia et al., 2011; Juszkiewicz et al., 2018) and in yeast (Shah et al., 2013), a slowdown > 5-fold by the leading ribosome was predicted to cause formation of disomes (Juszkiewicz et al., 2018). In yeast where elongation, though highly variable, is estimated to average ~9 aa/sec (Shah et al., 2013; Sharma et al., 2019), a local elongation rate of 1–2 aa/sec should be sufficient to form disomes. Once formed, a remaining question is how long disomes persist. Our observation of widespread trisome accumulation (Figure S4B, disome versus trisome average pause scores) offers an opportunity to answer this question. We can assume that disomes will remain unresolved for at least the length of time it takes a monosome to traverse the IRD, collide with a disome, and thereby form a trisome. With the foregoing estimates of IRD and elongation rate, we would predict disomes persist for at least 6–7 seconds, the time to translate 60 aa. Our evidence that tetrasomes can form at stop codons (Figure 1C) suggests this time is longer in some cases.
We also directly examined the prediction that ribosome collision and TE should be correlated. While data from reporter experiments on individual mRNAs are consistent with this hypothesis (Park and Subramaniam, 2019; Simms et al., 2017), we were surprised to not observe this correlation globally. This lack of correlation could be explained by a number of hypotheses (Figure S3A). It could be that initiation rates do not sufficiently vary to have a measurable effect on TE and therefore the rate of collisions. There could also be a feedback system whereby disome recognition by Hel2 directly reduces local initiation in real time. For example, ZNF598 (mammalian homolog of Hel2) was found to be associated with the cap-binding protein 4E-HP (Hickey et al., 2019; Morita et al., 2012; Tollenaere et al., 2019).This association offers a mechanism whereby disome recognition by Hel2/ZNF598 would lead to rapid local inhibition of initiation. Alternatively, it has been proposed that transcripts with high TEs are evolutionarily tuned to avoid slow codons that lead to disome formation (Park and Subramaniam, 2019). It is also conceivable that the formation of a disome could reduce the observed abundance of monosome footprints (and therefore the TE metric) within the coding sequence of highly translated genes. This technical limitation would result in a non-linear relationship between TE and ribosome loading, and scramble any correlation. These possibilities represent fertile ground for future investigation.
Our study also examined the possible role of RQC on endogenous mRNAs. The role of Hel2 in inducing the RQC pathway has been exemplified in many studies using reporter genes that encode non-physiological amino acid sequences known to induce strong ribosome arrest, such as poly-Lys or poly-Arg. In contrast, endogenous stalling events, induced by less extreme stalling motifs, have been theorized to circumvent the action of the RQC machinery (Simms et al., 2017). It has also been suggested that stochastic ribosome collisions could be targeted by the RQC machinery at the small cost of preventing the risk of aberrant translation (Juszkiewicz et al., 2018). Our data show that disome formation generally occurs on known stall-inducing sequences and that these endogenous disomes are sensitive to the presence of Hel2, as evidenced by a decrease in disome accumulation at these sites in the hel2Δ strain.
We considered several explanations for the decrease in disome formation when HEL2 is deleted. One possibility is that disomes are normally rescued by the RQC pathway and the loss of this rescue process leads to the formation of higher order collisions. These structures could reduce the number disome footprints obtained by our method. In particular, this was proposed to be true on endogenous genes with severe stalling events, such as SDD1 and RQC1, genes that are too poorly expressed to be visible in our datasets (Brandman et al., 2012; Matsuo et al., 2020). While we cannot rule out this model completely, several pieces of evidence suggest it may not apply to all disomes. Our observation that trisome footprints decrease in the hel2Δ strain (Figure S4B) suggests that higher order collisions do not increase for most substrates. It has been also shown that loss of HEL2 allows ribosomes to bypass severe stalling sites on reporter genes, an observation that seems counterintuitive if severe ribosome queueing (formation of tetrasomes and higher order structures) were also occuring.
Another possible model to explain the data is that ISR activation in the absence of Hel2 (Figure 5) reduces ribosome loading on mRNAs, leading to decreased disome formation. However, since other mutants that should also influence ribosome loading did not affect overall disome peaks (Figure S4C), this scenario seems somewhat less likely. Further experimentation under conditions where the ISR is inactive should offer further insight on this model. Another, non-mutally exclusive, explanation is that ubiquitination of disomes by Hel2 leads to stabilization of transiently-formed disome “encounter complexes” (Figure 4D). Without this stabilization, we predict these encounter complexes rapidly resume translation, in agreement with reporter assays (Juszkiewicz and Hegde, 2017; Matsuo et al., 2017; Matsuo et al., 2020). Although these stabilization events did not appear to trigger widespread mRNA degradation (Figure 5A), it is possible that a minor fraction of mRNAs with persistent disomes may be targeted for decay and such trends may not be detectable by RNA-seq experiments. Alternatively, initial stabilization of disomes may be followed by further steps (beyond ubiquitination) that are required before committing to mRNA degradation.
One possible mechanism to arbitrate disome fate after initial detection is the activity of the deubiquitinase Ubp3 (Jung et al., 2017; Matsuo et al., 2017), which could remove the ubiquitin that is initially added by Hel2. Although we detected steady-state Hel2-mediated uS3 ubiquitination in WT cells (Figure S5D), we were unable to detect uS10 ubiquitination, presumably due to lower abundance of uS10 compared to uS3 or variable levels of ubiquitination at these sites due to hierarchical targeting (Garshott et al., 2020). Curiously, disome formation was not completely abolished upon loss of Hel2 (Figure 4) and the ubiquitinated uS3 can be still detected at low levels on disomes in hel2Δ cells (Figure S5D), suggesting that other ubiquitin ligases or translation factors may contribute to disome stabilization. Indeed, deletion of Slh1 resulted in modest decrease in disome pause scores (Figure S4C). This suggests that Slh1, while shown to promote ribosome recycling on a severe stalling event in vitro (Matsuo et al., 2020), may have a more complex role for many substrates in the cell.
Our results together with previous findings suggest a possible connection with the “Gcn” pathway and the ISR (Figures 5 and S5). Previous studies have proposed that ribosome stalling activates Gcn2 (Garcia-Barrio et al., 2000; Harding et al., 2019; Inglis et al., 2019; Ishimura et al., 2016; Visweswaraiah et al., 2012) and it is therefore possible that the Gcn complex may also recognize disome encounter complexes (Figure S5E, left scheme). This model posits that if encounter complexes are not recognized in some way by Hel2, they can be instead sensed by the Gcn pathway, leading to increased eIF2α phosphorylation (Figure S5E, middle scheme). In WT cells, the RQC system may therefore prevent chronic ISR activation induced by disome encounter complexes. During His starvation induced by 3-AT, Hel2 recognition may be insufficient to prevent ISR activation due to the severity of stalling induced by the lack of His-tRNAHis. Therefore, nutrient starvation could activate both Hel2 and Gcn pathways, leading to upregulation of both ubiquitination by Hel2 and increased eIF2α phosphorylation by Gcn complex (Figure S5E, right scheme). Our disome and trisome profiling methodology will be a suitable platform to further investigate what determines whether a given disome would be targeted to the Gcn-mediated ISR or the Hel2-mediated RQC pathway. It is conceivable that the activity of other RQT proteins, such as Cue3 and Rqt4, as well as Gcn1, Gcn2 and Gcn20, may have important roles.
While our results suggest most endogenous disome events do not lead to later steps in the RQC pathway, our data offer clues as to the potential functional roles of disomes (Figure S6). It has been shown that the RQC pathway (including NGD) senses collisions to prevent frameshifting at inhibitory sequences, whereas PRF events were found to be collision-independent (Simms et al., 2019; Wolf and Grayhack, 2015). On the other hand, a recent report suggested that collision rates in bacteria could affect PRF efficiency (Smith et al., 2019). Our data suggest disome formation occurs as part of some frameshifting events and therefore opens the door to future study of their possible functional role. We also observed disomes at sites that can potentially mediate co-translational processing of ubiquitin precursors into individual ubiquitin peptides. Such regulation could be important for ensuring complete cleavage of ubiquitin subunits and avoiding potential degradation of the pro-ubiquitin peptide through the ubiquitin fusion degradation pathway (Johnson et al., 1995). The idea that translation of the pro-ubiquitin gene leads to the formation of disomes, that are themselves ubiquitinated, offers an intriguing feedback mechanism for ubiquitin production.
We look forward to using the disome profiling technique in other organisms to study various questions about translational stalling and its role in the cell. Indeed, recent studies have utilized the disome profiling in yeast, mouse and human cells (Arpat et al., 2019; Han et al., 2019; Han et al., 2020; Tuck et al., 2020; Zhao et al., 2019) and ribosome stalling has been shown to be regulated by the RNA binding protein FMRP that is known to be critical for neuronal development (Darnell et al., 2011; Das Sharma et al., 2019; Shah et al., 2020). Future disome profiling experiments can therefore be used to explore how dysregulated disome formation leads to disease phenotypes.
STAR METHODS
RESOURCE AVAILABILITY
Lead Contact
Further information and requests for resources and reagents should be directed to and will be fulfilled by the Lead Contact, Nicholas R. Guydosh (nicholas.guydosh@nih.gov).
Materials Availability
This study did not generate new unique reagents.
Data and Code Availability
Demultiplexed raw sequencing files as well as processed data are deposited in the NCBI GEO database with the accession number: GSE139036. Custom scripts are posted on Github: https://github.com/guydoshlab/Yeastcode1.
EXPERIMENTAL MODEL AND SUBJECT DETAILS
Derivatives of the S. cerevisiae BY4741 strain were used for the experiments presented. The list of yeast strains used in this study is indicated in Table S1. The BY4741 WT and hel2Δ His3+ strain were generated by amplifying the HIS3 gene and transforming this PCR fragment to chemically competent BY4741 WT or hel2Δ cells. Transformants were selected on Synthetic Complete (SC)-His plates and successful knock-in was confirmed by PCR. The primers that were used for amplification of HIS3 and the confirmation of the knock-in are listed in Table S2. To generate YCplac33-HEL2 plasmids, YCplac33 plasmid carrying the URA3 marker was first digested with EcoRI and HindIII. Then, the HEL2 ORF was amplified from WT BY4741 cells, including its native 5’ and 3’UTRs with transcriptional promoter and terminator, using the primers listed in Table S2. The HEL2 ORF was assembled with digested YCplac33 backbone using NEBuilder HiFi DNA Assembly Cloning Kit (NEB; E5520). To generate YCplac33-hel2-mut plasmids, site directed mutagenesis was conducted using the primers listed in Table S2 and Q5 Site-Directed Mutagenesis Kit (NEB; E0554S). The DNA assembly and site-directed mutagenesis reactions were transformed into NEB 5-alpha Competent E. coli cells (NEB; C2987). Successful clones were selected on LB (Luria Broth)/Amp100 plates and the plasmids isolated from these clones were verified by Sanger sequencing. Empty plasmids and the plasmids expressing WT or mutant HEL2 were then transformed into competent BY4741 WT and hel2Δ cells. The successful yeast clones were selected on SC-Ura plates and re-streaked on SC-Ura prior to downstream processes.
Most of the yeast strains were grown in YPD media at 30°C. For 3-AT experiments, cells were grown in SC-His. For convenience, we also used WT and hel2Δ His3+ cells (grown in SC-His media) for trisome and matching disome profiling experiments. Mass spectrometry experiments were also conducted using these strains. The yeast carrying YCplac33 plasmids were grown in SC-Ura media. After overnight growth, cultures were diluted into 750 mL fresh media to an OD600 of ~0.02 and were grown to a final OD600 between 0.6 and 0.7, filtered and frozen in liquid nitrogen. For the 3-AT experiments, WT His3+ cells were grown in SC-His medium until OD600 of ~0.5 and then 500 mM 3-AT (Sigma; A8056) stock prepared in water was added to reach a final concentration of 45 mM. In parallel, WT His3+ cells were grown and treated with the same volume of water as a mock control. Both mock-treated and 3-AT treated cultures were grown for an additional 30 minutes and then harvested.
METHOD DETAILS
Ribosome profiling
Ribosome (monosome), disome and trisome profiling were performed based on published protocols (Guydosh and Green, 2014; McGlincy and Ingolia, 2017), with some modifications and optimizations. Frozen cell pellets mixed with frozen droplets of lysis buffer (20 mM Tris pH 8.0, 140 mM KCl, 1.5 mM MgCl2, 1% Triton X-100 and 0.1 mg/mL cycloheximide [Sigma; C7698]) were lysed using a Retsch Cryomill (Retsch 20.749.0001). Powdered frozen cells were thawed at room temperature, transferred to a 50 mL falcon tube and spun at 3000 g for 5 min at 4°C. The supernatant was then transferred to a 1.5 mL microtube and spun at full speed for 10 min at 4°C. The absorbance of the lysate at 260 nm was recorded and total “OD” of the lysate was calculated as the product of the volume (in mL) and A260 reading. A fraction of the lysate equivalent to OD=40–50 was flash frozen in liquid nitrogen and kept at −80°C.
Prior to RNase I digestion, lysates were thawed, diluted with an equal volume of lysis buffer and then digested with ~26 U of RNase I (Ambion; AM2294) per OD for 1 h at room temperature (22°C) with gentle agitation (700 rpm). Monosomes, disomes and trisomes were separated by loading the lysates onto a 10%−50% sucrose gradient, prepared in gradient buffer (final concentration: 20 mM Tris pH 8.0, 150 mM KCl, 5 mM MgCl2, 0.5 mM DTT), and spun at 40,000 rpm for 3 hours at 4°C using SW 41 Ti Swinging-Bucket Rotor (Beckman Coulter). Sucrose gradient fractionation was performed by using a Brandel Density Gradient Fractionation System. The peaks corresponding to monosomes, disomes and trisomes were collected, flash-frozen in liquid nitrogen and kept at −80°C until the next step. RNA was separately purified from monosome, disome and trisome fractions using the SDS, hot acid phenol-chloroform extraction method and run on a 15% TBE-Urea polyacrylamide gel (Bio-Rad; 3450091) for the size selection process. For trisome profiling, RNAs extracted from two trisome fractions of the same lysate were pooled to increase the yield. The RNA size markers used for size selection are listed in Table S2. For the monosome profiling, RNAs between 25–34 nt were excised from the gel. For disome profiling of WT and hel2Δ replicates, we selected footprints between 40–80 nt initially. Since we found disome footprints were primarily between 57 and 63 nt, for subsequent experiments (involving the samples from not4Δ, hcr1Δ, rpl11BΔ and the strains carrying YCplac33 plasmid derivatives) 54 and 68 nt markers were used for size selection. For samples from 3-AT/mock treated WT His3+ cells as well as ANS-treated cells, footprints between 40 and 68 nt were selected. For trisome profiling experiments, we selected footprints between 80 and 100 nt, using our 80-nt marker (Table S2) and 100-nt band from a small RNA marker (Abnova; R0007), respectively. The excised gel was frozen on dry ice for 30 minutes and thawed in RNA extraction buffer (0.3 M NaOAc, 1 mM EDTA, 0.25% SDS) overnight at 20°C with gentle agitation (700 rpm). In the morning, RNA was precipitated and the pellet was resuspended in 10 mM Tris pH 8.
Ribosome footprint library construction
The monosome, disome and trisome RNA fragments were first dephosphorylated using PNK (NEB; M0201L) and ligated to preadenylated linkers listed in Table S2. These linkers contain a 5 nt-long random Unique Molecular Index (‘UMI’) and a 5 nt barcode that is unique for each sample. The linkers, which were pre-adenylated using a 5’ DNA adenylation mix (NEB; E2610L), were then ligated to dephosphorylated RNAs using T4 truncated RNA ligase 2 (K227Q) (NEB; M0351L). Unligated linkers were depleted by using 5 U per sample of 5’ deadenylase (NEB; M0331S) and RecJ exonuclease (Biosearch Technologies; RJ411250). Ligated RNA samples with unique barcodes were pooled and cleaned up using the Oligo Clean & Concentrator kit (Zymo Research; D4060). For disome profiling samples, ribosomal RNA removal was then performed by using Ribo-Zero Gold rRNA Removal kit (Yeast) (Illumina; MRZY1306). Ribosomal RNA removals from some disome profiling samples (SM042Fd, SM043Fd, SM044Fd, SM045Fd) and trisome profiling samples (SM036Ft, SM038Ft) were performed using Qiagen FastSelect kit (catalog number pending) for yeast. All samples were next reverse transcribed using Superscript III (Invitrogen; 18080044), and the reverse transcription primer (NI-802, listed in Table S2), which contains a random 2 nt UMI. The cDNAs obtained from this reaction were resolved on a 10% TBE-Urea gel (Bio-Rad; 3450089) and cDNAs were extracted using DNA gel extraction buffer (0.3 M NaCl, 1 mM EDTA, 10 mM Tris pH 8) with gentle overnight agitation (700 rpm) at 20°C. The next morning, DNA was precipitated and the pellet was resuspended in 10 mM Tris pH 8. The footprints were circularized using CircLigase ssDNA Ligase (Biosearch Technologies; CL4115K). For monosome footprints, ribosomal RNA removal was performed at this stage by oligonucleotide substraction using Dynabeads MyOne Streptavidin C1 (Invitrogen; 65001) and DNA oligos that are the reverse complement of ribosomal RNAs (listed in Table S2). Monosome, disome and trisome pools were separately amplified by PCR using Phusion DNA Polymerase (ThermoFisher Scientific; F530L). Quality of the library was assessed by using a BioAnalyzer via the High Sensitivity DNA Kit (Agilent; 5067–4626). Sequencing experiments were performed by the NHLBI DNA Sequencing and Genomics Core at NIH (Bethesda, MD): Sequencing of monosome (single end, 50 bp cycle) and disome (single end, 100 bp cycle) libraries was performed on an Illumina HiSeq3000 machine except sequencing of a set of biological replicates of WT, hel2Δ and slh1Δ (SM023Fd, SM024Fd and SM025Fd samples) that was performed on an Illumina HiSeq2500 machine (single end, 100 bp cycle) and the samples from strains carrying YCplac33 derivatives (SM042Fd, SM043Fd, SM044Fd, SM045Fd) that were sequenced on an Illumina NovaSeq machine (single end, 100 bp cycle). The trisome library was sequenced by using an Illumina NovaSeq machine (single end, 300 bp cycle mode), where the sequencing was stopped after 150 cycles.
RNA-seq
Total RNA was isolated from two biological replicates of WT and hel2Δ cells using the SDS, hot acid phenol-chloroform extraction method. RNA-seq libraries from these samples were constructed by the NHLBI DNA Sequencing and Genomics Core at NIH (Bethesda, MD) using Illumina TruSeq stranded ribozero kits. The mRNAs were sequenced on a HiSeq3000 machine (single end, 50 bp cycle).
Computational processing of ribosome profiling reads
Sequencing data was processed as described previously (McGlincy and Ingolia, 2017). Briefly, the fastq files of disome and monosome profiling data, which were provided by the NHLBI DNA Sequencing and Genomics Core (NIH), were trimmed to remove linkers and demultiplexed to isolate individual samples from pooled data using CUTADAPT (Martin, 2011). To remove tRNA and rRNA reads, the files were aligned to an index of noncoding RNAs with BOWTIE (version 1.1.2) (Langmead et al., 2009) using the following parameters: -v 2 -y. PCR duplicates were removed from resulting files using a custom python script. The fastq files from the deduplication step were then aligned to coding regions and splice junctions using the following parameters: -v 2 -y -a -m 1 --best --strata (2 mismatches allowed and multiple allignments suppressed) and using the R64–1-1 S288C reference genome assembly (SacCer3, Saccharomyces Genome Database Project).
For the RNA-seq data, fastq files that were provided by the sequencing core were directly mapped to tRNA and rRNA with BOWTIE. Unaligned reads were then mapped to coding regions and splice junctions using the same parameters described above.
The number of reads that were obtained after each step is provided in Table S3.
Computational analysis of processed files
Biopython version 1.73 was used for all the analyses. Unless noted otherwise, biological replicates were pooled. Dubious ORFs and overlapping genes were excluded from the analysis. Published 5’ and 3’UTR annotations (Nagalakshmi et al., 2008) were used to estimate UTR regions.
The footprint length distribution was obtained by using FastQC, version 0.11.7 (Babraham Bioinformatics). The read length distribution was created from the fastq files that mapped to coding regions and splice junctions. For monosome data, only the reads between 25 and 34 nt were analyzed. All read size ranges given are inclusive of end values. For the disome data, analysis was conducted using reads between 57 and 63 nt, except for the WT+ANS sample (SM040Fd), the reads between 47 and 63 are chosen due to higher abundance of footprints <57 nt. For the trisome data, the reads between 87 and 96 nt were analyzed. Both 5’ and 3’ alignments of the footprints were generated but 3’ alignment was used for most analysis, as described in the text. Ribosome reads were first normalized in units of rpm (reads per million mapped reads). Rpm was computed by dividing the read count at each nt position by the total number of mapped reads and then multiplying it by 106.
Quantitation of ribosome profiling data was performed by adding together the total number of normalized reads mapping to each coding sequence or UTR region. 3’ UTRs were extended 25 nt downstream of their annotated ends to include rare isoforms that may be longer. These totals were then normalized by a gene’s length (by dividing by the length in kilobases) to obtain rpkm values. Reads were shifted by 13 nt from their 5’ ends to map to the center of the P-site. For disome reads, this length corresponds to P site of the trailing ribosome. Quantitation of RNA-Seq data counted 5’ ends that mapped without a shift to annotated ORF regions. Data from ±15 nt of either end of the ORFs was eliminated to reduce effects due to initiation and termination.
Metagene plots were constructed by averaging rpm around the start and stop codons of each gene in a defined window (100 nt upstream of the ORF and 300 nt into the ORF for start codons; 300 nt of ORF and 100 nt downstream of the ORF for stop codons). ORFs that were marked as dubious (including those annotated as such and YOR186W, YGL033W, YJR120W and YHR215W), those that were unidirectionally overlapping with other ORFs, the genes with features smaller than the window size and those without any mapped reads were excluded from the analysis. In addition, the gene YPR132W was eliminated from the analysis of all WT disome data replicates due to a very strong peak on a KEK motif that dominated that average and obscured global trends of interest.
Footprint average plots around a particular motif were generated by first creating a list of occurrences of a motif of interest in the yeast transcriptome and then averaging normalized monosome or disome density from a region around the motif of interest (50 nt upstream and 50 nt downstream of the motif). The averaging was done after first normalizing the rpm at each position in the region to the total rpm in the region so that all occurences would be weighted equally in the average. The plots therefore show the average fraction of rpm values at each position within the window (normalized reads).
Average pause scores were computed by dividing the value of the peak of the footprint average plot (described above) by the average value over the window. Individual pause scores were computed for the box plot analysis in the same way by using data across the gene where the motif is found. Pause scores were only computed if the full ±50 nt window was covered by data. In addition, the final 31 nt of ORFs were not considered due to ribosome queuing artifacts. We excluded the motifs that were represented in the genome less than 100 times to reduce noise in the analysis, resulting in 6267 motifs that were compared across datasets.
The significance of differences in the median of individual pause scores (Figure S4A) was assessed by comparing blox plots and computing the independent 2-group Mann Whitney U Test in Rstudio.
To compute significant changes in mRNA expression, first the raw counts per gene was generated each for two replicates of WT and hel2Δ. Then these values were compared by DESeq2 (Love et al., 2014) in Rstudio and Padj values were obtained. Padj<0.05 was used as a significance cut-off. Consensus Gcn4-target mRNAs are primarily obtained from a published ChIP-seq dataset (Rawal et al., 2018). The first 250 genes that showed > 2-fold increase in Rpb3 (RNA polymerase B) occupancy in starved cells, which also had evidence of reproducible induction by Gcn4 in other datasets (Natarajan et al., 2001; Qiu et al., 2016; Saint et al., 2014), were considered as genuine Gcn4 target mRNAs. Data plotted for RNA-seq is shown as the average of two replicates.
Western blotting
Crude yeast extracts were prepared from 25 mL of yeast cells grown to logarithmic phase (OD~0.5–0.6) by TCA precipitation based on published methods (Reid and Schatz, 1982). 10 μL samples were resolved on a 4–12% Bis-Tris Plus gel (Invitrogen; NW04125) (For Figure S5A, top gel) or 5–10 μL were loaded on 4–20% Mini-Protean TGX gel (Biorad; 4561096) (For Figures 5D and S5A, bottom gel) and transferred to a PVDF membrane (BioRad; 1704156). The proteins were detected using antibodies against eIF2α-phospho (Abcam; 32157) and H3 (Abcam; 1791). The antibody against yeast eIF2α was kindly provided by the laboratory of Thomas Dever (NIH/NICHD). Western blotting of two biological replicates was performed to ensure the result was reproducible. Quantification of the western blot in Figure 5 was conducted by using ImageJ software. The values in the figure are obtained by dividing eIF2α-P intensity by eIF2α intensity.
Preparation of samples for mass spectrometry
For the mass spectrometry (MS) experiments, WT or hel2Δ His3+ cells were grown in SC-His media at 30°C. After overnight growth, cultures were diluted into 750 mL fresh media to reach OD600 of ~0.02. When cultures reached OD600 of 0.5, either water (mock treatment, both WT and hel2Δ) or 3-AT (Sigma; A8056, final concentration of 45 mM, only to WT cells) was added. The cultures were grown for additional 30 minutes. Lysis of these cells and sucrose gradient were conducted as described for ribosome profiling experiments, except an amount of the lysate, equivalent to OD (A260 × mL) ~100, was used for RNase digestion to obtain sufficient yield of proteins. The disome fraction was then isolated for protein extraction. Proteins associated with disomes were extracted by first diluting the disome sucrose gradient fraction with an equal volume of water and then doubling the volume by adding 100% ice-cold ethanol. The proteins were precipitated overnight at −20°C. Next day, the samples were centrifuged at full speed for 30 minutes at 4°C in a benchtop microcentrifuge. The protein pellet was resuspended in 8 M Urea in Triethylammonium bicarbonate (TEAB) buffer, pH 8.5. The protein concentration in samples was calculated by using a Pierce BCA Protein Assay Kit (ThermoFisher; 23225). To the dissolved protein (~20 μg), fresh DTT (100 mM stock) was added to reach a final concentration of 5 mM and incubated for 45 minutes for disulfide reduction. The samples were then alkylated using iodoacetamide (100 mM stock), which was added to a final concentration of 14 mM and incubated for 45 minutes. Then, to dilute 8 M Urea to <1 M, 25 mM TEAB was added. Proteins were digested using Trypsin (1 μg/μL stock), using 1 μg Trypsin per 12.5 μg of protein, overnight at 37°C. Next day, the samples were acidified by addition of 4 μL 100% formic acid and processed through ZipTip (Milipore; ZTC18S096) to clean up and concentrate the samples as described in the manufacturer’s instructions.
Liquid Chromatography–Tandem Mass Spectrometry (LC-MS/MS)
MS experiments were conducted by the NHLBI Proteomics Core at NIH (Bethesda, MD). Protein identification by LC-MS/MS was performed using an Orbitrap Fusion Lumos Tribid mass spectrometer (ThermoFisher; IQLAAEGAAPFADBMBHQ) interfaced with an Ultimate 3000 Nano-HPLC apparatus (ThermoFisher; ULTIM3000RSLCNANO). Peptides were fractionated by EASY-Spray PepMAP RPLC C18 column (2 μm, 100A, 75 μm × 500 mm, ThermoFisher; ES803A) using a 120-min linear gradient of 5–35% acetonitrile in 0.1% formic acid at a flow rate of 300 nL/min. The instrument was operated in data-dependent acquisition mode (DDA) using FT mass analyzer for one survey MS scan on selecting precursor ions followed by 3 second data-dependent HCD-MS/MS scans for precursor peptides with 2–7 charged ions above a threshold ion count of 10,000 with normalized collision energy of 37%. Survey scans of peptide precursors from 300 to 2000 m/z were performed at 120k resolution and MS/MS scans were acquired at 50,000 resolution with a mass range m/z 100–2000.
Protein identification and data analysis
All MS and MS/MS raw spectra from each set were processed and searched using Sequest HT algorithm within the Proteome Discoverer 2.2 (PD 2.2 software, ThermoFisher). The settings for precursor mass tolerance was set at 12 ppm, fragment ion mass tolerance to 0.05 Da, trypsin enzyme with 2 miscleavages with carbamidomethylation of cysteine as fixed modifications, and Gly-Gly(lysine), deamidation of glutamine and asparagine, oxidation of methionine as variable modifications. The S. cerevisiae sequence database from Swiss-Prot was used for database search. Identified peptides were filtered for maximum 1% FDR using the Percolator algorithm in PD 2.2 along with additional peptide confidence set to medium. The final lists of protein identification/quantitation were filtered by PD 2.2 with at least 2 unique peptides per protein identified with medium confidence. For the quantitation, label-free approach has been used, where the area under the curve for the precursor ions is used to calculate the relative fold change between different peptide ions.
Targeted Mass Spectrometry
To specifically detect and to better quantify non-ubiquitinated and ubiquitinated Rps3 levels, we used Targeted Selected ion monitoring (tSIM), a mass spectrometry acquisition method in which only a small mass-to-charge range is transmitted to the detector. In this acquisition mode, the mass analyzer is set to filter for particular peptide ions, which is then constantly monitored over the time and its signal is used for quantitation. Data was acquired on the Orbitrap Fusion Lumos Tribid mass spectrometer (ThermoFisher; IQLAAEGAAPFADBMBHQ). A tSIM scheme was used with an MS1 full scan resolution of 120,000 FWHM, with isolation window (m/z) of 20, maximum injection time of 75 ms. A second level of tMS2 (targeted MS2 scans) on selected precursors possible was performed. The scan was performed using 0.7 u isolation window and MS2 scans on targeted precursors were analyzed by Orbitrap at the resolution of 30,000 FWHM, with HCD collision energy setting set at 37% and maximum injection time as 150 ms. The peptide ions to be monitored have been included in the inclusion list for targeted peptides, with its subsequent +3 and +4 charge states for unmodified peptide ([K].ALPDAVTIIEPKEEEPILAPSVK.[D]) and peptide with ubiquitination on lysine ([K].ALPDAVTIIEPKEEEPILAPSVK.[D], 1XGG[K12]). Spectral .raw files from targeted acquisition were analyzed using Skyline software tool. Skyline MS1 filtering displays direct links of selected MS1 peak features to their underlying MS/MS data to ensure proper peak selection and integration, as well as facile raw data file import to an independent format. Typically, the precursor isotopic import filter was set to a count of three, (M, M + 1, and M + 2) at a resolution depending on the instrument platform. After data import, graphical displays of chromatographic traces (extracted ion chromatograms) were manually inspected for proper peak picking of MS1 filtered peptides. In some cases, the peak integration was adjusted manually in the chromatographic window.
QUANTIFICATION AND STATISTICAL ANALYSIS
Metagene and position average plots were generated by Igor Pro 7 (Wavemetrics). Scatter plots were generated on Prism 8. The Spearman R values were extracted from correlation analysis comparing two datasets with 95% confidence interval. To assess significance of pause score at stalling sites (Figures 4 and S4), the p-value was obtained by using the Mann-Whitney U test with the confidence level of 0.95 and boxplots were generated in RStudio. To detect significant changes in mRNA levels, DESEQ2 was used. For most of the figures, replicates of monosome and disome profiling data were pooled. However, while evaluating the effect of mutations, replicates were separately shown to support the conclusions and to display variability of the data.
Supplementary Material
Supplemental Excel Table S4: DEseq analysis of RNA-seq data to determine genes with significant difference between WT and hel2Δ cells. FDR (padj) <0.05 is used as a threshold to define significance. Gcn4-target mRNAs are highlighted in blue. Related to Figure 5.
Supplemental Excel Table S5: MS data showing the abundance of peptides associated with disomes, technical replicate 1. Related to Figure 5.
Supplemental Excel Table S6: MS data showing the abundance of peptides associated with disomes, technical replicate 2. Related to Figure 5.
KEY RESOURCES TABLE.
| REAGENT or RESOURCE | SOURCE | IDENTIFIER |
|---|---|---|
| Antibodies | ||
| Anti-eIF2α | Custom antibody made in the laboratory of Thomas Dever (NIH) | N/A |
| Anti-eIF2α-phospho | Abcam | 32157 |
| Anti-H3 | Abcam | 1791 |
| Bacterial and Virus Strains | ||
| NEB 5-alpha Competent E. coli cells | NEB | C2987 |
| Chemicals, Peptides, and Recombinant Proteins | ||
| Cycloheximide | Sigma-Aldrich | C7698 |
| 3-Amino-1,2,4-triazole (3-AT) | Sigma-Aldrich | A8056 |
| NEBuilder HiFi DNA Assembly Cloning Kit | NEB | E5520 |
| Q5 Site-Directed Mutagenesis Kit | NEB | E0554S |
| RNase I | Ambion | AM2294 |
| Adenylation mix | NEB | E2610 |
| PNK | NEB | M0201L |
| T4 RNA Ligase 2 Truncated, K227Q | NEB | M0351L |
| RecJ exonuclease | Biosearch technologies | RJ411250 |
| 5’ deadenylase | NEB | M0331S |
| Ribo-Zero Gold rRNA Removal Kit | Illumina | MRZY1306 |
| Superscript III Reverse Transcriptase | Invitrogen | 18080044 |
| CircLigase ssDNA ligase | Biosearch technologies | CL4115K |
| Dynabeads MyOne Streptavidin C1 | Invitrogen | 65001 |
| Phusion DNA Polymerase | ThermoFisher Scientific | F530L |
| Critical Commercial Assays | ||
| High Sensitivity DNA Kit | Agilent | 5067-4626 |
| Millipore Ziptips | Milipore | ZTC18S096 |
| Pierce BCA Protein Assay Kit | ThermoFisher Scientific | 23225 |
| Deposited Data | ||
| Raw and processed data, see also Table S3 | This paper | GEO: GSE139036 |
| Raw western blot gel images | This paper, Mendeley data | http://dx.doi.org/10.17632/53frn8z6xt.1 |
| Experimental Models: Organisms/Strains | ||
| See Table S1 | ||
| Oligonucleotides | ||
| See Table S2 | This paper | N/A |
| Recombinant DNA | ||
| N/A | ||
| Software and Algorithms | ||
| Scripts used for the analysis | This paper | https://github.com/guydoshlab/Yeastcode1 |
| Igor Pro 7 | Wavemetrics | 15-500 |
| BOWTIE 1.1.2 | Github | Langmead et al., 2009 |
| Cutadapt | Martin, 2011 | |
| Biopython | Github | https://github.com/biopython/biopython |
| BCbio | Github | https://github.com/chapmanb/bcbio.variation |
| DESEQ2 | Bioconductor | Love et al., 2014 |
| RStudio Version 1.2.5001 | RStudio, Inc., Boston, MA | N/A |
| Prism 8 for macOS, version 8.1.0 | GraphPad Software, Inc. San Diego, California USA | www.graphpad.com |
| Other | ||
| 15%TBE-Urea polyacrylamide gel | Bio-Rad | 3450091 |
| 10% TBE-Urea gel | Bio-Rad | 3450089 |
| 4–12% Bis-Tris Plus gel | Invitrogen | NW04125 |
| 4–20% Mini-Protean TGX gel | Bio-Rad | 4561096 |
| PVDF membrane pack | Bio-Rad | 1704156 |
Highlights.
Disome and trisome profiling in yeast reveal sites of collided ribosomes
Collisions move unrecycled ribosomes into 3’UTRs to reinitiate translation
Hel2 (ZNF598 homolog) maintains the presence of disomes and trisomes
Loss of Hel2 triggers eIF2α phosphorylation and the integrated stress response
ACKNOWLEDGEMENTS
We would like to acknowledge Theresa Marlin, who performed pilot disome profiling experiments in the Guydosh Lab. We are thankful to Sajni Patel and Marjan Gucek (NIH/NHLBI Proteomics Core) for mass spectrometry experiments. We thank to David Young for his assistance with ribosome profiling experiments and for providing some of the strains used in this study. We thank Alan Hinnebusch, Jon Lorsch, Thomas Dever, Reed Wickner, Orna Cohen-Fix and Guydosh Lab members for their feedback on our project. We also thank Alan Hinnebusch and Fan Zhang for providing yeast deletion strains, and Thomas Dever and Sara Young for providing antibodies for western blotting. We thank Yan Luo (NIH/NHLBI DNA Sequencing and Genomics Core) for sequencing experiments and Yousuf Khan for discussions about PRF genes. The work is supported by the Intramural Research Program of the NIH, National Institute of Diabetes and Digestive and Kidney Diseases (NIDDK; DK075132 to N.R.G.).
Footnotes
DECLARATIONS OF INTEREST
The authors declare no competing interests.
Publisher's Disclaimer: This is a PDF file of an unedited manuscript that has been accepted for publication. As a service to our customers we are providing this early version of the manuscript. The manuscript will undergo copyediting, typesetting, and review of the resulting proof before it is published in its final form. Please note that during the production process errors may be discovered which could affect the content, and all legal disclaimers that apply to the journal pertain.
REFERENCES
- Arpat AB, Liechti A, Matos MD, Dreos R, Janich P, and Gatfield D (2019). Transcriptome-wide sites of collided ribosomes reveal principles of translational pausing. bioRxiv, 710061. [DOI] [PMC free article] [PubMed] [Google Scholar]
- Atkins JF, Loughran G, Bhatt PR, Firth AE, and Baranov PV (2016). Ribosomal frameshifting and transcriptional slippage: From genetic steganography and cryptography to adventitious use. Nucleic Acids Res 44, 7007–7078. [DOI] [PMC free article] [PubMed] [Google Scholar]
- Baker RT, Tobias JW, and Varshavsky A (1992). Ubiquitin-specific proteases of Saccharomyces cerevisiae. Cloning of UBP2 and UBP3, and functional analysis of the UBP gene family. J Biol Chem 267, 23364–23375. [PubMed] [Google Scholar]
- Bengtson MH, and Joazeiro CA (2010). Role of a ribosome-associated E3 ubiquitin ligase in protein quality control. Nature 467, 470–473. [DOI] [PMC free article] [PubMed] [Google Scholar]
- Beznoskova P, Cuchalova L, Wagner S, Shoemaker CJ, Gunisova S, von der Haar T, and Valasek LS (2013). Translation initiation factors eIF3 and HCR1 control translation termination and stop codon read-through in yeast cells. PLoS Genet 9, e1003962. [DOI] [PMC free article] [PubMed] [Google Scholar]
- Brandman O, and Hegde RS (2016). Ribosome-associated protein quality control. Nat Struct Mol Biol 23, 7–15. [DOI] [PMC free article] [PubMed] [Google Scholar]
- Brandman O, Stewart-Ornstein J, Wong D, Larson A, Williams CC, Li GW, Zhou S, King D, Shen PS, Weibezahn J, et al. (2012). A ribosome-bound quality control complex triggers degradation of nascent peptides and signals translation stress. Cell 151, 1042–1054. [DOI] [PMC free article] [PubMed] [Google Scholar]
- Choe YJ, Park SH, Hassemer T, Korner R, Vincenz-Donnelly L, Hayer-Hartl M, and Hartl FU (2016). Failure of RQC machinery causes protein aggregation and proteotoxic stress. Nature 531, 191–195. [DOI] [PubMed] [Google Scholar]
- Chu J, Hong NA, Masuda CA, Jenkins BV, Nelms KA, Goodnow CC, Glynne RJ, Wu H, Masliah E, Joazeiro CA, et al. (2009). A mouse forward genetics screen identifies LISTERIN as an E3 ubiquitin ligase involved in neurodegeneration. Proc Natl Acad Sci U S A 106, 2097–2103. [DOI] [PMC free article] [PubMed] [Google Scholar]
- Collart MA, and Weiss B (2019). Ribosome pausing, a dangerous necessity for co-translational events. Nucleic Acids Res. 48, 1043–1055. [DOI] [PMC free article] [PubMed] [Google Scholar]
- D’Orazio KN, Wu CC, Sinha N, Loll-Krippleber R, Brown GW, and Green R (2019). The endonuclease Cue2 cleaves mRNAs at stalled ribosomes during No Go Decay. Elife 8, e49117. [DOI] [PMC free article] [PubMed] [Google Scholar]
- Darnell JC, Van Driesche SJ, Zhang C, Hung KY, Mele A, Fraser CE, Stone EF, Chen C, Fak JJ, Chi SW, Licatalosi DD, Richter JD, Darnell RB (2011). FMRP stalls ribosomal translocation on mRNAs linked to synaptic function and autism. Cell 146, 247–261. [DOI] [PMC free article] [PubMed] [Google Scholar]
- Das Sharma S, Metz JB, Li H, Hobson BD, Hornstein N, Sulzer D, Tang G, and Sims PA (2019). Widespread Alterations in Translation Elongation in the Brain of Juvenile Fmr1 Knockout Mice. Cell Rep 26, 3313–3322. [DOI] [PMC free article] [PubMed] [Google Scholar]
- Dever TE, Feng L, Wek RC, Cigan AM, Donahue TF, and Hinnebusch AG (1992). Phosphorylation of initiation factor 2 alpha by protein kinase GCN2 mediates gene-specific translational control of GCN4 in yeast. Cell 68, 585–596. [DOI] [PubMed] [Google Scholar]
- Diament A, Feldman A, Schochet E, Kupiec M, Arava Y, and Tuller T (2018). The extent of ribosome queuing in budding yeast. PLoS Comput Biol 14, e1005951. [DOI] [PMC free article] [PubMed] [Google Scholar]
- Dimitrova LN, Kuroha K, Tatematsu T, and Inada T (2009). Nascent peptide-dependent translation arrest leads to Not4p-mediated protein degradation by the proteasome. J Biol Chem 284, 10343–10352. [DOI] [PMC free article] [PubMed] [Google Scholar]
- Dinman JD, Icho T, and Wickner RB (1991). A −1 ribosomal frameshift in a double-stranded RNA virus of yeast forms a gag-pol fusion protein. Proc Natl Acad Sci U S A 88, 174–178. [DOI] [PMC free article] [PubMed] [Google Scholar]
- Doma MK, and Parker R (2006). Endonucleolytic cleavage of eukaryotic mRNAs with stalls in translation elongation. Nature 440, 561–564. [DOI] [PMC free article] [PubMed] [Google Scholar]
- Gamble CE, Brule CE, Dean KM, Fields S, and Grayhack EJ (2016). Adjacent Codons Act in Concert to Modulate Translation Efficiency in Yeast. Cell 166, 679–690. [DOI] [PMC free article] [PubMed] [Google Scholar]
- Garcia-Barrio M, Dong J, Ufano S, and Hinnebusch AG (2000). Association of GCN1-GCN20 regulatory complex with the N-terminus of eIF2alpha kinase GCN2 is required for GCN2 activation. EMBO J 19, 1887–1899. [DOI] [PMC free article] [PubMed] [Google Scholar]
- Garshott DM, Sundaramoorthy E, Leonard M, and Bennett EJ (2020). Distinct regulatory ribosomal ubiquitylation events are reversible and hierarchically organized. Elife 9, e54023. [DOI] [PMC free article] [PubMed] [Google Scholar]
- Garzia A, Jafarnejad SM, Meyer C, Chapat C, Gogakos T, Morozov P, Amiri M, Shapiro M, Molina H, Tuschl T, et al. (2017). The E3 ubiquitin ligase and RNA-binding protein ZNF598 orchestrates ribosome quality control of premature polyadenylated mRNAs. Nat Commun 8, 16056. [DOI] [PMC free article] [PubMed] [Google Scholar]
- Glover ML, Burroughs AM, Monem PC, Egelhofer TA, Pule MN, Aravind L, and Arribere JA (2020). NONU-1 Encodes a Conserved Endonuclease Required for mRNA Translation Surveillance. Cell Rep 30, 4321–4331. [DOI] [PMC free article] [PubMed] [Google Scholar]
- Grou CP, Pinto MP, Mendes AV, Domingues P, and Azevedo JE (2015). The de novo synthesis of ubiquitin: identification of deubiquitinases acting on ubiquitin precursors. Sci Rep 5, 12836. [DOI] [PMC free article] [PubMed] [Google Scholar]
- Guydosh NR, and Green R (2014). Dom34 rescues ribosomes in 3’ untranslated regions. Cell 156, 950–962. [DOI] [PMC free article] [PubMed] [Google Scholar]
- Guydosh NR, and Green R (2017). Translation of poly(A) tails leads to precise mRNA cleavage. RNA 23, 749–761. [DOI] [PMC free article] [PubMed] [Google Scholar]
- Guydosh NR, Kimmig P, Walter P, and Green R (2017). Regulated Ire1-dependent mRNA decay requires no-go mRNA degradation to maintain endoplasmic reticulum homeostasis in S. pombe. Elife 6, e29216. [DOI] [PMC free article] [PubMed] [Google Scholar]
- Han P, Shichino Y, Schneider-Poetsch T, Mito M, Hashimoto S, Udagawa T, Kohno K, Yoshida M, Mishima Y, Inada T, Iwasaki S (2020). Genome-wide Survey of Ribosome Collision. Cell Rep 31, 107610. [DOI] [PMC free article] [PubMed] [Google Scholar]
- Harding HP, Ordonez A, Allen F, Parts L, Inglis AJ, Williams RL, and Ron D (2019). The ribosomal P-stalk couples amino acid starvation to GCN2 activation in mammalian cells. Elife 8, e50149. [DOI] [PMC free article] [PubMed] [Google Scholar]
- Hickey KL, Dickson K, Cogan JZ, Replogle JM, Schoof M, D’Orazio KN, Sinha NK, Frost A, Green R, Kostova KK, Weissman JS (2019). GIGYF2 and 4EHP Inhibit Translation Initiation of Defective Messenger RNAs to Assist Ribosome-Associated Quality Control. bioRxiv, 792994. [DOI] [PMC free article] [PubMed] [Google Scholar]
- Hinnebusch AG (2005). Translational regulation of GCN4 and the general amino acid control of yeast. Annu Rev Microbiol 59, 407–450. [DOI] [PubMed] [Google Scholar]
- Ikeuchi K, Izawa T, and Inada T (2018). Recent Progress on the Molecular Mechanism of Quality Controls Induced by Ribosome Stalling. Front Genet 9, 743. [DOI] [PMC free article] [PubMed] [Google Scholar]
- Ikeuchi K, Tesina P, Matsuo Y, Sugiyama T, Cheng J, Saeki Y, Tanaka K, Becker T, Beckmann R, and Inada T (2019). Collided ribosomes form a unique structural interface to induce Hel2-driven quality control pathways. EMBO J 38, e100276. [DOI] [PMC free article] [PubMed] [Google Scholar]
- Inglis AJ, Masson GR, Shao S, Perisic O, McLaughlin SH, Hegde RS, and Williams RL (2019). Activation of GCN2 by the ribosomal P-stalk. Proc Natl Acad Sci U S A 116, 4946–4954. [DOI] [PMC free article] [PubMed] [Google Scholar]
- Ingolia NT, Ghaemmaghami S, Newman JR, and Weissman JS (2009). Genome-wide analysis in vivo of translation with nucleotide resolution using ribosome profiling. Science 324, 218–223. [DOI] [PMC free article] [PubMed] [Google Scholar]
- Ingolia NT, Lareau LF, and Weissman JS (2011). Ribosome profiling of mouse embryonic stem cells reveals the complexity and dynamics of mammalian proteomes. Cell 147, 789–802. [DOI] [PMC free article] [PubMed] [Google Scholar]
- Ishimura R, Nagy G, Dotu I, Chuang JH, and Ackerman SL (2016). Activation of GCN2 kinase by ribosome stalling links translation elongation with translation initiation. Elife 5, e14295. [DOI] [PMC free article] [PubMed] [Google Scholar]
- Ishimura R, Nagy G, Dotu I, Zhou H, Yang XL, Schimmel P, Senju S, Nishimura Y, Chuang JH, and Ackerman SL (2014). RNA function. Ribosome stalling induced by mutation of a CNS-specific tRNA causes neurodegeneration. Science 345, 455–459. [DOI] [PMC free article] [PubMed] [Google Scholar]
- Izawa T, Park SH, Zhao L, Hartl FU, and Neupert W (2017). Cytosolic Protein Vms1 Links Ribosome Quality Control to Mitochondrial and Cellular Homeostasis. Cell 171, 890–903 e818. [DOI] [PubMed] [Google Scholar]
- Joazeiro CAP (2019). Mechanisms and functions of ribosome-associated protein quality control. Nat Rev Mol Cell Biol 20, 368–383. [DOI] [PMC free article] [PubMed] [Google Scholar]
- Johnson ES, Ma PC, Ota IM, and Varshavsky A (1995). A proteolytic pathway that recognizes ubiquitin as a degradation signal. J Biol Chem 270, 17442–17456. [DOI] [PubMed] [Google Scholar]
- Jung Y, Kim HD, Yang HW, Kim HJ, Jang CY, and Kim J (2017). Modulating cellular balance of Rps3 mono-ubiquitination by both Hel2 E3 ligase and Ubp3 deubiquitinase regulates protein quality control. Exp Mol Med 49, e390. [DOI] [PMC free article] [PubMed] [Google Scholar]
- Juszkiewicz S, Chandrasekaran V, Lin Z, Kraatz S, Ramakrishnan V, and Hegde RS (2018). ZNF598 Is a Quality Control Sensor of Collided Ribosomes. Mol Cell 72, 469–481 e467. [DOI] [PMC free article] [PubMed] [Google Scholar]
- Juszkiewicz S, and Hegde RS (2017). Initiation of Quality Control during Poly(A) Translation Requires Site-Specific Ribosome Ubiquitination. Mol Cell 65, 743–750 e744. [DOI] [PMC free article] [PubMed] [Google Scholar]
- Klopotowski T, and Wiater A (1965). Synergism of aminotriazole and phosphate on the inhibition of yeast imidazole glycerol phosphate dehydratase. Arch Biochem Biophys 112, 562–566. [DOI] [PubMed] [Google Scholar]
- Kurian L, Palanimurugan R, Godderz D, and Dohmen RJ (2011). Polyamine sensing by nascent ornithine decarboxylase antizyme stimulates decoding of its mRNA. Nature 477, 490–494. [DOI] [PubMed] [Google Scholar]
- Langmead B, Trapnell C, Pop M, and Salzberg SL (2009). Ultrafast and memory-efficient alignment of short DNA sequences to the human genome. Genome Biol 10, R25. [DOI] [PMC free article] [PubMed] [Google Scholar]
- Lareau LF, Hite DH, Hogan GJ, and Brown PO (2014). Distinct stages of the translation elongation cycle revealed by sequencing ribosome-protected mRNA fragments. Elife 3, e01257. [DOI] [PMC free article] [PubMed] [Google Scholar]
- Letzring DP, Dean KM, and Grayhack EJ (2010). Control of translation efficiency in yeast by codon-anticodon interactions. RNA 16, 2516–2528. [DOI] [PMC free article] [PubMed] [Google Scholar]
- Letzring DP, Wolf AS, Brule CE, and Grayhack EJ (2013). Translation of CGA codon repeats in yeast involves quality control components and ribosomal protein L1. RNA 19, 1208–1217. [DOI] [PMC free article] [PubMed] [Google Scholar]
- Love MI, Huber W, and Anders S (2014). Moderated estimation of fold change and dispersion for RNA-seq data with DESeq2. Genome Biol 15, 550. [DOI] [PMC free article] [PubMed] [Google Scholar]
- Martin M (2011). Cutadapt removes adapter sequences from high-throughput sequencing reads. (2011). 17, 3. [Google Scholar]
- Marton MJ, Vazquez de Aldana CR, Qiu H, Chakraburtty K, and Hinnebusch AG (1997). Evidence that GCN1 and GCN20, translational regulators of GCN4, function on elongating ribosomes in activation of eIF2alpha kinase GCN2. Mol Cell Biol 17, 4474–4489. [DOI] [PMC free article] [PubMed] [Google Scholar]
- Matsuo Y, Ikeuchi K, Saeki Y, Iwasaki S, Schmidt C, Udagawa T, Sato F, Tsuchiya H, Becker T, Tanaka K, et al. (2017). Ubiquitination of stalled ribosome triggers ribosome-associated quality control. Nat Commun 8, 159. [DOI] [PMC free article] [PubMed] [Google Scholar]
- Matsuo Y, Tesina P, Nakajima S, Mizuno M, Endo A, Buschauer R, Cheng J, Shounai O, Ikeuchi K, Saeki Y, et al. (2020). RQT complex dissociates ribosomes collided on endogenous RQC substrate SDD1. Nat Struct Mol Biol. doi: 10.1038/s41594-020-0393-9. [DOI] [PubMed] [Google Scholar]
- McGlincy NJ, and Ingolia NT (2017). Transcriptome-wide measurement of translation by ribosome profiling. Methods 126, 112–129. [DOI] [PMC free article] [PubMed] [Google Scholar]
- Morita M, Ler LW, Fabian MR, Siddiqui N, Mullin M, Henderson VC, Alain T, Fonseca BD, Karashchuk G, Bennett CF, et al. (2012). A novel 4EHP-GIGYF2 translational repressor complex is essential for mammalian development. Mol Cell Biol 32, 3585–3593. [DOI] [PMC free article] [PubMed] [Google Scholar]
- Nagalakshmi U, Wang Z, Waern K, Shou C, Raha D, Gerstein M, and Snyder M (2008). The transcriptional landscape of the yeast genome defined by RNA sequencing. Science 320, 1344–1349. [DOI] [PMC free article] [PubMed] [Google Scholar]
- Natarajan K, Meyer MR, Jackson BM, Slade D, Roberts C, Hinnebusch AG, and Marton MJ (2001). Transcriptional profiling shows that Gcn4p is a master regulator of gene expression during amino acid starvation in yeast. Mol Cell Biol 21, 4347–4368. [DOI] [PMC free article] [PubMed] [Google Scholar]
- Palanimurugan R, Scheel H, Hofmann K, and Dohmen RJ (2004). Polyamines regulate their synthesis by inducing expression and blocking degradation of ODC antizyme. EMBO J 23, 4857–4867. [DOI] [PMC free article] [PubMed] [Google Scholar]
- Park H, and Subramaniam AR (2019). Inverted translational control of eukaryotic gene expression by ribosome collisions. PLoS Biol 17, e3000396. [DOI] [PMC free article] [PubMed] [Google Scholar]
- Qiu H, Chereji RV, Hu C, Cole HA, Rawal Y, Clark DJ, and Hinnebusch AG (2016). Genome-wide cooperation by HAT Gcn5, remodeler SWI/SNF, and chaperone Ydj1 in promoter nucleosome eviction and transcriptional activation. Genome Res 26, 211–225. [DOI] [PMC free article] [PubMed] [Google Scholar]
- Rawal Y, Chereji RV, Valabhoju V, Qiu H, Ocampo J, Clark DJ, and Hinnebusch AG (2018). Gcn4 Binding in Coding Regions Can Activate Internal and Canonical 5’ Promoters in Yeast. Mol Cell 70, 297–311 e294. [DOI] [PMC free article] [PubMed] [Google Scholar]
- Reid GA, and Schatz G (1982). Import of proteins into mitochondria. Yeast cells grown in the presence of carbonyl cyanide m-chlorophenylhydrazone accumulate massive amounts of some mitochondrial precursor polypeptides. J Biol Chem 257, 13056–13061. [PubMed] [Google Scholar]
- Reyes-Turcu FE, and Wilkinson KD (2009). Polyubiquitin binding and disassembly by deubiquitinating enzymes. Chem Rev 109, 1495–1508. [DOI] [PMC free article] [PubMed] [Google Scholar]
- Saint M, Sawhney S, Sinha I, Singh RP, Dahiya R, Thakur A, Siddharthan R, and Natarajan K (2014). The TAF9 C-terminal conserved region domain is required for SAGA and TFIID promoter occupancy to promote transcriptional activation. Mol Cell Biol 34, 1547–1563. [DOI] [PMC free article] [PubMed] [Google Scholar]
- Schuller AP, Wu CC, Dever TE, Buskirk AR, and Green R (2017). eIF5A Functions Globally in Translation Elongation and Termination. Mol Cell 66, 194–205 e195. [DOI] [PMC free article] [PubMed] [Google Scholar]
- Shah P, Ding Y, Niemczyk M, Kudla G, and Plotkin JB (2013). Rate-limiting steps in yeast protein translation. Cell 153, 1589–1601. [DOI] [PMC free article] [PubMed] [Google Scholar]
- Sharma AK, Sormanni P, Ahmed N, Ciryam P, Friedrich UA, Kramer G, and O’Brien EP (2019). A chemical kinetic basis for measuring translation initiation and elongation rates from ribosome profiling data. PLoS Comput Biol 15, e1007070. [DOI] [PMC free article] [PubMed] [Google Scholar]
- Simms CL, Hudson BH, Mosior JW, Rangwala AS, and Zaher HS (2014). An active role for the ribosome in determining the fate of oxidized mRNA. Cell Rep 9, 1256–1264. [DOI] [PMC free article] [PubMed] [Google Scholar]
- Simms CL, Kim KQ, Yan LL, Qiu J, and Zaher HS (2018). Interactions between the mRNA and Rps3/uS3 at the entry tunnel of the ribosomal small subunit are important for no-go decay. PLoS Genet 14, e1007818. [DOI] [PMC free article] [PubMed] [Google Scholar]
- Simms CL, Yan LL, Qiu JK, and Zaher HS (2019). Ribosome Collisions Result in +1 Frameshifting in the Absence of No-Go Decay. Cell Rep 28, 1679–1689 e1674. [DOI] [PMC free article] [PubMed] [Google Scholar]
- Simms CL, Yan LL, and Zaher HS (2017). Ribosome Collision Is Critical for Quality Control during No-Go Decay. Mol Cell 68, 361–373 e365. [DOI] [PMC free article] [PubMed] [Google Scholar]
- Sitron CS, Park JH, and Brandman O (2017). Asc1, Hel2, and Slh1 couple translation arrest to nascent chain degradation. RNA 23, 798–810. [DOI] [PMC free article] [PubMed] [Google Scholar]
- Smith AM, Costello MS, Kettring AH, Wingo RJ, and Moore SD (2019). Ribosome collisions alter frameshifting at translational reprogramming motifs in bacterial mRNAs. Proc Natl Acad Sci U S A 116, 21769–21779. [DOI] [PMC free article] [PubMed] [Google Scholar]
- Sundaramoorthy E, Leonard M, Mak R, Liao J, Fulzele A, and Bennett EJ (2017). ZNF598 and RACK1 Regulate Mammalian Ribosome-Associated Quality Control Function by Mediating Regulatory 40S Ribosomal Ubiquitylation. Mol Cell 65, 751–760 e754. [DOI] [PMC free article] [PubMed] [Google Scholar]
- Tollenaere MAX, Tiedje C, Rasmussen S, Nielsen JC, Vind AC, Blasius M, Batth TS, Mailand N, Olsen JV, Gaestel M, et al. (2019). GIGYF1/2-Driven Cooperation between ZNF598 and TTP in Posttranscriptional Regulation of Inflammatory Signaling. Cell Rep 26, 3511–3521 e3514. [DOI] [PubMed] [Google Scholar]
- Tuck AC, Rankova A, Arpat AB, Liechti LA, Hess D, Iesmantavicius V, Castelo-Szekely V, Gatfield D, and Buhler M (2020). Mammalian RNA Decay Pathways Are Highly Specialized and Widely Linked to Translation. Mol Cell 77, 1222–1236 e13. [DOI] [PMC free article] [PubMed] [Google Scholar]
- Visweswaraiah J, Lee SJ, Hinnebusch AG, and Sattlegger E (2012). Overexpression of eukaryotic translation elongation factor 3 impairs Gcn2 protein activation. J Biol Chem 287, 37757–37768. [DOI] [PMC free article] [PubMed] [Google Scholar]
- Wang Z, Gaba A, and Sachs MS (1999). A highly conserved mechanism of regulated ribosome stalling mediated by fungal arginine attenuator peptides that appears independent of the charging status of arginyl-tRNAs. J Biol Chem 274, 37565–37574. [DOI] [PubMed] [Google Scholar]
- Wickner RB, Fujimura T, and Esteban R (2013). Viruses and prions of Saccharomyces cerevisiae. Adv Virus Res 86, 1–36. [DOI] [PMC free article] [PubMed] [Google Scholar]
- Wolf AS, and Grayhack EJ (2015). Asc1, homolog of human RACK1, prevents frameshifting in yeast by ribosomes stalled at CGA codon repeats. RNA 21, 935–945. [DOI] [PMC free article] [PubMed] [Google Scholar]
- Wolin SL, and Walter P (1988). Ribosome pausing and stacking during translation of a eukaryotic mRNA. EMBO J 7, 3559–3569. [DOI] [PMC free article] [PubMed] [Google Scholar]
- Wu CC, Zinshteyn B, Wehner KA, and Green R (2019). High-Resolution Ribosome Profiling Defines Discrete Ribosome Elongation States and Translational Regulation during Cellular Stress. Mol Cell 73, 959–970 e955. [DOI] [PMC free article] [PubMed] [Google Scholar]
- Yonashiro R, Tahara EB, Bengtson MH, Khokhrina M, Lorenz H, Chen KC, Kigoshi-Tansho Y, Savas JN, Yates JR, Kay SA, et al. (2016). The Rqc2/Tae2 subunit of the ribosome-associated quality control (RQC) complex marks ribosome-stalled nascent polypeptide chains for aggregation. Elife 5, e11794. [DOI] [PMC free article] [PubMed] [Google Scholar]
- Young DJ, and Guydosh NR (2019). Hcr1/eIF3j Is a 60S Ribosomal Subunit Recycling Accessory Factor In Vivo. Cell Rep 28, 39–50 e34. [DOI] [PMC free article] [PubMed] [Google Scholar]
- Young DJ, Guydosh NR, Zhang F, Hinnebusch AG, and Green R (2015). Rli1/ABCE1 Recycles Terminating Ribosomes and Controls Translation Reinitiation in 3’UTRs In Vivo. Cell 162, 872–884. [DOI] [PMC free article] [PubMed] [Google Scholar]
- Young DJ, Makeeva DS, Zhang F, Anisimova AS, Stolboushkina EA, Ghobakhlou F, Shatsky IN, Dmitriev SE, Hinnebusch AG, and Guydosh NR (2018). Tma64/eIF2D, Tma20/MCT-1, and Tma22/DENR Recycle Post-termination 40S Subunits In Vivo. Mol Cell 71, 761–774 e765. [DOI] [PMC free article] [PubMed] [Google Scholar]
- Zhao T, Chen Y, Wang J, Chen S, and Qian W (2019). Disome-seq reveals sequence-mediated coupling of translational pauses and protein structures. bioRxiv, 746875. [Google Scholar]
Associated Data
This section collects any data citations, data availability statements, or supplementary materials included in this article.
Supplementary Materials
Supplemental Excel Table S4: DEseq analysis of RNA-seq data to determine genes with significant difference between WT and hel2Δ cells. FDR (padj) <0.05 is used as a threshold to define significance. Gcn4-target mRNAs are highlighted in blue. Related to Figure 5.
Supplemental Excel Table S5: MS data showing the abundance of peptides associated with disomes, technical replicate 1. Related to Figure 5.
Supplemental Excel Table S6: MS data showing the abundance of peptides associated with disomes, technical replicate 2. Related to Figure 5.
Data Availability Statement
Demultiplexed raw sequencing files as well as processed data are deposited in the NCBI GEO database with the accession number: GSE139036. Custom scripts are posted on Github: https://github.com/guydoshlab/Yeastcode1.