

Abstract
The mechanisms by which mutant huntingtin (mHTT) leads to neuronal cell death in Huntington’s disease (HD) are not fully understood. To gain new molecular insights, we used snRNA-Seq and TRAP to conduct transcriptomic analyses of caudate/putamen (striatal) cell type-specific gene expression changes in human HD and mouse models of HD. In striatal spiny projection neurons, the most vulnerable cell type in HD, we observe a release of mitochondrial RNA (mtRNA, a potent mitochondrial-derived innate immunogen) and a concomitant upregulation of innate immune signaling in spiny projection neurons. Further, we observe that the released mtRNAs can directly bind to the innate immune sensor PKR. We highlight the importance of studying cell type-specific gene expression dysregulation in HD pathogenesis, and reveal that the activation of innate immune signaling in the most vulnerable HD neurons provides a novel framework to understand the basis of mHTT toxicity and raises new therapeutic opportunities.
Graphical Abstract
eTOC Blurb
Lee, Fenster, et al. conduct striatal cell type-specific transcriptomics in mouse models of HD and human HD. Their findings reveal that mutant huntingtin leads to the release of mitochondrial-RNAs and activation of innate immune signaling in neurons in a manner that correlates with striatal cell vulnerability in HD.
INTRODUCTION
Huntington’s disease (HD) is a fatal neurodegenerative disorder caused by CAG trinucleotide repeat expansions in exon 1 of the huntingtin (HTT) gene (Group, 1993). Depending on the neuropathological severity, HD is classified along five grades (0–4), with grade 0 displaying no neuropathological abnormalities, grade 1 displaying 50% loss of striatal neurons, and grade 4 displaying 95% loss of striatal neurons. In addition to neuronal loss, striatal astrocyte numbers are greatly increased in grades 2–4 (Vonsattel et al., 1985). Although it is still not fully understood how trinucleotide CAG repeat expansions in the mutant huntingtin gene (mHTT) lead to the death of striatal neurons, mHTT has been linked to both toxic gain-of-function, as well as loss-of-function, effects in diverse cellular processes that include synaptic neurotransmission, neurotrophin signaling, mitochondrial function, DNA damage repair, axonal and vesicular transport, calcium signaling, and gene transcription (Zuccato et al., 2010). In support of gene transcription dysregulation as having an important role in Huntington’s disease pathobiology, mutant Huntingtin protein is most toxic when localized in the nucleus (Benn et al., 2005; Saudou et al., 1998) and the degree of transcriptional dysregulation in HD correlates with brain area vulnerability in human HD samples (Hodges et al., 2006). Because of this, and moreover that gene expression profiling reports not only on transcriptional dysregulation itself but also generally on cellular responses to mHTT, many studies have used gene expression profiling of HD and HD model tissue to study transcriptional changes induced by mHTT. However, to date these studies have been limited by anatomical cellular intermixing and thus they have not detected striatal cell type-specific changes to gene expression, but such data could yield critically lacking insights into the basis of mHTT toxicity. For example, there is differential vulnerability among HD-affected neurons, with Drd2-expressing striatopallidal ‘indirect pathway’ spiny projection neurons (iSPNs) displaying higher vulnerability in HD patients (Reiner et al., 1988). It is possible that other, less vulnerable cell types possess protective intrinsic factors or adaptive responses that iSPNs lack, or that iSPNs possess unique vulnerability factors or neurotoxic responses, knowledge of which may point to new HD therapeutic targets. Across many neurodegenerative diseases, not just HD, the basis of enhanced or selective neuronal vulnerability is not well understood. Thus, cell type-specific transcriptional studies across HD and HD models may provide a paradigm for future studies in other disease models.
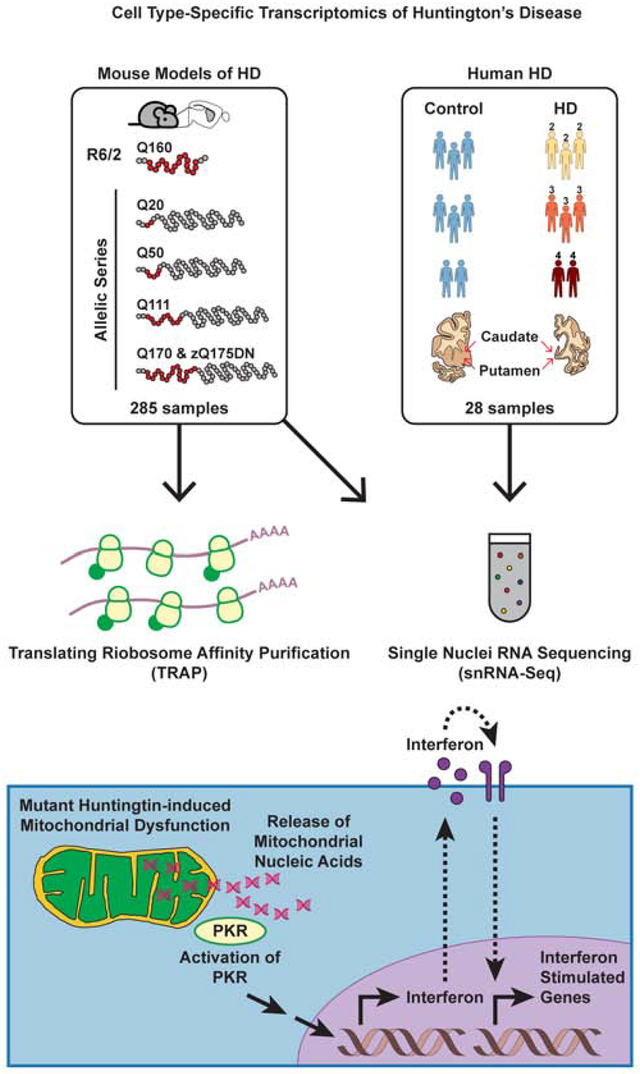
To gain cell type-specific resolution in gene expression profiling (Experimental Approach Overview: Fig. 1), we applied the translating ribosome affinity purification (TRAP) methodology (Doyle et al., 2008; Heiman et al., 2008) to the study of both a commonly used HD transgenic model (R6/2; human HTT exon 1 with 160 CAG repeats) as well as a series of Htt gene knockin CAG-expansion mouse ‘allelic series’ models containing full-length mouse Htt (with a humanized HTT exon 1) with 20, 50, 111, 170, or 175 CAG repeats. Cell type-specific changes in both types of models were additionally interrogated by unbiased striatal single nuclear RNA-Seq (snRNA-Seq). We further report here an snRNA-Seq characterization of caudate/putamen (striatal) cell types of grade 2–4 human HD post-mortem samples, in order to compare mouse model data to that obtained from affected striatal neurons in human HD. Comparison of gene expression changes across mouse and human cell types studied revealed a previously unrecognized complexity of cell type-specific gene expression changes in response to mHTT, as well as a conservation of many of these gene expression changes between HD and HD mouse models for neurons (but less so for some glial cell types). Several genes close to single nucleotide polymorphisms (SNPs) that have been implicated as age-of-onset modifiers by a recent human genetic study (Consortium., 2019) were altered in several caudate/putamen cell types in HD. Further, across the models and species, we observed a release of mitochondrial RNAs (mtRNAs) in SPNs, which resulted in an activation of neuronal innate immune signaling. We further found that released mtRNAs were bound to the dsRNA sensor Protein Kinase R (Eif2ak2, hereafter referred as PKR). Finally, we show that chemical inhibition (absent mHTT) of mitochondrial function alone is sufficient to induce PKR expression in human neurons. From these data we highlight the importance of considering cell type-specific transcriptional dysregulation in HD pathogenesis, and propose a model whereby mHTT leads to mitochondrial dysregulation and release of mtRNAs that then trigger an innate antiviral immune signal leading to enhanced neuronal vulnerability in HD.
Figure 1. Cell type-specific striatal gene expression profiling across HD and mouse models of HD.
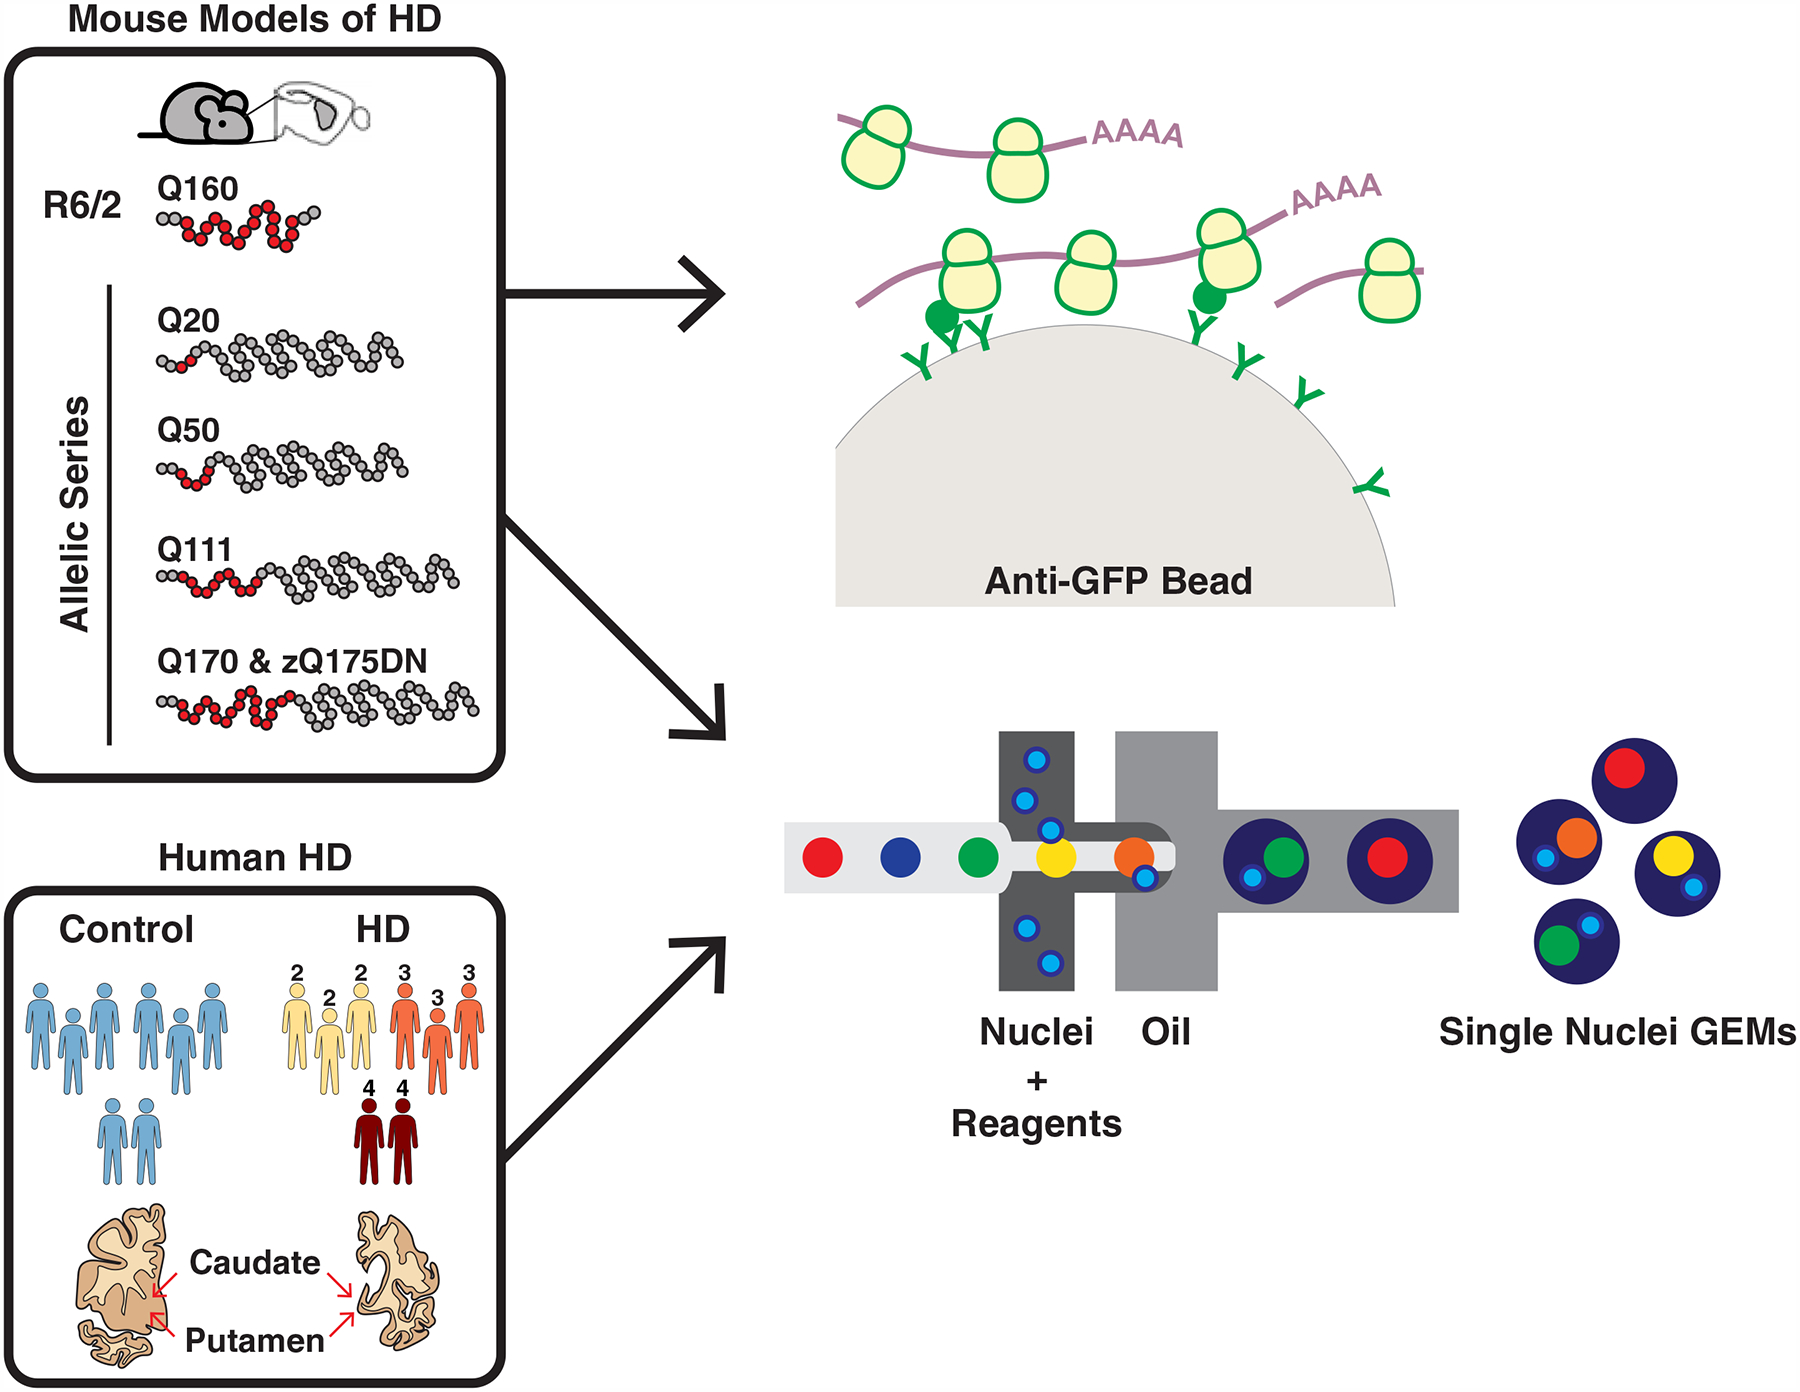
The commonly used transgenic R6/2 exon 1 mHTT fragment HD model and the allelic series knockin mHtt (Q20, Q50, Q111, Q170, and zQ175DN) HD models were used for translating ribosome affinity purification (TRAP) profiling, which purifies mature, cytoplasmically localized mRNAs by immunoaffinity purification of GFP-tagged ribosome complexes in genetically defined cell types. The R6/2 and zQ175DN models were also used for single nuclear RNA-Sequencing (snRNA-Seq), which reports gene expression changes based on captured nuclear sequences. HD grade 2–4 patient and control caudate and putamen (striatal) tissue samples were also used for snRNA-Seq.
RESULTS
Cell Type-Specific Gene Expression Profiling by TRAP of HD Mouse Models
In order to profile striatal spiny projection neurons (SPNs), which are the most affected cell type in HD (Vonsattel et al., 1985), and corticostriatal projection neurons (CStrPNs), which provide the majority of the excitatory glutamatergic input into the striatum and also have been implicated in HD (Cepeda et al., 2007) (Fig. 2A), we first used the TRAP methodology that allows for rapid, one-step affinity purification of messenger RNAs (mRNAs) (Heiman et al., 2008). The TRAP methodology provides high-resolution molecular phenotyping at the cell type population level, and additionally reports mRNAs that are bound by cytosolic ribosomes, thus providing data on mature mRNAs. We first studied the response of the targeted cell types to transgenic overexpression of a mutant exon 1 fragment of human HTT with a high CAG repeat expansion (160 CAG), utilizing the well-described and widely used R6/2 HD model (Mangiarini et al., 1996) (Fig. 1). For these exon 1 mHTT studies, Drd2-expressing striatopallidal ‘indirect pathway’ spiny projection neurons (iSPNs) and Drd1a-expressing striatonigral ‘direct pathway’ spiny projection neurons (dSPNs) were targeted using previously described TRAP lines (Heiman et al., 2008), while CStrPNs were targeted by injection into the striatum of a retrograde viral vector encoding the TRAP transgene in order to transduce, by projection, cortical neurons that project to the striatum (STAR Methods and Fig. S1). 9-week old mice were used to represent an early/mid phenotypic timepoint in this R6/2 model (Mangiarini et al., 1996). At this timepoint, over 5,000 protein-coding genes were dysregulated in both dSPNs and iSPNs, and more than 1,000 genes were dysregulated in CStrPNs, in response to exon 1 mHTT overexpression (Fig. 2B and Table S1). Comparison of the gene expression changes across cell types revealed that approximately half of dSPN- and iSPN-dysregulated genes were shared, and approximately half of the genes dysregulated in CStrPNs were also dysregulated in either or both types of SPNs (Fig. 2C). As expected from previous studies (Langfelder et al., 2016; Luthi-Carter et al., 2000), many SPN marker genes were downregulated in both dSPNs and iSPNs (Fig. 2D), but unexpectedly several of these SPN marker genes were also downregulated in CStrPNs (Fig. 2D). Pdyn and Substance P/Tac1, markers of striatal striosomes (Bolam et al., 1988; Brimblecombe and Cragg, 2017), were downregulated in dSPNs (Fig. 2D and Table S1), suggestive of an enhanced loss of markers of the striatal striosome compartment, an important functional compartmentalization of the striatum (Graybiel and Ragsdale, 1978) that may display earlier vulnerability in HD than the rest of the striatum (Hedreen and Folstein, 1995), and consistent with reports in HD mouse models of striosome-biased effects (Menalled et al., 2002; Sawiak et al., 2009). At the gene pathway level, many pathways were altered in each cell type in the R6/2 model (Fig. 2E, but see also Table S1). Among the most significant pathways commonly altered in dSPNs and iSPNs, many terms related to the regulation of synaptic transmission and function were downregulated, while the DNA mismatch repair pathway (including Msh2 and Mlh3) was upregulated. Upregulation of the DNA mismatch repair pathway [members of which can contribute to somatic instability of the mHTT CAG repeat (Dragileva et al., 2009; Manley et al., 1999)] may further contribute to the instability of the mHTT CAG trinucleotide repeat that has been demonstrated in this model (Gonitel et al., 2008). Among the most significant cell type-specific pathways, the neurotrophin signaling pathway was upregulated in iSPNs and several terms related to the mitochondrial oxidative phosphorylation (OXPHOS) pathway were downregulated in iSPNs. Many studies have implicated mHTT in the dysregulation of both of these pathways (Zuccato et al., 2010), but our studies point to iSPNs specifically as having differential responses in these pathways at this model timepoint. For example, while the brain-derived neurotrophic factor (BDNF) receptor Ntrk2 was downregulated in both dSPNs and iSPNs, only iSPNs showed upregulation of Bdnf itself, which may reflect a homeostatic response in iSPNs at this timepoint. Furthermore, downregulation of OXPHOS pathway genes would be expected to lead to neurotoxic effects in iSPNs based on the known striatal neurotoxic effect of OXPHOS inhibition (Wullner et al., 1994). Many gene pathways were also altered in CStrPNs in the R6/2 model, but most notable in overlap with dSPN and iSPN changes were many downregulated pathways related to synaptic function as well as the circadian entrainment pathway (Fig. 2E and Table S1). This downregulation of circadian genes in CStrPNs, dSPNs, and iSPNs may contribute to many cellular abnormalities, including perturbed redox homeostasis; indeed, disruption of circadian clock transcriptional activators has been shown to enhance the striatal neurotoxicity of the mitochondrial toxin 3-nitroproprionic acid in vivo (Musiek et al., 2013).
Figure 2. Cell type-specific analysis of gene expression changes in striatal spiny projection neurons (SPNs) and corticostriatal projection neurons (CStrPNs) of the R6/2 model of HD by TRAP.
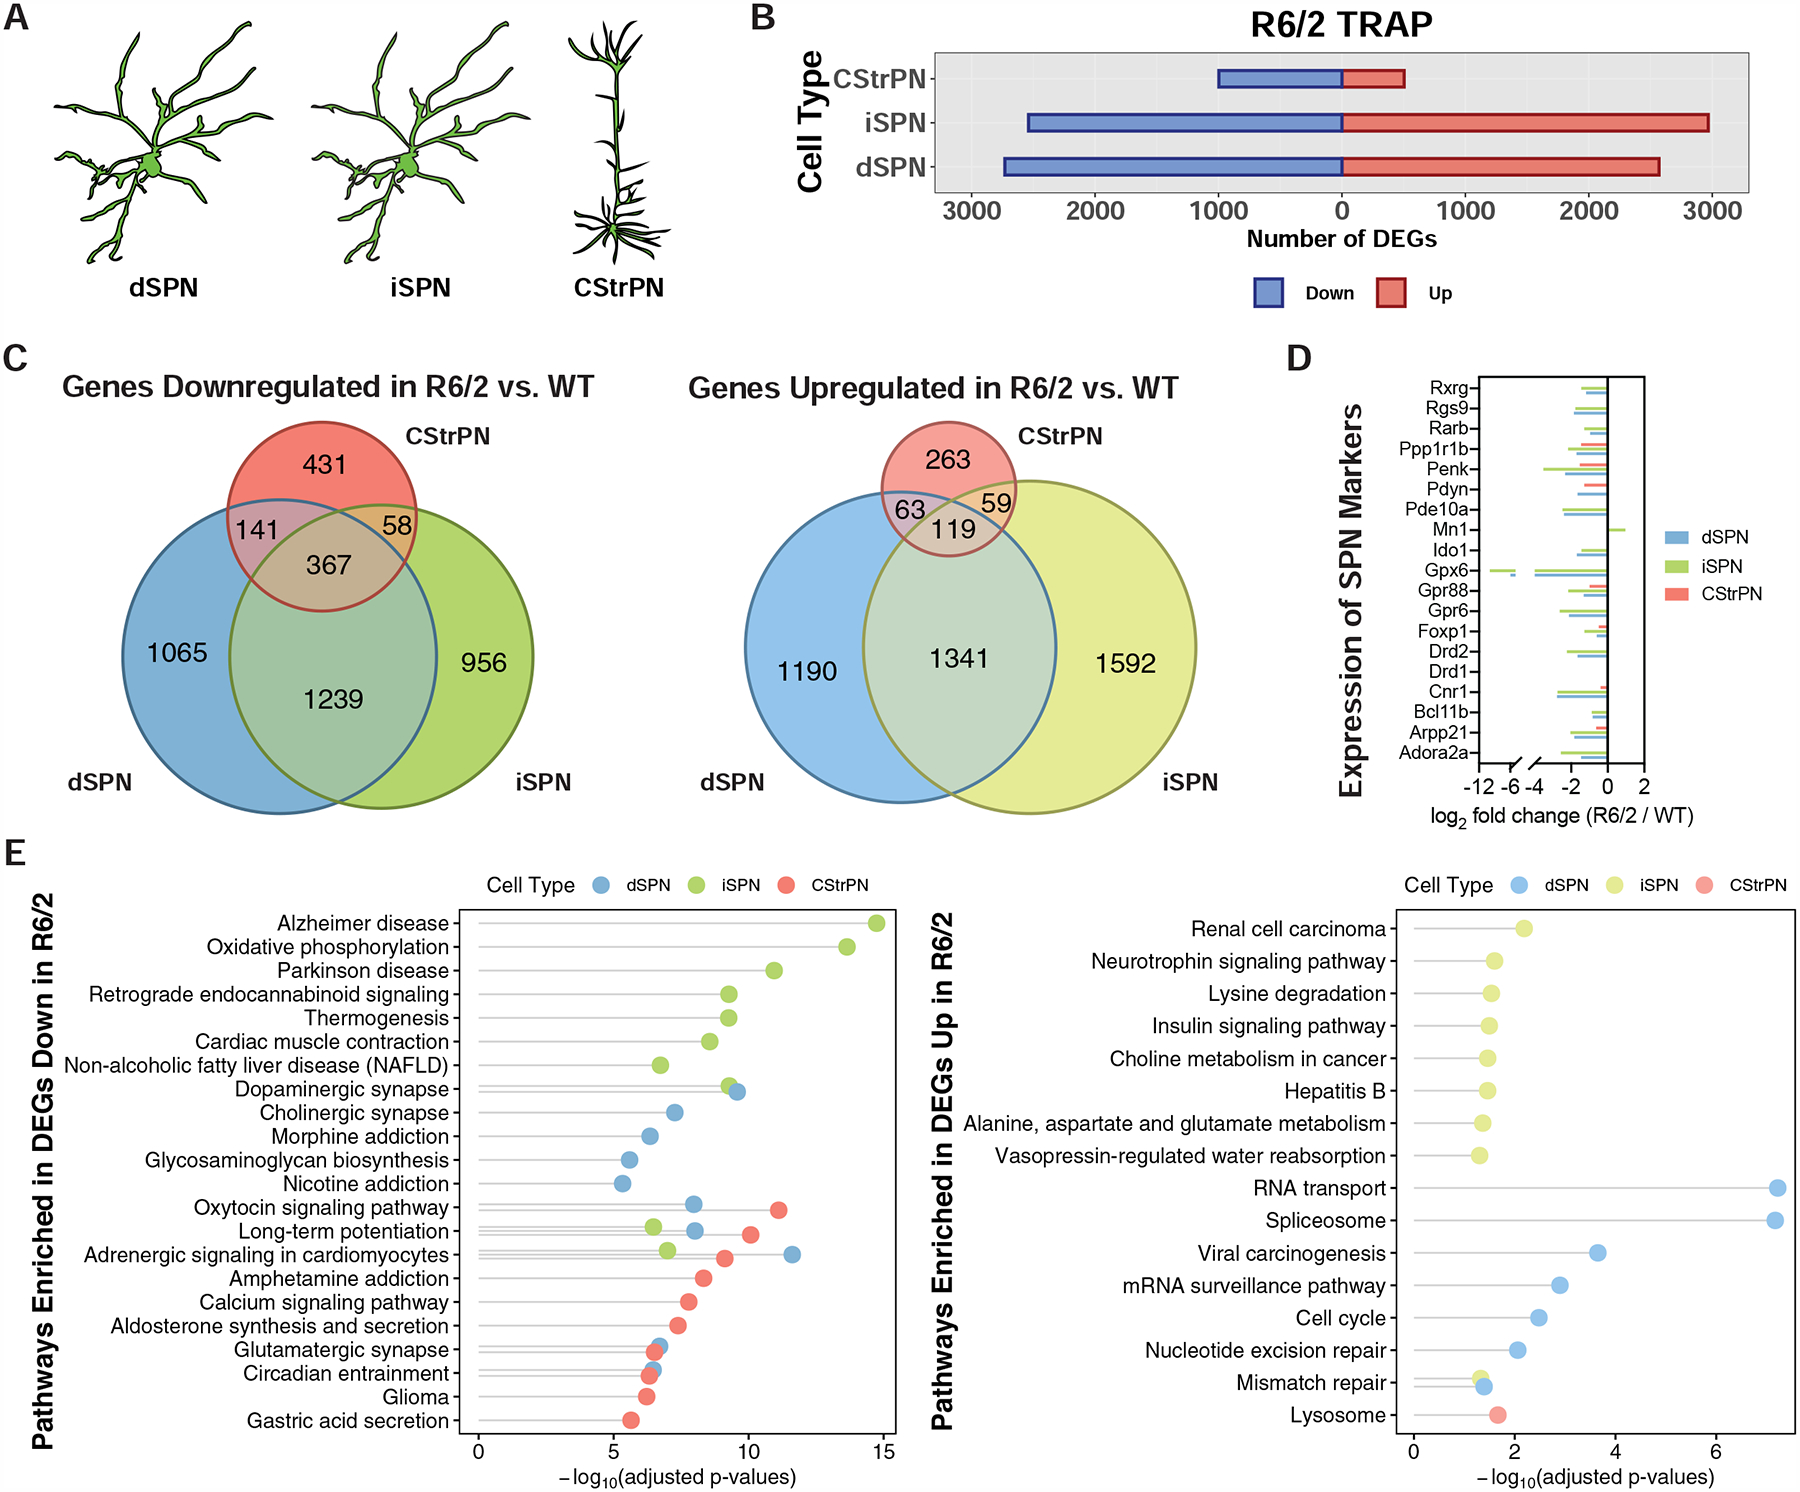
(A) Schematic depicting the targeting of striatal dSPNs, striatal iSPNs, and cortical CStrPNs. (B) Number of genes that were differentially expressed at the translated mRNA level in dSPNs, iSPNs, and CStrPNs in the R6/2 model at 9-weeks of age. (C) Venn diagrams representing unique and common differentially expressed genes across the three cell types (left panel: downregulated genes; right panel: upregulated genes). (D) Plot showing downregulation of SPN marker genes in the dSPN, iSPN, and CStrPN TRAP data. (E) Enriched KEGG pathways of genes downregulated (left panel) and upregulated (right panel) across the three cell types, represented with Fisher’s exact test −log10-adjusted p-value.
Weighted gene coexpression network analysis (WGCNA) (Langfelder et al., 2016; Langfelder and Horvath, 2008; Zhang and Horvath, 2005) was next used to identify modules of genes that were co-expressed across the dSPN and iSPN R6/2 model TRAP data. This analysis revealed several modules of genes with distinct transcriptional responses in either the presence of mHTT or by SPN cell type (Fig. S2A–B). Inspection of hub genes [those having expression values that were highly correlated with that module’s eigengene values (Langfelder et al., 2013)] (Fig. S2C) and KEGG pathway analysis (Fig. S2D) of these modules’ genes revealed that synaptic and circadian entrainment pathway genes were among those that were most highly enriched in the ‘dark green’, ‘green’, and ‘black’ modules (associated with the presence of mHTT) and that OXPHOS and synaptic pathway genes were among those that were most highly enriched in the ‘salmon’ and ‘black’ modules (associated with cell type). WGCNA analysis of the CStrPN R6/2 model TRAP data revealed that synaptic and circadian entrainment pathway genes were among those that were most highly enriched in the modules associated with the presence of mHTT in this cell type as well (Fig. S2E–H). Taken together, our analyses suggest that a combination of non-cell type-specific (e.g. synaptic and circadian clock gene dysregulation, seen in all three cell types profiled; DNA mismatch repair gene upregulation and BDNF receptor Ntrk2 downregulation seen in both dSPNs and iSPNs) and cell type-specific (OXPHOS pathway downregulation, seen in iSPNs) responses may lead the enhanced vulnerability of iSPNs in response to mHTT.
If transcriptional changes such as synaptic, circadian, and OXPHOS gene downregulation are indeed leading to SPNs vulnerability in HD, knowledge of their upstream, ‘master regulators’ may point to new therapeutic targets. In order to identify potential regulators of the TRAP-identified gene expression changes, we performed a Chromatin Enrichment Analysis (ChEA) (Lachmann et al., 2010) of the SPN and CStrPN dysregulated gene sets in the R6/2 model. Predicted regulators of dSPN and iSPN upregulated genes included Crem, Creb1, and Kdm5b, while Vdr and Foxo3 were also among the predicted regulators of dSPN-only upregulated genes and Wt1 was among the predicted regulators of iSPN-only upregulated genes (Fig. S3A and Table S1). Wt1 and Retinoic Acid Receptor beta (Rarb, whose own expression was downregulated in both dSPNs and iSPNs, Fig. 2D) were among the top predicted regulators of the downregulated genes in both SPN cell types (Fig. S3A and Table S1), as were components or regulators of the polycomb repressive complex 2 (PRC2) complex Suz12, Mtf2, and Ezh2. All of these factors were also the top predicted regulators of genes downregulated in CStrPNs (Fig. S3A and Table S1). Comparison of published striatal Rarb protein ChIP-Seq data (Niewiadomska-Cimicka et al., 2017) confirmed that the Rarb protein directly targets a large number of genes dysregulated in both dSPNs and iSPNs by mHTT in the R6/2 model (Fig. S3B).
In order to expand these data obtained in the transgenic mHTT exon 1 R6/2 model to full-length Htt models of HD, we examined an early timepoint of disease progression in a series of models possessing alleles of mHTT with a range of knockin CAG expansions. For this purpose we conducted TRAP studies in human HTT exon 1 knockin HdhQ20, HdhQ50, HdhQ111, HdhQ170 Htt lines (Wheeler et al., 1999) (an ‘allelic series’, as all lines are similar in construction and vary only by the CAG expansion size), as well as the commonly used human HTT exon 1 knockin zQ175KI line (Heikkinen et al., 2012; Menalled et al., 2012; Menalled et al., 2003), with its neomycin cassette removed: ‘zQ175 delta neo, or zQ175DN’ (Franich et al., 2019) (Fig. 1). All of these studies were conducted at 6-months of age, which reflects an early molecular phenotypic timepoint based upon whole tissue RNA sequencing studies (Langfelder et al., 2016). The zQ175DN line was included in our study since it has an identical CAG repeat range as the Q170 knockin line, but was independently generated, has a 10 bp human HTT intron 1 addition, a 94 bp mouse Htt intron 1 deletion, has a more severe phenotype than the Q170 knockin line, and is also widely used. A humanized Q20 exon 1 knockin reference allele was used as the control comparison for each knockin allele, as the human HTT gene has an average of 20 CAG repeats in control populations (Group, 1993). In these experiments, in addition to targeting dSPNs and iSPNs, we also profiled striatal astroglia and striatal cholinergic interneurons, as striatal astroglia have been implicated in HD pathogenesis (Bradford et al., 2009; Khakh et al., 2017), while striatal cholinergic interneurons represent a striatal population that is largely spared in HD (Cicchetti et al., 2000) (Fig. 3A). Both of these additional cell types were targeted with the use of previously characterized TRAP lines (Doyle et al., 2008).
Figure 3. Cell type-specific analysis of gene expression changes in striatal spiny projection neurons (SPNs), astroglia, and cholinergic interneurons of the allelic series knockin models of HD by TRAP.
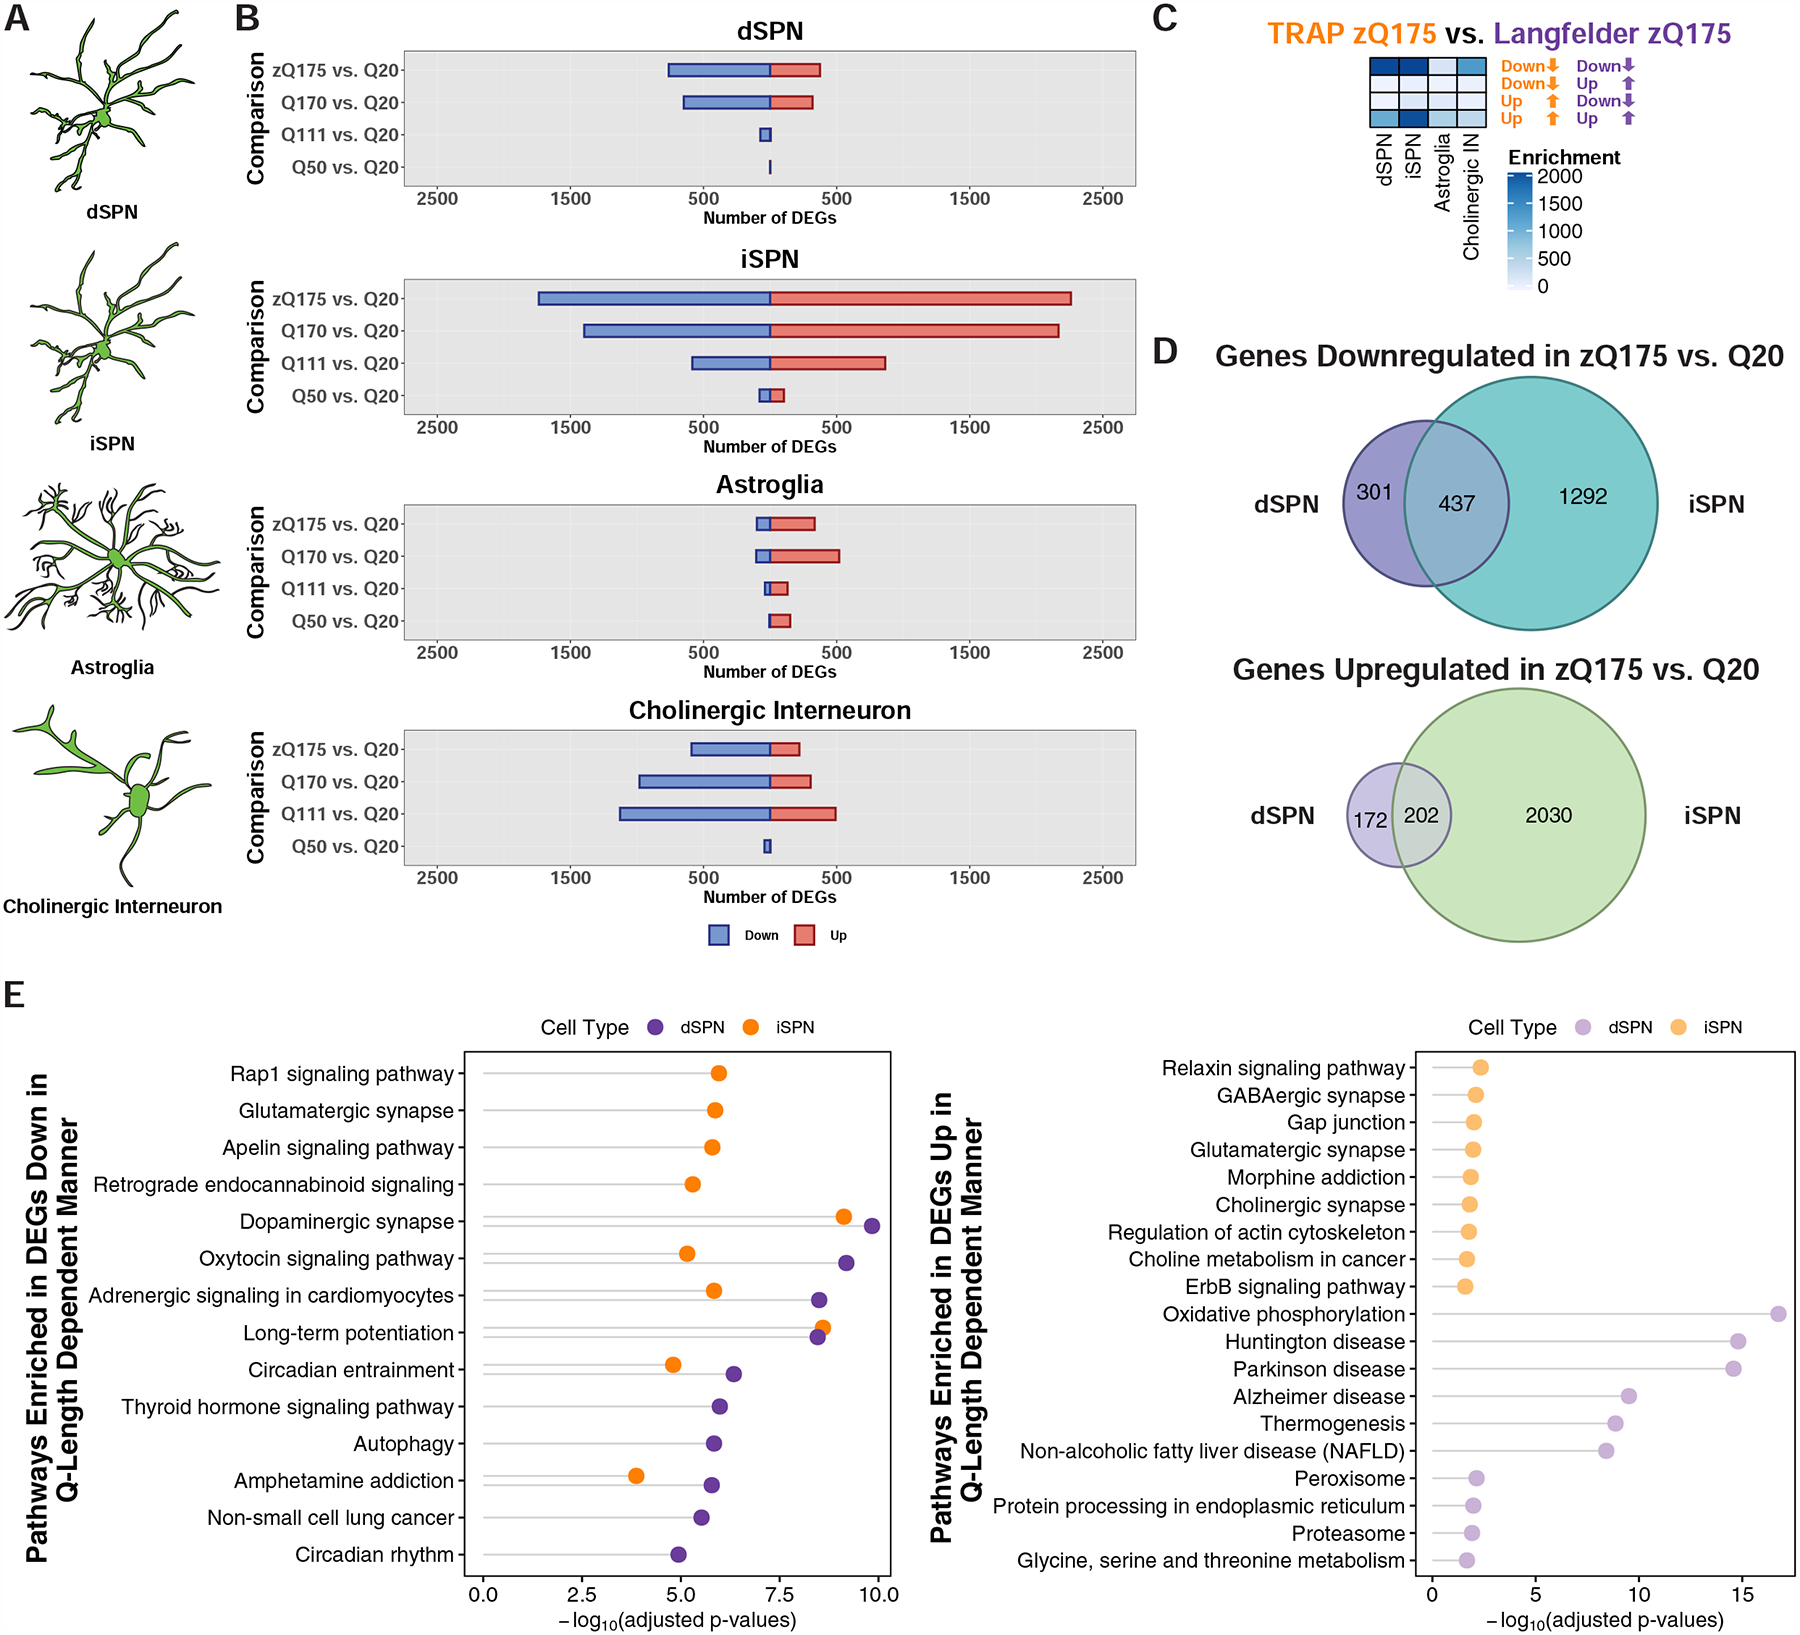
(A) Schematic depicting the targeting of striatal dSPNs, iSPNs, astroglia, and cholinergic interneurons. (B) Number of genes that were differentially expressed at the translated mRNA level in each of the cell types indicated at 6-months of age. (C) Overlap of the zQ175DN model downregulated and upregulated genes identified by cell type-specific TRAP and bulk RNA-Seq from the cited Langfelder et al. study. Overlaps were assessed using Fisher’s exact test and −log10-adjusted p-values are reported in the heatmap. (D) Venn overlap analysis of differentially expressed genes in the zQ175DN vs. Q20 comparisons between dSPNs and iSPNs (top panel: downregulated; bottom panel: upregulated). (E) KEGG pathway enrichment analysis of genes downregulated (left) and upregulated (right) in dSPNs and iSPNs from the linear regression analysis of CAG-length dependent changes, represented with Fisher’s exact test −log10-adjusted p-value.
As expected from previously published total striatal tissue transcriptional profiling data (Langfelder et al., 2016), all cell types profiled demonstrated CAG-length dependent dysregulation of gene expression in the full-length mHTT context (Fig. 3B and Table S1). iSPNs displayed the greatest number of changes to gene expression (Fig. 3B), and comparison of the zQ175DN cell type-specific transcriptional changes to total striatal tissue zQ175DN transcriptional profiling data (Langfelder et al., 2016) revealed the highest degree of enrichment when comparing the SPN gene expression changes (Fig. 3C), which would be expected if they were most affected in the striatum. Approximately half of the genes dysregulated in dSPNs were also dysregulated in iSPNs (Fig. 3D). SPN marker genes were downregulated in dSPNs and iSPNs, as expected (Table S1). Overall, the gene expression changes observed in the Q170 and zQ175DN knockin models were similar, although more similar in the dSPN cell type (Fig. S4 and Table S1). We saw little evidence, at this 6-month timepoint, of reactive astroglia marker expression in striatal astroglia (Fig. S5 and Table S1). However, like iSPNs, astroglia displayed a decrease to OXPHOS gene expression (Fig. S5 and Table S1). Both striatal astroglia and cholinergic interneurons displayed reduced expression of a large number of SPN markers, including Scn4b, Gpr6, Arpp21, and Pde10a (Table S1). To identify CAG-length dependent changes to gene expression in SPNs, we performed a linear regression across the Q20, Q50, Q111, Q170, and zQ175DN gene expression changes for each cell type (STAR Methods). This analysis revealed several thousand genes whose expression was correlated in dSPNs and iSPNs with the degree of CAG repeat expansion, with dSPNs having a larger number of genes that displayed CAG-length dependent dysregulation than iSPNs (Table S1). Overall, for downregulated genes, dSPN and iSPN CAG-length dependent (and zQ175DN vs. Q20) dysregulated gene pathways overlapped with several of those altered in the exon 1 mHTT R6/2 model (Fig. 3E and S6, and Table S1), and again we noted that more downregulated (vs. upregulated) gene pathways and their predicted regulators were shared among dSPNs and iSPNs in the CAG-length dependent gene expression changes (Fig. 3E and S3C, and Table S1). When considering the pathway changes, we observed again downregulation of the circadian entrainment pathway in both dSPNs and iSPNs, and in this case an increase to OXPHOS gene expression in dSPNs (in addition to, again, the decrease to OXPHOS gene expression in iSPNs), which may reflect a protective response in dSPNs in these milder models. WGCNA analysis of the dSPN and iSPN allelic series TRAP data was used to complement the linear regression analysis and further identify modules of genes whose expression was associated with CAG-length in each SPN cell type. This analysis revealed several gene modules with distinct transcriptional responses that were associated with CAG-length in both SPN cell types (Fig. S7A–B). The ‘brown’ module contained many synaptic and circadian entrainment genes that were downregulated with increasing CAG-length in both SPN cell types (Fig. S7B–D). In some cases, the correlations of the module eigengenes with CAG-length were of opposite directions by cell type, for example the ‘yellow’, ‘magenta’, and ‘black’ modules (Fig. S7B). Analysis of hub genes and KEGG pathway membership revealed that OXPHOS pathway genes were among those most highly represented in the ‘magenta’ and ‘black’ modules (Fig. S7C–D). Further, the ‘yellow’ module contained many hub genes that were themselves either glutamine-rich protein encoding genes (Tnrc6c, Tcf20, Ythdf3, Adamts3, and Mn1) or else genes encoding triplet repeat expansion RNA-binding proteins [Mbnl1 (Miller et al., 2000)] (Fig. S7C). This observation regarding ‘yellow’ module hub genes raises the interesting possibility that genes encoding glutamine-rich proteins or those that may form focal aggregates at the RNA level may be broadly perturbed by mHTT differently by cell type in a CAG-length dependent fashion.
Taken altogether, our TRAP data reveal in-depth population profiles of the cell type-specific gene expression changes that occur in either in the R6/2 (exon 1 fragment mHTT) or full-length mHtt allelic series models through analysis of mature, translated mRNAs. In the less aggressive full-length mHtt models, iSPNs displayed the most pronounced changes to gene expression at all allele lengths tested, while in the more severe R6/2 model, iSPNs and dSPNs displayed a similar level of changes to gene expression. In the R6/2 model we observed a loss of striosome compartment markers. In both the R6/2 and full-length allelic series models, dSPNs and iSPNs displayed considerable overlap in their downregulated genes and their predicted regulators, but this was mostly not the case for upregulated genes. At the 6-month timepoint tested, astroglia studied in the full-length models did not reveal markers of reactivity that might promote neuronal dysfunction, and gene expression changes in cholinergic interneurons revealed alterations to synaptic and metabolic function that may reflect homeostatic responses. While CStrPNs were not profiled in the allelic series mice, the results from the R6/2 model show a similarity in how these neurons and striatal SPNs respond to mHTT, as genes downregulated in CStrPNs shared a large overlap with those genes downregulated in SPNs. It is possible that the expression in deep layer cortical neurons of several known SPN marker genes that are also transcription factors, including Foxo1 and Ctip2/Bcl11b (Molyneaux et al., 2007), may in part be responsible this common molecular profile, as well as common higher vulnerability in HD. Finally, our data suggest that a combination of non-cell type-specific responses (e.g. synaptic and circadian clock gene dysregulation) and cell type-specific responses (e.g. OXPHOS gene downregulation) may render iSPNs more sensitive to mHTT.
Cell Type-Specific Gene Expression Profiling by snRNA-Seq of HD Mouse Models
To confirm and expand on these TRAP cell type-specific study findings, we next performed single nuclear RNA-sequencing (snRNA-Seq) of striatal cells in R6/2 and zQ175DN HD model mice of the same age as used for the TRAP studies by generating nuclear droplet-based profiles (Fig. 1 and STAR Methods). SnRNA-Seq reported gene expression differences are mostly determined by differential representation of untranslated region polyadenylated nuclear reads, and thus provides an independent view of gene expression dysregulation to that reported by our TRAP studies. We used our ACTIONet framework (Mohammadi et al., 2019) to identify major cell types in the striatum across the replicate transgenic or control samples in each case. Using a curated set of marker genes we recovered major expected cell types in the striatum, including dSPNs, iSPNs, Sst/Npy-expressing GABAergic interneurons, Pvalb-expressing GABAergic interneurons, Chat-expressing cholinergic interneurons, astroglia, oligodendrocytes, oligodendrocyte precursor cells (OPCs), and microglia; in addition we recovered other, rarer known cell types such as blood brain barrier endothelial and mural cells, and, since the subventricular zone was included in the striatal dissection, ciliated ependymal cells, secretory ependymal cells, cycling cells, and migrating neuroblasts (Fig. 4A–B, Fig. S8, and STAR Methods). Additionally, the recovered Foxp2/Olfm3-expressing neuron cluster represents a distinct neuron subtype that is characterized by expression of Foxp2, Olfm3, Adarb2, and Otof and likely represents the same striatal neuronal subtype recently characterized in other studies as expressing Otof and Olfm3 (Martin et al., 2019; Saunders et al., 2018). Of note, our recent studies suggest that Foxp2 can bi-directionally modulate HD-like phenotypes in HD mouse models (Hachigian et al., 2017), and thus it is possible that this newly defined neuron population underlies those reported effects.
Figure 4. Cell type-specific analysis of gene expression changes in striatal cell types of the R6/2 and zQ175DN models of HD by single nuclear RNA-Sequencing (snRNA-Seq).
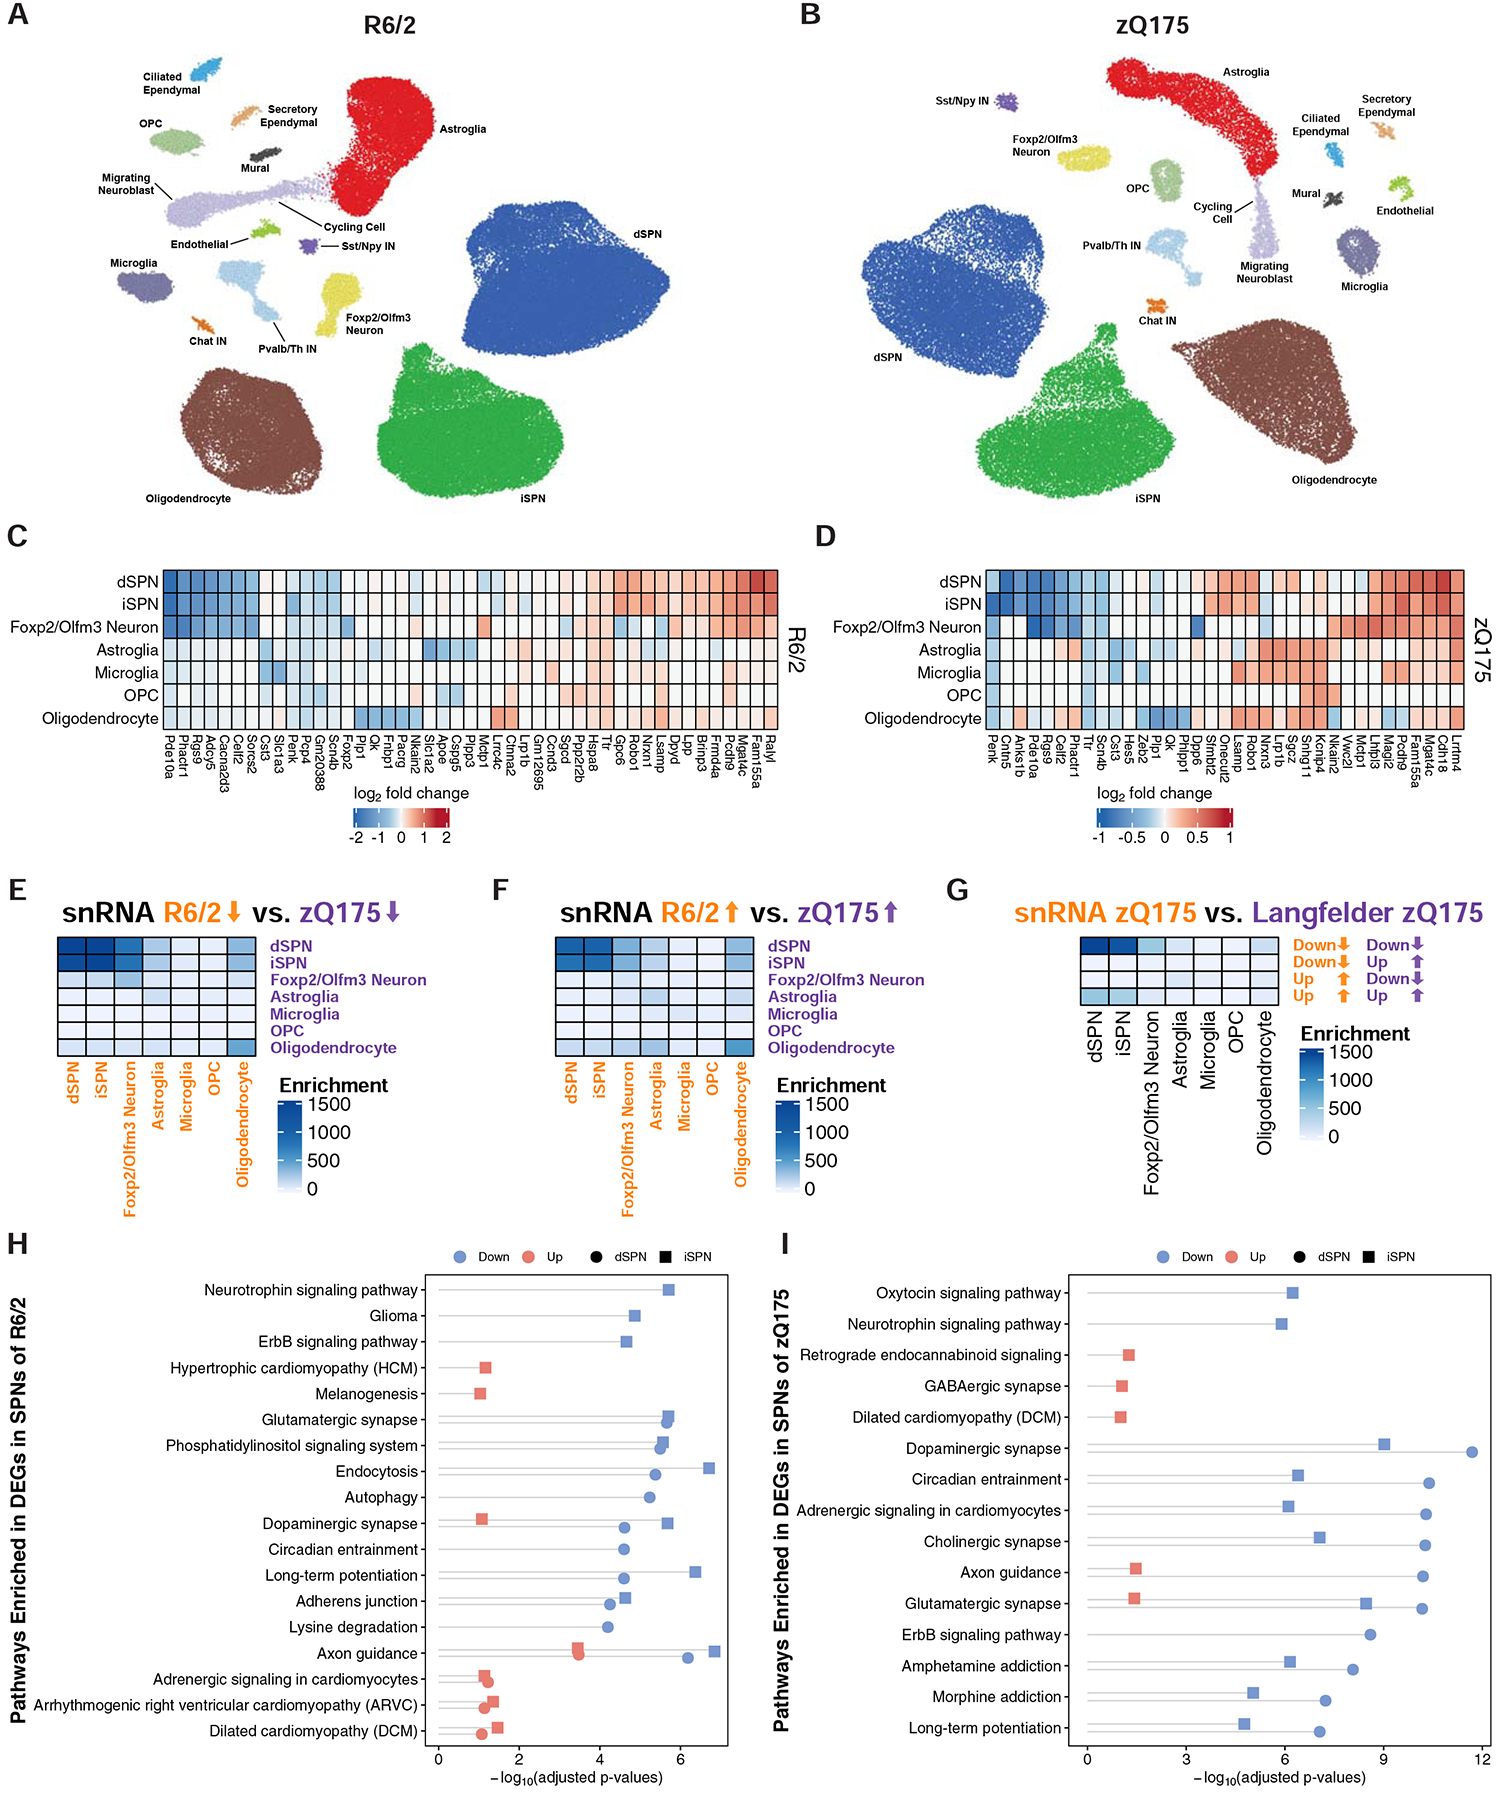
(A-B) Two-dimensional ACTIONet graphs of the major annotated cell types in the R6/2 (A) and zQ175DN (B) mouse models of HD (n = 108,467 nuclei across fifteen mice: eight isogenic control and seven R6/2 model mice, all at 9-weeks of age; n = 50,643 nuclei across eight mice: four isogenic control and four zQ175DN model mice, all at 6-months of age). Top five most downregulated and upregulated protein-coding genes by log2-fold change in the most abundant striatal cell types in the R6/2 model vs. control (C) or zQ175DN vs. control (D) comparisons. Significance of the overlap between cell type-specific (E) downregulated and (F) upregulated genes of snRNA-Seq-identified cell types across mouse models (Fisher’s exact test −log10-adjusted p-value). (G) Significance of overlap between downregulated and upregulated genes identified by snRNA-Seq and bulk RNA-Seq from the cited Langfelder et al. study in the zQ175DN model. The overlaps were assessed using Fisher’s exact test and −log10-adjusted p-values are reported. KEGG pathway analysis of downregulated and upregulated genes in dSPNs and iSPNs in the R6/2 (H) and zQ175DN (I) models, represented with Fisher’s exact test −log10-adjusted p-value.
We compared gene expression in HD model vs. control striatum for all sufficiently abundant cell types (STAR Methods), which revealed differentially expressed genes (DEGs) in dSPNs, iSPNs, Foxp2/Olfm3-neurons, astroglia, microglia, OPCs, and oligodendrocytes, as well as other striatal cell types in response to either form of mHTT at these HD model timepoints (Fig. 4C–D, Fig. S9, and Table S2). As predicted from our TRAP studies, most of the striatal cell types studied by snRNA-Seq, including oligodendrocytes, displayed downregulation of several SPN marker genes (Table S2), suggesting that mHTT affects at least some common transcriptional regulator(s) that are present across all of these striatal cell types, including glial cells. Comparison of all DEGs across cell types and across models revealed that iSPNs and dSPNs showed the most similar transcriptional responses for both downregulated and upregulated genes, and that genes upregulated in oligodendrocytes showed the next closest, but lower, similarity (Fig. 4E–F). These striking results indicate that dSPNs and iSPNs display very similar responses to both an exon 1 fragment of mHTT and a full length knockin mHtt with the same repeat size, but that this similarity in responses is largely not the case for the other cell types studied by snRNA-Seq. Comparison to previously published total striatal RNA-Seq data again revealed a high degree of overlap with SPN changes, but to a lesser extent other cell type changes (Fig. 4G). Pathway analysis of genes altered in expression in dSPNs and iSPNs (Fig. 4H–I) revealed similar pathways as had been seen in our TRAP analysis (Fig. S6). Analysis of predicted transcriptional regulators using the ChEA framework (Lachmann et al., 2010) identified the Rarb and Wt1 genes as potential key regulators for the observed downregulated gene expression alterations in SPNsof both mouse models, while the ACTIONet (Mohammadi et al., 2019) framework (STAR Methods) identified the Npas2, Rarb, and Egr3 genes as potential key regulators of downregulated genes in SPNs of the R6/2 model, as well as the Atf6 and Foxp1 genes as potential key regulators of downregulated genes in SPNs of the zQ175DN model (Fig. S10). This link to Npas2 may account in part for the observed circadian entrainment pathway gene changes in these HD model contexts (Fig. 4H) (Musiek et al., 2013). Finally, to evaluate the reproducibility of our gene expression results and assess their potential dependency on technological biases, a cross-mouse-model/cross-platform comparison (R6/2 vs. zQ175DN; TRAP vs. snRNA-Seq) was performed. To assess the overlap of the differentially expressed genes that were identified independently, Fisher’s exact test (one-sided hypergeometric test) was used to demonstrate the consistency of identified genes in iSPNs and dSPNs across both models and platforms (Fig. S11A–D). Clustering of identified genesets (Fig. S11E) revealed groups of high similarity matching upregulated and downregulated genes across both models and both technologies. Taken together, our snRNA-Seq data confirms our TRAP findings for dSPNs and iSPNs across mouse models, while additionally identifying distinct gene perturbations across other cell types cells between the two mouse models.
Cell Type-Specific Gene Expression Profiling by snRNA-Seq of HD
To expand these HD model studies to affected cells in the human HD caudate and putamen (striatum), we further performed snRNA-Seq studies on caudate and putamen cells from grade 2–4 human HD and matched control caudate and putamen cells (Fig. 1 and STAR Methods). Network-based clustering (Mohammadi et al., 2019) recovered major expected cell types seen in the mouse striatum, but we additionally uncovered much rarer cell types in the human caudate and putamen samples [e.g. T cells (Smolders et al., 2018)] (Fig. 5A). Our analysis also revealed that dSPNs and iSPNs became less distinct SPN subtypes in the human HD caudate and putamen, as compared to the case in the control tissue SPNs (Fig. S12). As expected (Gerfen, 1992), dSPNs and iSPNs contributed approximately equally to the SPN population in control tissue, but the number of iSPNs decreased with human HD grade progression (Fig. 5B), confirming reports of enhanced iSPN vulnerability in human HD that were based upon marker gene expression studies (Albin et al., 1992), and suggesting that proportion of iSPN vs. dSPN loss as measured by snRNA-Seq may serve as a qualitative method for human HD grading. We compared gene expression in the HD vs. control caudate and putamen for all sufficiently abundant cell types (STAR Methods), which revealed DEGs for neuronal and glial cell types as well as endothelial and mural cells (Fig. 5C, S9, and Table S2). As with the HD mouse model data, several striatal cell types studied by snRNA-Seq displayed downregulation of several SPN marker genes (Table S2). Analysis of protein-coding genes revealed that TAC1, a marker of striatal striosomes, was among the most downregulated genes in dSPNs (Fig. 5C). Huntingtin interacting protein 1 (HIP1) and junctophilin 4 (JPH4), which is co-expressed with and may function in a coordinated manner with JPH3 (CTG/CAG repeat expansions in which cause Huntington’s disease-like-2 disease) in neurons (Nishi et al., 2003), were among the downregulated genes in dSPNs and iSPNs (Fig. 5C). DHFR and LINGO1 were among the most upregulated genes in dSPNs and iSPNs (Fig. 5C), however these genes were also reported to be highly upregulated in a recent study of Alzheimer’s disease human tissue (Mathys et al., 2019) and as such these very top tier upregulated genes may represent genes that are commonly upregulated in multiple diseased states due to cellular stress. Comparison to previous total RNA studies (Hodges et al., 2006) revealed highest overlap to downregulated genes in SPNs in our study (Fig. 5D), and analysis of reactive astroglia markers (Liddelow et al., 2017) revealed a molecular signature of pan-reactive, and some A1- or A2-reactive, astroglial markers in the HD striatal astroglia data (Fig. 5E; for direct comparison, it is shown here side-by-side that the HD mouse model striatal astroglia do not show this same signature). Analysis of our data also revealed a large upregulation of mitochondrial-encoded RNAs (mtRNAs) in iSPNs and dSPNs (with higher upregulation in iSPNs), and to a lesser extent microglia (Fig. 5F and Fig. S13–S14). The mouse model snRNA-Seq and TRAP data also revealed upregulation of mouse mtRNAs in iSPNs of both the R6/2 and zQ175DN models, an upregulation which showed model age- and CAG-length dependency in the TRAP data (Fig. 5F and Table S1). At a pathway level, many terms related to synaptic function were among the differentially expressed genes in both dSPNs and iSPNs (Fig. 5G). Analysis of transcriptional regulators using ChEA revealed Kdm5b, Crem, Foxo3, and Vdr to be among potential master regulators (Fig. 5H), while similar analysis using the ACTIONet framework implicated several other genes as top predicted regulators (Fig. S15A–B). Finally, unbiased comparison of HD caudate and putamen dysregulated genes to genes linked to SNPs associated with earlier HD age-of-onset (Consortium., 2019) revealed that several of these SNP-linked genes, including TCERG1, PMS1, FAN1, MSH3, and MLH3, were downregulated in dSPNs and iSPNs (Fig. S15C), but future studies will be needed to correlate these findings by human HD grade, and thus to human HD disease progression, especially as our HD mouse model data suggest an increase to DNA mismatch repair gene expression at the phenotypic timepoint studied in the R6/2 model, which may reflect an earlier human HD ‘grade’ than used here.
Figure 5. Cell type-specific analysis of gene expression changes in caudate and putamen cell types in control and HD post-mortem tissue by single nuclear RNA-Sequencing (snRNA-Seq).
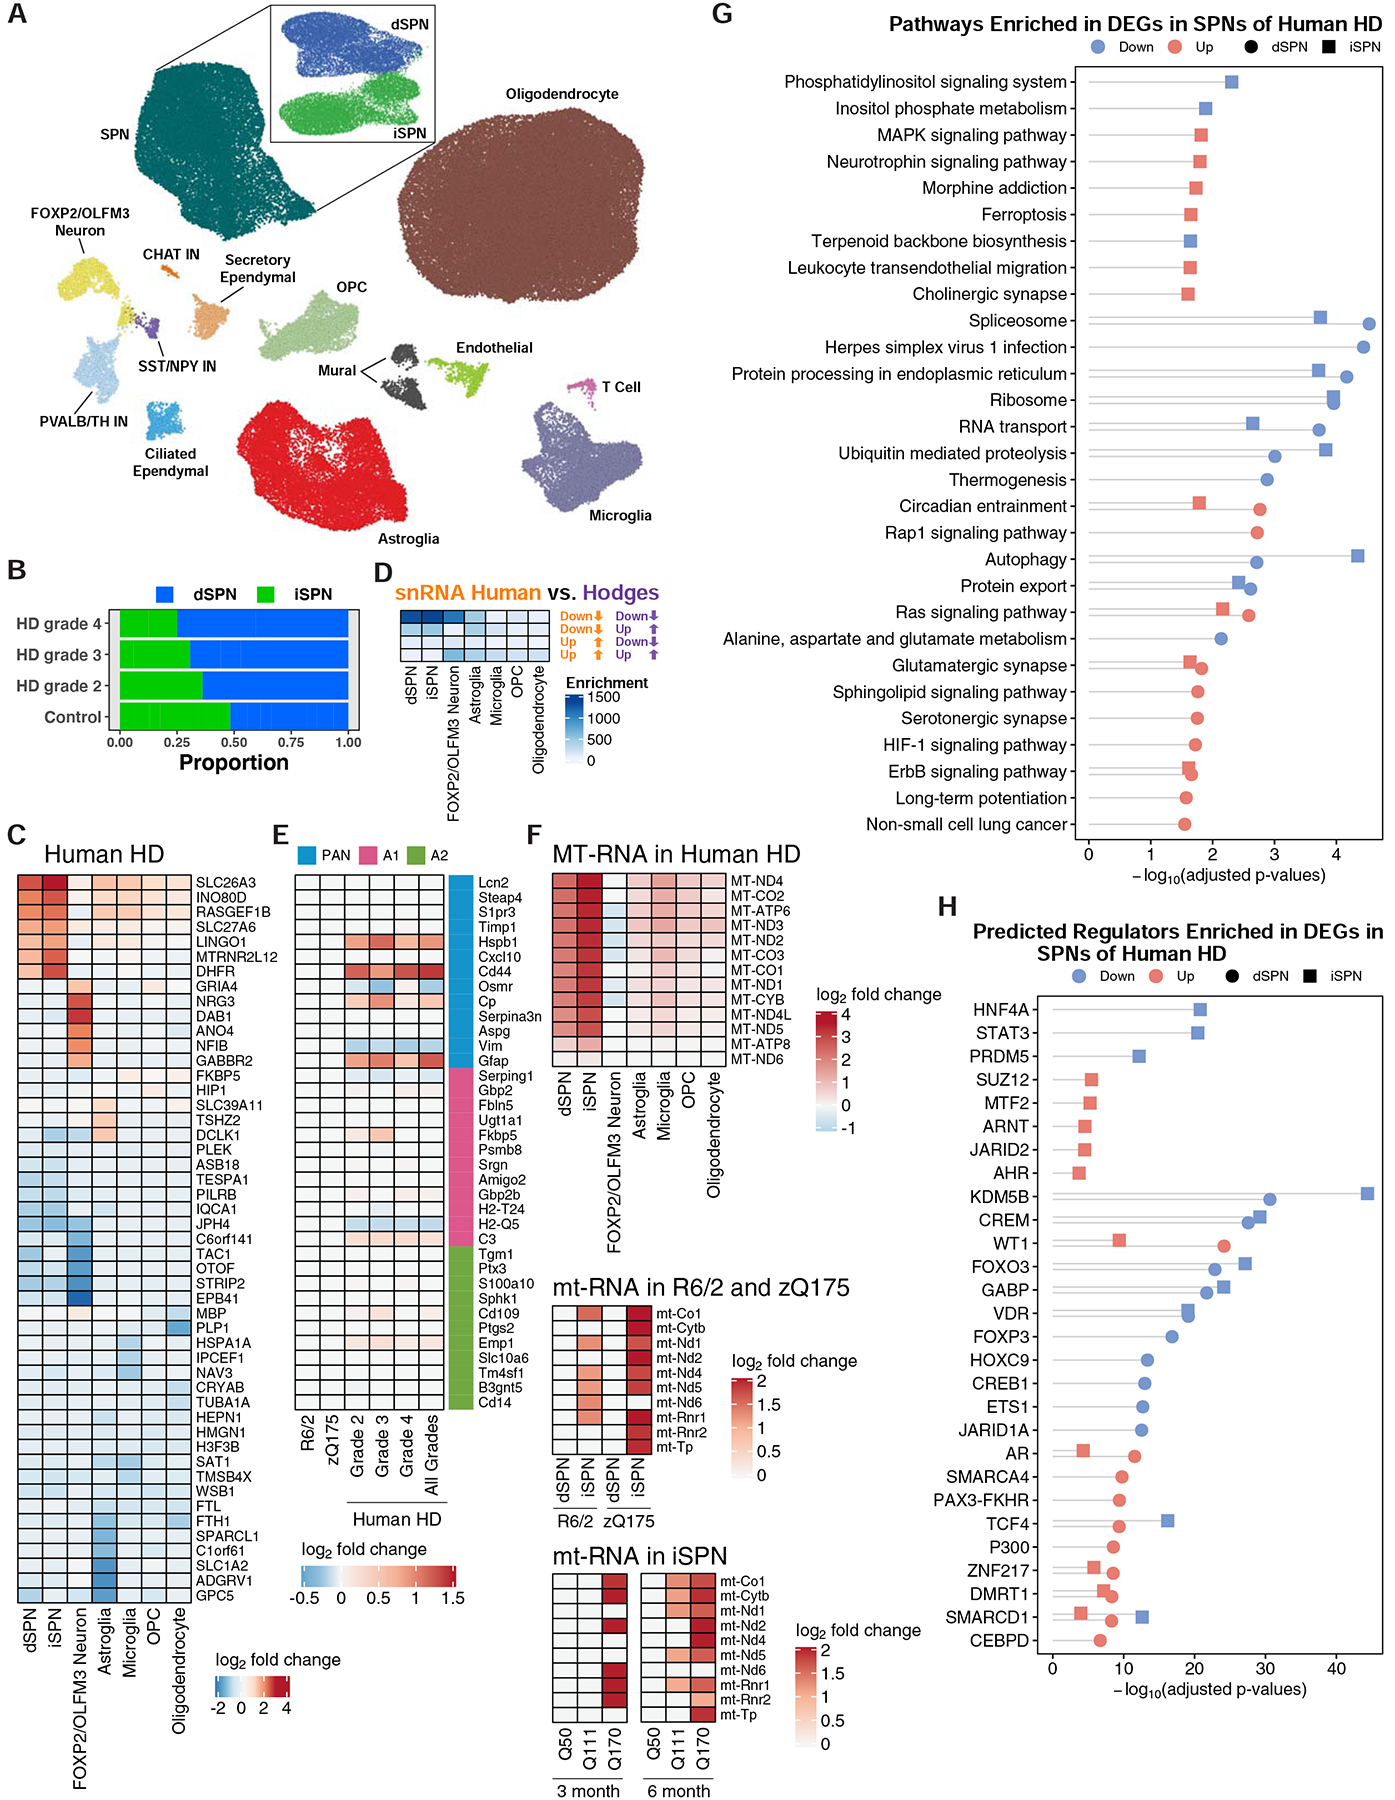
(A) Two-dimensional ACTIONet graphs of the recovered cell types in control and HD samples (n = 125,467 nuclei across fourteen unaffected control and fourteen HD caudate and putamen samples, samples described in Table S2). Subpanel: subACTIONet graph of SPN subtypes. (B) Average fraction of dSPNs vs. iSPNs across grades of HD relative to control samples. (C) Top five most downregulated and upregulated protein-coding genes by log2-fold change in the most abundant striatal cell types. (D) Significance of overlap between downregulated and upregulated genes identified by this snRNA-Seq study to total striatal data from the cited Hodges et al. study (Fisher’s exact test and −log10-adjusted p-values). (E) Differential expression of reactive astroglia marker genes in astroglia across grades of human HD but not mouse models of HD. (F) Upregulation of mtRNAs in major striatal cell types in human HD by snRNA-Seq and in R6/2 and zQ175DN mouse models by TRAP. D-F: Overlaps were assessed using Fisher’s exact test and −log10-adjusted p-values are reported in the heatmap. (G) KEGG pathway analysis of genes downregulated and upregulated in dSPNs and iSPNs, represented with Fisher’s exact test −log10-adjusted p-value. (H) Predicted transcriptional regulators, by ChEA analysis, of genes that were downregulated and upregulated across dSPNs and iSPNs, represented with Fisher’s exact test −log10-adjusted p-value.
To reveal the overall correlations between the gene expression changes in mouse HD model vs. human HD snRNA-Seq data, we computed Pearson’s correlation between human and mouse model cell type-specific, batch-corrected profiles (STAR Methods). The profile of perturbed genes in dSPNs, iSPNs, FOXP2/OLFM3-neuron, and astroglia of the human HD dataset exhibited substantial similarities with these cell types in both of the mouse models, but the correlations were lower when comparing other cell types such as microglia and oligodendrocytes (Fig. S16A–G). Thus, at the model timepoints and HD grades studied here, both mouse models recapitulate many of the SPN, FOXP2/OLFM3-neuron, and astroglial molecular changes that occur in human HD, but there may be less overall face validity between mouse models and human HD when considering other striatal cell types such as microglia, oligodendrocytes, and OPCs.
Mitochondrial dysfunction accompanied by mtRNA release in SPNs
mtRNAs were among the most upregulated genes in our HD snRNA-Seq data, as well as in our TRAP mouse model HD data (Fig. 5F). This does not reflect background contamination of the nuclei used for snRNA-Seq with non-specific mtRNA upon tissue lysis, as these reads were upregulated most highly in dSPNs and iSPNs, as opposed to all cell types (Fig. 5F and Fig. S13). Further, when considering the mouse model data, as the TRAP methodology purifies cytoplasmic ribosome-translated mRNAs that are nuclear encoded, and not mtRNAs that are sequestered in the mitochondria, the presence of mtRNAs loaded onto cytoplasmic ribosomes (an energy-dependent process) indicates a loss of mtRNA mitochondrial restriction in vivo that results from mitochondrial dysfunction (Dhir et al., 2018). To assess whether mtRNA release was occurring at an even earlier disease model timepoint, as opposed to being potentially solely a later secondary phenomenon, we profiled iSPNs in the allelic series HD models at a 3-months of age timepoint (Table S1). At this timepoint, there was also an increase in iSPN cytoplasmic mtRNAs as reported by TRAP, indicating that even at this early, 3-month model timepoint that displays very little gene expression dysregulation (119 total genes dysregulated in Q170 vs. Q20 iSPNs, Table S1), iSPNs display early, cell type-specific mtRNA release. In considering the possible mechanisms that might underlie this mtRNA release, we noted that our TRAP HD model data revealed that OXPHOS gene expression was reduced, as summarized in Fig. 6A by OXPHOS pathway. We validated that this reduction to gene expression resulted in a reductionto OXPHOS functional activity from age-matched mouse model tissue (Fig. 6B). To consider other mitochondrial-related pathways that could be causes of mtRNA release in an unbiased manner, we further performed a WGCNA analysis across the 3- and 6-month cell type-specific allelic series TRAP iSPN data. This analysis revealed a gene module (‘coral1’), enriched for genes with a role in OXPHOS function, that was both downregulated in a CAG-length dependent fashion and associated with model age (Fig. S17A–D). This association with model age (starting from an early 3-month disease model timepoint) further suggested a mechanistic link between mtRNA release and reduction to OXPHOS gene expression. Based upon these results, we looked specifically at the expression of OXPHOS mRNAs in our human snRNA-Seq data and observed here as well downregulation of many OXPHOS mRNAs (Fig. 6C). In the human HD snRNA-Seq data, however, the results were not as cell type-specific as those reported by TRAP in HD mouse models. This may be because of the lower ‘severity’ of all HD disease models in mice, or that there is an element of mRNA translation regulation (as opposed to mRNA transcription regulation only) for these OXPHOS mRNAs that only TRAP would reveal. In support of the latter, there is emerging evidence that mammalian nuclear-encoded OXPHOS mRNAs are regulated at the translational level (Schatton et al., 2017). In any case, based on the co-occurrence of the phenomenology, these data raise the possibility that decreases to OXPHOS function can lead directly, or indirectly, to the release of mtRNAs.
Figure 6. Mitochondrial oxidative phosphorylation pathway mRNAs are downregulated in SPNs of the R6/2 and zQ75DN models, as well as SPNs of HD tissue.
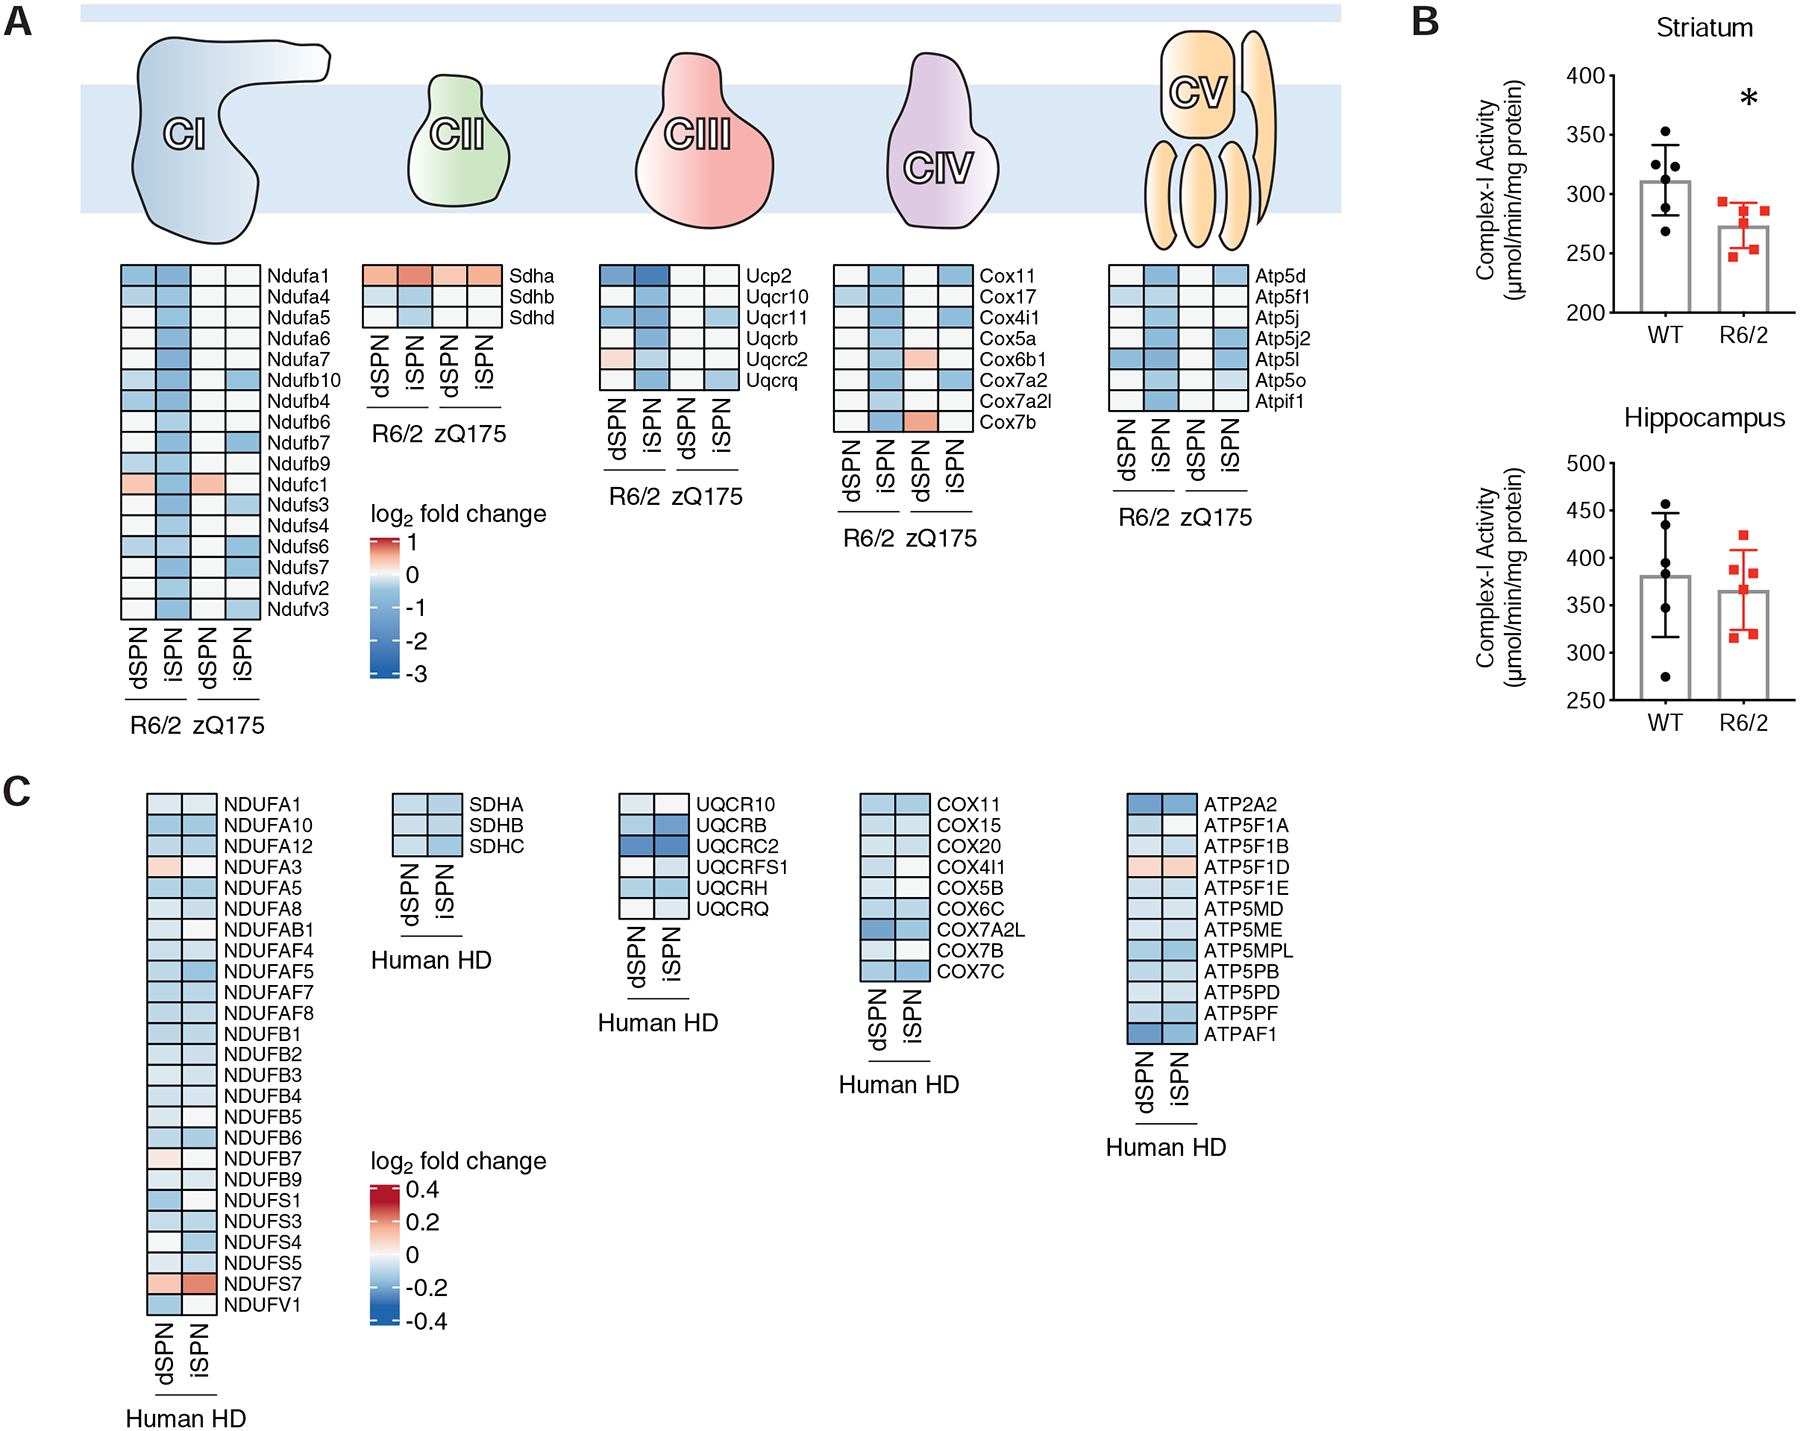
A. Schematic of the OXPHOS component complexes, with log2-fold change heat maps depicting altered expression of OXPHOS component mRNAs in dSPNs or iSPNs of the R6/2 model at 9-weeks of age or the zQ175DN model (compared to the Q20 control) at 6-months of age. B. OXPHOS Complex I activity measurement from whole R6/2 tissue at 9-weeks of age (top panel: striatum; bottom panel: hippocampus control). C. Heatmaps depicting altered expression of OXPHOS component mRNAs in dSPNs or iSPNs of human HD tissue.
Activation of innate immune signaling by mHTT and inhibition of mitochondrial function
As cytoplasmic mtRNAs have been shown to be highly immunogenic triggers of cytoplasmic innate immune sensors that activate a type I interferon response in human cells (Dhir et al., 2018), we next assessed whether innate immune signaling pathways were upregulated in iSPNs. Many interferon-responsive genes were selectively upregulated in iSPNs, the cell type where the mtRNA release was highest (Fig. 7A), and type I interferon itself was elevated in the striatum of both R6/2 and zQ175DN knockin mice (Fig. 7B). We next confirmed the presence and activation of PKR in HD model striatum, as PKR has been recently shown to be a sensor of endogenously released cytosolic mtRNAs (Kim et al., 2018). In the striatum of both R6/2 and zQ175DN knockin mice, not only was PKR upregulated (Fig. 7C), but also phosphorylated (Fig. 7D), which is indicative of activation. Basal PKR expression in control tissue was observed only in non-neuronal cells (presumably glial cells as previously reported), but in an HD model context PKR could also be detected in neuronal cells (Fig. 7E). We next assessed whether mtRNAs could be directly purified with PKR from HD model striatal tissue. Immunoprecipitation of PKR and analysis of bound RNAs (STAR Methods) revealed an increase in mtRNA binding to PKR in the presence of mHTT (Fig. 7F). To assess whether mtDNAs (in addition to mtRNAs) were also released in the presence of the exon 1 fragment of mHTT, we tested for the presence of mtDNAs in the cytosol of HD model tissue, and noted that this form of mHTT also promotes the accumulation not only of cytosolic mtRNA, but also of cytosolic mtDNA (Fig. S18A–B). Finally, in assessing whether there may be any striatal enriched factors that promote innate immune signaling in HD, we noticed that translocase of outer mitochondrial membrane 70 (TOMM70), which facilitates MAVS and TBK1/IRF3 signaling and interferon induction upon binding of cytosolic foreign RNAs (Liu et al., 2010) is itself a striatal enriched protein [(Heiman et al., 2008) and Fig. S18C]. Since overexpression of TOMM70 alone is sufficient to potentiate innate immune signaling (Liu et al., 2010), its higher expression in striatum may lead to high levels of SPN innate immune signaling upon mtRNA release.
Figure 7. PKR-mediated innate immune pathways are activated by mHTT.
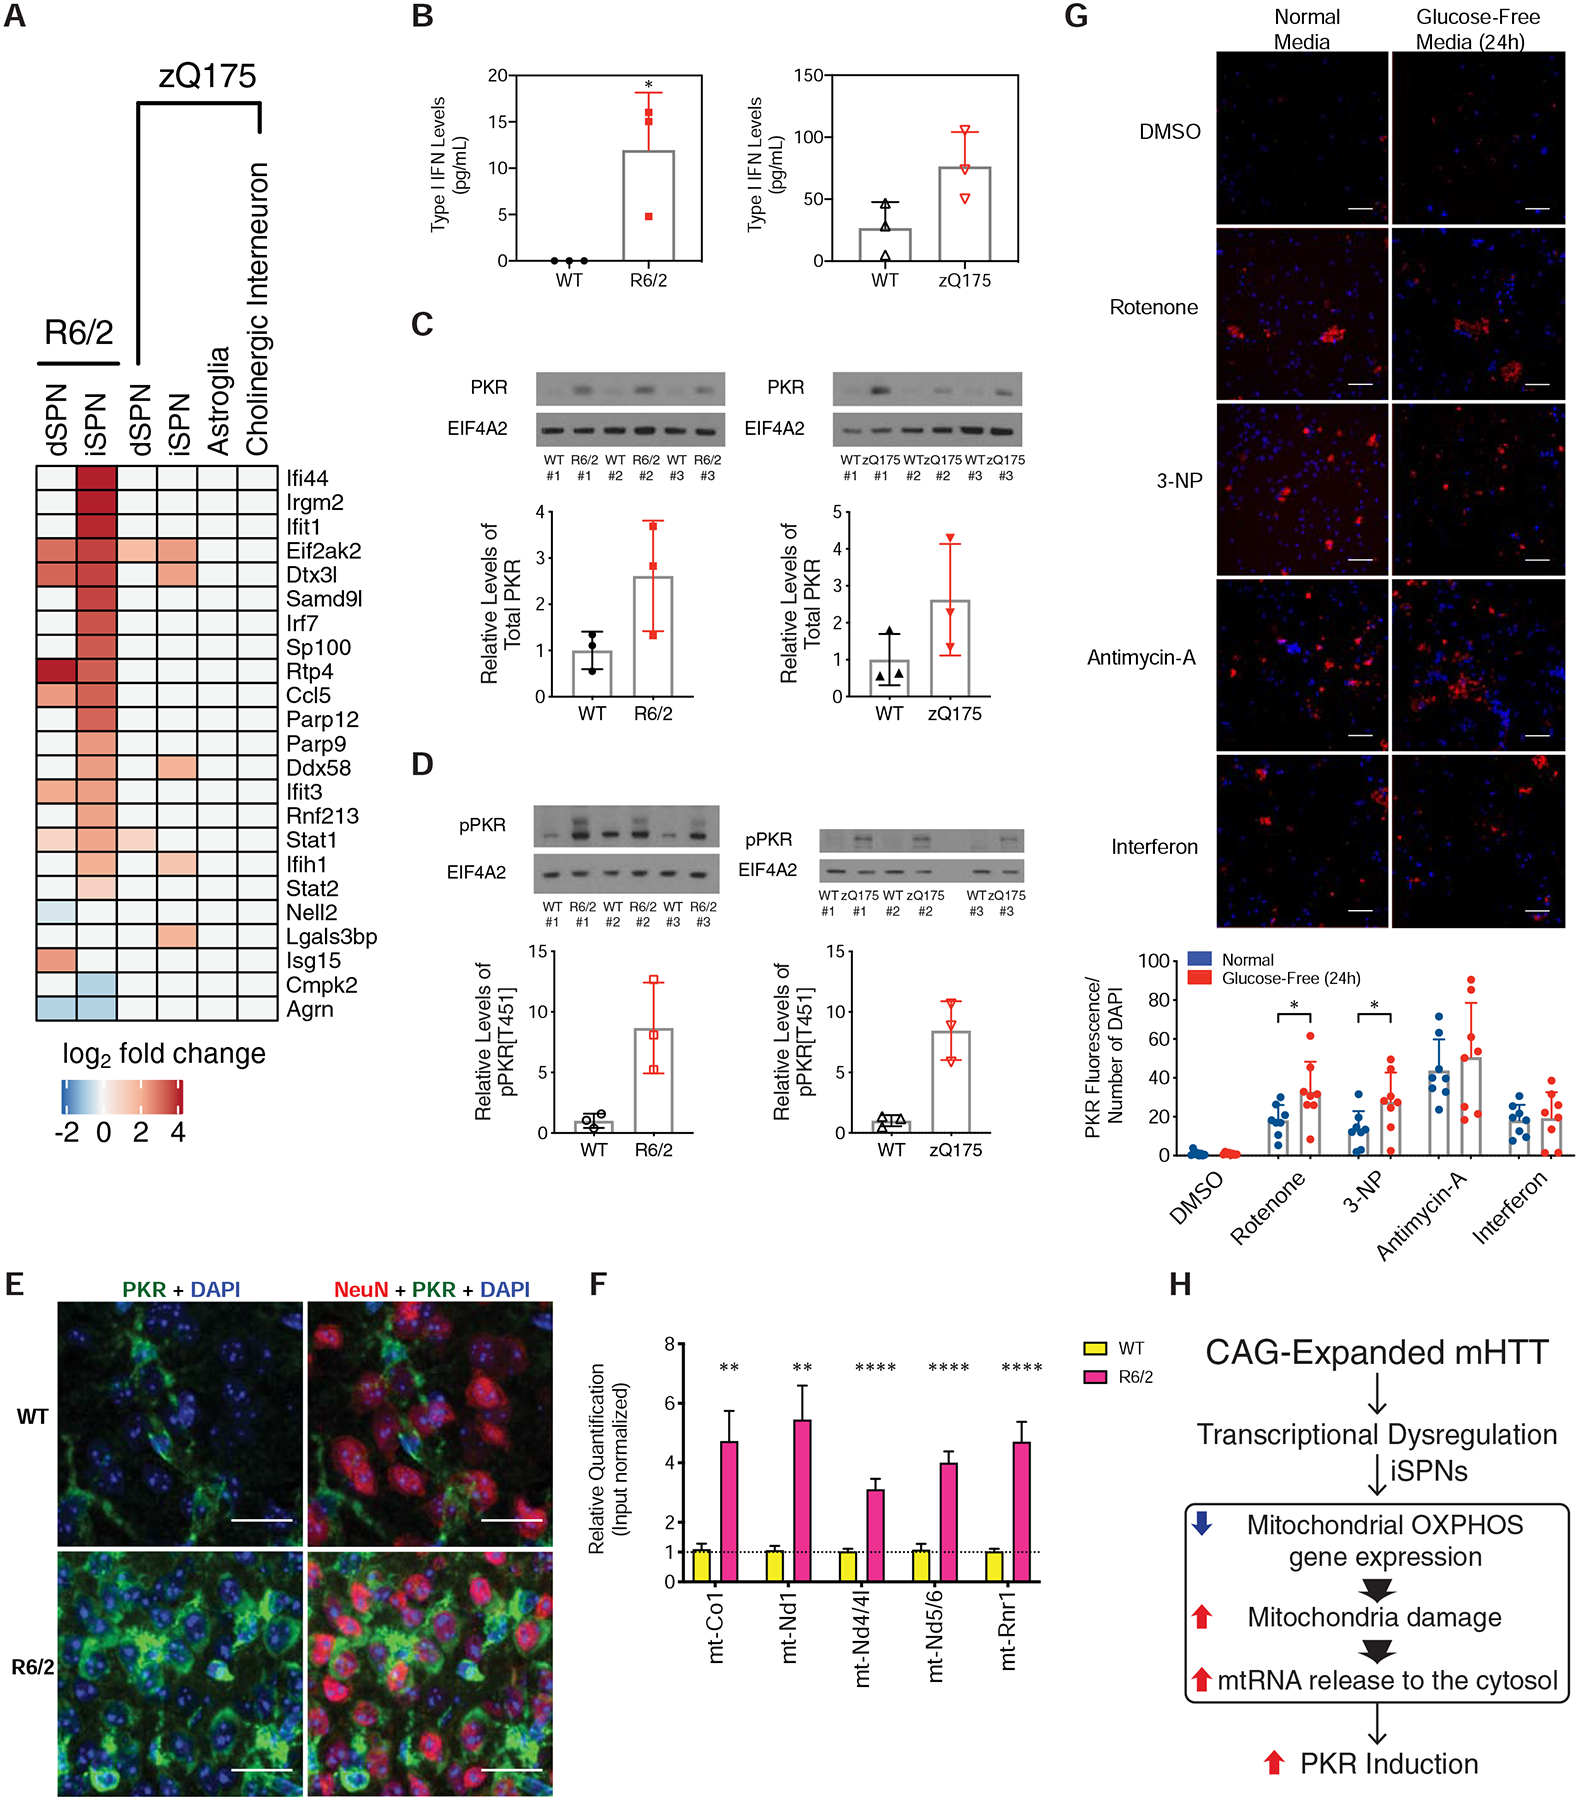
(A) Heatmap of expression of known interferon-stimulated genes and antiviral signaling factors related to innate immune signaling (West et al., 2015) in our TRAP data. (B) Interferon ELISA assay results from whole striatal tissue from the R6/2 model at 9-weeks of age (left panel) or the zQ175DN model at 23-months of age (right panel). (C) Western blot analysis of total PKR levels in whole striatal tissue from the R6/2 model at 9-weeks of age (left panel) or the zQ175DN model at 23-months of age (right panel). (D) Western blot analysis of phospho-PKR levels in whole striatal tissue from the R6/2 model at 9-weeks of age (left panel) or the zQ175DN model at 23-months of age (right panel). (E) Indirect immunofluorescent staining against NeuN (red pseudocolor), total PKR (green pseudocolor), and DAPI (blue pseudocolor), in the R6/2 and isogenic control striatum at 9-weeks of age, 40X magnification. Scale bar is 20 μm. (F) Quantitative PCR (qPCR) of mtRNAs associated with PKR after immunopurification of PKR from cytosolic extracts of either R6/2 or isogenic control striatum. (**) denotes p-value < 0.0021; (****) denotes p-value < 0.0001; multiple t-test using the two-stage linear step-up procedure of Benjamini, Krieger and Yekutieli, with Q = 1%. (G) Top panel: representative images of indirect immunofluorescent staining against total PKR (red pseudocolor) and DAPI (blue pseudocolor), in cultured day in vitro 14 iPSC-derived induced human neurons treated with DMSO vehicle control, 30 mg/mL interferon-β (a positive control treatment known to induce PKR) or mitochondrial oxidative phosphorylation inhibitors [50 nM Complex I inhibitor rotenone, 10 μM Complex II inhibitor 3-nitropropionic acid (3-NP), and 1 μM Complex III inhibitor antimycin-A] in both normal media containing either glucose-containing media or glucose-free media to increase dependency upon OXPHOS function. Scale bar = 0.45 mm. Bottom panel: quantitation across 8 images in each condition, * = p-value < 0.05, two-tailed Student’s t-test. (H) Model for innate immune activation by mutant HTT (mHTT). mHTT can induce transcriptional dysregulation in several cell types. In iSPNs, mHTT leads to a reduction in oxidative phosphorylation gene expression, which along with other mitochondrial insults leads to mitochondrial damage and release of innate immunogenic mtRNAs into the iSPN cytosol. These released mtRNAs then bind to PKR, triggering a high level of innate immune activation in iSPNs.
In order to assess whether inhibition of the mitochondrial OXPHOS activity itself could also lead to PKR expression, in the absence of mHTT, we tested the effects of Complex I, Complex II, and Complex III inhibition by the addition of rotenone, 3-nitropropionic acid (3-NP), and antimycin-A, respectively to NGN2-induced normal (non-HD) human neurons in vitro (STAR Methods). Assays were performed in culture media containing glucose or else in glucose-free media, which shifts cells to rely more on OXPHOS activity for the generation of ATP (Crabtree, 1935). Compared to control treatment, interferon treatment induced PKR expression as expected (Dedoni et al., 2010), in a manner that was independent of carbon source (Fig. 7G). Complex I, II, and III inhibition also induced PKR expression, and the effects of both Complex I and II inhibition were accentuated by culture in glucose-free media (Fig. 7G). These data demonstrate that direct chemical inhibition of mitochondrial OXPHOS activity in human neurons, phenocopying the genetic effect of mHTT on OXPHOS expression revealed by TRAP, can also induce PKR expression.
DISCUSSION
Transcriptional changes and dysregulation have long been associated with HD (Benn et al., 2005; Hodges et al., 2006; Saudou et al., 1998), but cell type-specific studies of gene expression across striatal cell types in HD models and human HD have been difficult to perform due to the technical challenges posed by the diversity of intermingled striatal cell types. By studying HD mouse models with TRAP and snRNA-Seq, and human HD tissue samples with snRNA-Seq, we reveal both non-cell type-specific and cell type-specific responses that are induced by mHTT and implicate OXPHOS gene downregulation, mtRNA release, and innate immune signaling activation as phenomena that may contribute to the enhanced sensitivity of iSPNs to mHTT.
Our profiling studies (Fig. 1–5) indicate that while dSPNs, iSPNs, Foxp2/Olfm3-neurons, and astroglia of both the R6/2 and zQ175DN mouse HD models recapitulate many of the gene expression changes occurring in these cells of grade 2–4 human HD tissue, this is less so for other cell types such as microglia, oligodendrocytes, and OPCs (Fig. S16). Although astroglia shared changes between the mouse models and human HD, many reactive astroglial markers were upregulated in human HD astroglia but not in mouse HD model astroglia (Fig. 5E). Our deepest profiling (TRAP) data in mouse models of HD suggest that a combination of non-cell type-specific responses (e.g. synaptic and circadian clock gene dysregulation) and cell type-specific responses (e.g. OXPHOS gene downregulation) may render iSPNs more sensitive to mHTT. Our mouse model data additionally reveal that corticostriatal projection neurons (CStrPNs) display a molecular response to mHTT that has similarities to those responses seen in striatal SPNs, an observation that may underlie reports of CStrPN dysfunction in mouse models of HD. Moreover, our human HD studies suggest an enhanced loss of striatal striosome markers and a grade-dependent loss of iSPN vs. dSPN numbers among the surviving SPNs, and we note that several genes near to age-of-onset modifier SNPs identified by the GeM-HD Consortium were altered in expression in dSPNs and iSPNs of human HD tissue. However, much larger-scale snRNA-Seq human HD studies will be needed to correlate these findings by human HD grade, and thus to human HD disease progression, as well as to more fully characterize gene expressions changes present in the rarer cell types studied here. With regard to regulators of the transcriptional changes observed in this study, we implicate Rarb as one of the top predicted regulators of the transcriptional downregulation observed across HD models. These data combined with that of another recent study (Niewiadomska-Cimicka et al., 2017) suggest that pharmacological activation of Rarb activity (Chen et al., 1995; Germain et al., 2004) may present a unique druggable transcription factor target for HD therapeutics. Our analyses also predict other transcriptional regulators that, in addition to Rarb, may account for many of the gene expression changes observed in mouse models of HD and human HD, but ATAC-Seq, ChIP-Seq, and transcription factor knockout studies will be needed to extend and confirm these predictions and correlations and to test the impact of altered functions of these transcription factors on HD model progression.
We observed in mouse models of HD and in human HD a decrease to nuclear-encoded OXPHOS mRNA gene expression (Fig. 6), accompanied by a release of mtRNAs from mitochondria in the most HD vulnerable cell type, iSPNs, followed by dSPNs, and note that in the mouse models this mtRNA release is both mouse HD model age and CAG-length dependent (Fig. 5). MtRNA has recently been shown, in addition to mtDNA, to be a potent mitochondrial-derived innate antiviral signaling immunogen (Dhir et al., 2018) and to be bound directly by the innate immune sensor PKR (Kim et al., 2018). In accordance with these findings, we observed that an upregulation of innate immune signaling pathway genes, as well as increased PKR levels and PKR activation, are both concomitant with mtRNA release, and we additionally provide evidence for direct binding of released mtRNAs by PKR (Fig. 7). We further show that pharmacological reduction of OXPHOS activity can lead to PKR upregulation in human neurons in culture in the absence of mHTT by treatment of neurons with OXPHOS chemical inhibitors alone (Fig. 7). This finding is similar to the reported observation that mild impairment of oxidative metabolism by dietary-induced thiamine deficiency alone leads to PKR activation in mice (Wang et al., 2007), in this case also in the absence of mHTT. It is worthwhile to note that both human pediatric dietary thiamine deficiency and Biotin-Thiamine-Responsive Basal Ganglia Disease have been linked to lesions of the basal ganglia (Alfadhel et al., 2013; Kornreich et al., 2005), as has been Aicardi-Goutières syndrome, an autoinflammatory disorder that displays inappropriate activation of innate immune signaling and constitutive upregulation of type I IFN-induced signaling (Crow and Manel, 2015). These non-HD human disorders that are characterized by striatal cell death extend the significance of our findings, by linking both the oxidative metabolism deficits and autoinflammatory activation phenomena described here directly to human striatal cell death absent the mHTT context. PKR activation in an autoinflammatory context has been directly linked to cell death (Chung et al., 2018). This toxicity in striatal neurons could be due not only to PKR-mediated translational shutdown (Chung et al., 2018) but also possibly to increases to repeat associated non-AUG (RAN) translation (Banez-Coronel et al., 2015) that activated PKR may likely mediate (Cheng et al., 2018; Meurs et al., 1992).
It is possible that the mechanism underlying mtRNA release by mitochondria is through Bcl2-associated X protein (Bax)–Bcl-2 homologous antagonist/killer (Bak), as has been shown for mtDNA release (Rongvaux et al., 2014; White et al., 2014). It is important to note that we also detected mtDNA release in the R6/2 model at the whole tissue level, although we did not have a cell type-specific assay for mtDNA release, as mtDNA would not be bound by the cell type-specific TRAP-tagged ribosomes (whole tissue data are presented in Fig. S18). Future studies will be needed to assess the possible contribution of cell type-specific cGAS/STING-dependent signaling in potentiating the mHTT-induced innate immune response, as well as the relevance of TOMM70 (a facilitator of innate immune signaling) striatal enrichment (Fig. S18) to SPN enhanced vulnerability in human HD.
In conclusion, our unbiased gene expression studies across mouse models of HD and human HD not only create a first catalog of the cell type-specific molecular changes induced by various forms of mHTT, but also reveal mtRNA release from mitochondria and innate immune activation in neurons in the context of mHTT (model presented in Fig. 7H). Future profiling studies, utilizing a much large number of human HD samples, will be needed in order to correlate gene expression changes to HD progression across all HD grades, extend our findings, and to better profile less abundant cell types. Future work aimed at understanding the regulators of the transcriptional changes documented here (e.g. validating the importance of Rarb and other regulators implicated by our data), the mechanistic basis of mtRNA release (e.g. whether this release is Bax/Bak dependent), and suppression of innate immune pathway signaling [e.g. by pharmacological inhibition of PKR (Ingrand et al., 2007)] may also point to new therapeutic targets in HD.
STAR METHODS
RESOURCE AVAILABILITY:
Lead Contact
Further information and requests for resources and reagents should be directed to the Lead Contact, Myriam Heiman (mheiman@mit.edu).
Materials Availability
This study did not generate new unique reagents.
Data and Code Availability
All sequencing datasets generated as part of this study are publicly available in NCBI GEO under accession #GSE152058. Code used to construct ACTIONet and identify cell types is accessible from https://github.com/shmohammadi86/ACTIONet.
EXPERIMENTAL MODEL AND SUBJECT DETAILS
Animals
All mouse husbandry and experimental procedures were conducted with the approval of the Massachusetts Institute of Technology Animal Care and Use Committee. Mice were housed under pathogen-free conditions, with food and water provided ad libitum on a standard 12h light/12h dark cycle. No procedures were performed on the mice prior to the outlined experiments. For all studies, littermate mice were group-housed and male littermates were used at ages described in the Method Details and figure legends. Only male mice were used given HD model differences in phenotype progression between male and female mice. Mice were assigned to experimental groups based on their genotype (all mice were used, and as individual biological replicates). Tg(Drd1a-EGFP/Rpl10a)CP73Htz mice were used for dSPN TRAP experiments, Tg(Drd2-EGFP/Rpl10a)CP101Htz mice were used for iSPN TRAP experiments, Tg(Chat-EGFP/Rpl10a,Slc18a3)DW167Htz/J mice were used for cholinergic interneuron TRAP experiments, and Tg(Aldh1l1-EGFP/Rpl10a)JD130Htz mice were used for astrocyte TRAP experiments. All TRAP lines (Doyle et al., 2008; Heiman et al., 2008) were backcrossed to the C57BL/6J background for at least 10 generations. B6CBA-Tg(HDexon1)62Gpb/1J mice (CAG repeat length 160 +/− 5; Jackson Laboratories stock # 002810) were used for R6/2 experiments, and B6J.HdhQ20 (Jackson Laboratories stock #370504), B6J.HdhQ50 (Jackson Laboratories stock #303454), B6J.HdhQ111 (Jackson Laboratories stock #370624), B6J.HdhQ170 (Jackson Laboratories stock #400706), and B6J.zQ175DN (Jackson Laboratories stock # 370832) knockin congenic C57BL/6J mice were used for the CAG allelic series experiments. Replicate number per mouse group is listed in Table S1–S2, and sample size was based on previous studies (Wertz et al., 2020; Zeisel et al., 2018). 9-week old male double hemizygous mice were used for the TRAPxR6/2 experiments, and 3-month or 6-month old male TRAP hemizygous/HTT knockin heterozygous mice were used for the TRAPxCAG allelic series experiments. Htt/HTT CAG repeat expansion sizing analysis was performed by Laragen, Inc. (Culver City, CA).
Human Samples
Post-mortem caudate and putamen tissue samples of grade 2–4 HD and matched unaffected controls (characteristics described in Table S2) were obtained from the NIH NeuroBioBank or the University of Alabama at Birmingham. BJRiPS human BJ fibroblast RNA-induced pluripotent stem cells (iPSCs) were provided by Dr. Tim Ahfeldt (Mount Sinai School of Medicine), and induced pluripotent stem cell (iPSC)-derived neurons were generated using a previously described protocol (Srikanth et al., 2018; Zhang et al., 2013) with slight modifications as detailed in the Method Detail below.
METHOD DETAILS
ChIP-Seq Analysis
The Rarb ChIP-Seq FASTQ file and the GFP ChIP-Seq FASTQ file from (Niewiadomska-Cimicka et al., 2017) were re-aligned using the Burrows-Wheeler Alignment tool (Li and Durbin, 2009) against the mm10 reference genome. Peaks were called by MACS2 software (Zhang et al., 2008) based on uniquely mapped reads using RARB as treatment and GFP as control with a cutoff q- value at 0.4. The genes and boundary used for overlapping span a distance to the nearest Transcription Start Site (TSS) from −2kb to +2kb.
Consistency of Transcriptionally Dysregulated Genesets Across Models, Modalities, and Species
Comparison of dysregulated genes identified across different mouse models, profiling modalities, and datasets.
We identified the set of upregulated and downregulated genes in each case-vs.-control analysis (see the snRNA-Seq and TRAP analysis sections below). We corrected these computed p-values for multiple hypothesis testing and used a threshold of 0.01 to declare dysregulated gene sets. We then used Fisher’s exact test to perform pairwise comparisons between mouse models assayed using the same technology (snRNA-Seq) (Fig. 4) and the SuperExactTest (Wang et al., 2015) to assess the overlap of multiple sets across both models and platforms (Fig. S11). The same statistical analysis was used for comparisons between our TRAP and snRNA-Seq datasets and datasets from prior literature. In these cases, we filtered out statistically insignificant genes (p-value < 0.01 for Hodges et al.; FDR-adjusted p-value 0.05 for Langfelder et al.) and computed the overlap of remaining common genes.
Comparison of dysregulated genes between cell types across human HD grades and mouse models
We computed Pearson’s correlation between cell type-specific profiles using the computed log-fold-change of pairwise-common, statistically significant genes to compare the overall cell type-specific transcriptional dysregulation across datasets. We removed batch effects introduced by differences in sequencing depth using the Limma package (Ritchie et al., 2015).
Interferon Measurement
An interferon alpha-2 ELISA assay kit (Abcam, Cambridge, MA, ab211648) was used, according to the manufacturer’s protocol, for measurement of interferon levels. Briefly, mouse striatal samples were harvested and flash-frozen in liquid nitrogen and kept at −80°C until used. On the day of the experiment, the tissue was homogenized with glass/Teflon power-driven Potter-Elvehjem homogenizer on ice in 400 μL 1x Cell Extraction Buffer PTR and diluted to the final concentration of 1.76 μg/μL. 50 μL of the diluted sample was used per well of the ELISA plate. After adding the 3,3’,5,5’-tetramethylbenzidine (TMB) substrate to the plate, the absorbance at 595nm was measured immediately. For each assay performed, 2 wells were used as the zero control and for each mouse assayed, technical duplicates were used.
Induced Neuron Differentiation
Induced pluripotent stem cell (iPSC)-derived neurons were generated using a previously described protocol (Srikanth et al., 2018; Zhang et al., 2013) with slight modifications. Briefly, BJRiPS human BJ fibroblast RNA-induced pluripotent stem cells (provided by Dr. Tim Ahfeldt, Mount Sinai School of Medicine) were plated on Matrigel-coated plates and cultured in mTeSR1 (ThermoFisher Scientific, Waltham MA) media at a density of 100K cells/cm2. iPSCs were then transduced using the following lentiviruses from Alstem (Richmond, CA): pTet-O-NGN2-puro (0.11μL/50K cells) and Fudelta GW-rtTA (0.11μL/50K cells). The following day (day 0), the transduced iPSCs were dissociated with Accutase (Stemcell Technologies, Vancouver Canada) and plated at a density of 200K cells/cm2 on Matrigel-coated plates. On day 1, iPSCs were exposed to KSR media (Knockout DMEM, 15% KOSR, 1x MEM-NEAA, 55μM beta-mercaptoethanol, 1x GlutaMAX) containing doxycycline (2 μg/mL). On day 2, the media was changed to equal volumes of KSR and N2B media (DMEM/F12, 1x GlutaMAX, 1x N2 supplement B, 0.3% dextrose containing doxycycline (2 μg/mL) and puromycin (5 μg/mL). On day 3, media was changed to N2B media containing the following: 2 μg/mL doxycycline, 5 μg/mL puromycin and 1:100 B27 supplement. Starting on day 4, cells were exposed to NBM medium (Neurobasal medium, 0.5x MEM-NEAA, 1x GlutaMAX, 0.3% dextrose) containing 1:50 B27, 10 ng/mL BDNF, GDNF and CNTF, 5 μg/mL puromycin and 2 μg/mL of doxycycline, however, the puromycin and doxycycline was discontinued on day 10 to ensure the integrity of mitochondrial-encoded proteins.
Mitochondrial Isolation and OXPHOS Complex Activity Measurement
Striatal or hippocampal tissue was placed in isolation buffer (250 mM Sucrose, 2 mM HEPES [pH 7.4] and 0.1 mM EDTA) and homogenized by 10 passes using a glass/Teflon power-driven Potter-Elvehjem homogenizer on ice, followed by 7 syringe passes using both a 26.5G and a 18G needle. Nuclei and debris were pelleted by centrifugation at 800 × g for 5 min at 4°C, and mitochondria were pelleted by centrifugation at 10,000 × g for 5 min at 4°C. The resulting mitochondrial pellet was washed in isolation buffer and then concentrated in hypotonic buffer (25 mM potassium phosphate, 5 mM MgCl2), and immediately stored in 50 μg aliquots at −80°C. Mitochondrial Complex I activity was analyzed by measuring the rate of rotenone-sensitive NADH consumption via spectrophotometric absorbance at 340 nm, as previously described (Birch-Machin and Turnbull, 2001). Briefly, 25 mM potassium phosphate [pH 7.4], 5 mM MgCl2, 2 mM KCN, 2.5 mg/mL bovine serum albumin Fraction V (BSA), 13 μM NADH, 0.65 mM ubiquinone, 2 μg/mL antimycin A were combined in a quartz cuvette and incubated for 5 min at 30°C. The change in absorbance was followed for 5 min at 340 nm, and then 50 μg of freeze-thawed mitochondria was added to this mixture. Absorbance was followed for another 3 min, and then rotenone was added at 5 μg/mL, and absorbance was again followed for 5 min. Rotenone-sensitive activities were calculated using linear regression. Complex II activity was determined by measuring dichloroindophenol (DCPIP) absorbance at 600 nm and 520 nm (reference) as previously described (Schlehe et al., 2013). Briefly, 50 mM potassium phosphate, 20 mM succinate, 400 μL ddH2O and 25 μg of freeze-thawed mitochondria were combined in a quartz cuvette and incubated for 10 min at 30°C. Following incubation, 2 μg/mL antimycin A, 2 μg/mL rotenone, 2 mM KCN and 50 μM DCIPP were then added for blank measurement at both 600 nm and 520 nm for 1 min. Decylubiquinone at 50 μM was then added and absorbances at 600 nm and 520 nm were followed for 3 min. Complex II activity was calculated using linear regression following subtraction of 600 nm and 520 nm absorbances.
PKR Immunofluorescence
Day in vitro (DIV) 14 iPSC-induced cortical neurons were exposed to a variety of electron transport chain inhibitors: 50 nM rotenone, 10 μM 3-NP, and 1 μM antimycin-A. Additionally, 30 mg/mL interferon-β was used as a positive control for PKR induction. These compounds were diluted in normal NBM or glucose-free NBM supplemented with 10 mM galactose, 2mM glutamine and 1 mM pyruvate and neurons were incubated for either 24 h or 48 h. Neurons were fixed with 4% paraformaldehyde, followed by membrane permeabilization and block with 0.2% Triton X-100 in PBS for 1 h at room temperature. Neurons were then incubated with anti-PKR primary antibody (Abcam, Cambridge, MA, ab184257, 1:1,000) for 1 h at 4°C and secondary antibody (ThermoFisher Scientific, Waltham MA, AlexaFluor594 chicken anti-rabbit IgG, A21442, 1:1,000) for 1 h at room temperature and DAPI (1:1,000) for 10 min. Following multiple washes, the neurons were imaged using GE InCell2200. ImageJ was used for quantification of total PKR fluorescence and DAPI number. Data were analyzed using GraphPad PRISM. Values are reported as mean ± SEM.
Brain tissue was harvested from the HD model and control mice following transcardial perfusion with 4% PFA in PBS, cryoprotected, and cryosectioned onto glass slides at 20 μM thickness. Slides were washed, blocked with blocking buffer (2% heat-inactivated donkey serum, 0.1% fish gelatin in TBS with 0.1% Triton X-100) for 1 h at room temperature, and incubated with anti-PKR primary antibody (Abcam, Cambridge, MA, ab184257, 1:1,000) in TBS with 0.1% Triton X-100 overnight at 4°C. Slides were subsequently washed, incubated with ImmPRESS anti-rabbit-HRP secondary antibody (Vector Laboratories, Burlingame, CA) for 1 h at room temperature, and processed with SuperBoost tyramide signal amplification kit (ThermoFisher Scientific, Waltham MA) according to manufacturer’s protocol. The slides were then blocked again with blocking buffer for 1 h at room temperature and incubated with anti-NeuN antibody (MilliporeSigma, Burlington, MA, MAB377, 1:100) in TBS with 0.1% Triton X-100 overnight at 4°C. Slides were subsequently washed, incubated with AlexaFluor647-conjugated anti-mouse secondary antibody (ThermoFisher Scientific, Waltham MA, 1:500) for 1 h at room temperature, washed, stained with DAPI, and mounted with ProLong Diamond antifade mounting media (ThermoFisher Scientific, Waltham MA). A Zeiss LSM700 confocal microscope (Carl Zeiss AG, Oberkochen, Germany) with a 40X objective lens was used for imaging.
PKR Levels and Activation Assays
Striatal tissue was placed in 1% SDS in water supplemented with Pierce HALT phosphatase and protease inhibitor cocktails (ThermoFisher Scientific, Waltham MA) and sonicated (Branson, Danbury, CT) at amplitude 10, two times 15 sec on ice with 30 sec in between. DTT was added to the lysate and 15 μg of protein per lane was run on Bis-Tris NuPAGE gels in MOPS buffer (ThermoFisher Scientific, Waltham MA). Proteins were transferred to polyvinylidene difluoride (PVDF) membrane and probed with the following primary antibodies: PKR (Abcam, Cambridge, MA, ab184257, 1:1,000 in 1% BSA in TBS with 0.05% Tween-20), phospho-PKR (GeneTex, Irvine CA, GTX32348, 1:1,000 in I-Block (ThermoFisher Scientific, Waltham MA, T2015)), Eif4a2 (Abcam, Cambridge, MA, ab31218, 1:10,000 in 5% BSA in TBS with 0.05% Tween-20).
PKR RNA Immunoprecipitation Assay
Striatal tissue was freshly harvested on the day of the experiment. The tissue was immediately lysed in Triton lysis buffer (50 mM HEPES [pH 7.5], 160 mM NaCl, 7 mM MgCl2, 3 mM CaCl2, 5 mM KCl, 1% Triton X-100, SUPERaseIn RNase Inhibitor 20 U/μL, RNasin Plus Rnase Inhibitor 40 U/μL, Pierce HALT Phosphatase and Protease Inhibitor Cocktails) with a glass/Teflon power-driven Potter-Elvehjem homogenizer. The lysate was cleared by centrifugation (two times 13,000 × g for 5 min at 4°C) and 350 μg of the supernatant was used for the PKR immunoprecipitation (15 μg of antibody with 62.5 μL of beads per immunoprecipitation). The lysate was precleared with Protein G Dynabeads (ThermoFisher Scientific, Waltham MA) for 1 h at 4°C on end-to-end rotation. Meanwhile an anti-PKR antibody (Abcam, Cambridge, MA, ab184257): Protein G Dynabeads conjugate was prepared by blocking the beads with the blocking buffer (1% IgG-free BSA in Triton lysis buffer) for 1h at 4°C on an end-to-end rotator, followed by incubating the blocked beads with the PKR antibody for 35 min at room temperature with end-over-end rotation. The lysate and the antibody:bead conjugate were combined and incubated for 4 h at 4°C with end-over-end rotation, and washed four times with Triton lysis buffer. After the fourth wash, the beads were resuspended in 300 μL of AE buffer (50 mM NaOAc [pH 5.3], 10 mM EDTA [pH 8.0]) and the RNA was extracted in acidic phenol/chloroform/isoamyl alcohol, and precipitated by overnight incubation at −20°C in RE buffer (1:1 mixture of EtOH and Isopropanol that is two times the volume of the sample, 3 M NaOAc [pH 5.3] that is one-sixth the volume of the sample, and 40 μg glycogen). The next day, the sample was centrifuged (13,000 × g for 1 h at 4°C) and the RNA pellet was washed with an ice-cold 70% ethanol, dried under the chemical hood for 5 min, and resuspended with 11 μL of nuclease-free water. 60 ng of PKR-bound RNA or input RNA were reverse transcribed using the cDNA First-Strand Synthesis Kit (ThermoFisher Scientific, Waltham MA) and diluted 1:5 with water. Real-time PCR reaction mix consisted of 4 μL of the diluted cDNA, 2 μL of TaqMan assay for each mitochondrial genes (listed below), 14 μL of water, and 20 μL of TaqMan Fast Advanced Master Mix (ThermoFisher Scientific, Waltham MA). Each reaction was performed in triplicate and mtRNA bound by PKR was quantified by quantitative real-time PCR using an ABI StepOnePlus Real-Time PCR System. ΔCt for each gene was calculated from Ct of elute and Ct of input, and ΔΔCt for each genes was then calculated from the ΔCt of R6/2 and the ΔCt of WT, and relative quantification value for each genes was calculated as 2−ΔΔCt and presented on the graph. 20x TaqMan Assays used for mitochondrial genes (all from ThermoFisher Scientific, Waltham MA): mt-Co1, Mm04225243_g1; mt-Nd1, Mm04225274_s1; mt-Nd4/4l, Mm04225294_s1; mt-Nd5/6, Mm04225315_s1; mt-Rnr1, Mm04260177_s1.
Single Nuclear (snRNA) RNA Sequencing and Analysis
Nuclei isolation protocol was adapted from (Mathys et al., 2019). All procedures were performed on ice. Tissue was homogenized in 700 μL of homogenization buffer (320 mM sucrose, 5 mM CaCl2, 3 mM Mg(CH3COO)2, 10 mM Tris HCl [pH 7.8], 0.1 mM EDTA [pH 8.0], 0.1% NP-40, 1 mM β-mercaptoethanol, and 0.4 U/μL SUPERaseIn RNase Inhibitor (ThermoFisher Scientific, Waltham MA) with a 2 mL KIMBLE Dounce tissue grinder (MilliporeSigma, Burlington MA) using 10 strokes with loose pestle followed by 10 strokes with tight pestle. From the mouse tissue samples the entire striatum was homogenized. From the human tissue samples 100 mg of grey matter was sectioned and homogenized. Homogenized tissue was filtered through a 40 μm cell strainer and mixed with 450 μL of working solution (50% OptiPrep density gradient medium (MilliporeSigma, Burlington MA), 5 mM CaCl2, 3 mM Mg(CH3COO)2, 10 mM Tris HCl [pH 7.8], 0.1 mM EDTA [pH 8.0], and 1 mM β-mercaptoethanol). The mixture was then slowly pipetted onto the top of an OptiPrep density gradient containing 750 μL of 30% OptiPrep Solution (134 mM sucrose, 5 mM CaCl2, 3 mM Mg(CH3COO)2, 10 mM Tris HCl [pH 7.8], 0.1 mM EDTA [pH 8.0], 1 mM β-mercaptoethanol, 0.04% NP-40, and 0.17 U/μL SUPERase In RNase Inhibitor) on top of 300 μL of 40% OptiPrep Solution (96 mM sucrose, 5 mM CaCl2, 3 mM Mg(CH3COO)2, 10 mM Tris HCl [pH 7.8], 0.1 mM EDTA [pH 8.0], 1 mM β-mercaptoethanol, 0.03% NP-40, and 0.12 U/μL SUPERase In RNase Inhibitor) inside a Sorenson Dolphin microcentrifuge tube (MilliporeSigma, Burlington MA). Nuclei were pelleted at the interface of the OptiPrep density gradient by centrifugation at 10,000 × g for 5 min at 4°C using a fixed angle rotor (FA-45-24-11-Kit). The nuclear pellet was collected by aspirating ~100μL from the interface and transferring to a 2.5 mL Eppendorf tube. The pellet was washed with 2% BSA (in 1x PBS) containing 0.12 U/μL SUPERase In RNase Inhibitor. The nuclei were pelleted by centrifugation at 300 × g for 3 min at 4°C using a swing-bucket rotor (S-24–11-AT). Nuclei were washed three times with 2% BSA and centrifuged under the same conditions. The nuclear pellet was resuspended in 100 μL of 2% BSA.
Droplet-based snRNA sequencing libraries were prepared using the Chromium Single Cell 3′ Reagent Kit v3 (10x Genomics, Pleasanton CA) according to the manufacturer’s protocol and sequenced on an Illumina NextSeq 500 at the MIT BioMicro Center (zQ175DN mouse samples) or a NovaSeq 6000 at the Broad Institute Genomics Platform (R6/2 mouse samples and human samples). FASTQ files were aligned to the pre-mRNA annotated Mus musculus reference genome version GRCm38 or human reference genome GRCh38. Cell Ranger v3.1 (10x Genomics, Pleasanton CA) was used for genome alignment and feature-barcode matrix generation.
The Python and R packages Scanorama (Hie et al., 2019), batchelor (Haghverdi et al., 2018), and Harmony (Korsunsky et al., 2018) were used to correct for batch effect observed across biological replicates within each experimental group from the count matrix. Batch-corrected data was used as input to the archetypal analysis for cell type identification (ACTION) algorithm (Mohammadi et al., 2018) to identify a set of landmark cells or ‘archetypes’, each representing a potential underlying cell state. Using ACTION-decompositions with varying numbers of archetypes, we employed our recently developed ACTION-based network (ACTIONet) framework (Mohammadi et al., 2019) to create a multi-resolution nearest neighbor graph. A modified version of the stochastic gradient descent-based layout method was used in the uniform manifold approximation and projection (UMAP) algorithm (Becht et al., 2018), to visualize the ACTIONet graph. A curated set of known cell type-specific markers was used to annotate individual cells with their expected cell type and assign a confidence score to each annotation and network connectivity was used to correct low-confidence annotations. For clusters containing cell types that were difficult to partition and annotate in the global context (e.g. human dSPNs and iSPNs), we computed ACTION decompositions and reconstructed the network within those clusters (subACTIONets). Multiple iterations of this process were performed to identify and prune low quality cells, such as those with ambiguous profiles resembling dissimilar cell types (generally corresponding to doublet nuclei), or cells corresponding to nodes with a low k-core number in the network (generally corresponding to high ambient RNA content or doublet nuclei).
Cell-wise gene expression was normalized and log-scaled using the R package scran using cell type and experimental group as normalization factors. Differential gene expression analysis was performed using Wilcoxon rank-sum test [R package presto (Korsunsky et al., 2019)] and Welch’s t-test on a by-cell-type basis for sufficiently abundant cell types. Genes were considered differentially expressed if they had an absolute log-fold change > 0.1 with FDR < 0.001 vs. the respective control in each statistical test. The number and identity of genes classified as differentially expressed differed was consistent across all genes. To verify that genes classified as differentially expressed were not a consequence of the number of cells (given the discrepancy in cell numbers between control and HD samples), we sampled 1,000 control and HD cells of each cell type and repeated our DEG analysis 100 times. Further, within each sample we aggregated the UMI counts across all genes for each cell type and performed pseudo-bulk DEG analysis using DESeq2. In all cases, the genes identified as differentially expressed were consistent. Pathway and chromatin enrichment analysis was performed using the EnrichR package (Chen et al., 2013; Kuleshov et al., 2016) considering only protein-coding genes.
Subcellular Fractionation for Assessment of Cytosolic Mitochondrial DNA
Frozen striatal tissue was gently homogenized with the lysis buffer provided with the Mitochondria Isolation Kit, mouse tissue (Miltenyi Biotec Inc., Auburn, CA). The lysate was centrifuged for 5 min at 500 × g at 4°C and the supernatant was further processed according to the manufacturer’s protocol to purify mitochondria. The unbound cytosolic fraction that was mitochondria depleted was then centrifuged at 20,000 × g for 15 min at 4°C to ensure complete depletion of mitochondria. The presence of mitochondria in each subcellular fractionation was assessed by western blotting against the mitochondrial outer membrane protein TOMM70 (Abcam, Cambridge, MA, ab83841, 1:2,000 in 5%BSA in TBS with 0.05% Tween20). The nucleic acids from both input and unbound fractions were purified, reverse transcribed and used for real-time PCR as described in the ‘PKR RNA Immunoprecipitation Assay’ section with the following modifications: i) the nucleic acid pellet was resuspended with 20 μL of nuclease-free water; ii) 500 ng of unbound or input nucleic acids were reverse transcribed with or without reverse transcriptase and the cDNA was diluted 1:5 with water; and iii) Ct values from the cDNA reactions prepared without reverse transcriptase were used to quantify mtDNA by normalizing to the input and the amount in the R6/2 mouse samples that is relative to the isogenic control mouse samples were shown.
TOMM70A Western Blot Assay
Mouse sub-brain region tissue extracts were prepared as described above in the methods section ‘PKR Levels and Activation Assays’. The following primary antibodies were used for western blotting: TOMM70A (Abcam, Cambridge, MA, ab83841, 1:2,000 in 5% milk in TBS with 0.05% Tween-20), VDAC (Cell Signaling Technology, Danvers MA, CST#4866, 1:1,000 in 5% milk in TBS with 0.05% Tween-20), PPP1R1B (Cell Signaling Technology, Danvers MA, CST#2302, 1:1,000 in 5% milk in TBS with 0.05% Tween-20), and H3C1 (Abcam, Cambridge, MA, ab1791, 1:50,000 in 5% milk in TBS with 0.05% Tween-20).
Transcription Factor Network Analysis
Transcription factor network analysis was done using the ACTIONet package for cell type-specific sub-networks. In summary, we constructed independent transcriptional regulatory networks from the top 3 best performing datasets in ChEA3 (Keenan et al., 2019) namely the ones constructed from Enrichr, GTEx, and ARCHS4, and augmented that with the regulons identified by VIPER (Alvarez et al., 2016). Using these four networks as the baseline, we assessed the overall activity of each transcription factor based on the aggregate activity of its downstream target genes (Mohammadi et al., 2018). We then combined individual p-values (Wilson, 2019) for each transcription factor to estimate a meta p-value for its activity.
TRAP Purifications
Retro-TRAP Approach
5-week old R6/2 or control, or 5-month old knockin allele animals, were injected in the striatum with a long-term herpes simplex virus (LT-HSV) (Fenno et al., 2014) encoding the TRAP transgene (Heiman et al., 2008) in order to transduce, by projection, cortical neurons that project to the striatum. After 4 weeks of incubation, at 9-weeks of age, the entire cortex was dissected and translated CStrPN cell type-specific translated mRNAs were purified for each mouse as described below for all TRAP samples.
All TRAP purifications
Brain tissue dissections were performed on ice after cooling the head in liquid nitrogen for 4 sec. After dissection, cell type-specific mRNAs were purified according to the established TRAP protocol (Heiman et al., 2014). Striata were homogenized with a glass/Teflon power-driven Potter-Elvehjem homogenizer in an ice-cold lysis buffer (150 mM KCl, 10 mM HEPES [pH 7.4], 5 mM MgCl2, 0.5mM dithiothreitol, 100 μg/mL cycloheximide, 20 U/μL SUPERaseIn RNase Inhibitor, 40 U/μL RNasin Plus Rnase Inhibitor, and EDTA-free protease inhibitors). Following homogenization, samples were centrifuged at 2,000 × g at 4°C for 10 min and the supernatant was removed to a new tube. NP-40 (final concentration 1%) and 1,2-Diheptanoylsn-glycero-3-phosphocholine (DHPC, final concentration 15 mM) were subsequently added and samples were incubated on ice for 5 min. Samples were centrifuged at 13,000 × g at 4°C for 10 min and the supernatant was removed to a new tube. Streptavidin Dynabeads (ThermoFisher Scientific, Waltham MA) coated with biotin-linked mouse anti-GFP antibodies were then added to this supernatant and the samples were incubated overnight at 4°C with end-over-end rotation. Beads were collected on a magnetic rack and washed three times with wash buffer (350 mM KCl, 10 mM HEPES [pH 7.4], 5 mM MgCl2, 0.5 mM dithiothreitol, 100 μg/mL cycloheximide, 1% NP-40). RNA was subsequently purified using the Absolutely RNA Isolation Nanoprep kit (Agilent Technologies, Santa Clara CA). To ensure quality and accurate quantitation, purified RNA was run on a Bioanalyzer using the RNA 6000 Pico Kit (Agilent Technologies, Santa Clara CA).
TRAP RNA Sequencing and Analysis
Purified TRAP samples were prepared for RNA-Seq using the Ovation RNA-Seq System v2 kit (NuGEN Technologies, San Carlos CA). RNA-Seq was performed on an Illumina HiSeq 4000 at the University of California, San Francisco Functional Genomics Core or the MIT BioMicro Center. FASTQ files were aligned to the Mus musculus genome version GRCm38.78 (reference FASTA and GTF file) using the STAR aligner (Dobin et al., 2013),v2.4.2a. Read counts were generated by STAR using the --quantMode GeneCounts option, along with the default options, except for --outFilterMismatchNoverLmax, which was set to 0.04 (from 0.3), --outFilterMismatchNmax, which was set at 999 (from 10), --alignIntronMax, which was set to 1000000 (from 0), and --alignMatesGapMax, which was set to 1000000 (from 0). Only mapped reads uniquely assigned to the mouse genome were used for differential expression testing. These were imported into R and then converted to normalized read counts with DESeq2 (Love et al., 2014). As a note, for one of the early datasets we generated (R6/2 Retro-TRAP data) the alignment step was completed using STAR v2.4.0 aligner, and gene count matrices were generated using HTSeq pipeline for downstream differential analysis. Differential expression was performed using DESeq2, and significant genes were filtered by a q-value (False Discovery Rate) threshold of 0.1 for the R6/2 studies and 0.01 for the knockin allelic series studies. For knockin allelic series studies, we further filtered the differential expressed genes lists as in (Langfelder et al., 2016), keeping only genes that had read counts > 5 in at least 8 replicates (except for the iSPN 3-month Q170 group, which had fewer replicates where the filter was > 5 in at least 4 out of 6 replicates). For GO and pathway analyses, differentially expressed genes were processed using Enrichr (Chen et al., 2013; Kuleshov et al., 2016). A linear regression model (ordinary least-squares regression consensus) across the allelic series knockin allele TRAP data was fit using the ‘ols’ procedure in the python statsmodels module (Seabold and Perktold, 2010). Module weighted gene coexpression network analysis (WGCNA) across cell types, CAG length alleles, or model age was performed as previously described (Langfelder et al., 2016; Langfelder and Horvath, 2008; Zhang and Horvath, 2005), and ‘hub’ genes in each consensus module (those having expression values that were highly correlated with that module’s eigengene values) were identified using the R function consensusKME or signedKME (Langfelder et al., 2013). For both the linear regression and WGCNA analysis across CAG-repeat length, the Q170 and zQ175DN replicates were combined into one group for each cell type, as these samples had overlapping CAG-repeat lengths.
QUANTIFICATION AND STATISTICAL ANALYSIS
Transcriptional Profiling:
Use of the relevant pipelines for quantification, determination of normality of data, and appropriate statistical analysis of the TRAP-Seq and snRNA-Seq data are described in the figures and figure legends as well as the Methods Detail sections above. Data met assumptions of the statistical approach based upon the experimental design in each case. As noted above in the Methods Detail section, differential gene expression analysis of the snRNA-Seq data was performed on a by-cell-type basis using both the Wilcoxon rank-sum test and Welch’s t-test in order to independently confirm statistical results.
Gene overlap and correlation analyses:
Overlap and correlation analyses of the TRAP-Seq and snRNA-Seq data are described in the figures and figure legends as well as the Methods Detail sections above.
Complex 1, PKR, and Interferon Experiments:
We used GraphPad Prism 8 to perform the statistical analysis of these experiments. Specific information on the number (n) of values usedas well as the statistical tests applied to the data can be found in the figures and/or figure legends. We considered results statistically significant with p < 0.05. Data met assumptions of the statistical approach based upon the experimental design in each case.
Supplementary Material
Table S1 (Excel File). Differentially expressed genes, as reported by TRAP from the studied cell types in 9-week old R6/2 model tissue, and 3-month old or 6-month old CAG knockin allele model tissue, as well as KEGG pathways, predicted ChEA regulators, and sample group information, related to Figures 2–3.
Table S2 (Excel File). Differentially expressed protein-coding genes in the most abundant striatal cell types reported by snRNA-Seq from the striatum of 9-week old R6/2 model tissue, 6-month old zQ175DN model tissue, as well as human caudate putamen samples (Y-chromosome genes removed for human data), and sample group information, related to Figures 4–5.
KEY RESOUCES TABLE:
| REAGENT or RESOURCE | SOURCE | IDENTIFIER |
|---|---|---|
| Antibodies | ||
| PKR | Abcam | Cat#ab184257 |
| phospho-PKR | GeneTex | Cat#GTX32348 |
| NeuN | MilliporeSigma | Cat#MAB377; RRID: AB_2298772 |
| Eif4a2 | Abcam | Cat#ab31218; RRID: AB_732123 |
| TOMM70 | Abcam | Cat#ab83841; RRID: AB_1861453 |
| VDAC | Cell Signaling Technology | Cat#4866; RRID: AB_2272627 |
| PPP1R1B | Cell Signaling Technology | Cat#2302; RRID: AB_2169007 |
| H3C1 | Abcam | Cat#ab1791; RRID: AB_302613 |
| anti-GFP 19C8 TRAP purification antibody | Antibody and Bioresource Core Facility at the Memorial Sloan Kettering Cancer Center | Cat#HtzGFP-19C8_as_BRS; RRID:AB_2716737 |
| anti-GFP 19F7 TRAP purification antibody | Antibody and Bioresource Core Facility at the Memorial Sloan Kettering Cancer Center | Cat#HtzGFP-19F7_as_BRS; RRID:AB_2716736 |
| AlexaFluor647 goat anti-mouse secondary antibody | ThermoFisher Scientific | Cat#A32728; RRID: AB_2633277 |
| Alexafluor594 chicken anti-rabbit secondary antibody | ThermoFisher Scientific | Cat#A21442; RRID: AB_2535860 |
| ImmPRESS anti-rabbit-HRP secondary antibody | Vector Laboratories | Cat#MP-7451; RRID: AB_2631198 |
| Bacterial and Virus Strains | ||
| Biological Samples | ||
| Human Control samples | The Alabama Brain Collection (ABC) and The NIH NeuroBioBank (The Human Brain and Spinal Fluid Resource Center) | https://www.uab.edu/medicine/psychiatry/research/resources-0/alabama-brain-collection and https://neurobiobank.nih.gov |
| Human HD grade 2–4 samples | The NIH NeuroBioBank (The Human Brain and Spinal Fluid Resource Center) | https://neurobiobank.nih.gov |
| Chemicals, Peptides, and Recombinant Proteins | ||
| Critical Commercial Assays | ||
| Interferon alpha-2 ELISA assay kit | Abcam | Cat#ab211648 |
| TaqMan Fast Advanced Master Mix | ThermoFisher Scientific | Cat# 4444963 |
| Mitochondria Isolation Kit, mouse tissue | Miltenyi Biotec Inc. | Cat#130-096-946 |
| Chromium Single Cell 3′ Library & Gel Bead Kit v3 | 10x Genomics | Cat#1000075 |
| Chromium Chip B Single Cell Kit | 10x Genomics | Cat#1000074 |
| Chromium i7 Multiplex Kit | 10x Genomics | Cat#120262 |
| Deposited Data | ||
| HD and HD mouse model sequencing data | This Paper | NCBI GEO: GSE152058 |
| Experimental Models: Cell Lines | ||
| Experimental Models: Organisms/Strains | ||
| Mouse: R6/2 hemizygous transgenic: B6CBA-Tg(HDexon1)62Gpb/1J hemi |
The Jackson Laboratory | RRID:IMSR_JAX: 002810 |
| Mouse: R6/2 non-carrier: B6CBA-Tg(HDexon1)62Gpb/1J non carrier controls |
The Jackson Laboratory | RRID:IMSR_JAX: 002810 |
| Mouse: Drd1a::TRAP: Tg(Drd1a-EGFP/Rpl10a)CP73Htz |
The Jackson Laboratory | RRID:IMSR_JAX:030254 |
| Mouse: Drd2::TRAP: Tg(Drd2-EGFP/Rpl10a)CP101Htz |
The Jackson Laboratory | RRID:IMSR_JAX:030255 |
| Mouse: Aldh1l1::TRAP: Tg(Aldh1l1-EGFP/Rpl10a)JD130Htz |
The Jackson Laboratory | RRID:IMSR_JAX:030247 |
| Mouse: Chat::TRAP: Tg(Chat-EGFP/Rpl10a,Slc18a3)DW167Htz/J |
The Jackson Laboratory | RRID:IMSR_JAX:030250 |
| Mouse: Q20 KI: B6J.HdhQ20 | The Jackson Laboratory | RRID:IMSR_JAX: 370504 |
| Mouse: Q50 KI: B6J.HdhQ50 | The Jackson Laboratory | RRID:IMSR_JAX: 303454 |
| Mouse: Q111 KI: B6J.HdhQ111 | The Jackson Laboratory | RRID:IMSR_JAX: 370624 |
| Mouse: Q170 KI: B6J.HdhQ170 | The Jackson Laboratory | RRID:IMSR_JAX: 400706 |
| Mouse: zQ175DN: B6J.zQ175DN | The Jackson Laboratory | RRID:IMSR_JAX: 370832 |
| Mouse: C57BL/6J WT controls | The Jackson Laboratory | RRID:IMSR_JAX:000664 |
| Oligonucleotides | ||
| Taqman gene expression Mouse Actb, Mm02619580_g1 | ThermoFisher Scientific | Cat#4331182 |
| Taqman gene expression Mouse mt-Co1, Mm04225243_g1 | ThermoFisher Scientific | Cat#4331182 |
| Taqman gene expression Mouse mt-Nd1, Mm04225274_s1 | ThermoFisher Scientific | Cat#4331182 |
| Taqman gene expression Mouse mt-Nd4/4l, Mm04225294_s1 | ThermoFisher Scientific | Cat#4331182 |
| Taqman gene expression Mouse mt-Nd5/6, Mm04225315_s1 | ThermoFisher Scientific | Cat#4331182 |
| Taqman gene expression Mouse mt-Rnr1, Mm04260177_s1 | ThermoFisher Scientific | Cat#4331182 |
| Recombinant DNA | ||
| Software and Algorithms | ||
| MACS2 | Zhang et al., 2008 | https://github.com/taoliu/MACS |
| EnrichR | Chen et. al. 2013, Kuleshov et al., 2016 | https://amp.pharm.mssm.edu/Enrichr/; RRID:SCR_001575 |
| WGCNA | Langfelder and Horvath, 2008 | https://horvath.genetics.ucla.edu/html/CoexpressionNetwork/Rpackages/WGCNA/; RRID:SCR_003302 |
| Limma | Ritchie et al., 2015 | http://bioconductor.org/packages/release/bioc/html/limma.html |
| Batchelor | Haghverdi et al., 2018 | https://bioconductor.org/packages/release/bioc/html/batchelor.html |
| ACTIONet | Mohammadi et al., 2019 | https://github.com/shmohammadi86/ACTIONet |
| STAR | Dobin et al., 2013 | https://github.com/alexdobin/STAR |
| DESeq2 | Love et al., 2014 | https://bioconductor.org/packages/release/bioc/html/DESeq2.html |
Highlights.
HD mouse model gene expression changes examined by TRAP and snRNA-Seq
Human HD gene expression changes examined by snRNA-Seq
mtRNA release and neuronal innate immune activation associated with mHTT
mtRNA release correlates with striatal cell type vulnerability in HD
ACKNOWLEDGEMENTS
This study was supported by funding from the CHDI Foundation, NIH/NINDS (1 R01 NS100802), and the Broderick fund for Phytocannabinoid Research at MIT to M.H. and the JPB Foundation to M.H. and H.L., NIH (R25MH101076) to R.J.F., NIH (5T32EB019940-05) to S.S.P., NIH NIA NIMH NINDS NHGRI (R01AG062335, R01AG058002, RF1AG054012, RF1AG062377, R01MH109978, U01MH119509, U01NS110453, R01HG008155) to M.K., and NIH/NINDS (NS065013) to M.J.L. RNA sequencing was performed at the MIT BioMicro Center, the UCSF Functional Genomics Core, and the Broad Institute Genomics Platform. The authors thank Dr. Duanduan Ma for assistance with the ChIP-Seq analysis, Dr. Kyriakitsa Galani and Julio Mantero for preparing the snRNA-Seq libraries, Dr. Li-Lun Ho for assistance with sequencing the libraries, Dr. Hanseruedi Mathys for assistance with the nuclei isolation protocol, Alex Powers for assistance with mouse stereotaxic surgery, and Brenda Lager for assistance with the coordination of mouse breeding and shipments. The authors additionally thank the NIH NeuroBioBank and the University of Alabama at Birmingham for providing the human HD and control case samples used in this study.
Footnotes
Publisher's Disclaimer: This is a PDF file of an unedited manuscript that has been accepted for publication. As a service to our customers we are providing this early version of the manuscript. The manuscript will undergo copyediting, typesetting, and review of the resulting proof before it is published in its final form. Please note that during the production process errors may be discovered which could affect the content, and all legal disclaimers that apply to the journal pertain.
DECLARATION OF INTERESTS
M.H. is a member of the Hereditary Disease Foundation’s Scientific Advisory Board, and T.V. and H.W. are employed by CHDI Management, Inc., as advisors to the CHDI Foundation, Inc.
Supplementary Materials are linked to the online version of the paper at:
REFERENCES
- Albin RL, Reiner A, Anderson KD, Dure L.S.t., Handelin B, Balfour R, Whetsell WO Jr., Penney JB, and Young AB (1992). Preferential loss of striato-external pallidal projection neurons in presymptomatic Huntington’s disease. Annals of neurology 31, 425–430. [DOI] [PubMed] [Google Scholar]
- Alfadhel M, Almuntashri M, Jadah RH, Bashiri FA, Al Rifai MT, Al Shalaan H, Al Balwi M, Al Rumayan A, Eyaid W, and Al-Twaijri W (2013). Biotin-responsive basal ganglia disease should be renamed biotin-thiamine-responsive basal ganglia disease: a retrospective review of the clinical, radiological and molecular findings of 18 new cases. Orphanet journal of rare diseases 8, 83. [DOI] [PMC free article] [PubMed] [Google Scholar]
- Alvarez MJ, Shen Y, Giorgi FM, Lachmann A, Ding BB, Ye BH, and Califano A (2016). Functional characterization of somatic mutations in cancer using network-based inference of protein activity. Nature genetics 48, 838–847. [DOI] [PMC free article] [PubMed] [Google Scholar]
- Banez-Coronel M, Ayhan F, Tarabochia AD, Zu T, Perez BA, Tusi SK, Pletnikova O, Borchelt DR, Ross CA, Margolis RL, et al. (2015). RAN Translation in Huntington Disease. Neuron 88, 667–677. [DOI] [PMC free article] [PubMed] [Google Scholar]
- Becht E, McInnes L, Healy J, Dutertre CA, Kwok IWH, Ng LG, Ginhoux F, and Newell EW (2018). Dimensionality reduction for visualizing single-cell data using UMAP. Nature biotechnology. [DOI] [PubMed] [Google Scholar]
- Benn CL, Landles C, Li H, Strand AD, Woodman B, Sathasivam K, Li SH, Ghazi-Noori S, Hockly E, Faruque SM, et al. (2005). Contribution of nuclear and extranuclear polyQ to neurological phenotypes in mouse models of Huntington’s disease. Human molecular genetics 14, 3065–3078. [DOI] [PubMed] [Google Scholar]
- Birch-Machin MA, and Turnbull DM (2001). Assaying mitochondrial respiratory complex activity in mitochondria isolated from human cells and tissues. Methods in cell biology 65, 97–117. [DOI] [PubMed] [Google Scholar]
- Bolam JP, Izzo PN, and Graybiel AM (1988). Cellular substrate of the histochemically defined striosome/matrix system of the caudate nucleus: a combined Golgi and immunocytochemical study in cat and ferret. Neuroscience 24, 853–875. [DOI] [PubMed] [Google Scholar]
- Bradford J, Shin JY, Roberts M, Wang CE, Li XJ, and Li S (2009). Expression of mutant huntingtin in mouse brain astrocytes causes age-dependent neurological symptoms. Proceedings of the National Academy of Sciences of the United States of America 106, 22480–22485. [DOI] [PMC free article] [PubMed] [Google Scholar]
- Brimblecombe KR, and Cragg SJ (2017). The Striosome and Matrix Compartments of the Striatum: A Path through the Labyrinth from Neurochemistry toward Function. ACS chemical neuroscience 8, 235–242. [DOI] [PubMed] [Google Scholar]
- Cepeda C, Wu N, Andre VM, Cummings DM, and Levine MS (2007). The corticostriatal pathway in Huntington’s disease. Progress in neurobiology 81, 253–271. [DOI] [PMC free article] [PubMed] [Google Scholar]
- Chen EY, Tan CM, Kou Y, Duan Q, Wang Z, Meirelles GV, Clark NR, and Ma’ayan A (2013). Enrichr: interactive and collaborative HTML5 gene list enrichment analysis tool. BMC bioinformatics 14, 128. [DOI] [PMC free article] [PubMed] [Google Scholar]
- Chen JY, Penco S, Ostrowski J, Balaguer P, Pons M, Starrett JE, Reczek P, Chambon P, and Gronemeyer H (1995). RAR-specific agonist/antagonists which dissociate transactivation and AP1 transrepression inhibit anchorage-independent cell proliferation. The EMBO journal 14, 1187–1197. [DOI] [PMC free article] [PubMed] [Google Scholar]
- Cheng W, Wang S, Mestre AA, Fu C, Makarem A, Xian F, Hayes LR, Lopez-Gonzalez R, Drenner K, Jiang J, et al. (2018). C9ORF72 GGGGCC repeat-associated non-AUG translation is upregulated by stress through eIF2alpha phosphorylation. Nature communications 9, 51. [DOI] [PMC free article] [PubMed] [Google Scholar]
- Chung H, Calis JJA, Wu X, Sun T, Yu Y, Sarbanes SL, Dao Thi VL, Shilvock AR, Hoffmann HH, Rosenberg BR, et al. (2018). Human ADAR1 Prevents Endogenous RNA from Triggering Translational Shutdown. Cell 172, 811–824 e814. [DOI] [PMC free article] [PubMed] [Google Scholar]
- Cicchetti F, Prensa L, Wu Y, and Parent A (2000). Chemical anatomy of striatal interneurons in normal individuals and in patients with Huntington’s disease. Brain research Brain research reviews 34, 80–101. [DOI] [PubMed] [Google Scholar]
- Consortium., G.M.o.H.s.D. (2019). CAG Repeat Not Polyglutamine Length Determines Timing of Huntington’s Disease Onset. Cell 178, 887–900 e814. [DOI] [PMC free article] [PubMed] [Google Scholar]
- Crabtree HG (1935). The differential effect of radium radiation on the carbohydrate metabolism of normal and tumour tissues irradiated at low temperature. The Biochemical journal 29, 2334–2343. [DOI] [PMC free article] [PubMed] [Google Scholar]
- Crow YJ, and Manel N (2015). Aicardi-Goutieres syndrome and the type I interferonopathies. Nature reviews Immunology 15, 429–440. [DOI] [PubMed] [Google Scholar]
- Dedoni S, Olianas MC, and Onali P (2010). Interferon-beta induces apoptosis in human SHSY5Y neuroblastoma cells through activation of JAK-STAT signaling and down-regulation of PI3K/Akt pathway. Journal of neurochemistry 115, 1421–1433. [DOI] [PubMed] [Google Scholar]
- Dhir A, Dhir S, Borowski LS, Jimenez L, Teitell M, Rotig A, Crow YJ, Rice GI, Duffy D, Tamby C, et al. (2018). Mitochondrial double-stranded RNA triggers antiviral signalling in humans. Nature 560, 238–242. [DOI] [PMC free article] [PubMed] [Google Scholar]
- Dobin A, Davis CA, Schlesinger F, Drenkow J, Zaleski C, Jha S, Batut P, Chaisson M, and Gingeras TR (2013). STAR: ultrafast universal RNA-seq aligner. Bioinformatics 29, 15–21. [DOI] [PMC free article] [PubMed] [Google Scholar]
- Doyle JP, Dougherty JD, Heiman M, Schmidt EF, Stevens TR, Ma G, Bupp S, Shrestha P, Shah RD, Doughty ML, et al. (2008). Application of a translational profiling approach for the comparative analysis of CNS cell types. Cell 135, 749–762. [DOI] [PMC free article] [PubMed] [Google Scholar]
- Dragileva E, Hendricks A, Teed A, Gillis T, Lopez ET, Friedberg EC, Kucherlapati R, Edelmann W, Lunetta KL, MacDonald ME, et al. (2009). Intergenerational and striatal CAG repeat instability in Huntington’s disease knock-in mice involve different DNA repair genes. Neurobiology of disease 33, 37–47. [DOI] [PMC free article] [PubMed] [Google Scholar]
- Fenno LE, Mattis J, Ramakrishnan C, Hyun M, Lee SY, He M, Tucciarone J, Selimbeyoglu A, Berndt A, Grosenick L, et al. (2014). Targeting cells with single vectors using multiple-feature Boolean logic. Nature methods 11, 763–772. [DOI] [PMC free article] [PubMed] [Google Scholar]
- Franich NR, Hickey MA, Zhu C, Osborne GF, Ali N, Chu T, Bove NH, Lemesre V, Lerner RP, Zeitlin SO, et al. (2019). Phenotype onset in Huntington’s disease knock-in mice is correlated with the incomplete splicing of the mutant huntingtin gene. Journal of neuroscience research. [DOI] [PMC free article] [PubMed] [Google Scholar]
- Gerfen CR (1992). The neostriatal mosaic: multiple levels of compartmental organization in the basal ganglia. Annual review of neuroscience 15, 285–320. [DOI] [PubMed] [Google Scholar]
- Germain P, Kammerer S, Perez E, Peluso-Iltis C, Tortolani D, Zusi FC, Starrett J, Lapointe P, Daris JP, Marinier A, et al. (2004). Rational design of RAR-selective ligands revealed by RARbeta crystal stucture. EMBO reports 5, 877–882. [DOI] [PMC free article] [PubMed] [Google Scholar]
- Gonitel R, Moffitt H, Sathasivam K, Woodman B, Detloff PJ, Faull RL, and Bates GP (2008). DNA instability in postmitotic neurons. Proceedings of the National Academy of Sciences of the United States of America 105, 3467–3472. [DOI] [PMC free article] [PubMed] [Google Scholar]
- Graybiel AM, and Ragsdale CW Jr. (1978). Histochemically distinct compartments in the striatum of human, monkeys, and cat demonstrated by acetylthiocholinesterase staining. Proceedings of the National Academy of Sciences of the United States of America 75, 5723–5726. [DOI] [PMC free article] [PubMed] [Google Scholar]
- Group, T.H.s.D.C.R. (1993). A novel gene containing a trinucleotide repeat that is expanded and unstable on Huntington’s disease chromosomes. The Huntington’s Disease Collaborative Research Group. Cell 72, 971–983. [DOI] [PubMed] [Google Scholar]
- Hachigian LJ, Carmona V, Fenster RJ, Kulicke R, Heilbut A, Sittler A, Pereira de Almeida L, Mesirov JP, Gao F, Kolaczyk ED, et al. (2017). Control of Huntington’s Disease-Associated Phenotypes by the Striatum-Enriched Transcription Factor Foxp2. Cell reports 21, 2688–2695. [DOI] [PubMed] [Google Scholar]
- Haghverdi L, Lun ATL, Morgan MD, and Marioni JC (2018). Batch effects in single-cell RNA-sequencing data are corrected by matching mutual nearest neighbors. Nature biotechnology 36, 421–427. [DOI] [PMC free article] [PubMed] [Google Scholar]
- Hedreen JC, and Folstein SE (1995). Early loss of neostriatal striosome neurons in Huntington’s disease. Journal of neuropathology and experimental neurology 54, 105–120. [DOI] [PubMed] [Google Scholar]
- Heikkinen T, Lehtimaki K, Vartiainen N, Puolivali J, Hendricks SJ, Glaser JR, Bradaia A, Wadel K, Touller C, Kontkanen O, et al. (2012). Characterization of neurophysiological and behavioral changes, MRI brain volumetry and 1H MRS in zQ175 knock-in mouse model of Huntington’s disease. PloS one 7, e50717. [DOI] [PMC free article] [PubMed] [Google Scholar]
- Heiman M, Kulicke R, Fenster RJ, Greengard P, and Heintz N (2014). Cell type-specific mRNA purification by translating ribosome affinity purification (TRAP). Nature protocols 9, 1282–1291. [DOI] [PMC free article] [PubMed] [Google Scholar]
- Heiman M, Schaefer A, Gong S, Peterson JD, Day M, Ramsey KE, Suarez-Farinas M, Schwarz C, Stephan DA, Surmeier DJ, et al. (2008). A translational profiling approach for the molecular characterization of CNS cell types. Cell 135, 738–748. [DOI] [PMC free article] [PubMed] [Google Scholar]
- Hie B, Bryson B, and Berger B (2019). Efficient integration of heterogeneous single-cell transcriptomes using Scanorama. Nature biotechnology 37, 685–691. [DOI] [PMC free article] [PubMed] [Google Scholar]
- Hodges A, Strand AD, Aragaki AK, Kuhn A, Sengstag T, Hughes G, Elliston LA, Hartog C, Goldstein DR, Thu D, et al. (2006). Regional and cellular gene expression changes in human Huntington’s disease brain. Human molecular genetics 15, 965–977. [DOI] [PubMed] [Google Scholar]
- Ingrand S, Barrier L, Lafay-Chebassier C, Fauconneau B, Page G, and Hugon J (2007). The oxindole/imidazole derivative C16 reduces in vivo brain PKR activation. FEBS letters 581, 4473–4478. [DOI] [PubMed] [Google Scholar]
- Keenan AB, Torre D, Lachmann A, Leong AK, Wojciechowicz ML, Utti V, Jagodnik KM, Kropiwnicki E, Wang Z, and Ma’ayan A (2019). ChEA3: transcription factor enrichment analysis by orthogonal omics integration. Nucleic acids research 47, W212–W224. [DOI] [PMC free article] [PubMed] [Google Scholar]
- Khakh BS, Beaumont V, Cachope R, Munoz-Sanjuan I, Goldman SA, and Grantyn R (2017). Unravelling and Exploiting Astrocyte Dysfunction in Huntington’s Disease. Trends in neurosciences 40, 422–437. [DOI] [PMC free article] [PubMed] [Google Scholar]
- Kim Y, Park J, Kim S, Kim M, Kang MG, Kwak C, Kang M, Kim B, Rhee HW, and Kim VN (2018). PKR Senses Nuclear and Mitochondrial Signals by Interacting with Endogenous Double-Stranded RNAs. Molecular cell 71, 1051–1063 e1056. [DOI] [PubMed] [Google Scholar]
- Kornreich L, Bron-Harlev E, Hoffmann C, Schwarz M, Konen O, Schoenfeld T, Straussberg R, Nahum E, Ibrahim AK, Eshel G, et al. (2005). Thiamine deficiency in infants: MR findings in the brain. AJNR American journal of neuroradiology 26, 1668–1674. [PMC free article] [PubMed] [Google Scholar]
- Korsunsky I, Fan J, Slowikowski K, Zhang F, Wei K, Baglaenko Y, Brenner M, Loh P-R, and Raychaudhuri S (2018). Fast, sensitive, and accurate integration of single cell data with Harmony. BioRxiv 461954. [DOI] [PMC free article] [PubMed] [Google Scholar]
- Korsunsky I, Nathan A, Millard N, and Raychaudhuri S (2019). Presto scales Wilcoxon and auROC analyses to millions of observations. bioRxiv bioRxiv 653253; doi: 10.1101/653253. [DOI] [Google Scholar]
- Kuleshov MV, Jones MR, Rouillard AD, Fernandez NF, Duan Q, Wang Z, Koplev S, Jenkins SL, Jagodnik KM, Lachmann A, et al. (2016). Enrichr: a comprehensive gene set enrichment analysis web server 2016 update. Nucleic acids research 44, W90–97. [DOI] [PMC free article] [PubMed] [Google Scholar]
- Lachmann A, Xu H, Krishnan J, Berger SI, Mazloom AR, and Ma’ayan A (2010). ChEA: transcription factor regulation inferred from integrating genome-wide ChIP-X experiments. Bioinformatics 26, 2438–2444. [DOI] [PMC free article] [PubMed] [Google Scholar]
- Langfelder P, Cantle JP, Chatzopoulou D, Wang N, Gao F, Al-Ramahi I, Lu XH, Ramos EM, El-Zein K, Zhao Y, et al. (2016). Integrated genomics and proteomics define huntingtin CAG length-dependent networks in mice. Nature neuroscience 19, 623–633. [DOI] [PMC free article] [PubMed] [Google Scholar]
- Langfelder P, and Horvath S (2008). WGCNA: an R package for weighted correlation network analysis. BMC bioinformatics 9, 559. [DOI] [PMC free article] [PubMed] [Google Scholar]
- Langfelder P, Mischel PS, and Horvath S (2013). When is hub gene selection better than standard meta-analysis? PloS one 8, e61505. [DOI] [PMC free article] [PubMed] [Google Scholar]
- Li H, and Durbin R (2009). Fast and accurate short read alignment with Burrows-Wheeler transform. Bioinformatics 25, 1754–1760. [DOI] [PMC free article] [PubMed] [Google Scholar]
- Liddelow SA, Guttenplan KA, Clarke LE, Bennett FC, Bohlen CJ, Schirmer L, Bennett ML, Munch AE, Chung WS, Peterson TC, et al. (2017). Neurotoxic reactive astrocytes are induced by activated microglia. Nature 541, 481–487. [DOI] [PMC free article] [PubMed] [Google Scholar]
- Liu XY, Wei B, Shi HX, Shan YF, and Wang C (2010). Tom70 mediates activation of interferon regulatory factor 3 on mitochondria. Cell research 20, 994–1011. [DOI] [PubMed] [Google Scholar]
- Love MI, Huber W, and Anders S (2014). Moderated estimation of fold change and dispersion for RNA-seq data with DESeq2. Genome biology 15, 550. [DOI] [PMC free article] [PubMed] [Google Scholar]
- Luthi-Carter R, Strand A, Peters NL, Solano SM, Hollingsworth ZR, Menon AS, Frey AS, Spektor BS, Penney EB, Schilling G, et al. (2000). Decreased expression of striatal signaling genes in a mouse model of Huntington’s disease. Human molecular genetics 9, 1259–1271. [DOI] [PubMed] [Google Scholar]
- Mangiarini L, Sathasivam K, Seller M, Cozens B, Harper A, Hetherington C, Lawton M, Trottier Y, Lehrach H, Davies SW, et al. (1996). Exon 1 of the HD gene with an expanded CAG repeat is sufficient to cause a progressive neurological phenotype in transgenic mice. Cell 87, 493–506. [DOI] [PubMed] [Google Scholar]
- Manley K, Shirley TL, Flaherty L, and Messer A (1999). Msh2 deficiency prevents in vivo somatic instability of the CAG repeat in Huntington disease transgenic mice. Nature genetics 23, 471–473. [DOI] [PubMed] [Google Scholar]
- Martin A, Calvigioni D, Tzortzi O, Fuzik J, Warnberg E, and Meletis K (2019). A Spatiomolecular Map of the Striatum. Cell reports 29, 4320–4333 e4325. [DOI] [PubMed] [Google Scholar]
- Mathys H, Davila-Velderrain J, Peng Z, Gao F, Mohammadi S, Young JZ, Menon M, He L, Abdurrob F, Jiang X, et al. (2019). Single-cell transcriptomic analysis of Alzheimer’s disease. Nature 570, 332–337. [DOI] [PMC free article] [PubMed] [Google Scholar]
- Menalled LB, Kudwa AE, Miller S, Fitzpatrick J, Watson-Johnson J, Keating N, Ruiz M, Mushlin R, Alosio W, McConnell K, et al. (2012). Comprehensive behavioral and molecular characterization of a new knock-in mouse model of Huntington’s disease: zQ175. PloS one 7, e49838. [DOI] [PMC free article] [PubMed] [Google Scholar]
- Menalled LB, Sison JD, Dragatsis I, Zeitlin S, and Chesselet MF (2003). Time course of early motor and neuropathological anomalies in a knock-in mouse model of Huntington’s disease with 140 CAG repeats. The Journal of comparative neurology 465, 11–26. [DOI] [PubMed] [Google Scholar]
- Menalled LB, Sison JD, Wu Y, Olivieri M, Li XJ, Li H, Zeitlin S, and Chesselet MF (2002). Early motor dysfunction and striosomal distribution of huntingtin microaggregates in Huntington’s disease knock-in mice. The Journal of neuroscience : the official journal of the Society for Neuroscience 22, 8266–8276. [DOI] [PMC free article] [PubMed] [Google Scholar]
- Meurs EF, Watanabe Y, Kadereit S, Barber GN, Katze MG, Chong K, Williams BR, and Hovanessian AG (1992). Constitutive expression of human double-stranded RNA-activated p68 kinase in murine cells mediates phosphorylation of eukaryotic initiation factor 2 and partial resistance to encephalomyocarditis virus growth. Journal of virology 66, 5805–5814. [DOI] [PMC free article] [PubMed] [Google Scholar]
- Miller JW, Urbinati CR, Teng-Umnuay P, Stenberg MG, Byrne BJ, Thornton CA, and Swanson MS (2000). Recruitment of human muscleblind proteins to (CUG)(n) expansions associated with myotonic dystrophy. The EMBO journal 19, 4439–4448. [DOI] [PMC free article] [PubMed] [Google Scholar]
- Mohammadi S, Davila-Velderrain J, and Kellis M (2019). Multi-resolution single-cell state characterization via joint archetypal/network analysis. bioRxiv. [Google Scholar]
- Mohammadi S, Ravindra V, Gleich DF, and Grama A (2018). A geometric approach to characterize the functional identity of single cells. Nature communications 9, 1516. [DOI] [PMC free article] [PubMed] [Google Scholar]
- Molyneaux BJ, Arlotta P, Menezes JR, and Macklis JD (2007). Neuronal subtype specification in the cerebral cortex. Nature reviews Neuroscience 8, 427–437. [DOI] [PubMed] [Google Scholar]
- Musiek ES, Lim MM, Yang G, Bauer AQ, Qi L, Lee Y, Roh JH, Ortiz-Gonzalez X, Dearborn JT, Culver JP, et al. (2013). Circadian clock proteins regulate neuronal redox homeostasis and neurodegeneration. The Journal of clinical investigation 123, 5389–5400. [DOI] [PMC free article] [PubMed] [Google Scholar]
- Niewiadomska-Cimicka A, Krzyzosiak A, Ye T, Podlesny-Drabiniok A, Dembele D, Dolle P, and Krezel W (2017). Genome-wide Analysis of RARbeta Transcriptional Targets in Mouse Striatum Links Retinoic Acid Signaling with Huntington’s Disease and Other Neurodegenerative Disorders. Molecular neurobiology 54, 3859–3878. [DOI] [PubMed] [Google Scholar]
- Nishi M, Sakagami H, Komazaki S, Kondo H, and Takeshima H (2003). Coexpression of junctophilin type 3 and type 4 in brain. Brain research Molecular brain research 118, 102–110. [DOI] [PubMed] [Google Scholar]
- Reiner A, Albin RL, Anderson KD, D’Amato CJ, Penney JB, and Young AB (1988). Differential loss of striatal projection neurons in Huntington disease. Proceedings of the National Academy of Sciences of the United States of America 85, 5733–5737. [DOI] [PMC free article] [PubMed] [Google Scholar]
- Ritchie ME, Phipson B, Wu D, Hu Y, Law CW, Shi W, and Smyth GK (2015). limma powers differential expression analyses for RNA-sequencing and microarray studies. Nucleic acids research. [DOI] [PMC free article] [PubMed] [Google Scholar]
- Rongvaux A, Jackson R, Harman CC, Li T, West AP, de Zoete MR, Wu Y, Yordy B, Lakhani SA, Kuan CY, et al. (2014). Apoptotic caspases prevent the induction of type I interferons by mitochondrial DNA. Cell 159, 1563–1577. [DOI] [PMC free article] [PubMed] [Google Scholar]
- Saudou F, Finkbeiner S, Devys D, and Greenberg ME (1998). Huntingtin acts in the nucleus to induce apoptosis but death does not correlate with the formation of intranuclear inclusions. Cell 95, 55–66. [DOI] [PubMed] [Google Scholar]
- Saunders A, Macosko EZ, Wysoker A, Goldman M, Krienen FM, de Rivera H, Bien E, Baum M, Bortolin L, Wang S, et al. (2018). Molecular Diversity and Specializations among the Cells of the Adult Mouse Brain. Cell 174, 1015–1030 e1016. [DOI] [PMC free article] [PubMed] [Google Scholar]
- Sawiak SJ, Wood NI, Williams GB, Morton AJ, and Carpenter TA (2009). Voxel-based morphometry in the R6/2 transgenic mouse reveals differences between genotypes not seen with manual 2D morphometry. Neurobiology of disease 33, 20–27. [DOI] [PubMed] [Google Scholar]
- Schatton D, Pla-Martin D, Marx MC, Hansen H, Mourier A, Nemazanyy I, Pessia A, Zentis P, Corona T, Kondylis V, et al. (2017). CLUH regulates mitochondrial metabolism by controlling translation and decay of target mRNAs. The Journal of cell biology 216, 675–693. [DOI] [PMC free article] [PubMed] [Google Scholar]
- Schlehe JS, Journel MS, Taylor KP, Amodeo KD, and LaVoie MJ (2013). The mitochondrial disease associated protein Ndufaf2 is dispensable for Complex-1 assembly but critical for the regulation of oxidative stress. Neurobiology of disease 58, 57–67. [DOI] [PMC free article] [PubMed] [Google Scholar]
- Seabold JS, and Perktold J (2010). Statsmodels: Econometric and Statistical Modeling with Python. Paper presented at: Python in Science Conference (Austin, Texas). [Google Scholar]
- Smolders J, Heutinck KM, Fransen NL, Remmerswaal EBM, Hombrink P, Ten Berge IJM, van Lier RAW, Huitinga I, and Hamann J (2018). Tissue-resident memory T cells populate the human brain. Nature communications 9, 4593. [DOI] [PMC free article] [PubMed] [Google Scholar]
- Srikanth P, Lagomarsino VN, Pearse RV 2nd, Liao M, Ghosh S, Nehme R, Seyfried N, Eggan K, and Young-Pearse TL (2018). Convergence of independent DISC1 mutations on impaired neurite growth via decreased UNC5D expression. Translational psychiatry 8, 245. [DOI] [PMC free article] [PubMed] [Google Scholar]
- Vonsattel JP, Myers RH, Stevens TJ, Ferrante RJ, Bird ED, and Richardson EP Jr. (1985). Neuropathological classification of Huntington’s disease. Journal of neuropathology and experimental neurology 44, 559–577. [DOI] [PubMed] [Google Scholar]
- Wang M, Zhao Y, and Zhang B (2015). Efficient Test and Visualization of Multi-Set Intersections. Scientific reports 5, 16923. [DOI] [PMC free article] [PubMed] [Google Scholar]
- Wang X, Fan Z, Wang B, Luo J, and Ke ZJ (2007). Activation of double-stranded RNA-activated protein kinase by mild impairment of oxidative metabolism in neurons. Journal of neurochemistry 103, 2380–2390. [DOI] [PubMed] [Google Scholar]
- Wertz MH, Mitchem MR, Pineda SS, Hachigian LJ, Lee H, Lau V, Powers A, Kulicke R, Madan GK, Colic M, et al. (2020). Genome-wide In Vivo CNS Screening Identifies Genes that Modify CNS Neuronal Survival and mHTT Toxicity. Neuron. [DOI] [PMC free article] [PubMed] [Google Scholar]
- West AP, Khoury-Hanold W, Staron M, Tal MC, Pineda CM, Lang SM, Bestwick M, Duguay BA, Raimundo N, MacDuff DA, et al. (2015). Mitochondrial DNA stress primes the antiviral innate immune response. Nature 520, 553–557. [DOI] [PMC free article] [PubMed] [Google Scholar]
- Wheeler VC, Auerbach W, White JK, Srinidhi J, Auerbach A, Ryan A, Duyao MP, Vrbanac V, Weaver M, Gusella JF, et al. (1999). Length-dependent gametic CAG repeat instability in the Huntington’s disease knock-in mouse. Human molecular genetics 8, 115–122. [DOI] [PubMed] [Google Scholar]
- White MJ, McArthur K, Metcalf D, Lane RM, Cambier JC, Herold MJ, van Delft MF, Bedoui S, Lessene G, Ritchie ME, et al. (2014). Apoptotic caspases suppress mtDNA-induced STING-mediated type I IFN production. Cell 159, 1549–1562. [DOI] [PMC free article] [PubMed] [Google Scholar]
- Wilson DJ (2019). The harmonic mean p-value for combining dependent tests. Proceedings of the National Academy of Sciences of the United States of America 116, 1195–1200. [DOI] [PMC free article] [PubMed] [Google Scholar]
- Wullner U, Young AB, Penney JB, and Beal MF (1994). 3-Nitropropionic acid toxicity in the striatum. Journal of neurochemistry 63, 1772–1781. [DOI] [PubMed] [Google Scholar]
- Zeisel A, Hochgerner H, Lonnerberg P, Johnsson A, Memic F, van der Zwan J, Haring M, Braun E, Borm LE, La Manno G, et al. (2018). Molecular Architecture of the Mouse Nervous System. Cell 174, 999–1014 e1022. [DOI] [PMC free article] [PubMed] [Google Scholar]
- Zhang B, and Horvath S (2005). A general framework for weighted gene co-expression network analysis. Statistical applications in genetics and molecular biology 4, Article17. [DOI] [PubMed] [Google Scholar]
- Zhang Y, Liu T, Meyer CA, Eeckhoute J, Johnson DS, Bernstein BE, Nusbaum C, Myers RM, Brown M, Li W, et al. (2008). Model-based analysis of ChIP-Seq (MACS). Genome biology 9, R137. [DOI] [PMC free article] [PubMed] [Google Scholar]
- Zhang Y, Pak C, Han Y, Ahlenius H, Zhang Z, Chanda S, Marro S, Patzke C, Acuna C, Covy J, et al. (2013). Rapid single-step induction of functional neurons from human pluripotent stem cells. Neuron 78, 785–798. [DOI] [PMC free article] [PubMed] [Google Scholar]
- Zuccato C, Valenza M, and Cattaneo E (2010). Molecular mechanisms and potential therapeutical targets in Huntington’s disease. Physiological reviews 90, 905–981. [DOI] [PubMed] [Google Scholar]
Associated Data
This section collects any data citations, data availability statements, or supplementary materials included in this article.
Supplementary Materials
Table S1 (Excel File). Differentially expressed genes, as reported by TRAP from the studied cell types in 9-week old R6/2 model tissue, and 3-month old or 6-month old CAG knockin allele model tissue, as well as KEGG pathways, predicted ChEA regulators, and sample group information, related to Figures 2–3.
Table S2 (Excel File). Differentially expressed protein-coding genes in the most abundant striatal cell types reported by snRNA-Seq from the striatum of 9-week old R6/2 model tissue, 6-month old zQ175DN model tissue, as well as human caudate putamen samples (Y-chromosome genes removed for human data), and sample group information, related to Figures 4–5.
Data Availability Statement
All sequencing datasets generated as part of this study are publicly available in NCBI GEO under accession #GSE152058. Code used to construct ACTIONet and identify cell types is accessible from https://github.com/shmohammadi86/ACTIONet.