

Abstract
CHEK2 encodes a serine/threonine kinase (Chk2) activated by ATM in response to DNA double-strand breaks. On the one hand, CHEK2 has been described as a tumor suppressor with proapoptotic, cell-cycle checkpoint and mitotic functions. On the other hand, Chk2 is also commonly activated (phosphorylated at T68) in cancers and precancerous lesions. Here, we report an extensive characterization of CHEK2 across the panel of 60 established cancer cell lines from the NCI Anticancer Screen (the NCI-60) using genomic and proteomic analyses, including exon-specific mRNA expression, DNA copy-number variation (CNV) by aCGH, exome sequencing, as well as western blot analyses for total and activated (pT68-Chk2) Chk2. We show that the high heterogeneity of Chk2 levels in cancer cells is primarily due to its inactivation (owing to low gene expression, alternative splicing, point mutations, copy-number alterations and premature truncation) or reduction of protein levels. Moreover, we observe that a significant percentage of cancer cells (12% of the NCI-60 and HeLa cells) show high endogenous Chk2 activation, which is always associated with p53 inactivation, and which is accompanied by downregulation of the Fanconi anemia and homologous recombination pathways. We also report the presence of activated Chk2 (pT68-Chk2) along with histone γ-H2AX in centrosomes.
Keywords: Chk2, centrosome, H2AX, p53, BRCA1, Fanconi anemia
Introduction
The cell-cycle checkpoint gene CHEK2 gene encodes Chk2, a serine/threonine kinase activated in response to double-strand breaks generated by endogenous oncogenic activation, replication defects, ionizing radiations, DNA-targeted chemotherapeutic agents and apoptosis (Bartek and Lukas, 2003; Ahn et al., 2004; Pommier et al., 2005; Harper and Elledge, 2007; Solier et al., 2009). Chk2 activation is initiated by its phosphorylation at threonine-68 (T68) by the ataxia telangiectasia mutated kinase, ATM (Ahn et al., 2000; Matsuoka et al., 2000) or other phosphatidyl-inositol-3 kinase-family kinases (ataxia telangiectasia-related kinase (ATR) and DNA-dependent protein kinase (DNA-PK)) (Bartek and Lukas, 2003; Li and Stern, 2005; Pommier et al., 2006). T68 phosphorylation, in turn, induces Chk2 homodimerization and auto-phosphorylation in trans (Ahn and Prives, 2002; Ahn et al., 2002; Schwarz et al., 2003; Li et al., 2008). Chk2 phosphorylates the substrate proteins involved in cell-cycle arrest, apoptosis, DNA-damage response and mitotic spindle assembly, including CDC25A, CDC25C, p53, E2F1, BRCA1 and BRCA2 (Matsuoka et al., 1998; Chehab et al., 2000; Hirao et al., 2000; Falck et al., 2001; Stevens et al., 2003; Ou et al., 2005; Pommier et al., 2005, 2006; Bahassi et al., 2008; Stolz et al., 2010).
The tumor-suppressor function of Chk2 stems from the epidemiological finding that Chk2 is inactivated by germline mutations in patients with Li–Fraumeni-like syndrome without p53 mutations (Bell et al., 1999) and from mouse genetic studies showing that knocking out CHEK2 in mice (Hirao et al., 2002; Takai et al., 2002) increases tumor incidence when p53, ATM, BRCA1 or Chkl are inactivated together with Chk2 (Cao et al., 2006; Niida et al., 2010). CHEK2 germline mutations have been identified in familial cases of breast cancer (Meijers-Heijboer et al., 2002; Nevanlinna and Bartek, 2006) and CHEK2 appears to be lost in more than 50% of lung cancers (Stolz et al., 2010). In response to BRCA1 deficiency, activation of the ATM–Chk2–p53 signaling pathway may contribute to the suppression of neoplastic transformation, as shown in BRCA1 Δ11/Δ11, CHEK2−/− mouse models (Cao et al., 2006), which are viable but prone to the development of neoplasia. This finding suggests a role for Chk2 as a tumor suppressor in response to BRCA1 deficiency as well as a key activator of BRCA1 during mitosis (Stolz et al., 2010). However, Chk2 activation (pT68-Chk2) is not always associated with apoptosis (Solier et al., 2009). pT68-Chk2 has recently been found to occur physiologically during mitosis as a critical step for BRCA1 phosphorylation on serine-988, which appears critical for maintaining chromosome number stability (Stolz et al., 2010). Endogenous T68-phosphorylated/activated Chk2 has been found in a wide range of cancers and precancerous lesions (Gorgoulis et al., 2005), raising the possibility that Chk2 may in some cases contribute to the carcinogenic process. In support of this hypothesis, Chk2 inactivation by small interfering RNA or small-molecule inhibitors is sufficient to kill ovarian cancer cell lines with endogenously activated Chk2 (Jobson et al., 2009). Similarly, HEK-293 cells are also killed after Chk2 antisense transfection (Yu et al., 2001). Moreover, Castedo et al. (2004) have shown that HeLa and HCT-116 cells can be sensitized to doxorubicin by transfection with a dominant-negative Chk2 mutant. The molecular mechanisms that may determine the ‘addiction’ of cancer cells to Chk2 are not presently understood. One possibility is that Chk2 may suppress apoptosis in p53-deficient cells not only by activating the DNA-damage response and cell-cycle checkpoints, but also by promoting the release of survivin from mitochondria (Ghosh et al., 2006).
The NCI-60 panel consists of 60 cancer cell lines from nine tissues of origin: 6 from hematopoietic malignancies, 10 melanomas, 5 lines from breast, 6 from the CNS, 7 from colon, 9 from lung, 7 ovarian, 2 from prostate and 8 from renal cancers. The NCI-60 panel was developed by the Developmental Therapeutics Program of the National Cancer Institute to screen and discover novel anticancer drugs (Shoemaker, 2006; Holbeck et al., 2010). The NCI-60 panel also provides a unique database because of its extensive characterization for genome-wide gene expression across multiple platforms, micro-RNA and protein expression (Scherf et al., 2000; Nishizuka et al., 2003; Bussey et al., 2006; Shankavaram et al., 2007; Reinhold et al., 2010); gene copy number by array comparative genomic hybridization (aCGH) (Nishizuka et al., 2003); karyotypic aberrations by spectral karyotyping (Roschke et al., 2003); oncogene mutations by capillary sequencing (Ikediobi et al., 2006) and sensitivity to more than 400 000 natural and synthetic compounds through in vitro toxicity screening (Shoemaker, 2006; Holbeck et al., 2010; Reinhold et al., 2010).
In the present paper, we present the genome-wide and proteomic analysis of the NCI-60 for CHEK2 mRNA expression, alternative splicing, copy-number alterations, mutations, as well as total and activated (phosphorylated) Chk2 protein levels, and perform differential gene expression analysis between cell lines with endogenously activated Chk2 and cell lines without such phenotype.
Results
CHEK2 transcript levels exhibit broad expression range across the NCI-60
CHEK2 transcript levels were determined by combining data generated from five different microarray platforms. Details on microarray quality control and z-score transformations are included under Materials and methods, and the data can be accessed at http://discover.nci.nih.gov/cellminer/. Data sets yielded a total of 25 good-quality, highly correlated probe sets from both Affymetrix and Agilent chips, with an average Pearson’s correlation coefficient of 0.788 for all probe sets and an average Pearson’s correlation coefficient of 0.805 between the Agilent and Affymetrix probe sets. Overall, the average normalized intensity for the Affymetrix probe sets was 5.32 (log2 intensity), with a range of 3.19 log2 (9.1-fold variation) and an s.d. of 0.79 (see Figure 1).
Figure 1.
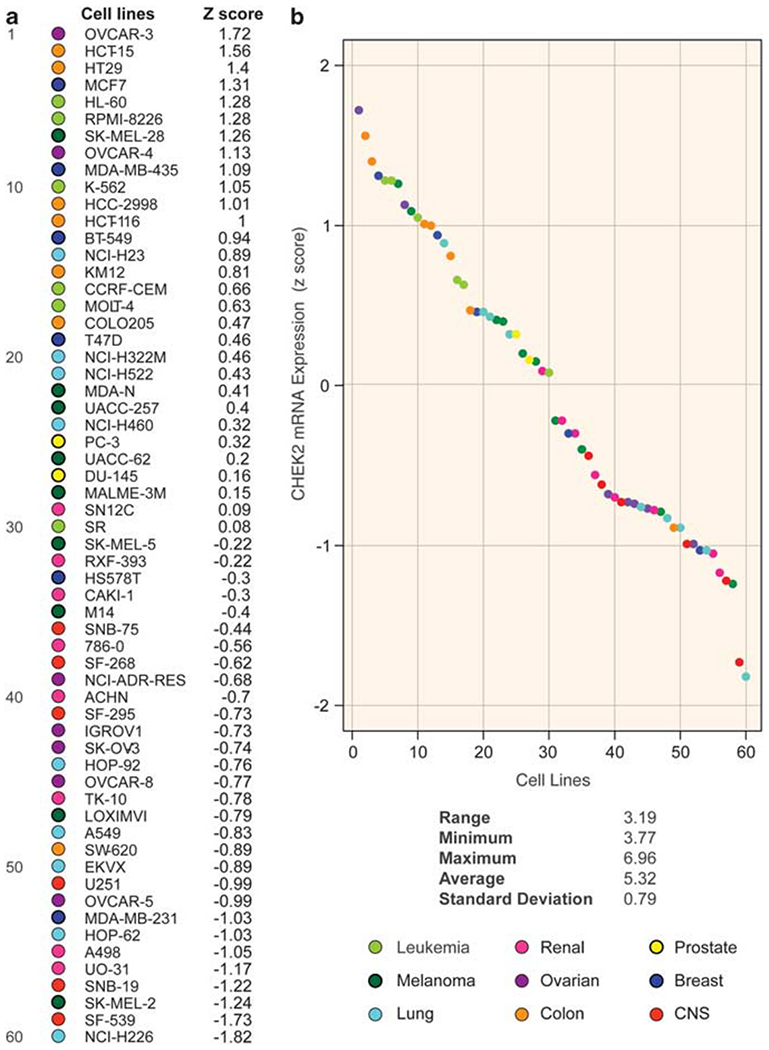
CHEK2 mRNA varies widely across the NCI-60 and shows tissue-specific expression. (a) CHEK2 expression in the 60 cancer cell lines from the NCI-60 panel sorted by decreasing CHEK2 mRNA expression (z-score). Tissues of origin are color-coded (see bottom right). (b) A dot plot of CHEK2 expression. Cell lines are ordered on the x-axis as in panel a. Range, minimum, maximum and average intensity below the figure represent the mean log2 values for the Affymetrix probe sets.
The ovarian cancer cell line OVCAR-3 showed the highest CHEK2 transcript levels (1.72 s.d.s above average for the z-scored values), whereas the lung cancer cell line NCI-H226 showed the lowest (1.82 s.d.s below average). A certain degree of tissue specificity for CHEK2 mRNA expression was observed (Figure 1), with cell lines of hematopoietic origin presenting above-average values (P<0.01, χ2-test, two-sided), and CNS and renal lines being the lowest expressers (P<0.01 and P<0.05, χ2-test, two-sided) (see also Figure 2a, left panel for mean-centered representation). Cell lines derived from lung cancer samples showed high variability in CHEK2 transcript expression, ranging from very low (NCI-H226, 1.82 s.d.s below the average for CHEK2 expression in the NCI-60) to high intensities (NCI-H23, 0.89 s.d.s above average). These results demonstrate the high heterogeneity (approximately eight-fold) for CHEK2 expression across the NCI-60.
Figure 2.
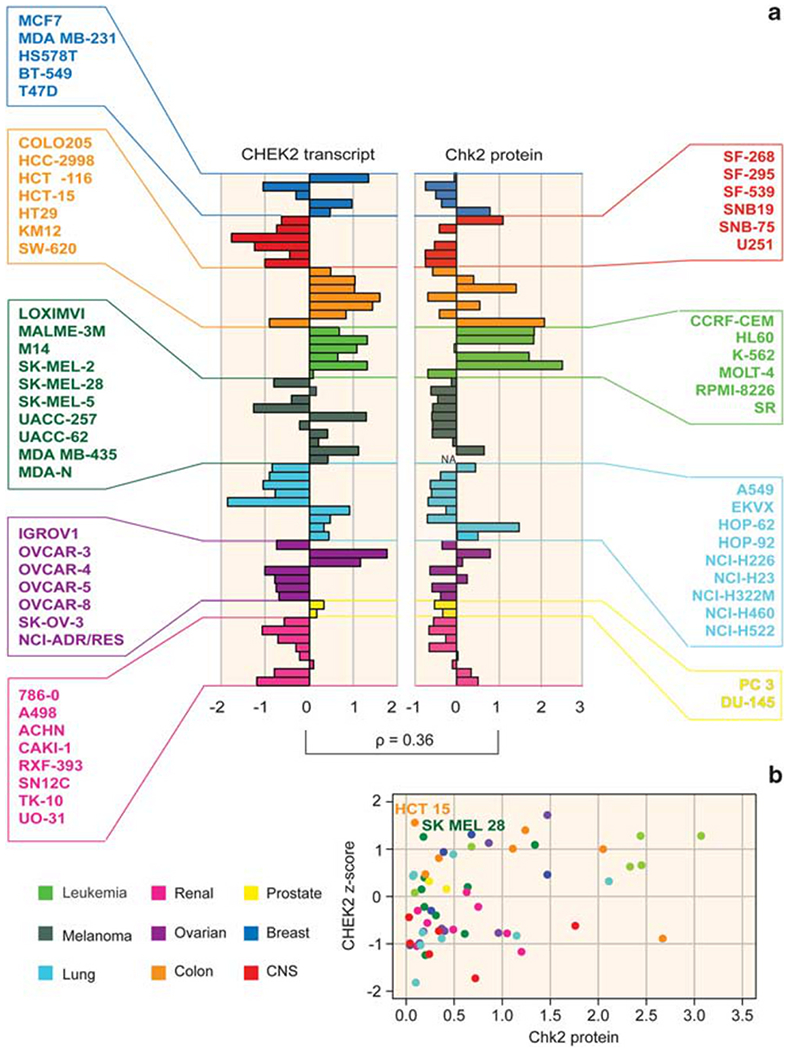
Relationship between CHEK2 mRNA and Chk2 protein levels across the NCI-60. (a) Mean-centered bar graphs showing intensities for CHEK2 transcript (left) and total Chk2 protein (right). The CHEK2 transcript values are z-score-normalized. r: Pearson’s correlation coefficient between transcript and protein levels (0.36, P<0.01, two-sided). The bars are colored according to tissues of origin (see bottom left for legend). NA: not available. (b) A scatter plot of Chk2 protein versus transcript. The two outliers (HCT-15 and SK-MEL-28) discussed in the text are indicated. x-axis: Total protein levels (ratios to HeLa cell line). y-axis: CHEK2 transcript intensity (z-score).
aCGH analysis revealed that two cell lines with low transcripts, melanoma SK-MEL-2 and lung cancer NCI-H226, were hypo-diploid at the CHEK2 locus (ch.22, cytoband 22q12.2) (see Supplementary Figure 1). On the other hand, in spite of the marked focal amplification of the CHEK2 locus in the ovarian line OVCAR-5, its transcript was scarcely expressed.
Novel CHEK2 point mutations in the NCI-60
Next-generation sequencing and targeted resequencing are currently being performed across the NCI-60 to analyze all exons of every known gene (unpublished data; ongoing analysis). Here we only report our results for CHEK2. Our analysis revealed 16 single-nucleotide variants in 11 cell lines (no short insertions or deletions were detected). Ten of these variants were further tested by conventional capillary sequencing, and all of them were validated (Table 1). In agreement with previous sequencing, we confirmed the two previously described point mutations, R145W and A247D, in the HCT-15 colon line (Lee et al., 2001). The effect of codon changes on the protein were evaluated by using the SIFT algorithm (Ng and Henikoff, 2003). A previously unknown missense CHEK2 mutation, E394K in the SK-MEL-28 cell line, was predicted to be damaging (Table 1). In light of the SIFT prediction and of the key position of this mutation in the kinase domain of Chk2, the novel E394K missense mutation variant found in melanoma SK-MEL-28 cells is likely to interfere with Chk2 activity. Together, exome sequencing revealed novel potentially inactivating CHEK2 mutations.
Table 1.
All 10 validated CHEK2 coding region SNVs identified in the NCI-60 panel
| Cell line | Varianta | Gene:Exonb | Known mutation/SNPc | % SNVd | Codon change | AA change | SIFT predictione |
|---|---|---|---|---|---|---|---|
| SK-MEL-28 | chr22:27421777 | CHEK2:12 | None | 32% | GAA>AAA | E394K | DAMAGING |
| HCT-15 | chr22:27451242 | CHEK2:4 | None | 33% | CGG>TGG | R145W | DAMAGING |
| HCT-15 | chr22:27437949 | CHEK2:7 | None | 39% | GCC > GAC | A247D | DAMAGING |
| OVCAR-4 | chr22:27451016 | CHEK2:5 | None | 26% | CGT>TGT | R181C | TOLERATED |
| KM12 | chr22:27451349 | CHEK2:4 | None | 48% | GTG>GCG | V109A | TOLERATED |
| ACHN | chr22:27460458 | CHEK2:2 | rs1805129 | 100% | GAA>GAG | E41E | None |
| HT29 | chr22:27460458 | CHEK2:2 | rs1805129 | 75% | GAA>GAG | E41E | None |
| KM12 | chr22:27460458 | CHEK2:2 | rs1805129 | 64% | GAA>GAG | E41E | None |
| RPMI-8226 | chr22:27460458 | CHEK2:2 | rs1805129 | 69% | GAA>GAG | E41E | None |
| SW-620 | chr22:27460458 | CHEK2:2 | rs1805129 | 100% | GAA>GAG | E41E | None |
Abbreviations: SNV, single-nucleotide variant; NCI-60, the NCI-60 panel (comprising 60 established cancer cell lines from the NCI Anticancer Screen).
Bold letters represent the predicted amino acid substitution based on the mutated codon.
All the coordinates are in respect to human genome build 18 (hg18, March 2006).
The exon numbers are calculated according to the SpliceCenter website (http://www.tigerteamconsulting.com/SpliceCenter/SpliceOverview.jsp), and the amino-acid position is calculated according to the protein canonical isoform a (NP 009125.1).
Reports of the particular variant in the Catalogue of Somatic Mutations in Cancer (COSMIC) database (http://www.sanger.ac.uk/genetics/CGP/cosmic/) or in the case of an rs number a known single-nucleotide polymorphism cataloged in dbSNP version 130
The value represents the percentage of unique reads containing the Single Nucleotide Variation.
Sorting Intolerant From Tolerant: A prediction based on the effect of the non-synonymous amino-acid substitution on protein function (Ng and Henikoff, 2003).
Analysis of transcription factors potentially involved in CHEK2 transcriptional control
The TRANSFAC database (Matys et al., 2006) provides analyses of transcription factors, their experimentally proven binding sites and potentially regulated genes. We used this database to determine putative CHEK2 transcription factors by correlating their transcript profiles in the NCI-60 with those of CHEK2 (Supplementary Figure 2). SP1, ELF1 and MYC showed a very high correlation with CHEK2 transcripts (P<0.001 for SP1 and ELF1, and <0.01 for MYC; Pearson’s correlation coefficient test r = 0.53, 0.42 and 0.4, respectively; Supplementary Figure 2). Other significantly correlated transcription factors were GABPA/NRF-2 (P<0.01), LIN9, LIN54, CTCF and FOXA1 (P<0.05). Although these data are only correlative, they suggest further experimental confirmation for the possible role of SP1, ELF1 and MYC as CHEK2 transcription factors, and the likely interaction of multiple transcription factors in CHEK2 transcriptional regulation.
Correlation between CHEK2 transcript and Chk2 protein levels
To assess the relationship between CHEK2 transcript and Chk2 protein levels, a western blot analysis was performed in the NCI-60. The results were normalized to the HeLa cervical cancer cell line and mean-centered (Figure 2, right panel). Overall, the leukemia cell lines present the highest Chk2 protein levels (4 out of 6 cell lines, 67% around two-fold above average), whereas the melanoma lines tend to be low (with 8 out of 9 tested cell lines below average). All the CNS lines also tend to have low Chk2 protein levels (with the exception of SF-268), as do the lung cancer lines (6 out 9 lines below average). The transcript and total protein showed a significant overall positive correlation (Pearson’s correlation coefficient = 0.36, P = 0.005; Figure 2b). Notable exceptions to this correlation are represented by the colorectal cancer cell line HCT-15 and the melanoma line SK-MEL-28, both of which present high CHEK2 transcript levels but almost undetectable Chk2 protein by western blotting (Figures 2a and b). The low protein levels for the HCT-15 are due to the CHEK2 mutations R145W and A247D (Lee et al., 2001) (see above and Table 1). The SK-MEL-28 line also contains a deleterious CHEK2 mutation, which causes an amino-acid substitution, E394K. This mutation is novel and further analyses are warranted to determine whether it destabilizes the Chk2 polypeptide. Overall, our results show that measuring the CHEK2 transcript may be a suboptimal surrogate for Chk2 protein level estimation in cancer cells.
CHEK2 exon analyses
To assess potential alternative CHEK2 splice variants, we analyzed the Affymetrix GeneChip Human Exon 1.0 ST (GH Exon 1.0 ST) exon microarray database from the NCI-60. Of the 28 probe sets across the CHEK2 transcript (1 to 4 probe sets per exon; mapping and exon numbering are according to the SpliceCenter Suite (http://www.tigerteamconsulting.com/SpliceCenter/SpliceOverview.jsp); Figure 3A), 22 showed a variance >0.1 across the NCI-60. These probeset values were clustered according to their normalized, median-centered expression (to account for the different variance of each probe set) as shown in Figure 3B. Cluster analysis divided the NCI-60 into two main groups, the high- and low-CHEK2-expresser cell lines (Figure 3A, a and b, respectively). In the low-expresser group, one cell line, ovarian SK-OV-3, clustered separately and presented an aberrant decrease in transcript intensity after exon-11 (Figure 3B, purple staggered arrow at bottom right, and Supplementary Figure 3c), suggesting the occurrence of a truncated message after that exon.
Figure 3.
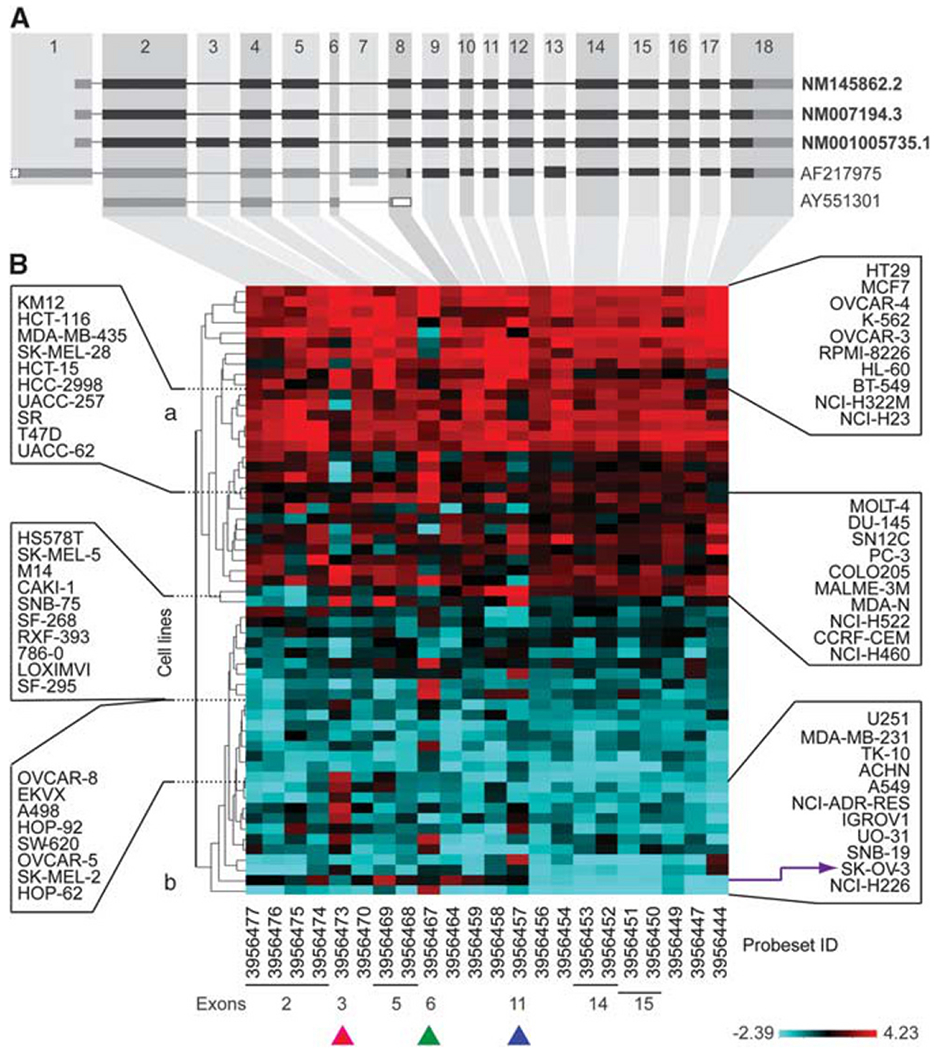
Exon array analysis of CHEK2 transcript in the NCI-60 reveals novel splice variants and premature transcript truncation in the ovarian cancer cell line SK-OV-3. (A) The three RefSeq CHEK2 isoforms (bold letters) and alternative transcripts are shown. Exons are numbered according to SpliceCenter; the black and gray boxes represent translated and untranslated exons, respectively. (B) A CIM showing median-centered probe set levels for CHEK2 exons in the NCI-60 clustered by normalized intensity. Right and left: Cell line names. Bottom: Probeset IDs. Purple arrow: SK-OV-3 cell line. Pink arrowhead: Exon-3. Green arrowhead: Exon-6. Blue arrowhead: Exon-11. a: High-CHEK2-expresser cell line cluster. b: Low-CHEK2-expresser cell line cluster.
The potential premature truncation of CHEK2 transcript in SK-OV-3 ovarian cells was tested by quantitative PCR. A cell line with uniformly high CHEK2 transcript, colorectal HCT-116, was used as a reference against SK-OV-3. The results shown in Figure 4a validate the results obtained by the exon array analysis. Notably, this CHEK2 transcript anomaly was reflected by the absence of detectable Chk2 protein by western blot analysis in SK-OV-3 cells (see Figure 2a, right panel).
Figure 4.
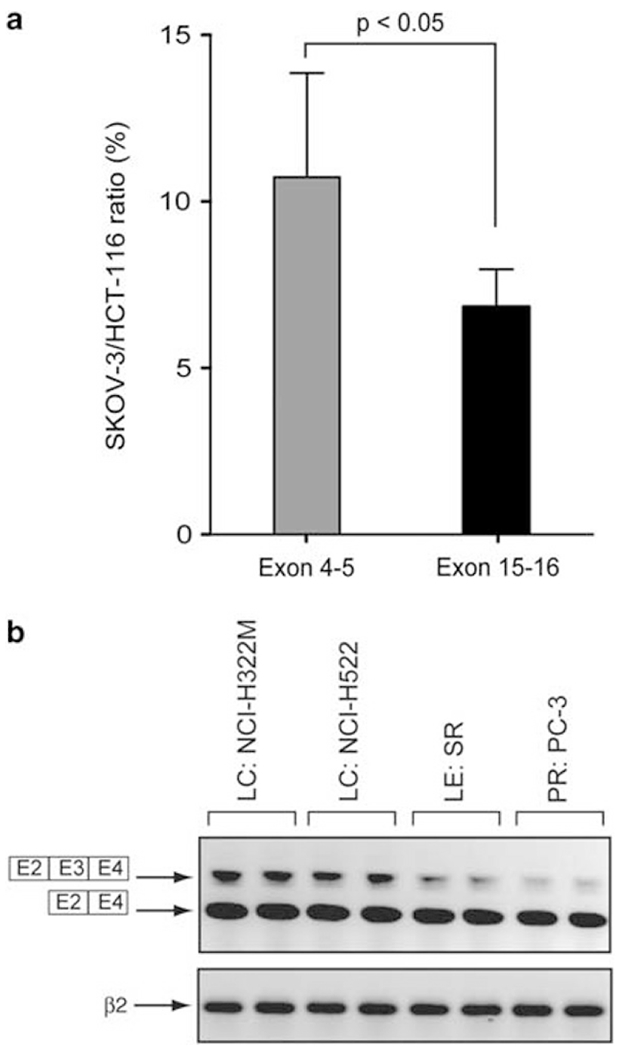
Exon-3 retention in cancer cell lines and premature truncation of SK-OV-3 are confirmed by independent PCR experiments. (a) Quantitative PCR showing premature truncation of the SK-OV-3 transcript compared with the HCT116 transcript. The primers used are CHEK2 E4s, CHEK2 E5as, CHEK2 E15s and CHEK2 E16as. The y-axis corresponds to the SK-OV-3/HCT116 ratio in percent. (b) RT–PCR showing retention of CHEK2 exon-3 in NCI-H322M, NCI-H522, SR and PC-3 cell lines. CHEK2 mRNA was analyzed by RT–PCR using CHEK2 E2s and CHEK2 E4 as primers. β2-Microglobulin (β2) mRNA was used as a standardizing control.
Looking at individual exons for variable intensity indicative of potential splice variants across cell lines, three probe sets, corresponding to exons 3, 6 and 11 (see pink, green and blue arrowheads at the bottom of Figure 3B), showed variable intensities across the NCI-60 (with lower than average intensity in some of the high-CHEK2-expresser lines and higher than average intensity in low-CHEK2-expresser lines). These results suggest the possible existence of CHEK2 splice variants for those three exons (3, 6 and 11; validation experiments for exon-3 are included below). Indeed, many cell lines showed a detectable signal for the probe set mapping to an additional exon (number 6 in Splice-Center), part of an alternative splice variant (AY551301) characterized by nonsense-mediated mRNA decay and found in breast cancer specimens (Staalesen et al., 2004).
We also validated by semi-quantitative PCR (reverse transcription (RT)–PCR) the retention of exon-3 detected by exon array in some of the NCI-60 cells (this exon is spliced in the canonical CHEK2 transcript variant-1 (NM 007194.3, see Figure 3A)). Two lung cancer cell lines showing high exon-3 intensity in the exon array analysis, NCI-H322M and NCI-H522, and two lines with low exon-3, leukemia SR and prostate cancer PC-3, were tested for those experiments. Figure 4b shows that the four cell lines transcribe both transcript variant-1 and the exon-3-retaining transcript variant-3 (NM 001005735.1). However, two of them, in good agreement with the exon array data, present a more intense slower migrating band, consistent with higher levels of the longer CHEK2 transcript retaining exon-3. These data demonstrate the presence of multiple CHEK2 isoforms and splice variants co-existing in the same cell populations in the NCI-60.
Chk2 is constitutively phosphorylated in p53-deficient cell lines
To determine the extent of endogenous Chk2 activation in the NCI-60, lysates from each of the 60 cell lines were subjected to western blot analysis with a phospho-specific antibody against the T68 residue of Chk2 (pT68-Chk2) (Figure 5a and Supplementary Figure 4). While performing these experiments, testing the cervical cancer HeLa cell line revealed consistently high endogenous pT68-Chk2 levels, which led us to use the HeLa cell line as a reference and normalization parameter for pT68-Chk2 levels across the NCI-60. The pT68-Chk2 western blot quantitations are plotted in Figure 5b (left panel). Seven of the NCI-60 lines showed consistently high pT68-Chk2 levels: the leukemia/multiple myeloma RPMI-8226; the three lung cancer lines, EKVX, HOP-92 and NCI-H322M; the two ovarian cancer lines OVCAR-3 and OVCAR-4; and the renal cancer line RXF-393, which together with OVCAR-3, presented the highest basal levels of pT68-Chk2 among the NCI-60, comparable or greater than HeLa. Notably, all the 12 cancer cell lines characterized as being p53 wild-type (data from the IARC p53 database (http://www-p53.iarc.fr/)) showed almost undetectable levels of pT68-Chk2 (dotted arrows in Figure 5b). Overall, these results demonstrate the value of phosphoproteomic analyses, as pT68-Chk2 levels are not correlated with total Chk2 protein levels (Figure 5b, right panel; Supplementary Figure 4; also see Figure 2a, right panel). They also demonstrate the absence of high endogenous Chk2 activation in wild-type p53 cells.
Figure 5.
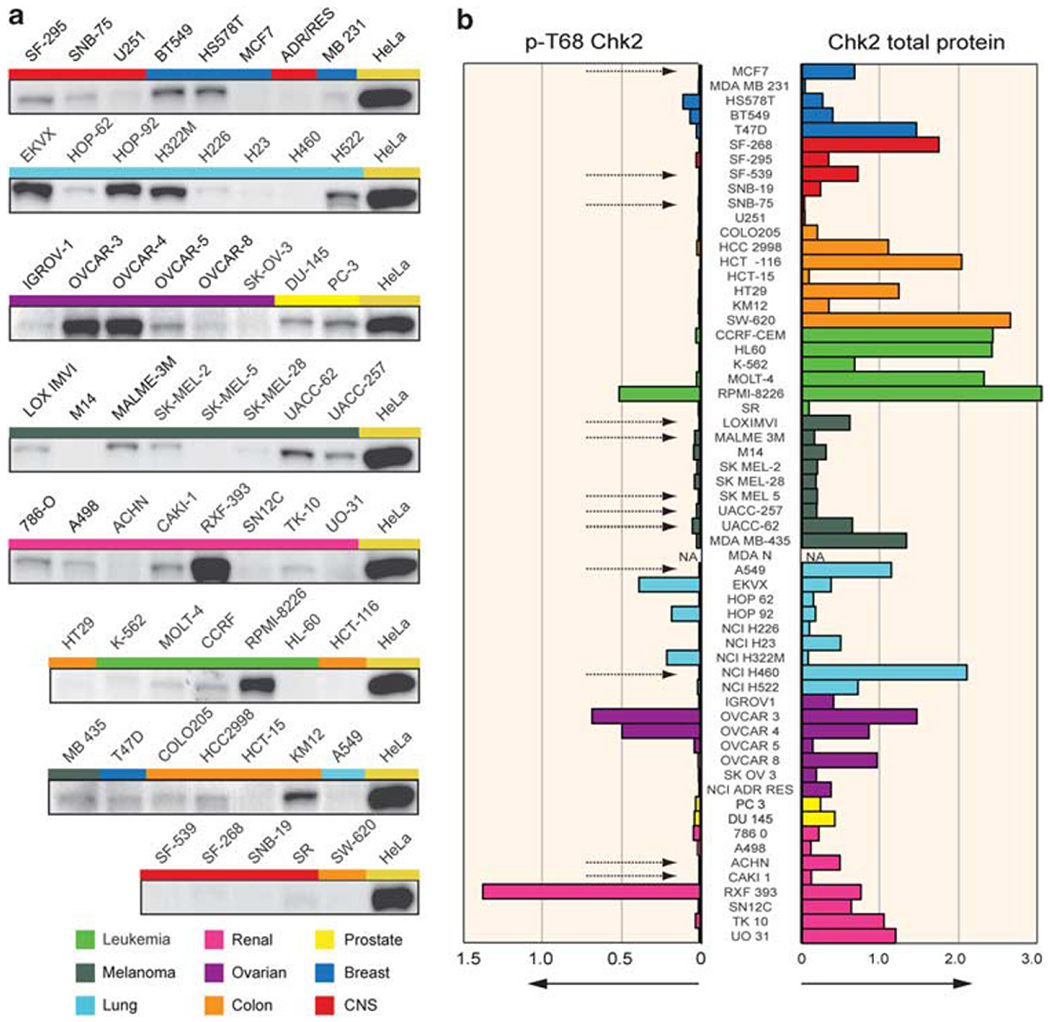
Proteomic analysis of total and phosphorylated (pT68) Chk2 shows high endogenous levels of Chk2 activation in several cancer cell lines across the NCI-60. (a) Representative western blot pictures of pT68-Chk2 in the NCI-60. The colored bars correspond to the tissues of origin (see legend at the bottom). HeLa cells were used as positive control and to calculate the Chk2 phosphorylation ratios in the NCI-60. (b) Quantitation of pT68-Chk2 (left) and total Chk2 (right) protein levels in the NCI-60. The colored bars represent the means of the ratios between the western blot intensities of the individual cell lines and the HeLa reference loading, after normalization by β-actin loading. The colors represent the tissues of origin (see also Figure 1). The dotted arrows indicate known p53 wild-type cancer cell lines. NA: not available.
Relationship between DNA damage, chromosomal instability and Chk2 activation by ATM
Immunofluorescence analyses showed that activated/phosphorylated Chk2 is nuclear (diffuse and focal patterns). We also found that pT68-Chk2 is concentrated in the centrosomes of both interphase and mitotic cells (Figure 6 and Supplementary Figure 5), which is consistent with prior reports (Tsvetkov et al., 2003; Zhang et al., 2007). In the cell lines that scored low for pT68-Chk2 by western blotting (HCT116, HT29 cells; see Figure 5), immunofluorescence nuclear staining for pT68-Chk2 was reduced in comparison with the high-pT68-Chk2 cell lines (HeLa, RFX-393, OVCAR-3 and OVCAR-4; Figures 6a and b). However, the pT68-Chk2 centrosomal staining remained visible in the low-pT68—Chk2 cells (Figure 6b).
Figure 6.
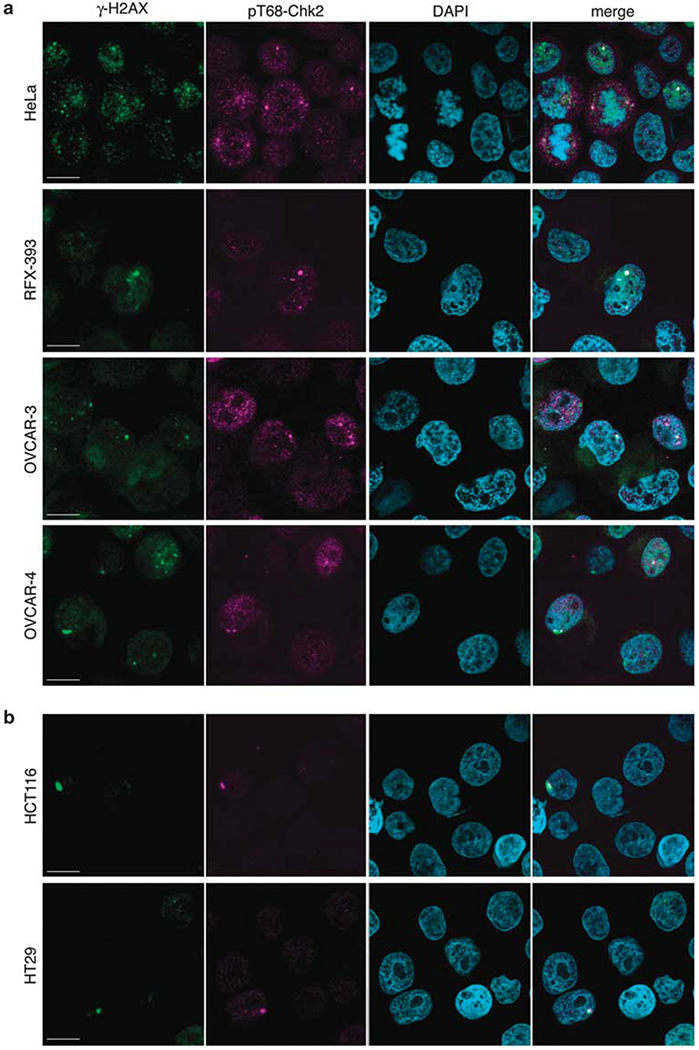
pT68-Chk2 tends to be linked to DNA damage and localizes to centrosomes. (a) pT68-Chk2 and γ-H2AX confocal immunofluorescence staining in high-pT68-Chk2 cell lines (HeLa, RXF-393, OVCAR-3, OVCAR-4). pT68-Chk2 was labeled in pink, γ-H2AX in green and nuclei were stained in blue with DAPI. Scale bars: 10 μm. (b) pT68-Chk2 and γ-H2AX confocal immunofluorescence staining in low-pT68-Chk2 cell lines (HCT116, HT29). pT68-Chk2 was labeled in pink, γ-H2AX in green and nuclei were stained in blue with DAPI. Scale bars: 10 μm.
To determine whether cells with activated Chk2 display high levels of DNA damage, we looked at γ-H2AX staining (γ-H2AX corresponds to histone H2AX phosphorylated at S139), which is a sensitive marker of double-strand breaks (Bonner et al., 2008), in cells co-stained with pT68-Chk2. γ-H2AX presented focal and diffuse nuclear staining in the cells with activated Chk2 (Figure 6a and Supplementary Figure 5). In HeLa cells, which show high endogenous pT68-Chk2 activation, the pT68-Chk2 signal mostly colocalized with γ-H2AX in interphase cells (see Figure 6a, upper panel; representative image in Supplementary Figure 5, upper panel). Also, centrosomal pT68-Chk2 colocalized with γ-H2AX in interphase cells. In mitotic cells (see Figure 6a, upper panel; representative image in Supplementary Figure 5, lower panel), the pT68-Chk2 signal tended to be excluded from the DNA, remained in centrosomes and did not colocalize with γ-H2AX, which remained within the condensed chromatin. Similar results were obtained in the other three high- pT68-Chk2 cell lines: OVCAR-3, OVCAR-4 and RXF-393 (Figure 6a).
To identify the kinase implicated in the endogenous phosphorylation of Chk2, we pretreated HeLa cells with KU55933 or NU7441. At the concentrations used, KU55933 and NU7441 are highly specific inhibitors of ATM and DNA-PK, respectively (Hickson et al., 2004; Leahy et al., 2004). The ATM inhibitor strongly decreased pT68-Chk2 phosphorylation, whereas the DNA-PK inhibitor showed a weaker effect, and both together completely suppressed pT68-Chk2 phosphorylation (Figure 7a). To look for downstream substrates of Chk2, we compared the phosphorylation levels of CDC25A, CDC25C and BRCA1 in HeLa and HCT116 cells. Although CDC25C phosphorylation at S216 was greater in HeLa cells, this was not the case for the phosphorylation intensities of CDC25A at S123 or BRCA1 at S988 (Figure 7b).
Figure 7.
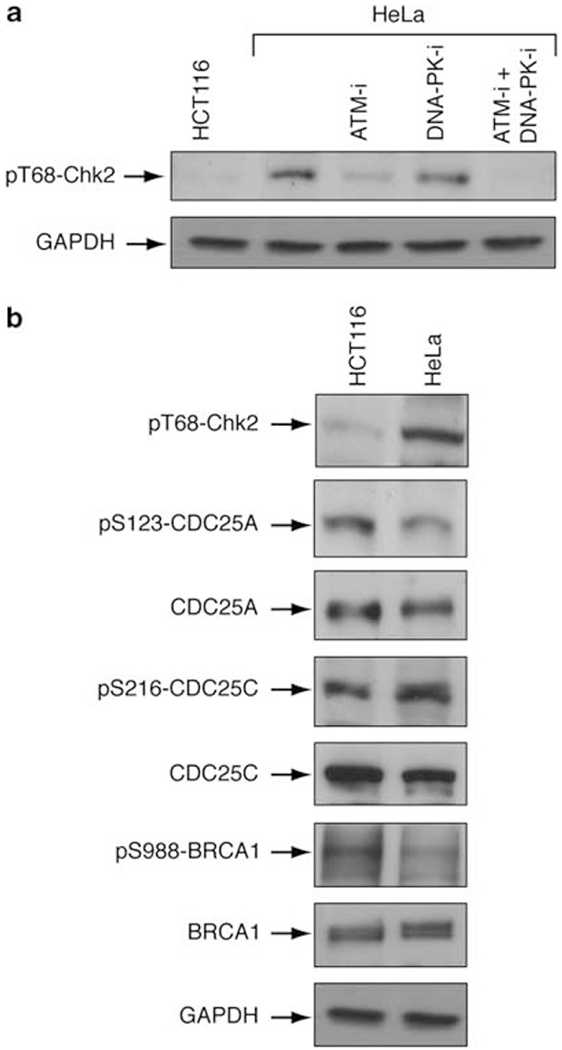
Chk2 is phosphorylated by both ATM and DNA-PK. (a) HeLa cells were treated with an ATM inhibitor (ATM-i) (KU55933) and/or a DNA-PK inhibitor (DNA-PK-i) (NU7441) (10 μM for 4h). pT68-Chk2 was analyzed by western blotting. GAPDH was used as loading control. (b) Study of some Chk2 substrates in HCT116 and HeLa cells. pS123-CDC25A, total CDC25A, pS216-CDC25C, total CDC25C, pS988-BRCA1, total BRCA1 and pT68-Chk2 T68 were examined by western blotting. GAPDH was used as loading control.
To determine whether there is a correlation between Chk2 activation and chromosome instability or ploidy, we correlated pT68-Chk2 with spectral karyotyping alterations for each of the 60 cell lines (Roschke et al., 2003). Overall, we found a statistically significant correlation between pT68-Chk2 levels and the number of chromosomal rearrangements per cell (Pearson’s product–moment correlation = 0.29, P<0.05, two-tailed). All seven cell lines with high pT68-Chk2 showed higher than average chromosomal rearrangements. Conversely, all cells with low chromosomal rearrangements showed low pT68-Chk2 (see Supplementary Figure 6). These data demonstrate a positive correlation between activated Chk2 and chromosomal instability.
Downregulation of homologous recombination and Fanconi anemia pathway genes in Chk2-activated cells
The potential impact of endogenous Chk2 activation was analyzed by transcriptome profiling of the five highest-pT68-Chk2 cell lines, comparing them with five tissue-matched, low-pT68-Chk2 and p53-matched deficient cell lines. Two-sided t-tests revealed 176 genes differentially expressed with statistical significance (P<0.01) in the two groups (high- versus low-pT68-Chk2). The clustered intensity map for those genes is shown in Figure 8A. Among the genes with downregulated expression, a significant number codes for proteins involved in DNA recombination, replication and repair (FANCA, FANCG, FANCL, BRCA2, RAD51C, EME1 and RECQL5 being the most relevant), and centromere organization (Figure 8B). Intriguingly, several of these downregulated genes are parts of the Fanconi anemia pathway or related to homologous recombination (P<0.05 for statistically significant enrichment using Ingenuity Pathway Analysis; see Supplementary Figure 7). Among the upregulated genes in the high-pT68-Chk2 lines, a significant number encodes for cellular stress response and immunological disease factors (Figure 8B). One of them, CDKN2A/p14ARF, is strongly upregulated in the high-pT68-Chk2 lines (P = 0.0051, t-test, two-sided), consistent with prior studies suggesting a role of CDKN2A/p14ARF in promoting Chk2 activation through Tip60-dependent acetylation and activation of ATM (Sun et al., 2005; Eymin et al., 2006).
Figure 8.
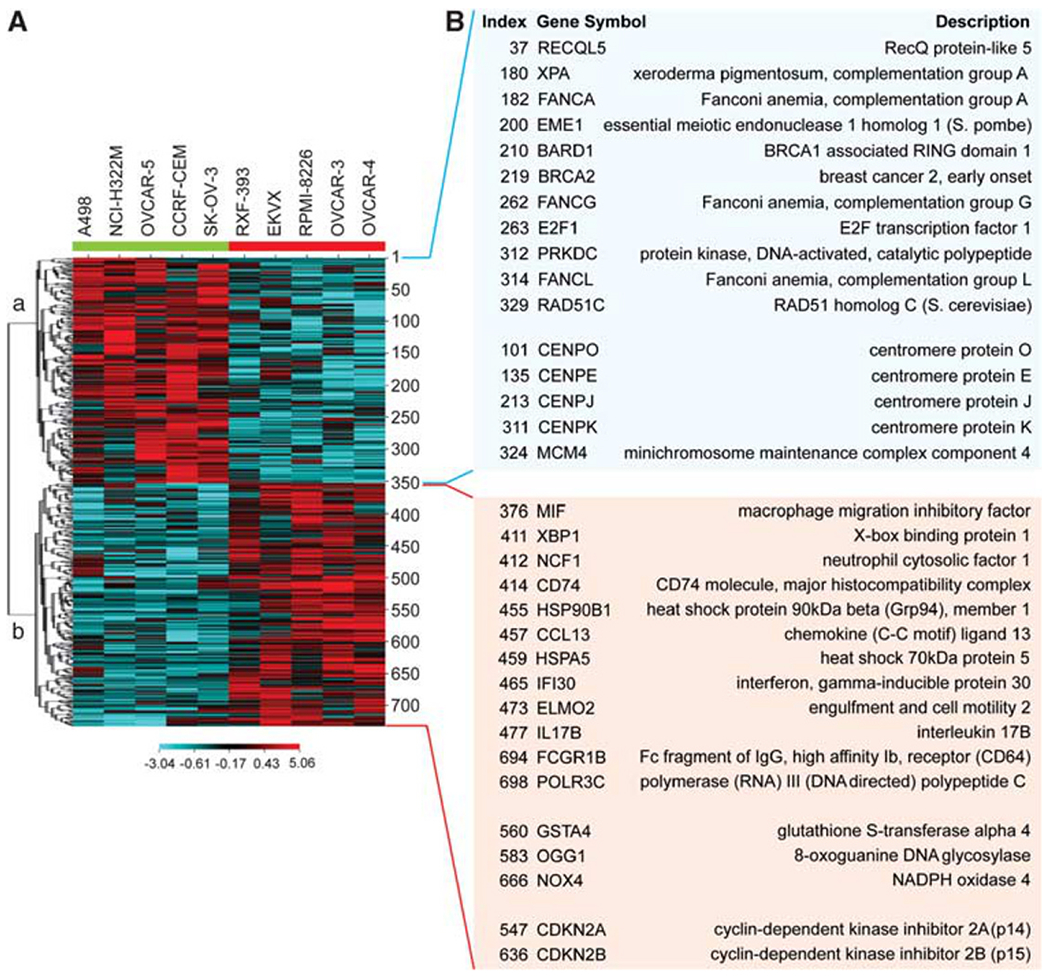
Fanconi anemia and homologous recombination genes are downregulated in cells with activated (phosphorylated) Chk2 and p53 deficiency. (A) A CIM of genes differentially expressed in the five highest-pT68-Chk2 cancer cell lines from the NCI-60 (highlighted with a red bar on the right) and in five tissue-matched, p53-deficient and low-pT68-Chk2 cancer cell lines (highlighted with a green bar on the left). (B) Relevant genes up- and downregulated in pT68-Chk2-activated cells (light red and blue boxes, respectively).
Discussion
In this study, we used a series of genomic and proteomic assays to characterize the CHEK2 gene and its protein product in the 60 cell lines of the NCI (NCI-60 panel). Our analysis reveals the relatively high frequency of Chk2 heterogeneity in cancer cells, either by inactivation or endogenous activation/phosphorylation. We show that inactivation can result from several mechanisms, including point mutations, haplo-insufficiency, alternative splicing, premature truncation of CHEK2 transcript or reduced protein levels. Endogenous activation measured by phosphoproteomic analyses with a pT68-Chk2-specific antibody was also detected in approximately 12% of the cell lines and in HeLa cells, always in a p53-deficient cellular milieu.
In normal human tissues, Chk2 is widely expressed in proliferating, renewing cell populations, whereas being undetectable or cytoplasmic in resting or terminally differentiated cells (Bartek et al., 2001; Lukas et al., 2001). Our results show that, despite an overall correlation between transcript and total protein levels, 19 of the NCI-60 cell lines (approximately 1/3) show relatively low Chk2 protein levels in spite of higher than average CHEK2 mRNA levels. HCT-15 is a typical example where CHEK2 mRNA is among the highest in the NCI-60 panel whereas there is no detectable Chk2 protein. Consistent with the existing literature (Lee et al., 2001), we confirmed that this cell line harbors a bi-allelic gene mutation in CHEK2, R145W within the forkhead-associated (FHA) domain of one allele and A247D in the kinase domain of the other. As a result, one allele is not transcribed, whereas the other generates an inactive, rapidly degraded protein product. Exome sequencing of the NCI-60 revealed a novel, undescribed and potentially deleterious Chk2 mutation (E394K) in the melanoma SK-MEL-28 cell line (see Table 1).
Three canonical CHEK2 isoforms are usually described in the literature (http://www.tigerteamconsulting.com/ SpliceCenter/ArrayCheck). However, more than 90 pathological CHEK2 splice variants have been reported in breast cancer (Staalesen et al., 2004), and it has been suggested that these isoforms, co-existing with physiological ones, could exert a dominant-negative effect in neoplastic diseases (Berge et al., 2010). In the present study, we identified a novel CHEK2 transcript in the SK-OV-3 ovarian cell line, characterized by premature truncation after exon-11. Other splicing variations appear likely at exons 3, 6 and 11, based on our exon array expression analyses and validation by PCR for exon-3. Exon-6 is normally not included in the canonical CHEK2 isoforms (Staalesen et al., 2004), but its presence, albeit at low absolute intensity, in some cancer cell lines suggests that it might be retained as an undescribed Chk2 minor isoform along with canonical transcript variants. Thus, our results from the NCI-60 consolidate the rationale for using exon array platforms to detect splice variants in tumors.
A recent study reported that Chk2 is lost in more than 50% of lung cancer tissues (Stolz et al., 2010). In line with these results, we observed lower than average total Chk2 levels in 6 out of 9 lung cancer cell lines (66%). The lung cancer cell line NCI-H226 is also the lowest CHEK2 expresser across the NCI-60. Interestingly, we also found three lung cancer lines (EKVX, HOP-92 and NCI-H322M) with high levels of activated pT68-Chk2. The pT68-Chk2 modification was not investigated in the recent publication linking Chk2 and BRCA1 with chromosome stability in cancer cells (Stolz et al., 2010).
Chk2 phosphorylation at T68 by ATM, DNA-PK or/and ATR is the first step toward its activation in response to DNA damage (Ahn et al., 2000). Several studies have reported high levels of endogenous activation of Chk2 in pre-neoplastic and early cancerous lesions (Bartkova et al., 2005; Gorgoulis et al., 2005; Fan et al., 2006; Nuciforo et al., 2007). Later on in the carcinogenesis process, Chk2 phosphorylation is variably maintained (Hirao et al., 2000; Bartkova et al., 2001, 2004; DiTullio et al., 2002; Sullivan et al., 2002; Hattori et al., 2004; Ribeiro-Silva et al., 2006; Albert et al., 2007; Kim et al., 2009). This Chk2 activation has generally been interpreted as a cellular response to oncogenic stress and endogenous DNA lesions that drive cells toward p53-mediated apoptosis (Antoni et al., 2007; Bartkova et al., 2010). Our study demonstrates high endogenous pT68-Chk2 (activated Chk2) in seven of the NCI-60 cell lines (approximately 12%), as well as in the HeLa cells. Our data indicate that activated/phosphorylated Chk2 tends to be linked to endogenous DNA damage in interphase cells- in response to ATM (and DNA-PK). In a recent study, Sedelnikova and Bonner (2006) studied endogenous γ-H2AX foci in a wide range of untreated cancer cell lines. That study shows that some cell lines, such as MDA-MB-231 with high γ-H2AX foci, fail to show high pT68-Chk2. This could be due to the fact that the Chk2 pathway may not be functional in some of the cells that accumulate endogenous DNA lesions.
We also found a high pT68-Chk2 signal in centrosomes, which colocalizes with γ-H2AX in interphase cells. Our observation regarding the centrosomal activation of Chk2 is consistent with prior reports showing pT68-Chk2 in centrosomes (Tsvetkov et al., 2003; Zhang et al., 2007). Concerning γ-H2AX, its focal and diffuse patterns have been mentioned previously (Zhao et al., 2007, 2008), but our study is the first to show its centrosomal localization. It is noteworthy that some other DNA-damage response proteins have been reported in centrosomes: Chk1, ATM and ATR (Zhang et al., 2007). Whether the concentration and colocalization of γ-H2AX and pT68-Chk2 in centrosomes is related to DNA damage remains questionable. However, it is interesting to note that the cells with high activated/phosphorylated Chk2 were also those with the greatest number of chromosomal rearrangements.
Of interest, none of the NCI-60 cell lines with proficient p53 function showed detectable levels of activated Chk2. This observation holds true also for HeLa cells, which, while being genetically p53 wild-type, are infected by human papilloma virus, which inactivates p53 (Yee et al., 1985), owing to its degradation by the viral protein E6 (Kessis et al., 1993). Although several studies have linked Chk2 to p53 activation in apoptosis and senescence induction (Gire et al., 2004; Powers et al., 2004; Rogoff et al., 2004; Pommier et al., 2005; Antoni et al., 2007), other studies have shown that Chk2 exerts p53-independent effects (Stevens et al., 2003; Yang et al., 2006; Zhou et al., 2007; Solier and Pommier, 2009; Solier et al., 2009; Stolz et al., 2010) that may even promote cell survival (Yu et al., 2001; Castedo et al., 2004; Ghosh et al., 2006; Jobson et al., 2009). In line with these reports, Chk2 has recently been shown to regulate SIRT1 expression by phosphorylating HuR (Abdelmohsen et al., 2007) and to reduce chromosomal attachment to kinetochores by phosphorylating BRCA1 (Stolz et al., 2010).
Our observations that cancer cells with high endogenous activated Chk2 also show downregulated Fanconi anemia and homologous recombination pathways (as seen by gene expression microarrays (see Figure 8) and western blotting (see Figure 7b)), together with an elevated number of chromosomal rearrangements (see Supplementary Figure 6), suggests a role for Chk2 in the control of cell proliferation when DNA-damage repair pathways are altered. Our data may also point toward a rationale for Chk2 inhibition in cancers with an intrinsic deficiency in the aforementioned pathways.
The detection of high pT68-Chk2 in p53-deficient lines is suggestive of the dependence of such cells on activated Chk2. The consequence of Chk2 inactivation/depletion in cells with high levels of this kinase is an antiproliferative effect (Jobson et al., 2009). Jobson et al. showed that PV1019, a potent and selective inhibitor of Chk2, exerts antiproliferative activity in OVCAR-3 and OVCAR-4 cell lines (two lines showing high levels of activated Chk2). Moreover, they observed that downregulation of Chk2 (by small interfering RNA) in the OVCAR-4 cell line also causes growth inhibition. Thus, Chk2 inhibition can produce antiproliferative activity in cancer cells with endogenously activated Chk2. It is worth mentioning that detecting activated Chk2 in cancer may also have a prognostic value, as shown in squamous-cell carcinoma of the esophagus (Sarbia et al., 2007), where Chk2 activation in tumor specimens correlates with response to neoadjuvant radio-chemotherapy.
In conclusion, the biology of Chk2 remains complex, multifaceted and fast evolving. Our study provides information on the relationship between different genomic and proteomic parameters related to Chk2 in cancer cells, and on the broad spectrum of variation in these parameters using the NCI-60 as a systems biology model. Measuring Chk2 expression and activation in tumors is likely relevant for translational research. On the one hand, Chk2 acts as a tumor suppressor both in germinal and somatic cells, and its loss is likely to contribute to the inactivation of p53 and BRCA1. On the other hand, Chk2 activation by DNA damage (double-strand breaks) can be measured readily using pT68-Chk2 antibodies and could be used prior to therapy to identify tumors with endogenous DNA damage and genomic instability. During therapy, activated Chk2 may also be useful to measure the DNA-damaging and apoptotic effects of anticancer treatments.
Materials and methods
Cell lines
The NCI-60 panel of cancer cell lines was obtained from the NCI Developmental Therapeutics Program and grown in RPMI-1640 (Lonza Walkersville Inc., Walkersville, MD, USA) with 10% fetal calf serum (Atlantic Biologicals Corp., Miami, FL, USA) and 2 mm l-glutamine (Invitrogen Corp., Frederick, MD, USA) as described previously (Scherf et al., 2000). The cervix carcinoma HeLa cell line was obtained from ATCC (Rockville, MD, USA).
Chemicals
The DNA-PK kinase inhibitor (NU7441 = DNA-PK-i) and the ATM kinase inhibitor (KU55933 = ATM-i) were from Tocris Bioscience (Ellisville, MO, USA).
High-throughput sequencing, data analysis and validation
A manuscript is under preparation, which will describe the details and the overall results of the high-throughput sequencing and data analysis. Briefly, the whole exome of the NCI-60 panel of cell lines was sequenced by using the SureSelect Human Whole Exome capture kit (Agilent Inc., Germantown, MD, USA) according to the manufacturers’ protocol, followed by 2 × 80-bp paired-end reads using the Illumina Genome Analyzer IIx (Illumina Inc., San Diego, CA, USA). Base calling was performed by using the standard Illumina pipeline followed by alignment to the reference human genome build hg18 using Novoalign (Novocraft Technologies, Selangor, Malaysia). The alignments were further processed by using a GATK pipeline (http://www.broadinstitute.org/gsa/wiki/index.php/Main_Page). The candidate variants in CHEK2 were amplified by PCR and subjected to conventional capillary sequencing on an ABI 3730 DNA Analyzer (Applied Biosystems, Pleasanton, CA, USA).
mRNA processing and microarray analysis
mRNA extraction, purification, quality control, microarray hybridization, profiling and quality assessment have been described elsewhere (Nishizuka et al., 2003; Reinhold et al., 2010). The microarray data sets used to generate z-score profiles for the gene transcripts in the NCI-60 are downloadable from our relational database CellMiner (http://discover.nci.nih.gov/cellminer/loadDownload.do) and from the GEO data repository (accession numbers GSE22821, GSE5846, GSE5949, GSE5720).
Quantitation of gene transcript expression using five microarray platforms—development of the z-scored transcript data set
Transcript expression data for the NCI-60 were generated from five microarray platforms that have been used for gene expression analysis in the NCI-60: Affymetrix Human Genome U95 (HG-U95; ~ 60 000 features; Affymetrix Inc., Santa Clara, CA, USA) (Supplementary Table 1). (Shankavaram et al., 2007), Human Genome U133 (HG-U133a and b; ~44 000 features) (Shankavaram et al., 2007), Human Genome U133 Plus 2.0 (HG-U133 Plus 2.0; ~47 000 features), Agilent WHG (Reinhold et al., 2010) and Affymetrix GeneChip Human Exon 1.0 ST (GH Exon 1.0 ST; ~850 000 features) (Nishizuka et al., 2003). Further details on mRNA processing and microarray analysis for the aforementioned data sets have been provided elsewhere (Pfister et al., 2009; Gmeiner et al., 2010). To generate gene transcript expression values, non-degenerate probes (as determined by SpliceCenter (http://www.tigerteamconsulting.com/SpliceCenter/SpliceOverview.jsp)) from the five platforms with an intensity range of ⩾1.2 log2 and with a Pearson’s correlation coefficient with other probes ⩾0.60 were used. Probes passing these quality criteria were used to determine a z-score value for gene transcript intensities as follows: the mean for each probe intensity value across the NCI-60 was subtracted from that probe value in individual samples, and divided by its s.d. z-scores were then averaged to generate a consensus gene transcription profile across all the five platforms used for such analysis.
Exon array analysis of CHEK2 transcript
After feature extraction, pre-processing and normalization of Affymetrix GeneChip Human Exon 1.0. ST arrays according to Partek default specifications, non-degenerate probe sets (as defined in SpliceCenter) for CHEK2 were normalized according to the robust z-score method: the median of the expression of a given probe set in the NCI-60 was subtracted from the individual values for that probe set, and divided by the normalized inter-quartile range (that is, the inter-quartile range multiplied by a factor of 0.7413, which makes it comparable to a s.d.). The resulting values, after median-centering, were used to generate a clustered image map (CIM for short) of probe set expression.
aCGH analysis
For aCGH analysis, samples from the NCI-60 were prepared and analyzed with NimbleGen 385K aCGH chips (NimbleGen HG18 CGH 385K WG Tiling v2.0; NimbleGen Systems Inc., Madison, WI, USA) according to the manufacturer’s specifications (http://www.nimblegen.com/products/lit/cgh_userguide_v6p0.pdf) (Nishizuka et al., 2003). The experiment did not include HT29. In brief, 1.5 μg of genomic DNA from cancer cell lines and from human male reference samples were purified, labeled using Cy3-Random and Cy5-Random Nonamers respectively, and hybridized to NimbleGen arrays. NimbleGen pairs files were then loaded in Partek 6.4 (Partek Inc., St Louis, MO, USA) for further analysis.
Quantitative PCR
The cell lines HCT-116 and SKOV-3 were washed in phosphate-buffered saline (PBS). RNA extraction was performed with the Nucleospin RNA II kit (Macherey-Nagel, Bethlehem, PA, USA). An aliquot of 1 μg of RNA was reverse-transcribed by using a reverse transcription kit (Promega, Madison, WI, USA). Real-time PCR was performed with the SYBR Green PCR Master Mix (Applied Biosystems, Carlsbad, CA, USA) on the ABI 7900 thermocycler (Applied Biosystems). The expression level of the gene of interest was normalized by the β2-microglobulin RNA level of the same sample. The reaction mixtures contained 5 μl of 2 × Quantitect SYBR-Green PCR Master Mix and 2 μl of reverse-transcriptase-generated cDNA (diluted by 10) in a final volume of 10 μl containing primers (Proligo, Paris, France) at 125 nm. Relative gene expression was expressed as 2−ΔΔCt (ΔΔCt = ΔCt(sample) − ΔCt(calibrator); ΔCt = Ct(gene) − Ct(β2-microglobulin)). The primer sequences are listed in Supplementary Table 2.
RT–PCR
The OneStep RT–PCR kit (Qiagen, Valencia, CA, USA) was used under the following conditions: 1 × buffer, 400 μm of each dNTP, 0.6 μm of each primer, 2 μl of enzyme mix and 1 μg of template RNA in a total volume of 50 μl. RNA was reverse-transcribed for 30 min at 50 °C; the initial PCR step was activated by heating for 15 min at 95 °C before the PCR (1-min denaturation at 94 °C, 1-min annealing at 60 °C, 1-min extension at 72 °C, 32 cycles) by using a MJ Research PTC-200 Thermo Cycler (MJ Research, Reno, NV, USA). The PCR products were analyzed on agarose gels. The amplified DNA fragments were stained with ethidium bromide and fluorescence was detected by video-camera imaging using the Quantity One software (Bio-Rad, Hercules, CA, USA). The primer sequences are listed in Supplementary Table 2.
Western blotting
Whole-cell lysates were prepared from logarithmically growing populations of the NCI-60 human tumor cell line panel. Approximately 1 × 10⁷ cells were lysed with 1 × RIPA buffer (Millipore, Billerica, MA, USA) or in buffer containing 1% sodium dodecyl sulfate, 10 mm Tris–HCl (pH 7.4), supplemented with protease inhibitors (Roche Applied Science, Indianapolis, IN, USA) and phosphatase inhibitors (Sigma Chemical Co., St Louis, MO, USA). Total protein concentrations were determined using the Bio-Rad Protein Assay (Bio-Rad Laboratories Inc., Hercules, CA, USA). Equal amounts of proteins were boiled for 5 min in Tris-glycine-sodium dodecyl sulfate sample buffer (Invitrogen, Carlsbad, CA, USA) or heated at 70 °C for 10 min in lithium dodecyl sulfate sample buffer (Invitrogen), separated by Tris-glycine or Tris-acetate polyacrylamide gels (Invitrogen) and electroblotted onto nitrocellulose membranes (Bio-Rad). The membranes were saturated with milk, incubated overnight at 4 °C with primary antibodies, washed and then incubated for 45 min with secondary antibodies: peroxidase-conjugated goat antimouse IgG or peroxidase-conjugated goat anti-rabbit IgG (Santa Cruz Biotechnology, Santa Cruz, CA, USA). Signals were revealed by autoradiography using the Enhanced Chemiluminescence detection kit (Pierce, Rockford, IL, USA). The relative band intensities were determined by densitometry by using the Labworks 4.0 Imaging Acquisition and Analysis software (UVP Laboratory productsdivers, Upland, CA, USA). The protein expression data for each cell line was replicated in at least three independent experiments.
The primary antibodies used are as follows: anti-β-actin (Millipore), anti-pS988-BRCA1 (#sc-12888; Santa Cruz Biotechnology), anti-BRCA1 (#MS110; Calbiochem, EMD Biosciences, San Diego, CA, USA), anti-pS123-CDC25A (#AP3045a; ABGENT, San Diego, CA, USA), anti-CDC25A (#sc-7389; Santa Cruz Biotechnology), anti-pS216-CDC25C (#9528; Cell Signaling, Danvers, MA, USA), anti-CDC25C (#cc26; Calbiochem), anti-pT68-Chk2 (#2661; Cell Signaling), anti-Chk2 ((#2662; Cell Signaling), anti-γ-H2AX (#05-636; Upstate, Temecula, CA, USA) and anti-GAPDH (glyceraldehyde-3-phosphate dehydrogenase) (#2118; Cell Signaling).
Immunofluorescence microscopy
Cells were washed with PBS; fixed with 2% formaldehyde in PBS for 20 min; washed with PBS; fixed and permeabilized with cold (−20 °C) 70% ethanol for 20 min; washed with PBS; blocked with 8% bovine serum albumin in PBS for 1 h; washed with PBS; incubated with the first antibody (pT68-Chk2; 1/500 dilution; γ-H2AX, 1/500 dilution) in 1% bovine serum albumin in PBS for 2 h; washed with PBS; incubated with the secondary antibody conjugated with Alexa Fluor-488 or 568 for 1 h at RT; washed with PBS and mounted by using the Vectashield mounting medium with DAPI (4’,6-diamidino-2-phenylindole) to counterstain the DNA (Vector Laboratories, Inc., Burlingame, CA, USA). Confocal images were sequentially acquired with the Zeiss AIM software on a Zeiss LSM 510 NLO Confocal system (Carl Zeiss Inc., Thornwood, NY, USA).
Pathway analysis
Gene expression data were analyzed for pathway enrichment by Ingenuity Pathways Analysis (Ingenuity Systems, Redwood City, CA, USA).
Statistical analyses
Agilent output text files were analyzed by using Agilent GeneSpring GX 10.0 (Agilent Technologies, Santa Clara, CA, USA), whereas Affymetrix CEL files and NimbleGen pairs files were analyzed by using the Partek software (Partek Inc.). All data sets were processed and normalized, before z-score transformation, according to the default options of the software used, with the exception of normalization for the Affymetrix data (GCRMA for all platforms) and probe summarization for gene copy number analysis for the NimbleGen data (minimum 15 probes for any gene). The data were then loaded into R for further analysis (http://www.R-project.org). Unpaired t-tests with equal variance assumption were applied for differential gene expression between high-pT68-Chk2 cells and low-pT68 cells, retaining genes significant at a P<0.01 (two-tailed). Robust z-score transformation was used to normalize exon probe set data. CIMs were generated with the CIMMiner tool, available freely on our Genomics and Bioinformatics Group website (http://discover.nci.nih.gov/). The ‘1-Pearson’ method was used for exon CIM and for differential gene expression CIM. The clustering method was average linkage for both types of CIM. In pathway analyses with Ingenuity, processes and pathways were considered significantly enriched when having a P<0.05. Western blot triplicates were normalized to the β-actin content of each membrane and the ratio with HeLa cell lysate was calculated. Individual outliers in triplicates were removed by using the Grubbs’ test and the means for the remaining values were generated. R was used for statistical analysis and for graphics generation. Figures were finalized with Adobe Design Suit Standard CS3.
Supplementary Material
Acknowledgements
The present data were in part presented in abstract form at the 21st EORTC-NCI-AACR International Symposium on Molecular Targets and Cancer Therapeutics (Boston, 15–19 November 2009) and at the 101st AACR Annual Meeting (Washington DC, 17–21 April 2010). We thank Sven Bilke, Yuan Jiang, Marbin Pineda, Robert Walker and Yuelin Zhu for technical help in next-generation sequencing and data analysis, and Jaleisa Turner for help in capillary sequencing. We also thank Margot Sunshine (LMP BioInformatics Groups) for invaluable work and technical help. GZ thanks Dr P Blandini for insightful suggestions on the possible consequences of Chk2 activation in cancer treatment. Funding: This work was supported by the Center for Cancer Research, Intramural Program of the National Cancer Institute, and by the Division of Cancer Treatment and Diagnosis, Extramural Program of the National Cancer Institute (National Institutes of Health), and by AIRC MFAG grant no. 10570 (GZ). GZ was also supported by a PhD fellowship grant (XXIII Ciclo) from the University of Genova (Genova, Italy).
Footnotes
Conflict of interest
The authors declare no conflict of interest.
Supplementary Information accompanies the paper on the Oncogene website (http://www.nature.com/onc)
References
- Abdelmohsen K, Pullmann R Jr, Lal A, Kim HH, Galban S, Yang X et al. (2007). Phosphorylation of HuR by Chk2 regulates SIRT1 expression. Mol Cell 25: 543–557. [DOI] [PMC free article] [PubMed] [Google Scholar]
- Ahn J, Prives C. (2002). Checkpoint kinase 2 (Chk2) mono-mers or dimers phosphorylate Cdc25C after DNA damage regardless of threonine 68 phosphorylation. J Biol Chem 277: 48418–48426. [DOI] [PubMed] [Google Scholar]
- Ahn J, Urist M, Prives C. (2004). The Chk2 protein kinase. DNA Repair (Amst) 3: 1039–1047. [DOI] [PubMed] [Google Scholar]
- Ahn JY, Li X, Davis HL, Canman CE. (2002). Phosphorylation of threonine 68 promotes oligomerization and autophosphorylation of the Chk2 protein kinase via the forkhead-associated domain. J Biol Chem 277: 19389–19395. [DOI] [PubMed] [Google Scholar]
- Ahn JY, Schwarz JK, Piwnica-Worms H, Canman CE. (2000). Threonine 68 phosphorylation by ataxia telangiectasia mutated is required for efficient activation of Chk2 in response to ionizing radiation. Cancer Res 60: 5934–5936. [PubMed] [Google Scholar]
- Albert JM, Cao C, Kim KW, Willey CD, Geng L, Xiao D et al. (2007). Inhibition of poly(ADP-ribose) polymerase enhances cell death and improves tumor growth delay in irradiated lung cancer models. Clin Cancer Res 13: 3033–3042. [DOI] [PubMed] [Google Scholar]
- Antoni L, Sodha N, Collins I, Garrett MD. (2007). CHK2 kinase: cancer susceptibility and cancer therapy—two sides of the same coin? Nat Rev Cancer 7: 925–936. [DOI] [PubMed] [Google Scholar]
- Bahassi EM, Ovesen JL, Riesenberg AL, Bernstein WZ, Hasty PE, Stambrook PJ. (2008). The checkpoint kinases Chk1 and Chk2 regulate the functional associations between hBRCA2 and Rad51 in response to DNA damage. Oncogene 27: 3977–3985. [DOI] [PubMed] [Google Scholar]
- Bartek J, Falck J, Lukas J. (2001). CHK2 kinase—a busy messenger. Nat Rev Mol Cell Biol 2: 877–886. [DOI] [PubMed] [Google Scholar]
- Bartek J, Lukas J. (2003). Chk1 and Chk2 kinases in checkpoint control and cancer. Cancer Cell 3: 421–429. [DOI] [PubMed] [Google Scholar]
- Bartkova J, Falck J, Rajpert-De Meyts E, Skakkebaek NE, Lukas J, Bartek J. (2001). Chk2 tumour suppressor protein in human spermatogenesis and testicular germ-cell tumours. Oncogene 20: 5897–5902. [DOI] [PubMed] [Google Scholar]
- Bartkova J, Guldberg P, Gronbaek K, Koed K, Primdahl H, Moller K et al. (2004). Aberrations of the Chk2 tumour suppressor in advanced urinary bladder cancer. Oncogene 23: 8545–8551. [DOI] [PubMed] [Google Scholar]
- Bartkova J, Hamerlik P, Stockhausen MT, Ehrmann J, Hlobilkova A, Laursen H et al. (2010). Replication stress and oxidative damage contribute to aberrant constitutive activation of DNA damage signalling in human gliomas. Oncogene 29: 5095–5102. [DOI] [PubMed] [Google Scholar]
- Bartkova J, Horejsi Z, Koed K, Kramer A, Tort F, Zieger K et al. (2005). DNA damage response as a candidate anticancer barrier in early human tumorigenesis. Nature 434: 864–870. [DOI] [PubMed] [Google Scholar]
- Bell DW, Varley JM, Szydlo TE, Kang DH, Wahrer DC, Shannon KE et al. (1999). Heterozygous germ line hCHK2 mutations in Li-Fraumeni syndrome. Science 286: 2528–2531. [DOI] [PubMed] [Google Scholar]
- Berge EO, Staalesen V, Straume AH, Lillehaug JR, Lonning PE. (2010). Chk2 splice variants express a dominant-negative effect on the wild-type Chk2 kinase activity. Biochim Biophys Acta 1803: 386–395. [DOI] [PubMed] [Google Scholar]
- Bonner WM, Redon CE, Dickey JS, Nakamura AJ, Sedelnikova OA, Solier S et al. (2008). GammaH2AX and cancer. Nat Rev Cancer 8: 957–967. [DOI] [PMC free article] [PubMed] [Google Scholar]
- Bussey KJ, Chin K, Lababidi S, Reimers M, Reinhold WC, Kuo WL et al. (2006). Integrating data on DNA copy number with gene expression levels and drug sensitivities in the NCI-60 cell line panel. Mol Cancer Ther 5: 853–867. [DOI] [PMC free article] [PubMed] [Google Scholar]
- Cao L, Kim S, Xiao C, Wang RH, Coumoul X, Wang X et al. (2006). ATM–Chk2–p53 activation prevents tumorigenesis at an expense of organ homeostasis upon Brca1 deficiency. EMBO J 25: 2167–2177. [DOI] [PMC free article] [PubMed] [Google Scholar]
- Castedo M, Perfettini JL, Roumier T, Yakushijin K, Horne D, Medema R et al. (2004). The cell cycle checkpoint kinase Chk2 is a negative regulator of mitotic catastrophe. Oncogene 23: 4353–4361 [DOI] [PubMed] [Google Scholar]
- Chehab NH, Malikzay A, Appel M, Halazonetis TD. (2000). Chk2/hCds1 functions as a DNA damage checkpoint in G(1) by stabilizing p53. Genes Dev 14: 278–288. [PMC free article] [PubMed] [Google Scholar]
- DiTullio RA Jr, Mochan TA, Venere M, Bartkova J, Sehested M, Bartek J et al. (2002). 53BP1 functions in an ATM-dependent checkpoint pathway that is constitutively activated in human cancer. Nat Cell Biol 4: 998–1002. [DOI] [PubMed] [Google Scholar]
- Eymin B, Claverie P, Salon C, Leduc C, Col E, Brambilla E et al. (2006). p14ARF activates a Tip60-dependent and p53-independent ATM/ATR/CHK pathway in response to genotoxic stress. Mol Cell Biol 26: 4339–4350. [DOI] [PMC free article] [PubMed] [Google Scholar]
- Falck J, Mailand N, Syljuasen RG, Bartek J, Lukas J. (2001). The ATM–Chk2–Cdc25A checkpoint pathway guards against radio-resistant DNA synthesis. Nature 410: 842–847. [DOI] [PubMed] [Google Scholar]
- Fan C, Quan R, Feng X, Gillis A, He L, Matsumoto ED et al. (2006). ATM activation is accompanied with earlier stages of prostate tumorigenesis. Biochim Biophys Acta 1763: 1090–1097. [DOI] [PubMed] [Google Scholar]
- Ghosh JC, Dohi T, Raskett CM, Kowalik TF, Altieri DC. (2006). Activated checkpoint kinase 2 provides a survival signal for tumor cells. Cancer Res 66: 11576–11579. [DOI] [PubMed] [Google Scholar]
- Gire V, Roux P, Wynford-Thomas D, Brondello JM, Dulic V. (2004). DNA damage checkpoint kinase Chk2 triggers replicative sensecence. EMBO J 23: 2554–2563. [DOI] [PMC free article] [PubMed] [Google Scholar]
- Gmeiner WH, Reinhold WC, Pommier Y. (2010). Genome-wide mRNA and microRNA profiling of the NCI 60 cell-line screen and comparison of FdUMP[10] with fluorouracil, floxuridine, and topoisomerase 1 poisons. Mol Cancer Ther 9: 3105–3114. [DOI] [PMC free article] [PubMed] [Google Scholar]
- Gorgoulis VG, Vassiliou LV, Karakaidos P, Zacharatos P, Kotsinas A, Liloglou T et al. (2005). Activation of the DNA damage checkpoint and genomic instability in human precancerous lesions. Nature 434: 907–913. [DOI] [PubMed] [Google Scholar]
- Harper JW, Elledge SJ. (2007). The DNA damage response: ten years after. Mol Cell 28: 739–745. [DOI] [PubMed] [Google Scholar]
- Hattori H, Kuroda M, Ishida T, Shinmura K, Nagai S, Mukai K et al. (2004). Human DNA damage checkpoints and their relevance to soft tissue sarcoma. Pathol Int 54: 26–31. [DOI] [PubMed] [Google Scholar]
- Hickson I, Zhao Y, Richardson CJ, Green SJ, Martin NM, Orr AI et al. (2004). Identification and characterization of a novel and specific inhibitor of the ataxia-telangiectasia mutated kinase ATM. Cancer Res 64: 9152–9159. [DOI] [PubMed] [Google Scholar]
- Hirao A, Cheung A, Duncan G, Girard PM, Elia AJ, Wakeham A et al. (2002). Chk2 is a tumor suppressor that regulates apoptosis in both an ataxia telangiectasia mutated (ATM)-dependent and an ATM-independent manner. Mol Cell Biol 22: 6521–6532. [DOI] [PMC free article] [PubMed] [Google Scholar]
- Hirao A, Kong YY, Matsuoka S, Wakeham A, Ruland J, Yoshida H et al. (2000). DNA damage-induced activation of p53 by the checkpoint kinase Chk2. Science 287: 1824–1827. [DOI] [PubMed] [Google Scholar]
- Holbeck SL, Collins JM, Doroshow JH. (2010). Analysis of food and drug administration-approved anticancer agents in the NCI60 panel of human tumor cell lines. Mol Cancer Ther 9: 1451–1460. [DOI] [PMC free article] [PubMed] [Google Scholar]
- Ikediobi ON, Davies H, Bignell G, Edkins S, Stevens C, O’Meara S et al. (2006). Mutation analysis of 24 known cancer genes in the NCI-60 cell line set. Mol Cancer Ther 5: 2606–2612. [DOI] [PMC free article] [PubMed] [Google Scholar]
- Jobson AG, Lountos GT, Lorenzi PL, Llamas J, Connelly J, Cerna D et al. (2009). Cellular inhibition of checkpoint kinase 2 (Chk2) and potentiation of camptothecins and radiation by the novel Chk2 inhibitor PV1019 [7-nitro-1H-indole-2-carboxylic acid {4-[1-(guanidinohydrazone)-ethyl]-phenyl}-amide]. J Pharmacol Exp Ther 331: 816–826. [DOI] [PMC free article] [PubMed] [Google Scholar]
- Kessis TD, Slebos RJ, Nelson WG, Kastan MB, Plunkett BS, Han SM et al. (1993). Human papillomavirus 16 E6 expression disrupts the p53-mediated cellular response to DNA damage. Proc Natl Acad Sci USA 90: 3988–3992. [DOI] [PMC free article] [PubMed] [Google Scholar]
- Kim DS, Kim MJ, Lee JY, Lee SM, Choi JE, Lee SY et al. (2009). Epigenetic inactivation of checkpoint kinase 2 gene in non-small cell lung cancer and its relationship with clinicopathological features. Lung Cancer 65: 247–250. [DOI] [PubMed] [Google Scholar]
- Leahy JJ, Golding BT, Griffin RJ, Hardcastle IR, Richardson C, Rigoreau L et al. (2004). Identification of a highly potent and selective DNA-dependent protein kinase (DNA-PK) inhibitor (NU7441) by screening of chromenone libraries. Bioorg Med Chem Lett 14: 6083–6087. [DOI] [PubMed] [Google Scholar]
- Lee SB, Kim SH, Bell DW, Wahrer DC, Schiripo TA, Jorczak MM et al. (2001). Destabilization of CHK2 by a missense mutation associated with Li-Fraumeni syndrome. Cancer Res 61: 8062–8067. [PubMed] [Google Scholar]
- Li J, Stern DF. (2005). Regulation of CHK2 by DNA-dependent protein kinase. J Biol Chem 280: 12041–12050. [DOI] [PubMed] [Google Scholar]
- Li J, Taylor IA, Lloyd J, Clapperton JA, Howell S, MacMillan D et al. (2008). Chk2 oligomerization studied by phosphopeptide ligation: implications for regulation and phosphodependent interactions. J Biol Chem 283: 36019–36030. [DOI] [PubMed] [Google Scholar]
- Lukas C, Bartkova J, Latella L, Falck J, Mailand N, Schroeder T et al. (2001). DNA damage-activated kinase Chk2 is independent of proliferation or differentiation yet correlates with tissue biology. Cancer Res 61: 4990–4993. [PubMed] [Google Scholar]
- Matsuoka S, Huang M, Elledge SJ. (1998). Linkage of ATM to cell cycle regulation by the Chk2 protein kinase. Science 282: 1893–1897. [DOI] [PubMed] [Google Scholar]
- Matsuoka S, Rotman G, Ogawa A, Shiloh Y, Tamai K, Elledge SJ. (2000). Ataxia telangiectasia-mutated phosphorylates Chk2 in vivo and in vitro. Proc Natl Acad Sci USA 97: 10389–10394. [DOI] [PMC free article] [PubMed] [Google Scholar]
- Matys V, Kel-Margoulis OV, Fricke E, Liebich I, Land S, Barre-Dirrie A et al. (2006). TRANSFAC and its module TRANSCompel: transcriptional gene regulation in eukaryotes. Nucleic Acids Res 34: D108–D110. [DOI] [PMC free article] [PubMed] [Google Scholar]
- Meijers-Heijboer H, van den Ouweland A, Klijn J, Wasielewski M, de Snoo A, Oldenburg R et al. (2002). Low-penetrance susceptibility to breast cancer due to CHEK2(*)1100delC in noncarriers of BRCA1 or BRCA2 mutations. Nat Genet 31: 55–59. [DOI] [PubMed] [Google Scholar]
- Nevanlinna H, Bartek J. (2006). The CHEK2 gene and inherited breast cancer susceptibility. Oncogene 25: 5912–5919. [DOI] [PubMed] [Google Scholar]
- Ng PC, Henikoff S. (2003). SIFT: predicting amino acid changes that affect protein function. Nucleic Acids Res 31: 3812–3814. [DOI] [PMC free article] [PubMed] [Google Scholar]
- Niida H, Murata K, Shimada M, Ogawa K, Ohta K, Suzuki K et al. (2010). Cooperative functions of Chk1 and Chk2 reduce tumour susceptibility in vivo. EMBO J 29: 3558–3570. [DOI] [PMC free article] [PubMed] [Google Scholar]
- Nishizuka S, Charboneau L, Young L, Major S, Reinhold WC, Waltham M et al. (2003). Proteomic profiling of the NCI-60 cancer cell lines using new high-density reverse-phase lysate microarrays. Proc Natl Acad Sci USA 100: 14229–14234. [DOI] [PMC free article] [PubMed] [Google Scholar]
- Nuciforo PG, Luise C, Capra M, Pelosi G, d’Adda di Fagagna F. (2007). Complex engagement of DNA damage response pathways in human cancer and in lung tumor progression. Carcinogenesis 28: 2082–2088. [DOI] [PubMed] [Google Scholar]
- Ou YH, Chung PH, Sun TP, Shieh SY. (2005). p53 C-terminal phosphorylation by CHK1 and CHK2 participates in the regulation of DNA-damage-induced C-terminal acetylation. Mol Biol Cell 16: 1684–1695. [DOI] [PMC free article] [PubMed] [Google Scholar]
- Pfister TD, Reinhold WC, Agama K, Gupta S, Khin SA, Kinders RJ et al. (2009). Topoisomerase I levels in the NCI-60 cancer cell line panel determined by validated ELISA and microarray analysis and correlation with indenoisoquinoline sensitivity. Mol Cancer Ther 8: 1878–1884. [DOI] [PMC free article] [PubMed] [Google Scholar]
- Pommier Y, Sordet O, Rao VA, Zhang H, Kohn KW. (2005). Targeting chk2 kinase: molecular interaction maps and therapeutic rationale. Curr Pharm Des 11: 2855–2872. [DOI] [PubMed] [Google Scholar]
- Pommier Y, Weinstein JN, Aladjem MI, Kohn KW. (2006). Chk2 molecular interaction map and rationale for Chk2 inhibitors. Clin Cancer Res 12: 2657–2661. [DOI] [PubMed] [Google Scholar]
- Powers JT, Hong S, Mayhew CN, Rogers PM, Knudsen ES, Johnson DG. (2004). E2F1 uses the ATM signaling pathway to induce p53 and Chk2 phosphorylation and apoptosis. Mol Cancer Res 2: 203–214. [PubMed] [Google Scholar]
- Reinhold WC, Mergny JL, Liu H, Ryan M, Pfister TD, Kinders R et al. (2010). Exon array analyses across the NCI-60 reveal potential regulation of TOP1 by transcription pausing at guanosine quartets in the first intron. Cancer Res 70: 2191–2203. [DOI] [PMC free article] [PubMed] [Google Scholar]
- Ribeiro-Silva A, Moutinho MA, Moura HB, Vale FR, Zucoloto S. (2006). Expression of checkpoint kinase 2 in breast carcinomas: correlation with key regulators of tumor cell proliferation, angiogenesis, and survival. Histol Histopathol 21: 373–382. [DOI] [PubMed] [Google Scholar]
- Rogoff HA, Pickering MT, Frame FM, Debatis ME, Sanchez Y, Jones S et al. (2004). Apoptosis associated with deregulated E2F activity is dependent on E2F1 and Atm/Nbs1/Chk2. Mol Cell Biol 24: 2968–2977. [DOI] [PMC free article] [PubMed] [Google Scholar]
- Roschke AV, Tonon G, Gehlhaus KS, McTyre N, Bussey KJ, Lababidi S et al. (2003). Karyotypic complexity of the NCI-60 drug-screening panel. Cancer Res 63: 8634–8647. [PubMed] [Google Scholar]
- Sarbia M, Ott N, Puhringer-Oppermann F, Brucher BL. (2007). The predictive value of molecular markers (p53, EGFR, ATM, CHK2) in multimodally treated squamous cell carcinoma of the oesophagus. Br J Cancer 97: 1404–1408. [DOI] [PMC free article] [PubMed] [Google Scholar]
- Scherf U, Ross DT, Waltham M, Smith LH, Lee JK, Tanabe L et al. (2000). A gene expression database for the molecular pharmacology of cancer. Nat Genet 24: 236–244. [DOI] [PubMed] [Google Scholar]
- Schwarz JK, Lovly CM, Piwnica-Worms H. (2003). Regulation of the Chk2 protein kinase by oligomerization-mediated cis- and trans-phosphorylation. Mol Cancer Res 1: 598–609. [PubMed] [Google Scholar]
- Sedelnikova OA, Bonner WM. (2006). GammaH2AX in cancer cells: a potential biomarker for cancer diagnostics, prediction and recurrence. Cell Cycle 5: 2909–2913. [DOI] [PubMed] [Google Scholar]
- Shankavaram UT, Reinhold WC, Nishizuka S, Major S, Morita D, Chary KK et al. (2007). Transcript and protein expression profiles of the NCI-60 cancer cell panel: an integromic microarray study. Mol Cancer Ther 6: 820–832. [DOI] [PubMed] [Google Scholar]
- Shoemaker RH. (2006). The NCI60 human tumour cell line anticancer drug screen. Nat Rev Cancer 6: 813–823. [DOI] [PubMed] [Google Scholar]
- Solier S, Pommier Y. (2009). The apoptotic ring: a novel entity with phosphorylated histones H2AX and H2B and activated DNA damage response kinases. Cell Cycle 8: 1853–1859. [DOI] [PubMed] [Google Scholar]
- Solier S, Sordet O, Kohn KW, Pommier Y. (2009). Death receptor-induced activation of the Chk2- and histone H2AX-associated DNA damage response pathways. Mol Cell Biol 29: 68–82. [DOI] [PMC free article] [PubMed] [Google Scholar]
- Staalesen V, Falck J, Geisler S, Bartkova J, Borresen-Dale AL, Lukas J et al. (2004). Alternative splicing and mutation status of CHEK2 in stage III breast cancer. Oncogene 23: 8535–8544. [DOI] [PubMed] [Google Scholar]
- Stevens C, Smith L, La Thangue NB. (2003). Chk2 activates E2F-1 in response to DNA damage. Nat Cell Biol 5: 401–409. [DOI] [PubMed] [Google Scholar]
- Stolz A, Ertych N, Kienitz A, Vogel C, Schneider V, Fritz B et al. (2010). The CHK2–BRCA1 tumour suppressor pathway ensures chromosomal stability in human somatic cells. Nat Cell Biol 12: 492–499. [DOI] [PubMed] [Google Scholar]
- Sullivan A, Yuille M, Repellin C, Reddy A, Reelfs O, Bell A et al. (2002). Concomitant inactivation of p53 and Chk2 in breast cancer. Oncogene 21: 1316–1324. [DOI] [PubMed] [Google Scholar]
- Sun Y, Jiang X, Chen S, Fernandes N, Price BD. (2005). A role for the Tip60 histone acetyltransferase in the acetylation and activation of ATM. Proc Natl Acad Sci USA 102: 13182–13187. [DOI] [PMC free article] [PubMed] [Google Scholar]
- Takai H, Naka K, Okada Y, Watanabe M, Harada N, Saito S et al. (2002). Chk2-deficient mice exhibit radioresistance and defective p53-mediated transcription. EMBO J 21: 5195–5205. [DOI] [PMC free article] [PubMed] [Google Scholar]
- Tsvetkov L, Xu X, Li J, Stern DF. (2003). Polo-like kinase 1 and Chk2 interact and co-localize to centrosomes and the midbody. J Biol Chem 278: 8468–8475. [DOI] [PubMed] [Google Scholar]
- Yang S, Jeong JH, Brown AL, Lee CH, Pandolfi PP, Chung JH et al. (2006). Promyelocytic leukemia activates Chk2 by mediating Chk2 autophosphorylation. J Biol Chem 281: 26645–26654. [DOI] [PubMed] [Google Scholar]
- Yee C, Krishnan-Hewlett I, Baker CC, Schlegel R, Howley PM. (1985). Presence and expression of human papillomavirus sequences in human cervical carcinoma cell lines. Am J Pathol 119: 361–366. [PMC free article] [PubMed] [Google Scholar]
- Yu Q, Rose JH, Zhang H, Pommier Y. (2001). Antisense inhibition of Chk2/hCds1 expression attenuates DNA damage-induced S and G2 checkpoints and enhances apoptotic activity in HEK-293 cells. FEBS Lett 505: 7–12. [DOI] [PubMed] [Google Scholar]
- Zhang S, Hemmerich P, Grosse F. (2007). Centrosomal localization of DNA damage checkpoint proteins. J Cell Biochem 101: 451–465. [DOI] [PubMed] [Google Scholar]
- Zhao H, Tanaka T, Halicka HD, Traganos F, Zarebski M, Dobrucki J et al. (2007). Cytometric assessment of DNA damage by exogenous and endogenous oxidants reports aging-related processes. Cytometry A 71: 905–914. [DOI] [PMC free article] [PubMed] [Google Scholar]
- Zhao H, Traganos F, Darzynkiewicz Z. (2008). Kinetics of histone H2AX phosphorylation and Chk2 activation in A549 cells treated with topotecan and mitoxantrone in relation to the cell cycle phase. Cytometry A 73: 480–489. [DOI] [PubMed] [Google Scholar]
- Zhou M, Meng Z, Jobson AG, Pommier Y, Veenstra TD. (2007). Detection of in vitro kinase generated protein phosphorylation sites using gamma[18O4]-ATP and mass spectrometry. Anal Chem 79: 7603–7610. [DOI] [PubMed] [Google Scholar]
Associated Data
This section collects any data citations, data availability statements, or supplementary materials included in this article.