

ABSTRACT
Multiple studies have suggested that ω-3 fatty acid intake may have a protective effect on cancer risk; however, its true association with cancer risk remains controversial. We performed an umbrella review of meta-analyses to summarize and evaluate the evidence for the association between ω-3 fatty acid intake and cancer outcomes. We searched PubMed, Embase, and the Cochrane Database of Systematic Reviews from inception to December 1, 2018. We included meta-analyses of observational studies that examined associations between intake of fish or ω-3 fatty acid and cancer risk (gastrointestinal, liver, breast, gynecologic, prostate, brain, lung, and skin) and determined the level of evidence of associations. In addition, we appraised the quality of the evidence of significant meta-analyses by using the Grading of Recommendations Assessment, Development and Evaluation (GRADE) system. We initially screened 598 articles, and 15 articles, including 57 meta-analyses, were eligible. Among 57 meta-analyses, 15 reported statistically significant results. We found that 12 meta-analyses showed weak evidence of an association between ω-3 fatty acid intake and risk of the following types of cancer: liver cancer (n = 4 of 6), breast cancer (n = 3 of 14), prostate cancer (n = 3 of 11), and brain tumor (n = 2 of 2). In the other 3 meta-analyses, studies of endometrial cancer and skin cancer, there were no assessable data for determining the evidence levels. No meta-analysis showed convincing, highly suggestive, or suggestive evidence of an association. In the sensitivity analysis of meta-analyses by study design, we found weak associations between ω-3 fatty acid intake and breast cancer risk in cohort studies, but no statistically significant association in case-control studies. However, the opposite results were found in case of brain tumor risk. Although ω-3 fatty acids have been studied in several meta-analyses with regard to a wide range of cancer outcomes, only weak associations were identified in some cancer types, with several limitations. Considering the nonsignificant or weak evidence level, clinicians and researchers should cautiously interpret reported associations between ω-3 fatty acid consumption and cancer risks.
Keywords: ω-3 fatty acid, fish, cancer, umbrella review, meta-analysis
Introduction
ω-3 Fatty acids, also called n-3 fatty acids, play important roles in human health and a variety of diseases (1), and therefore, they are considered one of the important resources for the human body. ω-3 Fatty acids include long-chain α-linolenic acid (ALA), EPA, and DHA (2). ALA is considered an essential fatty acid because it cannot be synthesized by the body and must be obtained by consumption of food or supplements. However, because EPA and DHA are generated from ALA in the body, their dietary consumption is not considered essential for human health (3). ω-3 Fatty acids can be ingested from ALA-containing plant oil, which can be obtained from walnuts, flaxseed, and canola (4). EPA and DHA can be supplemented by eating fatty fish such as albacore tuna, salmon, mackerel, sardines, and herring (5). ω-3 Fatty acids are incorporated into numerous parts of the body (6). For example, DHA is a key component of all cell membranes (7), and EPA and DHA are precursors of metabolites that act as lipid mediators, which are assumed to be effective in preventing or treating several diseases (8).
Multiple animal studies and in vitro studies have supported the association of the consumption of fish high in ω-3 fatty acids with reduced cancer risk. ω-3 Fatty acids modulate the production of inflammatory signaling molecules, called eicosanoids, and regulate the inflammatory reaction along with the effect on cell growth (9). Later epidemiological studies and meta-analyses also examined the putative effects of ω-3 fatty acid supplementation on various cancers (10, 11). However, these reviews have generated conflicting results and did not include comprehensive appraisals and consideration of biases and uncertainty in the body of evidence used to support claims of causal associations.
Recently, a new approach called the umbrella review has been developed to investigate field-wide evidence on complex topics such as cardiovascular diseases, cancers, and multiple health outcomes (12–14). The number of meta-analyses in the field of medicine has increased exponentially, and the abundance of the results has not always had positive effects on clinical decisions (15). Recently published meta-analyses, including those in nutrition, only give a limited perspective of results by examining the effect of a specific intervention on a specific outcome. In studies of different types of cancer included in previously published meta-analyses, differences in types and doses of ω-3 fatty acids have affected the conclusions obtained and led to contradictory and inconsistent meta-analysis findings. A systematic approach to providing evidence is thus needed.
Given the aforementioned shortcomings of previous data, we set out to provide an overview and evaluate the validity of reported associations of ω-3 fatty acids with various cancer risks by performing the first umbrella review of the evidence across existing systematic reviews and meta-analyses of observational studies. To the best of our knowledge, no umbrella review has investigated the association between ω-3 fatty acids and cancer risk.
Methods
This umbrella review of meta-analyses was performed according to the Preferred Reporting Items for Systematic Reviews and Meta-Analyses (PRIMSA) guidelines (16).
Search strategy of the literature
We performed an umbrella review of the systematic reviews and meta-analyses on associations between ω-3 fatty acid intake and cancer risks. Three investigators (JIS, HJS, and EKC) performed a search of PubMed, Embase, and the Cochrane Database of Systematic Reviews, restricted to articles published in English. The search included studies publisehd through December 1, 2018, without any limitation of the publication date. We used the following search terms: (ω-3 fatty acid OR n-3 fatty acid OR w-3 fatty acid OR alpha-linolenic acid OR EPA OR DHA OR PUFA OR docosapentaenoic acid (DPA) OR long chain PUFA OR fish OR fish oil OR krill oil) AND cancer AND meta. We screened for eligible articles by subsequently examining titles, abstracts, and full texts in order.
Eligibility and inclusion/exclusion criteria
We included only systematic reviews and meta-analyses that examined the association between ω-3 fatty acid and cancer risk. We excluded studies that 1) examined genetic polymorphisms related to ω-3 fatty acid metabolism; 2) had ω-3 fatty acid status as the outcome; 3) dealt with cost-effectiveness of ω-3 fatty acid supplementation; 4) were meta-analyses in which the treatment arm contained several compounds, including ω-3 fatty acids; 5) were meta-analyses focusing on the ratio of ω-3/ω-6 PUFA; 6) did not reporting cancer risk. We also excluded meta-regression analyses and sensitivity analyses. A detailed flow chart of the screening and selection process of eligible articles is presented in Figure 1.
FIGURE 1.
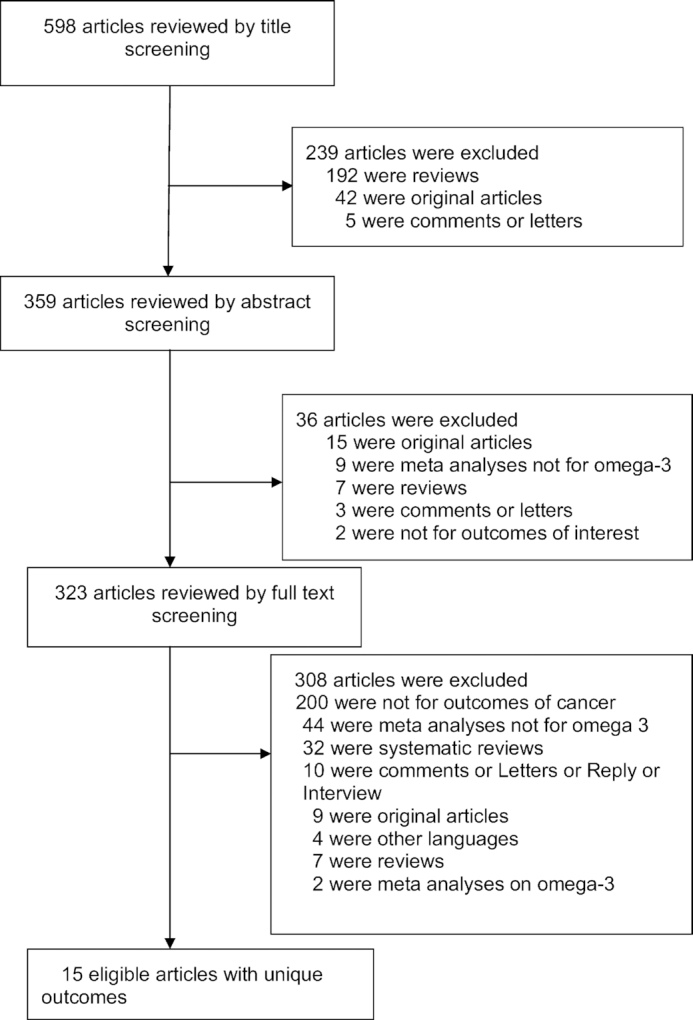
Flow chart of the literature search.
Assessment of methodological quality
The methodological quality of the included systematic reviews and meta-analyses was evaluated using A Measurement Tool to Assess Systematic Reviews 2 (AMSTAR2) (17). This instrument is a 16-point assessment tool for evaluating methodological aspects of included studies and provides a rationale for item selection and identifies critical domains for assessment of the validity of the results of systematic reviews and meta-analyses. Study validity is classified as high, moderate, low, or critically low instead of using an overall score. The detailed results obtained with these rating criteria are shown in Supplemental Table 1.
Extraction of the data
Data were extracted by 3 investigators (GK, HP, and EJ), and any discrepancies were discussed and resolved by consensus. For each eligible review, we gathered the outcome data of the meta-analyses. We also abstracted the names of the first author and the journal, publication year, type of outcome, types of patients, study design (cohort and/or case-control), number of studies, type of metric (RR, OR, or HR, as reported by the authors of the meta-analysis), effect sizes with corresponding 95% CIs, meta-analysis model (fixed/random), the P value for overall effects, I2 or chi-squared value for between-study heterogeneity, P value for between-study heterogeneity, and Egger's P value or other statistics for publication bias.
Data analysis
With the extracted data from meta-analyses, we reanalyzed the eligible meta-analyses extracted from the previously published studies. We collected all of the included individual studies and performed reanalysis using Comprehensive Meta-Analysis software version 3.3.070 (Biostat). Then, we summarized different summary effect sizes with corresponding 95% CIs from the results of meta-analyses. We applied random-effects models by assuming that individual effects of studies were different (i.e., between-study heterogeneity). We also calculated the 95% prediction interval (PI), which further accounts for between-study heterogeneity and evaluates the uncertainty of the effect that would be expected in a new study addressing the same associations (24–26).
We assessed the heterogeneity between studies using I2, which ranges from 0 to 100%, and the P value of the chi-square–based Cochran Q test (27). I2 is the ratio of between-study variance to the sum of the within- and between-study variances (28). I2 values >50 % or >75 % are usually interpreted as having large or very large heterogeneity, respectively (28). We also evaluated small-study effects, commonly known as publication bias, to identify whether such studies tend to give much larger risk estimates than large studies (29). By using the regression asymmetry test proposed by Egger and colleagues, we assessed small-study effects indicating publication and other reporting bias (30). An Egger P value <0.10 in a random-effects model was judged to provide evidence for small-study effects.
In addition, we assessed the presence of excess significance, a measure of literature bias that compares the expected number of statistically significant studies in a meta-analysis with the observed number (31). Excess significance was calculated as a ratio of the effect size of the largest individual study (the study with the smallest variance) in each meta-analysis to the summary effect size of the meta-analysis, with a ratio <1 indicating the presence of excess significance bias (32). For statistically significant meta-analyses, we also appraised the quality of the evidence from each meta-analysis by using the GRADE system (33).
Level of evidence of associations
Based on results of our reanalysis of the eligible meta-analysis, we further grouped the associations between ω-3 fatty acids and cancer risks according to the criteria from conventional umbrella reviews (15, 34) with the following components: evidence of strong statistical significance using random-effects meta-analyses at P < 10−6, magnitude of between-study heterogeneity I2 < 50%, number of cases with binary outcomes >1000, absence of small study effects (Egger P ≥ 0.10), and 95% PI that excluded the null.
Convincing evidence required strong statistical significance in a meta-analysis, with P < 10−6, the absence of large heterogeneity (I2 < 50%), number of cases with binary outcomes >1000, no evidence of small-study effects (Egger P value > 0.10) and excess significance bias, and 95% PI excluding the null.
Highly suggestive evidence required strong statistical significance, with P < 10−6, 95% PI including the null, number of cases >1000, and the presence of large heterogeneity (I2 > 50%), small-study effects, and excess significance bias.
Suggestive evidence required a significant association, with P < 0.001, 95% PI including the null, number of cases >1000, the presence of large heterogeneity (I2 > 50%), small-study effects, and excess significance bias.
Weak evidence was that for which there was large heterogeneity (I2 > 50%) or publication bias and evidence of small-study effects. Even if there was not large heterogeneity (I2 ≤ 50%) or publication bias or excess significance bias, a small number of cases (<1000) or a nominally significant association (P = 0.001–0.05) would be observed.
Nonsignificant associations had P > 0.05.
If a meta-analysis included only 1 study, the between-study heterogeneity and Egger P value were not available. In this case, we determined the level was not assessable (NA).
Reanalysis of meta-analyses by study design
We further processed the sensitivity analysis by study design. Using the reported results from meta-analyses, including both case-control and cohort studies in a single analysis, we separated them by study design (case-control and cohort) and performed a reanalysis. Meta-analyses including only 1 cohort and case-control study, respectively, were not accounted for in the sensitivity analysis. We then evaluated the level of evidence of the outcome from reanalysis.
Results
Overall summary of meta-analyses
A total of 598 articles were initially identified, with exclusions of duplicated articles, and 15 eligible articles with 57 meta-analyses were included in our review. We systematically categorized 57 meta-analyses into 6 cancer-risk categories as follows: gastrointestinal cancer, liver cancer, breast cancer, gynecologic cancer, prostate cancer, and brain/lung/skin cancer (10, 18–23, 35–42). Brain/lung/skin cancer was assessed in groups due to small numbers of meta-analyses.
Gastrointestinal cancer outcomes
Among 5 meta-analyses identified from the literature search, all showed no association of cancer risk with ω-3 fatty acid intake. The studies were on gastric cancer (n = 1) and colorectal cancer (n = 4) (Table 1).
TABLE 1.
Summary of the meta-analyses of fish and ω-3 fatty acid intake and gastrointestinal cancer risk1
| Author & year, type of cancer | n | Type of studies | Type of ω-3 fatty acid intake2 | Cases/total participants | Type of metrics | Summary effect size (95% CI) | Model | P value | I 2 (P value) | Egger's P value | Statistically significant |
|---|---|---|---|---|---|---|---|---|---|---|---|
| Wu S et al., 2011 (18) | |||||||||||
| Gastric cancer | 17 | CC, cohort | High fish consumption | 5323/136,226 | RR | 0.87 (0.71, 1.07) | Random | NR | 73.3 (<0.001) | 0.59 | No |
| Shen X-J et al., 2012 (19) | |||||||||||
| Colorectal cancer | 7 | Cohort | High ω-3 PUFAs intake | 4656/489,465 | RR | 0.97 (0.86, 1.10) | Random | NR | 38.1 (0.08) | NR | No |
| Chen G-C et al., 2015 (20) | |||||||||||
| Colorectal cancer | 10 | CC, cohort | Total n-3 PUFA intake (high vs. low) | 7372/581,943 | RR | 0.99 (0.92, 1.06) | Random | NR | 10.5 (0.34) | 0.61 | No |
| Colorectal cancer | 11 | CC, cohort | Marine n-3 PUFA intake (high vs. low) | NR | RR | 1.00 (0.93, 1.07) | Random | NR | 0.0 (0.51) | 0.73 | No |
| Geelen A et al., 2007 (21) | |||||||||||
| Colorectal cancer | 14 | Cohort | Fish consumption (high vs. low) | NR | RR | 0.88 (0.78, 1.00) | Random | NR | 18.3 (0.25) | 0.66 | No |
n represents the number of studies included in the meta-analysis. CC, case control; NR, not reported.
Definitions of comparison of each category follow that described in the original studies.
Liver cancer outcomes
Six meta-analyses of the association of ω-3 fatty acids and liver cancer were identified. Among these, 4 meta-analyses were statistically significant, with reduction of cancer incidence with ω-3 fatty acid intake. The other 2 meta-analyses revealed no associations (Table 2).
TABLE 2.
Summary of the meta-analyses of fish and ω-3 fatty acid intake and liver cancer risk1
| Author & year, type of cancer | n | Type of studies | Type of ω-3 fatty acid intake2 | Cases/total participants | Type of metrics | Summary effect size (95% CI) | Model | P value | I2 (P) | Egger's P value | Statistically significant |
|---|---|---|---|---|---|---|---|---|---|---|---|
| Huang R-X et al., 2015 (22) | |||||||||||
| HCC | 10 | CC, cohort | High total fish intake | 1984/5,370,040 | RR | 0.82 (0.71, 0.94) | Random | 0.018 | 12.8 (0.325) | 0.07 | Yes |
| HCC | 5 | CC | High total fish intake | 809/10,352 | RR | 0.79 (0.59, 1.06) | Random | 0.27 | 41.9 (0.142) | NR | No |
| HCC | 5 | Cohort | High total fish intake | 1175/5,359,688 | RR | 0.82 (0.70, 0.96) | Random | 0.011 | 0.0 (0.487) | NR | Yes |
| Gao M et al., 2015 (23) | |||||||||||
| HCC | 11 | CC, cohort | Fish consumption | NR/1,196,005 | RR | 0.65 (0.51, 0.79) | Random | NR | 44.1 (0.057) | <0.01 | Yes |
| HCC | 2 | CC, cohort | n-3 PUFA intake | 583/91,291 | RR | 0.49 (0.19, 0.79) | Random | NR | 0.0 (0.929) | NA | Yes |
| HCC | 2 | CC, cohort | ALA intake | 583/91,291 | RR | 0.70 (0.30, 1.10) | Random | NR | 0.0 (1.000) | NA | No |
n represents the number of studies included in the meta-analysis. ALA, alpha-linolenic acid; CC, case control; HCC, hepatocellular carcinoma; NR, not reported.
Definitions of comparison of each category follow that described in the original studies.
Breast cancer outcomes
Among 14 meta-analyses, 3 showed a statistically significant result for reduction of breast cancer risk with ω-3 fatty acid intake. The remaining meta-analyses showed no association (Table 3).
TABLE 3.
Summary of the meta-analyses of fish and ω-3 fatty acid intake and breast cancer risk1
| Author & year, type of cancer | n | Type of studies | Type of ω-3 fatty acid intake2 | Cases/total participants | Type of metrics | Summary effect size (95% CI) | Model | P value | I2 (P value) | Egger's P value | Statistically significant |
|---|---|---|---|---|---|---|---|---|---|---|---|
| Zheng J-S et al., 2013 (10) | |||||||||||
| Breast cancer | 17 | CC, cohort | Highest marine n-3 PUFA intake | 16,178/527,392 | RR | 0.86 (0.78, 0.94) | Random | NR | 54 (0.003) | 0.017 | Yes |
| Breast cancer | 10 | CC, cohort | Total n-3 PUFA | NR | RR | 0.96 (0.86, 1.06) | Random | NR | 13 (NR) | 0.04 | No |
| Breast cancer | 10 | Cohort | Marine n-3 PUFA (diet) | 11,519/443,619 | RR | 0.85 (0.76, 0.96) | Random | NR | 67 (0.001) | NR | Yes |
| Breast cancer | 3 | Cohort | Per 0.1g/d increment of dietary marine n-3 PUFA | 3114/117,488 | RR | 0.95 (0.90, 1.00) | Random | NR | 52 (0.1) | NR | Yes |
| Breast cancer | 5 | Cohort | Per 0.1% energy increment of daily dietary marine n-3 PUFA | 6344/288,626 | RR | 0.95 (0.90, 1.00) | Random | NR | 79 (<0.001) | NR | No |
| Breast cancer | 11 | CC, cohort | Highest dietary fish intake | 13,323/687,770 | RR | 1.03 (0.93, 1.14) | Random | NR | 54 (0.009) | 0.6 | No |
| Breast cancer | 11 | CC, cohort | Per 15 g/d increment of fish intake | 13,323/666,400 | RR | 1.00 (0.97, 1.03) | Random | NR | 64.0 (0.001) | NR | No |
| Breast cancer | 10 | CC, cohort | Marine n-3 fatty (EPA) | NR | RR | 0.93 (0.85, 1.02) | Random | NR | 2.9 (NR) | NR | No |
| Breast cancer | 10 | CC, cohort | Marine n-3 fatty (DHA) | NR | RR | 0.88 (0.75, 1.03) | Random | NR | 37.6 (NR) | NR | No |
| Breast cancer | 4 | CC, cohort | Marine n-3 fatty (DPA) | 4746/284,724 | RR | 0.90 (0.69, 1.19) | Random | NR | 0.0 (NR) | NR | No |
| Breast cancer | 6 | Cohort | ALA(Diet) | 8274/281,756 | RR | 0.98 (0.90, 1.06) | Random | NR | 5.1 (0.384) | NR | No |
| Breast cancer | 4 | Cohort | Per 0.1 g/d increment of dietary ALA intake | 6310/190,451 | RR | 0.99 (0.98, 1.01) | Random | NR | 65.0 (0.035) | NR | No |
| Breast cancer | 3 | Cohort | Per 0.1% energy increment of daily dietary ALA intake | 5510/171,680 | RR | 1.00 (0.99, 1.00) | Random | NR | 0.0 (0.770) | NR | No |
| Breast cancer | 12 | CC, cohort | ALA (tissue biomarker and diet) | 9296/284,724 | RR | 0.97 (0.90, 1.04) | Random | NR | 0.0 (0.548) | 0.37 | No |
n represents the number of studies included in the meta-analysis. ALA, α-linolenic acid; CC, case-control; DPA, docosapentaenoic acid; NR, not reported.
Definitions of comparison of each category follow those described in the original studies.
Gynecologic cancer outcomes
Among 14 meta-analyses, 2 meta-analyses found that high EPA and DHA intake significantly reduced the risk of ovarian cancer, respectively (EPA intake OR: 0.57; 95% CI: 0.39, 0.84; DHA intake OR: 0.64; 95% CI: 0.44, 0.94); however, they both only included 1 case-control study. The other meta-analyses did not affect the incidence of ovarian cancer (n = 7) or endometrial cancer (n = 5) (Table 4).
TABLE 4.
Summary of the meta-analyses of ω-3 fatty acid intake and gynecologic cancer risk1
| Author & year, type of cancer | n | Type of studies | Type of ω-3 fatty acid intake2 | Cases/total participants | Type of metrics | Summary effect size (95% CI) | Model | P value | I 2 (P value) | Egger's P value | Statistically significant |
|---|---|---|---|---|---|---|---|---|---|---|---|
| Hoang T et al., 2019 (38) | |||||||||||
| Endometrial cancer | 2 | CC | Dietary ω-3 fatty acids (high vs. low) | 1010/2451 | OR | 0.87 (0.65, 1.18) | Random | 0.382 | 0.0 (0.351) | NA | No |
| Endometrial cancer | 3 | Cohort | Dietary ω-3 fatty acids (high vs. low) | NR/157,456 | HR | 1.03 (0.63, 1.68) | Random | 0.902 | 81.0 (0.001) | 0.615 | No |
| Endometrial cancer | 1 | CC | EPA intake (high vs. low) | 556/1089 | OR | 0.57 (0.39, 0.84) | Random | NR | NA | NA | Yes |
| Endometrial cancer | 3 | Cohort | EPA intake (high vs. low) | NR/157,456 | HR | 1.00 (0.61, 1.62) | Random | 0.10 | 81.7 (0.000) | 0.693 | No |
| Endometrial cancer | 2 | CC | ALA intake (high vs. low) | 1010/2451 | OR | 0.95 (0.72, 1.25) | Random | 0.709 | 0.0 (0.739) | NA | No |
| Endometrial cancer | 3 | Cohort | ALA intake (high vs. low) | NR/157,456 | HR | 0.92 (0.76, 1.11) | Random | 0.368 | 0.0 (0.838) | 0.074 | No |
| Endometrial cancer | 1 | CC | DHA intake (high vs. low) | 556/1089 | OR | 0.64 (0.44, 0.94) | Random | NR | NA | NA | Yes |
| Endometrial cancer | 3 | Cohort | DHA intake (high vs. low) | NR/157,456 | HR | 1.01 (0.63, 1.60) | Random | 0.981 | 79.2 (0.008) | 0.529 | No |
| Endometrial cancer | 2 | Cohort | DPA intake (high vs. low) | NR/88,774 | HR | 0.86 (0.71, 1.03) | Random | NR | 0.0 (NR) | NA | No |
| Ovarian cancer | 3 | CC | Dietary ω-3 fatty acids (high vs. low) | 4269/5803 | OR | 0.79 (0.61–1.03) | Random | NR | 74.5 (NR) | NR | No |
| Ovarian cancer | 2 | CC, cohort | EPA intake (high vs. low) | 3238/3392 | OR | 0.89 (0.73, 1.08) | Random | NR | 71.5 (NR) | NA | No |
| Ovarian cancer | 3 | CC, cohort | ALA intake (high vs. low) | 4269/5803 | OR | 0.99 (0.77, 1.26) | Random | NR | 58.6 (NR) | NR | No |
| Ovarian cancer | 2 | CC, cohort | DHA intake (high vs. low) | 3238/3392 | OR | 0.91 (0.75, 1.11) | Random | NR | 0.0 (NR) | NA | No |
| Ovarian cancer | 1 | CC | DPA intake (high vs. low) | 1366/1414 | OR | 1.06 (0.85, 1.33) | NA | NR | NA | NA | No |
n represents the number of studies included in the meta-analysis. ALA, α-linolenic acid; CC, case control; DPA, docosapentaenoic acid; NA, not assessible; NR, not reported.
Definitions of comparison of each category follow that described in the original studies.
Prostate cancer outcomes
Among 11 meta-analyses, 3 meta-analyses showed statistically significant results for the association between ω-3 fatty acid intake and prostate cancer (n = 3). Of 3 results, 1 meta-analysis showed that consumption of long-chain n-3 increased the risk of prostate cancer (RR: 1.14; 95% CI: 1.01, 1.28), whereas the other 2 meta-analyses found a protective effect of ω-3 intake. One study showed a marginally nonsignificant association between high consumption of fish and prostate cancer (p = 0.05). The remaining meta-analyses reported no association (n = 7) (Table 5).
TABLE 5.
Summary of the meta-analyses of fish and ω-3 fatty acid intake and prostate cancer risk1
| Author & year, type of cancer | n | Type of studies | Type of ω-3 fatty acid intake2 | Cases/total participants | Type of metrics | Summary effect size (95% CI) | Model | P value | I2 (P value) | Egger's P value | Statistically significant |
|---|---|---|---|---|---|---|---|---|---|---|---|
| Fu Y-Q et al., 2015 (37) | |||||||||||
| Prostate cancer | 5 | Cohort | Per 0.5 g/d increase in ALA intake | 7781/430,090 | RR | 0.99 (0.98, 1.00) | Random | NR | 0.0 (0.670) | NR | Yes |
| Prostate cancer | 5 | Cohort | Per 0.05 g/d increase in EPA intake | 7778/450,999 | RR | 1.02 (0.99, 1.05) | Random | NR | 36.1 (0.181) | NR | No |
| Szymanski KM et al., 2010 (41) | |||||||||||
| Prostate cancer | 12 | CC | High fish consumption | 5777/9805 | OR | 0.85 (0.72, 1.00) | Random | 0.05 | 44 (0.05) | 0.62 | No |
| Prostate cancer | 12 | Cohort | High fish consumption | 13,924/445,820 | RR | 1.01 (0.90, 1.14) | Random | 0.83 | 59 (0.005) | 0.84 | No |
| Alexander DD et al., 2015 (35) | |||||||||||
| Prostate cancer | 13 | Cohort | High ω-3 PUFA intake (diet) | NR/446,243 | SRRE | 1.00 (0.93, 1.09) | Random | NR | 50.4 (0.019) | NR | No |
| Chua ME et al., 2012 (36) | |||||||||||
| Prostate cancer | 4 | Cohort | ALA intake | NR/177,133 | RR | 0.92 (0.85, 0.99) | Random | 0.019 | 0 (0.677) | 0.34 | Yes |
| Prostate cancer | 2 | Cohort | Total ω 3 intake | NR/93,047 | RR | 0.97 (0.89, 1.07) | Random | 0.549 | 20 (0.264) | NR | No |
| Prostate cancer | 3 | Cohort | EPA intake | NR/151,326 | RR | 1.05 (0.96, 1.15) | Random | 0.317 | 41 (0.182) | 0.65 | No |
| Prostate cancer | 3 | Cohort | DHA intake | NR/196,192 | RR | 1.03 (0.94, 1.13) | Random | 0.489 | 52 (0.127) | 0.54 | No |
| Prostate cancer | 2 | Cohort | Long-chain n-3 | NR/30,731 | RR | 1.14 (1.01, 1.28) | Random | 0.036 | 25 (0.249) | NA | Yes |
| Prostate cancer | 4 | Cohort | Long-chain n-3 +(DHA + EPA) | NR/82,483 | RR | 1.03 (0.97, 1.10) | Random | 0.278 | 0 (0.462) | 0.51 | No |
n represents the number of studies included in the meta-analysis. ALA, α-linolenic acid; CC, case control; NA, not assessible; NR, not reported.
Definitions of comparison of each category follow that described in the original studies.
Brain, lung, skin cancer outcomes
Among 7 meta-analyses associated with brain, lung, and skin cancer, 3 reported statistically significant associations. Two studies revealed a significant reduced incidence of brain tumors with ω-3 fatty acid intake (n = 2 of 2). Also, a meta-analysis consisting of 1 case-control study found a significantly reduced risk of melanoma. Contrary to the results above, there was no association between the ω-3 fatty acid intake and lung (n = 2) or other skin cancer (n = 2) (Table 6).
TABLE 6.
Summary of the meta-analyses of fish and ω-3 fatty acid intake and brain, lung, and skin cancer risk1
| Author & year, type of cancer | n | Type of studies | Type of ω-3 fatty acid intake2 | Cases/total participants | Type of metrics | Summary effect size (95% CI) | Model | P value | I2 (P value) | Egger's P value | Statistically significant |
|---|---|---|---|---|---|---|---|---|---|---|---|
| Lian W et al., 2017 (39) | |||||||||||
| Brain tumor | 9 | CC, cohort | Fish intake (high vs. low) | 4428/505,296 | RR | 0.83 (0.70, 0.99) | Random | NR | 37.5 (0.119) | 0.02 | Yes |
| Brain tumor | 9 | CC, cohort | Per 100 g/wk increase fish intakes | 4428/505,296 | RR | 0.95 (0.91, 0.98) | Random | NR | 51.7 (0.035) | 0.02 | Yes |
| Zhang Y-F et al., 2014 (42) | |||||||||||
| Lung cancer | 11 | Cohort | PUFA intake (high vs low) | NR/1,268,442 | RR | 0.91(0.78, 1.06) | Random | 0.230 | 67.7 (0.001) | 0.186 | No |
| Lung cancer | 11 | Cohort | PUFA intake (per 5 g/d increment) | NR/1,268,442 | RR | 0.98 (0.96, 1.01) | Random | 0.142 | 69.5 (<0.001) | 0.135 | No |
| Noel SE et al., 2014 (40) | |||||||||||
| Skin cancer, basal cell carcinoma | 2 | Cohort | n-3 PUFA intake (high vs. low) | 3840/44,539 | RR | 1.05 (0.86, 1.28) | Random | NR | 53.6 (0.14) | NR | No |
| Skin cancer, squamous cell carcinoma | 2 | CC, cohort | n-3 PUFA intake (high vs. low) | 1037/2959 | RR | 0.86 (0.59, 1.23) | Random | NR | 52.6 (0.15) | NA | No |
| Skin cancer, melanoma | 1 | CC | n-3 PUFA intake (high vs. low) | 304/609 | OR | 0.52 (0.34, 0.78) | NA | NR | NA | NA | Yes |
n represents the number of studies included in the meta-analysis. CC, case control; NA, not assessible; NR, not reported.
Definitions of comparison of each category follow that described in the original studies.
Levels of evidence of association
Out of 15 significant associations, 12 studies were available to determine the level of evidence (Table 7). Three meta-analyses on melanoma and endometrial cancer were not assessable because they contained only 1 individual study. Of the remaining 12 associations, no study showed convincing or suggestive evidence of association. All meta-analyses with statistically significant findings showed weak evidence, as follows: liver cancer (n = 4 of 6), breast cancer (n = 3 of 14), prostate cancer (n = 3 of 11), and brain tumor (n = 2 of 2). One meta-analysis showed statistically significant results, but the level of evidence was not applicable due to lack of included studies. The other 42 meta-analyses were nonsignificant.
TABLE 7.
Summary of 12 reanalyses of meta-analyses of fish and ω-3 fatty acid intake and cancer risk with statistically significant results1
| Type of cancer | Type of studies | Type of ω-3 fatty acid intake | Number of cases | Metrices | Reanalyzed summary estimate (95% CI) | P value | I2 (P value) | Egger's P value | Small-study effects | Prediction interval | Excess significance ratio | Evidence | GRADE certainty | Reference |
|---|---|---|---|---|---|---|---|---|---|---|---|---|---|---|
| HCC | CC, cohort | High total fish intake | 1984 | RR | 0.83 (0.75, 0.92) | 3.3E-04 | 0.0 (0.441) | 0.347 | Yes | 0.73–0.95 | 0.75 | Weak | Very low | (22) |
| HCC | Cohort | High total fish intake | 1175 | RR | 0.83 (0.74, 0.94) | 0.002 | 0.0 (0.722) | 0.87 | Yes | 0.70–0.99 | 0.77 | Weak | Very low | (22) |
| HCC | Nest CC, cohort | Fish consumption | NR | RR | 0.72 (0.61, 0.86) | 3.05E-04 | 24.117 (0.214) | 0.001 | Yes | 0.50–1.06 | 0.49 | Weak | Very low | (23) |
| HCC | CC, cohort | n-3 PUFA intake | 583 | RR | 0.49 (0.28, 0.85) | 0.011 | 0.0 (0.919) | NA | NA | NA | 1.03 | Weak | Low | (23) |
| Breast cancer | Nest CC, CC, cohort | Highest marine n-3 PUFA intake | 16,178 | RR | 0.86 (0.78, 0.94) | 0.002 | 53.796 (0.003) | 0.017 | Yes | 0.63–1.15 | −0.13 | Weak | Very low | (10) |
| Breast cancer | CC, cohort | Marine n-3 PUFA (Diet) | 11,519 | RR | 0.86 (0.76, 0.96) | 0.007 | 67.343 (0.001) | 0.028 | Yes | 0.60–1.21 | −0.13 | Weak | Very low | (10) |
| Breast cancer | Cohort | Per 0.1 g/d increment of dietary marine n-3 PUFA | 3114 | RR | 0.93 (0.90, 0.97) | 3.89E-04 | 0.000 (0.554) | 0.422 | No | 0.73–1.19 | 0.87 | Weak | Moderate | (10) |
| Prostate cancer | Nest CC, CC, cohort | Per 0.5 g/d increase in ALA intakes | 7781 | RR | 0.99 (0.98, 1.00) | 0.028 | 0.000 (0.665) | 0.566 | No | 0.98–1.01 | 0.0 | Weak | Low | (37) |
| Prostate cancer | Cohort | ALA intake | NR | RR | 0.91 (0.85, 0.98) | 0.017 | 0.000 (0.634) | 0.354 | No | 0.80–1.05 | 0.92 | Weak | Moderate | (36) |
| Prostate cancer | Cohort | Long-chain n-3 | NR | RR | 1.14 (1.01, 1.28) | 0.036 | 24.836 (0.249) | NA | NA | NA | 0.63 | Weak | Low | (36) |
| Brain tumor | CC, cohort | Fish intake (high vs. low) | 4428 | RR | 0.83 (0.70, 0.99) | 0.033 | 37.220 (0.121) | 0.024 | Yes | 0.56–1.25 | 0.58 | Weak | Very low | (39) |
| Brain tumor | CC, cohort | Per 100 g/wk increase fish intakes | 4428 | RR | 0.95 (0.91, 0.98) | 0.007 | 50.736 (0.039) | 0.005 | Yes | 0.86–1.05 | 0.0 | Weak | Very low | (39) |
Definitions of comparison of each category follow that described in the original studies. ALA, alpha-linolenic acid; CC, case control; GRADE, Grading of Recommendations Assessment, Development and Evaluation; NR, not reported.
Among 12 meta-analyses with weak levels of evidence, 5 (41.7%) had a nominally significant association (P = 0.01–0.05). Four (33.3%) had I2 > 50%, implying large heterogeneity between studies; however, none of them showed very large heterogeneity (I2 > 75%). Regarding publication bias, 7 studies (58.3%) showed evidence of small-study effects (Egger P value < 0.10). In case of GRADE assessment, 2 meta-analyses on breast and prostate cancer were rated as moderate certainty and 3 on hepatocellular carcinoma (HCC) and prostate cancer showed low certainty. The other 7 meta-analyses were rated as very low certainty.
Out of 42 nonsignificant associations, 40 meta-analyses showed a nonsignificant levels of evidence (P > 0.05). One outcome of meta-analysis was unavailable for reanalysis due to insufficient information on individual studies used for meta-analysis. The other study only included a single individual study, so the level of evidence was not assessible (Table 8).
TABLE 8.
Summary of 40 reanalyses of meta-analyses of fish and ω-3 fatty acid intake and cancer risk with no statistically significant results1
| Type of cancer | Type of studies | Type of ω-3 fatty acid intake | Number of cases | Metrices | Reanalyzed summary estimate (95% CI) | P value | I2 (P value) | Egger's P value | Small-study effects | Prediction interval | Excess significance ratio | Evidence | Reference |
|---|---|---|---|---|---|---|---|---|---|---|---|---|---|
| Gastric cancer | CC, cohort | High fish consumption | 5323/136,226 | RR | 0.87 (0.71, 1.06) | 0.17 | 73.266 (<0.001) | 0.692 | No | 0.42–1.78 | 1.58 | Nonsignificant | (18) |
| Colorectal cancer | Cohort | High ω-3 PUFAs intake | 4656/489,465 | RR | 0.97 (0.86, 1.10) | 0.66 | 37.546 (0.099) | 0.652 | No | 0.71–1.33 | 1.81 | Nonsignificant | (19) |
| Colorectal cancer | CC, cohort | Total n-3 PUFA intake (high vs. low) | 7372/581,943 | RR | 0.99 (0.92, 1.06) | 0.76 | 10.492 (0.340) | 0.610 | No | 0.87–1.12 | −3.47 | Nonsignificant | (20) |
| Colorectal cancer | CC, cohort | Marine n-3 PUFA intake (high vs. low) | NR | RR | 1.00 (0.93, 1.07) | 0.97 | 0.0 (0.508) | 0.739 | No | 0.92–1.08 | −25.89 | Nonsignificant | (20) |
| Colorectal cancer | Cohort | Fish consumption (high vs. low) | NR | RR | 0.88 (0.78–1.00) | 0.051 | 14.618 (0.286) | 0.314 | No | 0.35–1.79 | 2.95 | Nonsignificant | (21) |
| HCC | CC | High total fish intake | 809/10,352 | RR | 0.79 (0.59, 1.06) | 0.12 | 41.895 (0.142) | 0.314 | No | 0.35–1.79 | 0.0 | Nonsignificant | (22) |
| HCC | CC, cohort | ALA intake | 583/91,291 | RR | 0.70 (0.42–1.18) | 0.18 | 0.0 (1.000) | NA | NA | NA | 1.00 | Nonsignificant | (23) |
| Breast cancer | CC, cohort | Total n-3 PUFA | NR | RR | 0.96 (0.86, 1.07) | 0.43 | 17.486 (0.282) | 0.068 | Yes | 0.78–1.18 | −0.44 | Nonsignificant | (10) |
| Breast cancer | Cohort | Per 0.1% energy increment of daily dietary marine n-3 PUFA | 6344/288,626 | RR | 0.97 (0.92, 1.02) | 0.22 | 55.285 (0.048) | 0.181 | No | 0.85–1.11 | 0.0 | Nonsignificant | (10) |
| Breast cancer | CC, cohort | Highest dietary fish intake | 13,323/687,770 | RR | 1.03 (0.93, 1.14) | 0.61 | 53.635 (0.009) | 0.596 | No | 0.75–1.40 | 0.0 | Nonsignificant | (10) |
| Breast cancer | CC, cohort | Per 15 g/d increment of fish intake | 13,323/666,400 | RR | 1.00 (0.97, 1.03) | 0.98 | 64.5 (<0.001) | 0.847 | No | 0.92–1.09 | −37.77 | Nonsignificant | (10) |
| Breast cancer | CC, cohort | Marine n-3 fatty (EPA) | NR | RR | 0.86 (0.75–1.01) | 0.098 | 12.756 (0.174) | 0.051 | Yes | 0.63–1.18 | −0.07 | Nonsignificant | (10) |
| Breast cancer | CC, cohort | Marine n-3 fatty (DHA) | NR | RR | 0.89 (0.75, 1.05) | 0.16 | 41.781 (0.079) | 0.164 | No | 0.60–1.32 | −0.17 | Nonsignificant | (10) |
| Breast cancer | CC, cohort | Marine n-3 fatty (DPA) | 4746/284,724 | RR | 0.91 (0.68, 1.22) | 0.54 | 0.0 (0.933) | 0.800 | No | 0.48–1.72 | 0.68 | Nonsignificant | (10) |
| Breast cancer | Cohort | ALA (diet) | 8274/281,756 | RR | 0.98 (0.90–1.06) | 0.56 | 5.065 (0.384) | 0.645 | No | 0.85–1.12 | 1.27 | Nonsignificant | (10) |
| Breast cancer | Cohort | Per 0.1 g/d increment of dietary ALA intake | 6310/190,451 | RR | 1.00 (0.99–1.01) | 0.54 | 41.644 (0.162) | 0.321 | No | 0.97–1.03 | 0.0 | Nonsignificant | (10) |
| Breast cancer | Cohort | Per 0.1% energy increment of daily dietary ALA intake | 5510/171,680 | RR | 1.00 (0.99, 1.01) | 0.96 | 0.0 (0.771) | 0.440 | No | 0.97–1.04 | 0.0 | Nonsignificant | (10) |
| Breast cancer | CC, cohort | ALA (tissue biomarker and diet) | 9296/284,724 | RR | 0.97 (0.90, 1.04) | 0.39 | 0.0 (0.548) | 0.373 | No | 0.89–1.05 | 0.96 | Nonsignificant | (10) |
| Endometrial cancer | CC | Dietary ω-3 fatty acids (high vs. low) | 1010/2451 | OR | 0.78 (0.47, 1.30) | 0.35 | 87.184 (0.005) | NA | NA | NA | −0.04 | Nonsignificant | (38) |
| Endometrial cancer | Cohort | Dietary ω-3 fatty acids (high vs. low) | NR/157,456 | HR | 1.03 (0.63, 1.67) | 0.91 | 81.866 (0.004) | 0.590 | No | 0.0–335.28 | −7.58 | Nonsignificant | (38) |
| Endometrial cancer | Cohort | EPA intake (high vs. low) | NR/157,456 | HR | 0.99 (0.61, 1.60) | 0.97 | 82.320 (0.003) | 0.669 | No | 0.0–318.92 | 21.13 | Nonsignificant | (38) |
| Endometrial cancer | CC | ALA intake (high vs. low) | 1010/2451 | OR | 1.08 (0.84, 1.39) | 0.55 | 28.698 (0.236) | NA | NA | NA | 2.26 | Nonsignificant | (38) |
| Endometrial cancer | Cohort | ALA intake (high vs. low) | NR/157,456 | HR | 0.93 (0.78, 1.09) | 0.37 | 0.0 (0.819) | 0.065 | Yes | 0.31–2.73 | 0.53 | Nonsignificant | (38) |
| Endometrial cancer | Cohort | DHA intake (high vs. low) | NR/157,456 | HR | 1.00 (0.63, 1.59) | 0.99 | 80.457 (0.006) | 0.503 | No | 0.0–237.8 | −111.04 | Nonsignificant | (38) |
| Endometrial cancer | Cohort | DPA intake (high vs. low) | NR/88,774 | HR | 0.86 (0.71, 1.03) | 0.11 | 0.0 (0.888) | NA | NA | NA | 1.04 | Nonsignificant | (38) |
| Ovarian cancer | CC | Dietary ω-3 fatty acids (high vs. low) | 4269/5803 | OR | 0.79 (0.61, 1.03) | 0.081 | 74.539 (0.020) | 0.766 | No | 0.04–17.31 | 1.00 | Nonsignificant | (38) |
| Ovarian cancer | CC, cohort | EPA intake (high vs. low) | 3238/3392 | OR | 0.89 (0.73, 1.08) | 0.25 | 0.0 (0.653) | NA | NA | NA | 1.21 | Nonsignificant | (38) |
| Ovarian cancer | CC, cohort | ALA intake (high vs. low) | 4269/5803 | OR | 0.98 (0.77, 1.26) | 0.90 | 58.606 (0.089) | 0.943 | No | 0.07–13.89 | −11.17 | Nonsignificant | (38) |
| Ovarian cancer | CC, cohort | DHA intake (high vs. low) | 3238/3392 | OR | 0.91 (0.75, 1.11) | 0.34 | 0.0 (0.789) | NA | NA | NA | 0.86 | Nonsignificant | (38) |
| Prostate cancer | Cohort | Per 0.05 g/d increase in EPA intake | 7778/450,999 | RR | 1.02 (0.99, 1.05) | 0.25 | 30.635 (0.217) | 0.709 | No | 0.94–1.10 | 1.10 | Nonsignificant | (37) |
| Prostate cancer | CC | High fish consumption | 5777/9805 | OR | 0.86 (0.72, 1.02) | 0.074 | 47.291 (0.035) | 0.507 | No | 0.53–1.37 | 1.43 | Nonsignificant | (41) |
| Prostate cancer | Cohort | High fish consumption | 13,924/445,820 | RR | 1.05 (0.91, 1.21) | 0.51 | 61.981 (0.002) | 0.671 | No | 0.70–1.58 | 0.83 | Nonsignificant | (41) |
| Prostate cancer | Cohort | Total ω 3 intake | NR/93,047 | RR | 1.15 (0.99, 1.33) | 0.067 | 24.836 (0.249) | NA | NA | NA | 0.63 | Nonsignificant | (36) |
| Prostate cancer | Cohort | EPA intake | NR/151,326 | RR | 1.08 (0.92, 1.25) | 0.34 | 42.662 (0.175) | 0.658 | No | 0.24–4.88 | 0.13 | Nonsignificant | (36) |
| Prostate cancer | Cohort | DHA intake | NR/196,192 | RR | 1.08 (0.91, 1.27) | 0.40 | 51.445 (0.128) | 0.539 | No | 0.19–6.25 | −0.14 | Nonsignificant | (36) |
| Prostate cancer | Cohort | Long-chain n-3 +(DHA + EPA) | NR/82,483 | RR | 1.03 (0.97, 1.10) | 0.28 | 0.0 (0.461) | 0.339 | No | 0.95–1.13 | −0.30 | Nonsignificant | (36) |
| Lung cancer | Cohort | PUFA intake (high vs low) | NR/1,268,442 | RR | 0.91 (0.78, 1.06) | 0.23 | 67.739 (0.001) | 0.186 | No | 0.58–1.44 | −0.11 | Nonsignificant | (42) |
| Lung cancer | Cohort | PUFA intake (per 5 g/d increment) | NR/1,268,442 | RR | 0.98 (0.96, 1.01) | 0.14 | 69.484 (<0.001) | 0.135 | No | 0.93–1.04 | 0.0 | Nonsignificant | (42) |
| Skin cancer, Basal cell carcinoma | Cohort | n-3 PUFA intake (high vs. low) | 3840/44,539 | RR | 1.05 (0.86, 1.28) | 0.64 | 53.633 (0.142) | NA | NA | NA | 2.53 | Nonsignificant | (40) |
| Skin cancer, Squamous cell carcinoma | CC, cohort | n-3 PUFA intake (high vs. low) | 1037/2959 | RR | 0.85 (0.60, 1.21) | 0.38 | 49.990 (0.157) | NA | NA | NA | −0.12 | Nonsignificant | (40) |
Definitions of comparison of each category follow that described in the original studies.
ALA, α-linolenic acid; CC, case control; DPA, docosapentaenoic acid; NA, not assessible.
Reanalysis of meta-analyses by study design
Among 57 meta-analyses analyzed in our study, 15 of them included both case-control and cohort studies in a single meta-analysis (Table 9). For investigations of the highest marine n-3 fatty acid intake, and its potential association with breast cancer, a weak level of evidence of a meta-analysis of observational studies and cohort studies was found, while analysis of case-control studies revealed no significance. Although 2 studies of brain tumors showed weak levels of evidence on meta-analyses of both observational studies and case-control studies, these findings were not significant in cohort studies. However, the pooled meta-analysis of observational studies included only 1 case-control study, and thus this meta-analysis should be interpreted cautiously.
TABLE 9.
Sensitivity analysis of meta-analyses of fish and ω-3 fatty acid intake and cancer risk by study design (cohort and case-control)1
| Observational studies | Cohort | Case-control | ||||||||
|---|---|---|---|---|---|---|---|---|---|---|
| Author & year, type of cancer | Type of ω-3 fatty acid intake2 | n | Summary estimate (95% CI)3 | Level of evidence | n | Summary estimate (95% CI)3 | Level of evidence | n | Summary estimate (95% CI)3 | Level of evidence |
| Wu S et al., 2011 (18) | ||||||||||
| Gastric cancer | High fish consumption | 17 | 0.87 (0.71, 1.07) | Not significant | 2 | 1.10 (0.75, 1.61) | Not significant | 15 | 0.85 (0.68, 1.06) | Not significant |
| Chen G-C et al., 2015 (20) | ||||||||||
| Colorectal cancer | Total n-3 PUFA intake (high vs. low) | 10 | 0.99 (0.92–1.06) | Not significant | 2 | 1.02 (0.92, 1.12) | Not significant | 11 | 0.97 (0.87, 1.08) | Not significant |
| Colorectal cancer | Marine n-3 PUFA intake (high vs. low) | 11 | 1.00 (0.93–1.07) | Not significant | 2 | 1.04 (0.92, 1.17) | Not significant | 9 | 0.98 (0.90, 1.07) | Not significant |
| Zheng J-S et al., 2013 (10) | ||||||||||
| Breast cancer | Highest marine n-3 PUFA intake | 17 | 0.86 (0.78–0.94) | Weak | 11 | 0.86 (0.77, 0.96) | Weak | 6 | 0.83 (0.67, 1.03) | Not significant |
| Breast cancer | Total n-3 PUFA | 10 | 0.96 (0.86–1.06) | Not significant | 4 | 0.99 (0.91, 1.08) | Not significant | 6 | 0.95 (0.61, 1.19) | Not significant |
| Breast cancer | Highest dietary fish intake | 11 | 1.03 (0.93–1.14) | Not significant | 9 | 1.05 (0.94, 1.18) | Not significant | 2 | 0.83 (0.57, 1.20) | Not significant |
| Breast cancer | Per 15 g/d increment of fish intake | 11 | 1.00 (0.97–1.03) | Not significant | 9 | 1.00 (0.97, 1.03) | Not significant | 2 | 0.92 (0.72, 1.19) | Not significant |
| Breast cancer | Marine n-3 fatty (EPA) | 10 | 0.93 (0.85–1.02) | Not significant | 4 | 0.89 (0.74, 1.07) | Not significant | 6 | 0.78 (0.60, 1.02) | Not significant |
| Breast cancer | Marine n-3 fatty (DHA) | 10 | 0.88 (0.75–1.03) | Not significant | 4 | 0.92 (0.74, 1.15) | Not significant | 6 | 0.83 (0.63, 1.08) | Not significant |
| Breast cancer | Marine n-3 fatty (DPA) | 4 | 0.99 (0.98, 1.01) | Not significant | 1 | 0.94 (0.63, 1.38) | Not significant | 3 | 0.89 (0.56, 1.42) | Not significant |
| Breast cancer | ALA (tissue biomarker and diet) | 12 | 0.97 (0.90, 1.04) | Not significant | 6 | 0.97 (0.90, 1.06) | Not significant | 6 | 0.87 (0.67, 1.12) | Not significant |
| Hoang T et al., 2019 (38) | ||||||||||
| Ovarian cancer | ALA intake (high vs. low) | 3 | 0.99 (0.77, 1.26) | Not significant | 1 | 1.00 (0.72, 1.39) | Not significant | 2 | 0.97 (0.66, 1.43) | Not significant |
| Lian W et al., 2017 (39) | ||||||||||
| Brain tumor | Fish intake (high vs. low) | 9 | 0.83 (0.70, 0.99) | Weak | 1 | 1.05 (0.82, 1.34) | Not significant | 8 | 0.79 (0.66, 0.95) | Weak |
| Brain tumor | Per 100 g/wk increase fish intakes | 9 | 0.95 (0.91, 0.98) | Weak | 1 | 0.96 (0.92, 1.01) | Not significant | 8 | 0.94 (0.89, 0.99) | Weak |
| Noel SE et al., 2014 (40) | ||||||||||
| Skin cancer, squamous cellcarcinoma | n-3 PUFA intake (high vs. low) | 3 | 0.86 (0.59, 1.23) | Not significant | 2 | 0.98 (0.71, 1.36) | Not significant | 1 | 0.70 (0.49, 1.00) | Not significant |
n represents the number of studies included in the meta-analysis. ALA, α-linolenic acid; DPA, docosapentaenoic acid; NA, not assessible.
Definitions of comparison of each category follow that described in the original studies.
All summary estimates and 95% CIs were obtained by reanalysis. They were based on a random-effects model.
Discussion
Our umbrella review is to our knowledge the first reported study to examine the evidence from meta-analyses of observational studies on the relation between ω-3 fatty acid intake and cancer risk. Extensive data were provided by 15 eligible articles, with a total of 57 meta-analyses. Among these, we extracted meta-analyses for primary or secondary outcomes, classified these meta-analyses according to types of outcomes, and evaluated each type of analysis with level of significance, using collected data (e.g., P for overall effect, P for heterogeneity, and I2 and P for publication bias, prediction intervals, and numbers of participants). All 12 meta-analyses for the effects of ω-3 intake on liver cancer (n = 4 of 6), breast cancer (n = 3 of 14), prostate cancer (n = 3 of 11), and brain tumor (n = 2 of 2) showed statistically significant results with weak evidence. Three meta-analyses of studies of endometrial cancer and skin cancer also showed significant results, but only contained a single individual study, and the level of evidence was not assessable.
In 1 study there was a positive association between long-chain n-3 intake and risk of prostate cancer. However, this study only included 2 individual cohorts, with a P value showing a nominal significance (P = 0.036), which should be interpreted cautiously.
In the present study, we not only focused on a specific type of ω-3 fatty acids but also included the various types of ω-3 fatty acids. Conventional meta-analyses only focus on a single comparison with a single outcome, which is a design through which it is difficult to broadly understand a subject. To overcome this limitation, the goal of our umbrella review is to help clinicians and researchers develop an extensive understanding of the current evidence for the assciation of ω-3 fatty acid intake with cancer, and therefore we included studies of different sources of ω-3 fatty acid in the current investigation. Regarding the sources of ω-3 fatty acid, the studies were on total dietary fish intake (n = 12, 21.1%), PUFA (n = 18, 31.6%), ALA (n = 10, 17.5%), EPA (n = 6, 10.5%), DHA (n = 5, 8.8%), and DPA (n = 3, 5.3%).
As shown in Table 9, we found that high intake of marine n-3 PUFA significantly reduced the risk of breast cancer in meta-analyses of both observational and cohort studies; however, findings were not significant in analyses of reported case-control studies (10). Despite the nonsignificant result from the meta-analysis of case-control studies, the direction of the outcomes was consistent between case-control and cohort studies. This result is attributable to the design of the included 11 cohort studies, which investigated effects prospectively, a approach that is considered to be more reliable than other methods. In contrast, in studies of of brain tumor, high consumption of fish showed a positive effect in the meta-analyses of both case-control and observational studies; however, the analyses also showed a negative effect for the cohort study design. Given these points, it is important to consider meta-analyses of both case-control and cohort studies when drawing conclusions.
Our results revealed that few studies on ω-3 intake showed high levels of evidence. Thus, it will be important not to overemphasize the claimed associations by clarifying the evidence. Most clinicians focus only on the overall P value to determine the significance of results. However, investigators should also consider the effect size, 95% CI, heterogeneity, publication bias, and funnel plot data (28, 29, 43). Using a method that follows the conventional criteria makes it possible to establish the level of evidence much more easily for multiple meta-analyses.
An umbrella review is a type of meta-analysis designed to provide a conclusive summary of reports highlighting the level of evidence (44). Since Ioannidis et al. first suggested the concept in 2009, an increasing number of umbrella reviews have been published (45). In single meta-analyses, statistical methods are frequently inadequate and misused (45), which can result in misleading outcomes, distortion, and bias. Recently, the practice of establishing the level of evidence has gained more importance to increase the value of the publication and provide an informative summary for decision makers in healthcare (44, 45).
Most of the meta-analyses investigated in the current study primarily presented their results with random- or fixed-effects sizes and 95% CIs with P values. However, to determine the noteworthiness of the results, it was important to conduct further analysis of between-study heterogeneity and small-study effects (30, 46).
Previously published meta-analyses mostly had a lack of information about publication bias, which made it difficult to assess the validity of the evidence synthesis (47). In our study, 19 of 57 meta-analyses did not mention the value for publication bias, which include 4 statistically significant results. This limitation explains the need to comprehensively interpret the meta-analyses using an umbrella review.
The public considers ω-3 fatty acids to be beneficial for health, a viewpoint that has led to the consumption of fish oil supplements. Reflecting this trend, much research has assessed the potential association of ω-3 fatty acids with health outcomes, with a special focus on disease reduction, an approach that has led to conflicting results. Nevertheless, no comprehensive study on ω-3 fatty acids has specifically studied levels of evidence. Moreover, most recent evidence from a randomized controlled trial highlighted findings indicating that supplementation with ω-3 fatty acids did not significantly lower the incidence of cancer, which supports our finding (11).
In addition, we compared our final results with those of the report from the Word Cancer Research Fund/American Institute for Cancer Research (WCRF/AICR). According to the latest report published from the Continuous Update Project (CUP) initiated by WCRF/AICR, high amounts of fish consumption were significantly associated with reduction of liver and colorectal cancer incidence, both graded as “limited–suggestive” evidence (48). However, in studies of other cancers, including head and neck, lung, stomach, pancreas, gallbladder, ovary, endometrium, prostate, kidney, bladder, and skin cancer, the authors draw conclusions with “limited–no conclusion” evidence. In our study, the results of meta-analyses assessing the risk of colorectal cancer were not significant; however, in the case of liver cancer, there was a positive association supported by a weak level of evidence. Putatively, ω-3 fatty acids have anti-inflammatory effects, which may lower risk for cancers, including liver and colorectal cancer (49, 50). Nevertheless, the level of evidence was still limited available studies, suggesting that further studies are needed to confirm these findings. The lack of strong evidence regarding HCC may also be partly explained by the multifactorial etiology of such tumor types. Indeed, relevant biological differences in responses to ω-3 fatty acid may exist in cases of viruses-related neoplasms compared with HCC associated with a particular environmental risk factor compared with others.
The mechanisms of the cancer preventive effect of ω-3 fatty acids remain to be elucidated. There has been evidence for their effect on the immune system. A large prospective cohort study has shown that marine ω-3 fatty acids are associated with lower risk of colorectal cancer containing higher numbers of FOXP3+ regulatory T cells (51), corroborated by in vitro experimental evidence for their stimulating effect on CD4+ T cells via suppressing regulatory T cells (51).
In fact, one of the possible reasons why there is only weak evidence for effects of ω-3 fatty acids on overall organ-specific cancer risk is the combining of biologically heterogeneous cancer subtypes into one entity, which has been done in a vast majority of epidemiological studies. When there is a causal association only with a specific cancer subtype, an effect size is always larger for the specific subtype than for overall cancer containing all subtypes (52, 53). Weak or no evidence for risks of overall organ-specific cancers does not exclude causal associations for specific cancer subtypes (52, 53).
There were some limitations in our study. First, we included studies from published meta-analyses and thus might have missed some individual studies if they were not identified with our predefined systematic search strategy. Second, we did not reanalyze all the data. Third, an original observational study could be cited in 2 or more meta-analyses. Even though 1 meta-analysis that has better quality should be selected for 1 cause–response association, and meta-analyses should be summarized in one-exposure, many-outcomes, or many-exposures, one-outcome associations in forest plots, small study numbers could not fully reflect these facts. Fourth, the degrees or definitions of high or low intakes may cross individual studies. Measurements defined in the meta-analyses varied across individual observational studies and consumption categories were not clear in some studies, which should lead to cautious interpretation. Finally, we only investigated the association of ω-3 intake on cancer risks. Further meta-research articles on levels or ratios of ω-3 fatty acid components or cancer mortality need to be explored in future studies.
Conclusion
In conclusion, although ω-3 fatty acids are commonly used as dietary supplements and many studies on ω-3 fatty acids have been published, there was no convincing evidence related to the effects of ω-3 fatty acids on cancer risk. Weak evidence supported the association between ω-3 fatty acids and breast cancer, HCC, prostate cancer, and brain tumor. From the results separating the study design, we found that there was a discrepancy in the association of ω-3 fatty acids with breast cancer and brain tumor. To draw a consistent outcome with a high level of evidence, further studies are needed to identify the actual effects of ω-3 fatty acids on cancer risks by using individual patient data meta-analyses. In addition, subgroup analyses according to various factors, as well as elimination of bias and errors in big data or original meta-analyses, are warranted.
ACKNOWLEDGEMENTS
The time effort of SO was in part supported by US National Institutes of Health grant R35 CA197735.
The authors’ responsibilities were as follows—HJS and JIS: study conceptualization; JIS: study methodology; EKC, HJS, KHL, HP, GK, and JIS: performed study validation; KHL, HP, GK, GHJ, and JYK: performed formal analysis; EKC, SHJ, and JIS: performed data curation; KHL, EKC, ME, AK, and JIS: prepared original draft of manuscript; KHL, HJS, GK, GHJ, HP, EJ, AK, ME, JYK, BS, MS, AK, SHH, ED, LFMdR, LJ, NK, HJvdV, EC, NV, ELG, GG, SO, MS, JR, SJJ, TT, SEJ, LS, LY, HO, EKC, JIS, and GG: reviewed and edited manuscript; and all authors: read and approved the final manuscript.
Notes
KHL, HJS, GK, GHJ, and JYK contributed equally to this work.
The authors report no funding received for this study.
Author Disclosures: The authors report no conflicts of interest. BS is supported by a Clinical Lectureship (ICA-CL-2017-03-001) jointly funded by Health Education England (HEE) and the National Institute for Health Research (NIHR); is in part funded by the NIHR Biomedical Research Centre at South London and Maudsley NHS Foundation Trust; and is also supported by the Maudsley Charity, King's College London, and the NIHR South London Collaboration for Leadership in Applied Health Research and Care (CLAHRC) funding. The time effort of SO was in part supported by US National Institutes of Health grant R35 CA197735. This paper presents independent research. The views expressed in this publication are those of the authors and not necessarily those of the acknowledged institutions. Supplemental Table 1 is available from the “Supplementary data” link in the online posting of the article and from the same link in the online table of contents at https://academic.oup.com/advances.
Abbreviation used: ALA, α-linolenic acid; AMSTAR2, A Measurement Tool to Assess Systematic Reviews 2; CUP, Continuous Update Project; DPA, docosapentaenoic acid; GRADE, Grading of Recommendations Assessment, Development and Evaluation; HCC, hepatocellular carcinoma; NA, not assessable; PI, prediction interval; PRISMA, Preferred Reporting Items for Systematic Reviews and Meta-Analyses; WCRF/AICR, Word Cancer Research Fund/American Institute for Cancer Research.
References
- 1. Bradberry JC, Hilleman DE. Overview of omega-3 fatty acid therapies. P T. 2013;38(11):681–91. [PMC free article] [PubMed] [Google Scholar]
- 2. Nettleton JA. Omega-3 fatty acids: comparison of plant and seafood sources in human nutrition. J Am Diet Assoc. 1991;91(3):331–7. [PubMed] [Google Scholar]
- 3. Tur JA, Bibiloni MM, Sureda A, Pons A. Dietary sources of omega 3 fatty acids: public health risks and benefits. Br J Nutr. 2012;107(Suppl 2):S23–52. [DOI] [PubMed] [Google Scholar]
- 4. Kris-Etherton PM, Harris WS, Appel LJ, Association AHANCAH . Omega-3 fatty acids and cardiovascular disease: new recommendations from the American Heart Association. Arterioscler Thromb Vasc Biol. 2003;23(2):151–2. [DOI] [PubMed] [Google Scholar]
- 5. Surette ME. The science behind dietary omega-3 fatty acids. Can Med Assoc J. 2008;178(2):177–80. [DOI] [PMC free article] [PubMed] [Google Scholar]
- 6. Lazzarin N, Vaquero E, Exacoustos C, Bertonotti E, Romanini ME, Arduini D. Low-dose aspirin and omega-3 fatty acids improve uterine artery blood flow velocity in women with recurrent miscarriage due to impaired uterine perfusion. Fertil Steril. 2009;92(1):296–300. [DOI] [PubMed] [Google Scholar]
- 7. Krauss-Etschmann S, Shadid R, Campoy C, Hoster E, Demmelmair H, Jimenez M, Gil A, Rivero M, Veszpremi B, Decsi T et al.. Effects of fish-oil and folate supplementation of pregnant women on maternal and fetal plasma concentrations of docosahexaenoic acid and eicosapentaenoic acid: a European randomized multicenter trial. Am J Clin Nutr. 2007;85(5):1392–400. [DOI] [PubMed] [Google Scholar]
- 8. Serhan CN, Chiang N, Van Dyke TE. Resolving inflammation: dual anti-inflammatory and pro-resolution lipid mediators. Nat Rev Immunol. 2008;8(5):349–61. [DOI] [PMC free article] [PubMed] [Google Scholar]
- 9. Calder PC. Omega-3 fatty acids and inflammatory processes. Nutrients. 2010;2(3):355–74. [DOI] [PMC free article] [PubMed] [Google Scholar]
- 10. Zheng J-S, Hu XJ, Zhao YM, Yang J, Li D. Intake of fish and marine n-3 polyunsaturated fatty acids and risk of breast cancer: meta-analysis of data from 21 independent prospective cohort studies. BMJ. 2013;346:f3706. [DOI] [PubMed] [Google Scholar]
- 11. Manson JE, Cook NR, Lee IM, Christen W, Bassuk SS, Mora S, Gibson H, Albert CM, Gordon D, Copeland T et al.. Marine n-3 fatty acids and prevention of cardiovascular disease and cancer. N Engl J Med. 2019;380(1):23–32. [DOI] [PMC free article] [PubMed] [Google Scholar]
- 12. Poole R, Kennedy OJ, Roderick P, Fallowfield JA, Hayes PC, Parkes J. Coffee consumption and health: umbrella review of meta-analyses of multiple health outcomes. BMJ. 2017;359:j5024. [DOI] [PMC free article] [PubMed] [Google Scholar]
- 13. Khan SU, Khan MU, Riaz H, Valavoor S, Zhao D, Vaughan L, Okunrintemi V, Riaz IB, Khan MS, Kaluski E et al.. Effects of nutritional supplements and dietary interventions on cardiovascular outcomes: an umbrella review and evidence map. Ann Intern Med. 2019;171(3):190–8. [DOI] [PMC free article] [PubMed] [Google Scholar]
- 14. Tsilidis KK, Kasimis JC, Lopez DS, Ntzani EE, Ioannidis JP. Type 2 diabetes and cancer: umbrella review of meta-analyses of observational studies. BMJ. 2015;350:g7607. [DOI] [PubMed] [Google Scholar]
- 15. Fusar-Poli P, Radua J. Ten simple rules for conducting umbrella reviews. Evid Based Ment Health. 2018;21(3):95–100. [DOI] [PMC free article] [PubMed] [Google Scholar]
- 16. Moher D, Liberati A, Tetzlaff J, Altman DG, Group P. Preferred reporting items for systematic reviews and meta-analyses: the PRISMA statement. Ann Intern Med. 2009;151(4):264–9, W64. [DOI] [PubMed] [Google Scholar]
- 17. Shea BJ, Reeves BC, Wells G, Thuku M, Hamel C, Moran J, Moher D, Tugwell P, Welch V, Kristjansson E et al.. AMSTAR 2: a critical appraisal tool for systematic reviews that include randomised or non-randomised studies of healthcare interventions, or both. BMJ. 2017;358:j4008. [DOI] [PMC free article] [PubMed] [Google Scholar]
- 18. Wu S, Liang J, Zhang L, Zhu X, Liu X, Miao D. Fish consumption and the risk of gastric cancer: systematic review and meta-analysis. BMC Cancer. 2011;11:26. [DOI] [PMC free article] [PubMed] [Google Scholar]
- 19. Shen X-J, Zhou JD, Dong JY, Ding WQ, Wu JC. Dietary intake of n-3 fatty acids and colorectal cancer risk: a meta-analysis of data from 489 000 individuals. Br J Nutr. 2012;108(9):1550–6. [DOI] [PubMed] [Google Scholar]
- 20. Chen G-C, Qin LQ, Lu DB, Han TM, Zheng Y, Xu GZ, Wang XH. N-3 polyunsaturated fatty acids intake and risk of colorectal cancer: meta-analysis of prospective studies. Cancer Causes Control. 2015;26(1):133–41. [DOI] [PubMed] [Google Scholar]
- 21. Geelen A, Schouten JM, Kamphuis C, Stam BE, Burema J, Renkema JM, Bakker EJ, van't Veer P, Kampman E. Fish consumption, n-3 fatty acids, and colorectal cancer: a meta-analysis of prospective cohort studies. Am J Epidemiol. 2007;166(10):1116–25. [DOI] [PubMed] [Google Scholar]
- 22. Huang R-X, Duan YY, Hu JA. Fish intake and risk of liver cancer: a meta-analysis. PLoS One. 2015;10(1):e0096102. [DOI] [PMC free article] [PubMed] [Google Scholar]
- 23. Gao M, Sun K, Guo M, Gao H, Liu K, Yang C, Li S, Liu N. Fish consumption and n-3 polyunsaturated fatty acids, and risk of hepatocellular carcinoma: systematic review and meta-analysis. Cancer Causes Control. 2015;26(3):367–76. [DOI] [PubMed] [Google Scholar]
- 24. Higgins JP, Thompson SG, Spiegelhalter DJ. A re-evaluation of random-effects meta-analysis. J R Stat Soc Ser A Stat Soc. 2009;172(1):137–59. [DOI] [PMC free article] [PubMed] [Google Scholar]
- 25. Graham PL, Moran JL. Robust meta-analytic conclusions mandate the provision of prediction intervals in meta-analysis summaries. J Clin Epidemiol. 2012;65(5):503–10. [DOI] [PubMed] [Google Scholar]
- 26. Higgins JP. Commentary: heterogeneity in meta-analysis should be expected and appropriately quantified. Int J Epidemiol. 2008;37(5):1158–60. [DOI] [PubMed] [Google Scholar]
- 27. Cochran WG. The combination of estimates from different experiments. Biometrics. 1954;10(1):101–29. [Google Scholar]
- 28. Ioannidis JP, Patsopoulos NA, Evangelou E. Uncertainty in heterogeneity estimates in meta-analyses. BMJ. 2007;335(7626):914–6. [DOI] [PMC free article] [PubMed] [Google Scholar]
- 29. Sterne JA, Sutton AJ, Ioannidis JP, Terrin N, Jones DR, Lau J, Carpenter J, Rucker G, Harbord RM, Schmid CH et al.. Recommendations for examining and interpreting funnel plot asymmetry in meta-analyses of randomised controlled trials. BMJ. 2011;343:d4002. [DOI] [PubMed] [Google Scholar]
- 30. Egger M, Davey Smith G, Schneider M, Minder C. Bias in meta-analysis detected by a simple, graphical test. BMJ. 1997;315(7109):629–34. [DOI] [PMC free article] [PubMed] [Google Scholar]
- 31. Ioannidis JP, Trikalinos TA. An exploratory test for an excess of significant findings. Clin Trials. 2007;4(3):245–53. [DOI] [PubMed] [Google Scholar]
- 32. Hailes HP, Yu R, Danese A, Fazel S. Long-term outcomes of childhood sexual abuse: an umbrella review. Lancet Psychiatry. 2019;6(10):830–9. [DOI] [PMC free article] [PubMed] [Google Scholar]
- 33. Guyatt GH, Oxman AD, Vist GE, Kunz R, Falck-Ytter Y, Alonso-Coello P, Schunemann HJ, Group GW. GRADE: an emerging consensus on rating quality of evidence and strength of recommendations. BMJ. 2008;336(7650):924–6. [DOI] [PMC free article] [PubMed] [Google Scholar]
- 34. Choi EK, Park HB, Lee KH, Park JH, Eisenhut M, van der Vliet HJ, Kim G, Shin JI. Body mass index and 20 specific cancers: re-analyses of dose-response meta-analyses of observational studies. Ann Oncol. 2018;29(3):749–57. [DOI] [PubMed] [Google Scholar]
- 35. Alexander DD, Bassett JK, Weed DL, Barrett EC, Watson H, Harris W. Meta-analysis of long-chain omega-3 polyunsaturated fatty acids (LComega-3PUFA) and prostate cancer. Nutr Cancer. 2015;67(4):543–54. [DOI] [PMC free article] [PubMed] [Google Scholar]
- 36. Chua ME, Sio MC, Sorongon MC, Dy JS. Relationship of dietary intake of omega-3 and omega-6 fatty acids with risk of prostate cancer development: a meta-analysis of prospective studies and review of literature. Prostate Cancer. 2012;2012:826254. [DOI] [PMC free article] [PubMed] [Google Scholar]
- 37. Fu YQ, Zheng JS, Yang B, Li D. Effect of individual omega-3 fatty acids on the risk of prostate cancer: a systematic review and dose-response meta-analysis of prospective cohort studies. J Epidemiol. 2015;25(4):261–74. [DOI] [PMC free article] [PubMed] [Google Scholar]
- 38. Hoang T, Myung SK, Pham TT. Dietary intake of omega-3 fatty acids and endocrine-related gynecological cancer: a meta-analysis of observational studies. Cancer Res Treat. 2019;51(3):1022–32. [DOI] [PMC free article] [PubMed] [Google Scholar] [Retracted]
- 39. Lian W, Wang R, Xing B, Yao Y. Fish intake and the risk of brain tumor: a meta-analysis with systematic review. Nutr J. 2017;16(1):1. [DOI] [PMC free article] [PubMed] [Google Scholar]
- 40. Noel SE, Stoneham AC, Olsen CM, Rhodes LE, Green AC. Consumption of omega-3 fatty acids and the risk of skin cancers: a systematic review and meta-analysis. Int J Cancer. 2014;135(1):149–56. [DOI] [PubMed] [Google Scholar]
- 41. Szymanski KM, Wheeler DC, Mucci LA. Fish consumption and prostate cancer risk: a review and meta-analysis. Am J Clin Nutr. 2010;92(5):1223–33. [DOI] [PubMed] [Google Scholar]
- 42. Zhang Y-F, Lu J, Yu FF, Gao HF, Zhou YH. Polyunsaturated fatty acid intake and risk of lung cancer: a meta-analysis of prospective studies. PLoS One. 2014;9(6):e99637. [DOI] [PMC free article] [PubMed] [Google Scholar]
- 43. Lau J, Ioannidis JP, Terrin N, Schmid CH, Olkin I. The case of the misleading funnel plot. BMJ. 2006;333(7568):597–600. [DOI] [PMC free article] [PubMed] [Google Scholar]
- 44. Aromataris E, Fernandez R, Godfrey CM, Holly C, Khalil H, Tungpunkom P. Summarizing systematic reviews: methodological development, conduct and reporting of an umbrella review approach. Int J Evid Based Healthc. 2015;13(3):132–40. [DOI] [PubMed] [Google Scholar]
- 45. Ioannidis JP. Integration of evidence from multiple meta-analyses: a primer on umbrella reviews, treatment networks and multiple treatments meta-analyses. CMAJ Can Med Assoc J. 2009;181(8):488–93. [DOI] [PMC free article] [PubMed] [Google Scholar]
- 46. Belbasis L, Bellou V, Evangelou E, Ioannidis JP, Tzoulaki I. Environmental risk factors and multiple sclerosis: an umbrella review of systematic reviews and meta-analyses. Lancet Neurol. 2015;14(3):263–73. [DOI] [PubMed] [Google Scholar]
- 47. Herrmann D, Sinnett P, Holmes J, Khan S, Koller C, Vassar M. Statistical controversies in clinical research: publication bias evaluations are not routinely conducted in clinical oncology systematic reviews. Ann Oncol. 2017;28(5):931–7. [DOI] [PubMed] [Google Scholar]
- 48. WCRF/AICR. Continuous Update Project Report. Meat, fish and dairy products and the risk of cancer. Washington (DC): World Cancer Research Fund/American Institute for Cancer Research; 2018. [Google Scholar]
- 49. Cockbain AJ, Toogood GJ, Hull MA. Omega-3 polyunsaturated fatty acids for the treatment and prevention of colorectal cancer. Gut. 2012;61(1):135–49. [DOI] [PubMed] [Google Scholar]
- 50. Larsson SC, Kumlin M, Ingelman-Sundberg M, Wolk A. Dietary long-chain n-3 fatty acids for the prevention of cancer: a review of potential mechanisms. Am J Clin Nutr. 2004;79(6):935–45. [DOI] [PubMed] [Google Scholar]
- 51. Song M, Nishihara R, Cao Y, Chun E, Qian ZR, Mima K, Inamura K, Masugi Y, Nowak JA, Nosho K et al.. Marine omega-3 polyunsaturated fatty acid intake and risk of colorectal cancer characterized by tumor-infiltrating T cells. JAMA Oncol. 2016;2(9):1197–206. [DOI] [PMC free article] [PubMed] [Google Scholar]
- 52. Ogino S, Chan AT, Fuchs CS, Giovannucci E. Molecular pathological epidemiology of colorectal neoplasia: an emerging transdisciplinary and interdisciplinary field. Gut. 2011;60(3):397–411. [DOI] [PMC free article] [PubMed] [Google Scholar]
- 53. Ogino S, Nishihara R, VanderWeele TJ, Wang M, Nishi A, Lochhead P, Qian ZR, Zhang X, Wu K, Nan H et al.. Review article: the role of molecular pathological epidemiology in the study of neoplastic and non-neoplastic diseases in the era of precision medicine. Epidemiology. 2016;27(4):602–11. [DOI] [PMC free article] [PubMed] [Google Scholar]