

SUMMARY
Alcohol use is associated with increased risk of developing tuberculosis (TB) disease, yet the impact of alcohol use on TB treatment outcomes has not been summarized. We aimed to quantitatively review evidence of the relationship between alcohol use and poor TB treatment outcomes. We conducted a systematic review of PubMed, EMBASE, and Web of Science (January 1980–May 2018). We categorized studies as having a high- or low-quality alcohol use definition and examined poor treatment outcomes individually and as two aggregated definitions (i.e., including or excluding loss to follow-up [LTFU]). We analyzed drug-susceptible (DS-) and multidrug-resistant (MDR-) TB studies separately. Our systematic review yielded 111 studies reporting alcohol use as a predictor of DS- and MDR-TB treatment outcomes. Alcohol use was associated with increased odds of poor treatment outcomes (i.e., death, treatment failure, and LTFU) in DS (OR 1.99, 95% CI 1.57–2.51) and MDR-TB studies (OR 2.00, 95% CI 1.73–2.32). This association persisted for aggregated poor treatment outcomes excluding LTFU, each individual poor outcome, and across sub-group and sensitivity analyses. Only 19% of studies used high-quality alcohol definitions. Alcohol use significantly increased the risk of poor treatment outcomes in both DS- and MDR-TB patients. This study highlights the need for improved assessment of alcohol use in TB outcomes research and potentially modified treatment guidelines for TB patients who consume alcohol.
Keywords: alcohol use disorder, multidrug-resistant TB, drug-susceptible TB, risk factors
In 2017, an estimated 10 million individuals developed tuberculosis (TB) disease, with 1.6 million resultant deaths, more than from disease caused by any other pathogen.1 Alcohol use has been identified as a major risk factor for both developing TB disease and having worse outcomes;1–4 10–20% of all TB deaths worldwide have been attributed to alcohol use.2,5 The 2017 World Health Organization (WHO) Sustainable Development Goals (SDG) for TB highlight the prevention and treatment of alcohol use disorders (AUDs), defined in the Diagnostic and Statistical Manual of Mental Disorders, Fifth Edition (DSM-5) as including alcohol abuse and dependence,6 as key to decreasing global TB incidence and deaths.1 Neither the magnitude of the impact of alcohol use on TB treatment response nor the drivers of the association have been systematically quantified, a critical first step in informing novel approaches to improving TB outcomes.
Heavy alcohol use or AUD prevalence among TB patients worldwide ranges from 15% to 70%.7–11 Those who use alcohol may have worse TB treatment outcomes due to behavioral mechanisms, including worse medication adherence and greater loss to follow-up (LTFU),12–14 or biologic mechanisms, including the impact of alcohol on innate and adaptive immune responses,15 lung function and barrier protection,16 hepatotoxicity,17 and TB and human immunodeficiency virus (HIV) drug absorption and metabolism.18
In this systematic review and meta-analysis, we aimed to quantify the strength of the association between alcohol use and drug-susceptible TB (DS-TB) and multidrug-resistant TB (MDR-TB) treatment outcomes, including whether the association persists beyond LTFU, and to identify gaps in knowledge. DS- and MDR-TB studies were analyzed separately, given their distinctly different treatment regimens and risk factors for poor outcomes.
METHODS
We conducted this study according to the Preferred Reporting Items for Systematic Reviews and Meta-Analyses (PRISMA) (Supplementary Table S1).19 Ethical approval was not required for the study.
Data sources and searches
We searched PubMed, EMBASE, and Web of Science from January 1980 to May 2018 for articles and abstracts evaluating risk factors for TB treatment outcomes (Supplementary Table S2). We also searched references of identified review articles for studies meeting our criteria.
Study review and selection
Studies written in English, Spanish, French, Portuguese, Russian, Mandarin, Italian, Dutch, and Korean were included. We resolved discrepancies by discussion and consensus, and third party arbitration if needed. Two individuals independently reviewed titles and abstracts of articles for inclusion. Articles were included if they were peer-reviewed, reported participants receiving standard treatment regimens for TB disease, and described factors associated with TB treatment outcomes comparable to WHO definitions (Supplementary Table S3). Studies were excluded if they reported three or fewer patients, were reviews or commentaries, reported an exclusively pediatric population (<16 years of age), or reported treatment prior to 1980. For our analyses, the alcohol exposure group was considered the highest level of exposure reported by the authors (e.g., the highest volume of consumption or highest AUD risk), while the reference group was the lowest level of exposure (which mostly referred to no alcohol consumption, but could also include low levels of consumption). If a study reported more than two alcohol exposure levels, participants from the intermediate levels were excluded. Due to between-study variations in how alcohol use was assessed, we refer to exposure as ‘alcohol use,’ recognizing that severity varies.
For studies identified through title and abstract review, two reviewers conducted a full-text review of all articles that mentioned alcohol terms. Reviewers documented on a coding sheet the primary reason for exclusion using the criteria listed above, with additional exclusion of studies that did not stratify treatment outcome by alcohol use or did not report either count data or effect measure estimates.
Data extraction
For each included study, two investigators independently extracted variables of interest (Supplementary Table S4). For papers presenting data on more than one distinct cohort, we treated each cohort as a distinct “study,” adding ‘a’ or ‘b’ to the assigned study ID.
Data analysis
MDR-TB was defined as resistance to at least isoniazid and rifampin. If >20% of participants had MDR-TB, we classified it as an MDR-TB study. Separate analyses were performed for each of the following outcomes: 1) poor outcome A (i.e., death, treatment failure, and LTFU) compared to cure and treatment completion; 2) poor outcome B (i.e., death or treatment failure) compared to cure and treatment completion; 3) death compared to treatment failure, LTFU, cure, and treatment completion; 4) treatment failure compared to death, LTFU, cure and treatment completion; and, 5) LTFU compared to death, treatment failure, cure and treatment completion. We excluded participants who transferred out. We performed sensitivity analyses where LTFU was added to the reference group of poor outcome B and the other poor outcomes were compared only to cure and treatment completion.
The study sample was the number of individuals with alcohol use information reported in the authors’ final analysis. We used study counts to calculate unadjusted odds ratios (ORs) and 95% confidence intervals (CIs) for each outcome. For studies that reported adjusted effect measures or did not provide counts, we used the authors’ reported effect measure estimates and 95% CIs. We considered adjusted effect measures adequate if the model included age and sex. Overall study quality was assessed by looking at the case, exposure, and outcome definitions. All included studies used standard definitions for TB disease and treatment outcomes. We also assessed study strategy for documenting alcohol use. Assessment of alcohol use was determined to be higher-quality if a validated screening instrument was used, or alcohol use was well categorized by quantity and/or frequency of drinking.
We assessed heterogeneity of effect estimates using the Cochran Q test for heterogeneity and calculating the I2 statistic.20,21 We computed summary estimates for both the unadjusted and adjusted effect estimates using the random-effects model and weighting method according to the maximum likelihood method described by Normand.22 Studies that were highly influential or contributed greatly to the estimate of heterogeneity were identified using Baujat et al.’s graphical method.23 We conducted sensitivity analyses by recalculating combined effect sizes after removing these studies. We assessed publication bias using the Egger test,24 and visually reviewed funnel plots of the effect estimate logarithms against the standard errors for asymmetry.24
We conducted sub-group and meta-regression analyses to identify additional sources of heterogeneity, assess the impact of study quality on the summary estimates, and look for effect modification. We performed individual random-effects meta-regression analyses, restricting analyses to sub-groups with a minimum of five studies. Background TB incidence was determined by WHO classifications of high-burden (HBC) or not high-burden countries (not HBC), differentiated by overall TB and MDR-TB burden.1 Country income was based on the World Bank’s 2019 fiscal year classifications.25
Statistical procedures were performed using SAS v9.4 (SAS Institute, Cary, NC, USA) and R v3.5.1 (R Computing, Vienna, Austria).
RESULTS
We identified 3,038 citations for title and abstract review; 1,102 met criteria for full review (Figure 1). We excluded 35 citations in languages for which we lacked fluent reviewers and one whose full text was not available. Nine hundred and fifty-eight papers were excluded upon full-text review. We contacted the authors of 10 studies and obtained clarification from three. We ultimately included 80 studies on DS-TB and 31 studies on MDR-TB (Figure 1). The included studies were in English (n = 105), Spanish (n = 3), French (n = 2), and Portuguese (n = 1). The studies included 81 cohort, 29 case-control, and one randomized controlled trial.
Figure 1.
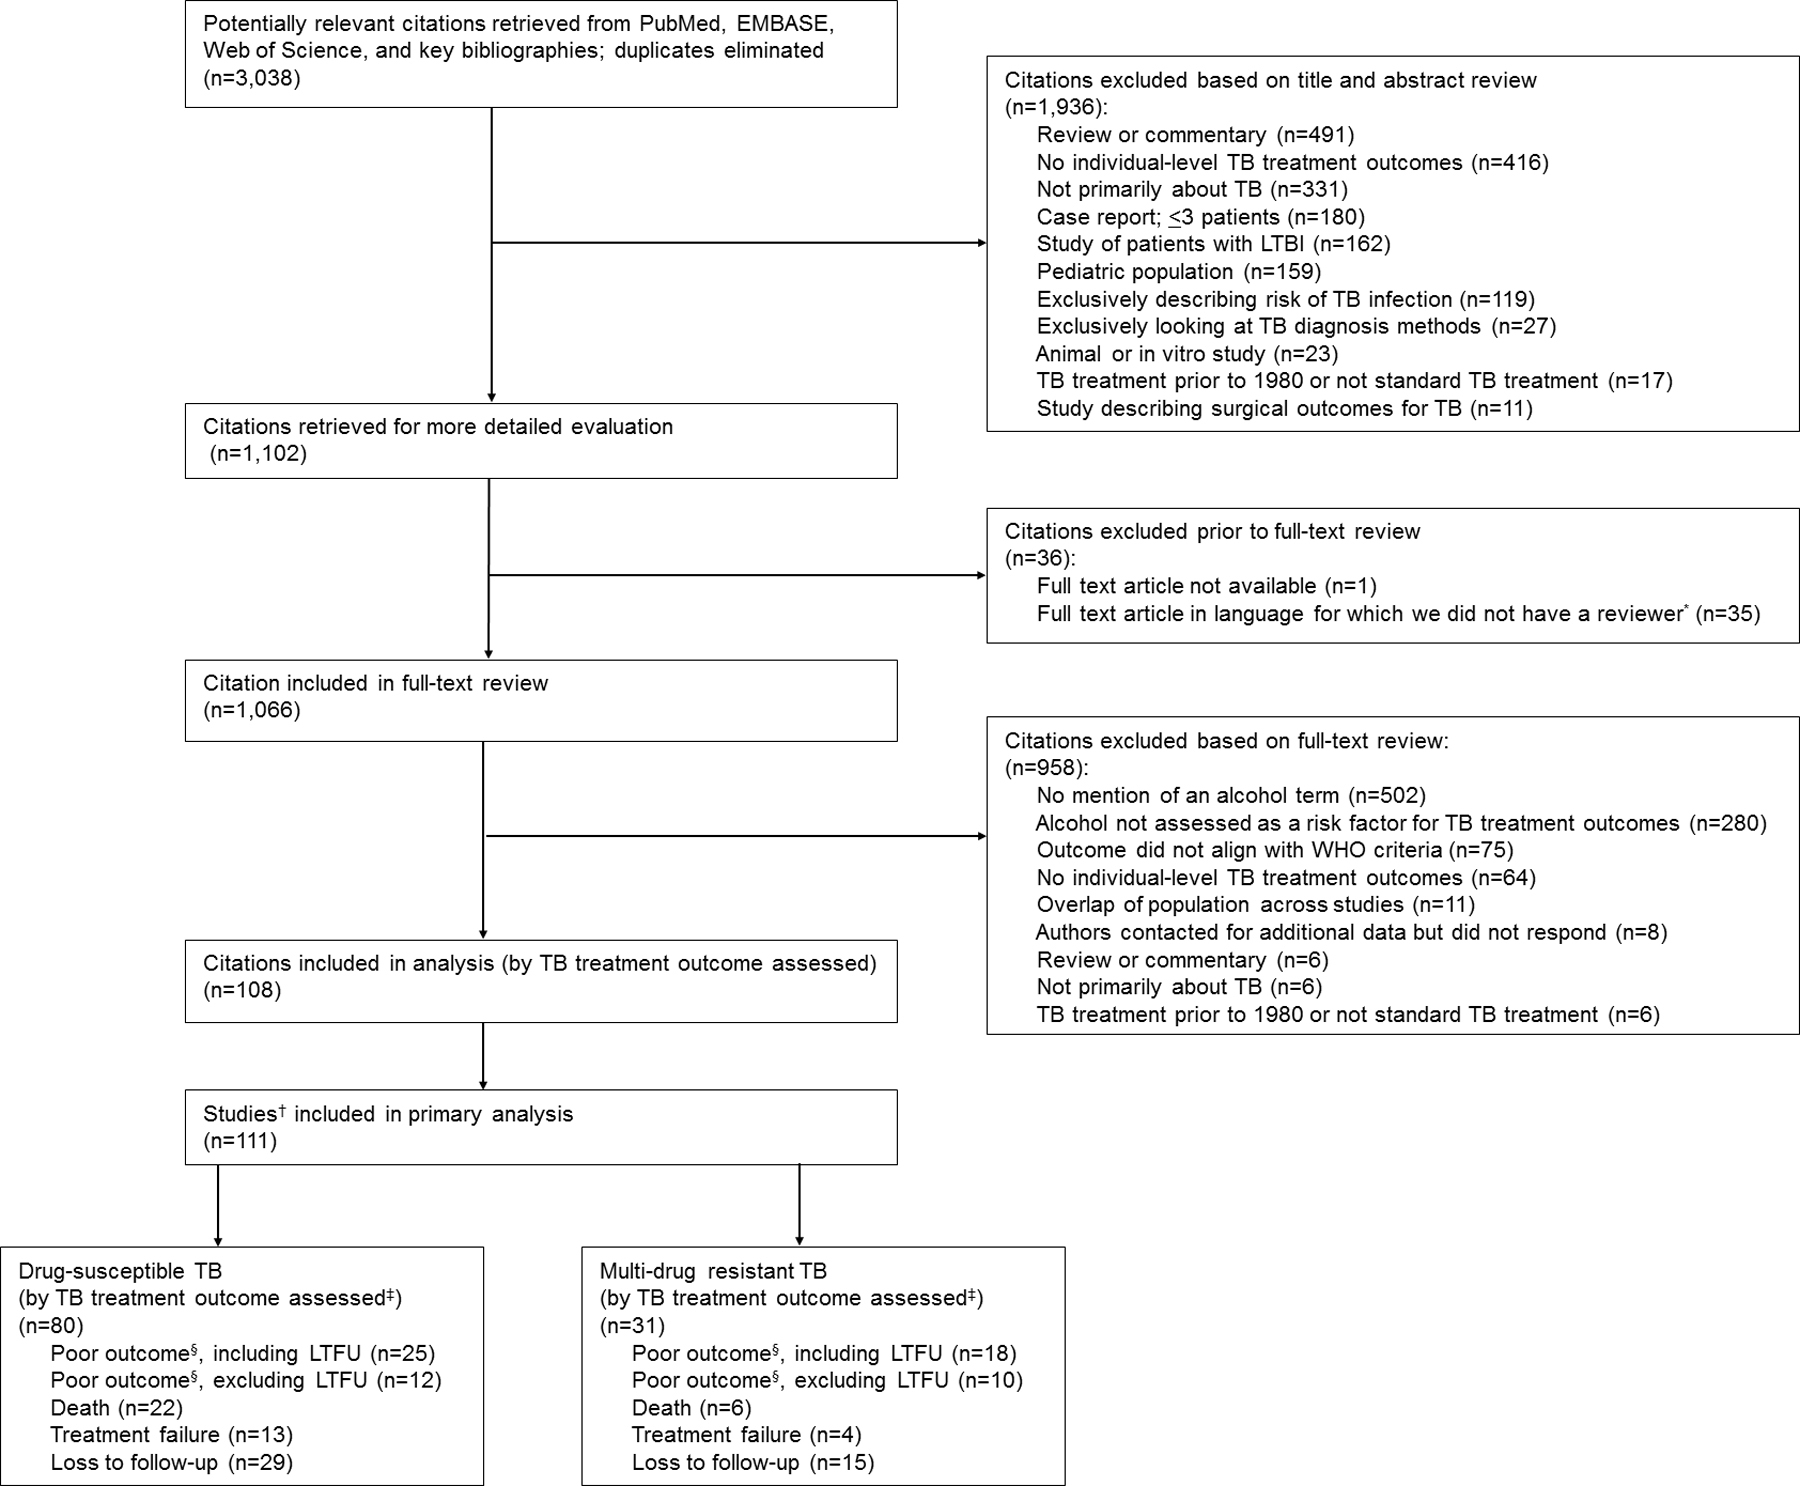
PRISMA flow chart of studies included in the meta-analysis. *Japanese (n = 21), German (n = 8), Polish (n = 5), and Hungarian (n = 1). †Three citations were split due to reporting on two unique cohorts, therefore were treated as two studies each. ‡List not mutually exclusive as many studies report more than one outcome. §Death or treatment failure. TB = tuberculosis; LTBI = latent tuberculosis infection; WHO = World Health Organization; LTFU = loss to follow-up; PRISMA = Preferred Reporting Items for Systematic Reviews and Meta-Analyses.
Quality of alcohol measurement
Off the 111 studies included, four used a validated screening method for alcohol exposure (i.e., CAGE Alcohol Questionnaire). One study used DSM-5 definitions, two reported the volume consumed, and 12 reported consumption frequency (Supplementary Tables S5 and S6). The remaining (n = 90, 81%) used a lower-quality alcohol exposure variable: 58 (52%) relied on medical chart extraction, 28 (25%) on questionnaire/interview self-report, and 21 (19%) lacked detail on how alcohol use was assessed.
Poor outcome A (including loss to follow-up)
Among DS-TB studies, patients who consumed alcohol had significantly higher odds of poor outcome A (i.e., death, treatment failure, and LTFU) than the reference alcohol group (i.e., no or low alcohol use) (n = 25; OR 1.99, 95% CI 1.57–2.51; Figure 2A, Table 1). The finding was similar for MDR-TB studies (n = 18; OR 2.00, 95% CI 1.73–2.32; Figure 2A, Table 1). Sub-group analyses among DS-TB studies that used a high-quality definition for alcohol use revealed an increase in the association between alcohol use and poor outcome A (n = 4; OR 3.05, 95% CI 1.58–5.89). All sub-group analyses for poor outcome A among both DS-TB and MDR-TB studies retained a significant association with alcohol use, except DS-TB studies of pulmonary TB patients (n = 3; OR 2.02; 95% CI 0.92–4.45) and MDR-TB studies reporting an adjusted measure of association (n = 5; OR 1.48, 95% CI 0.84–2.61), both of which contained a small number of studies in each analysis (Table 2).
Figure 2.
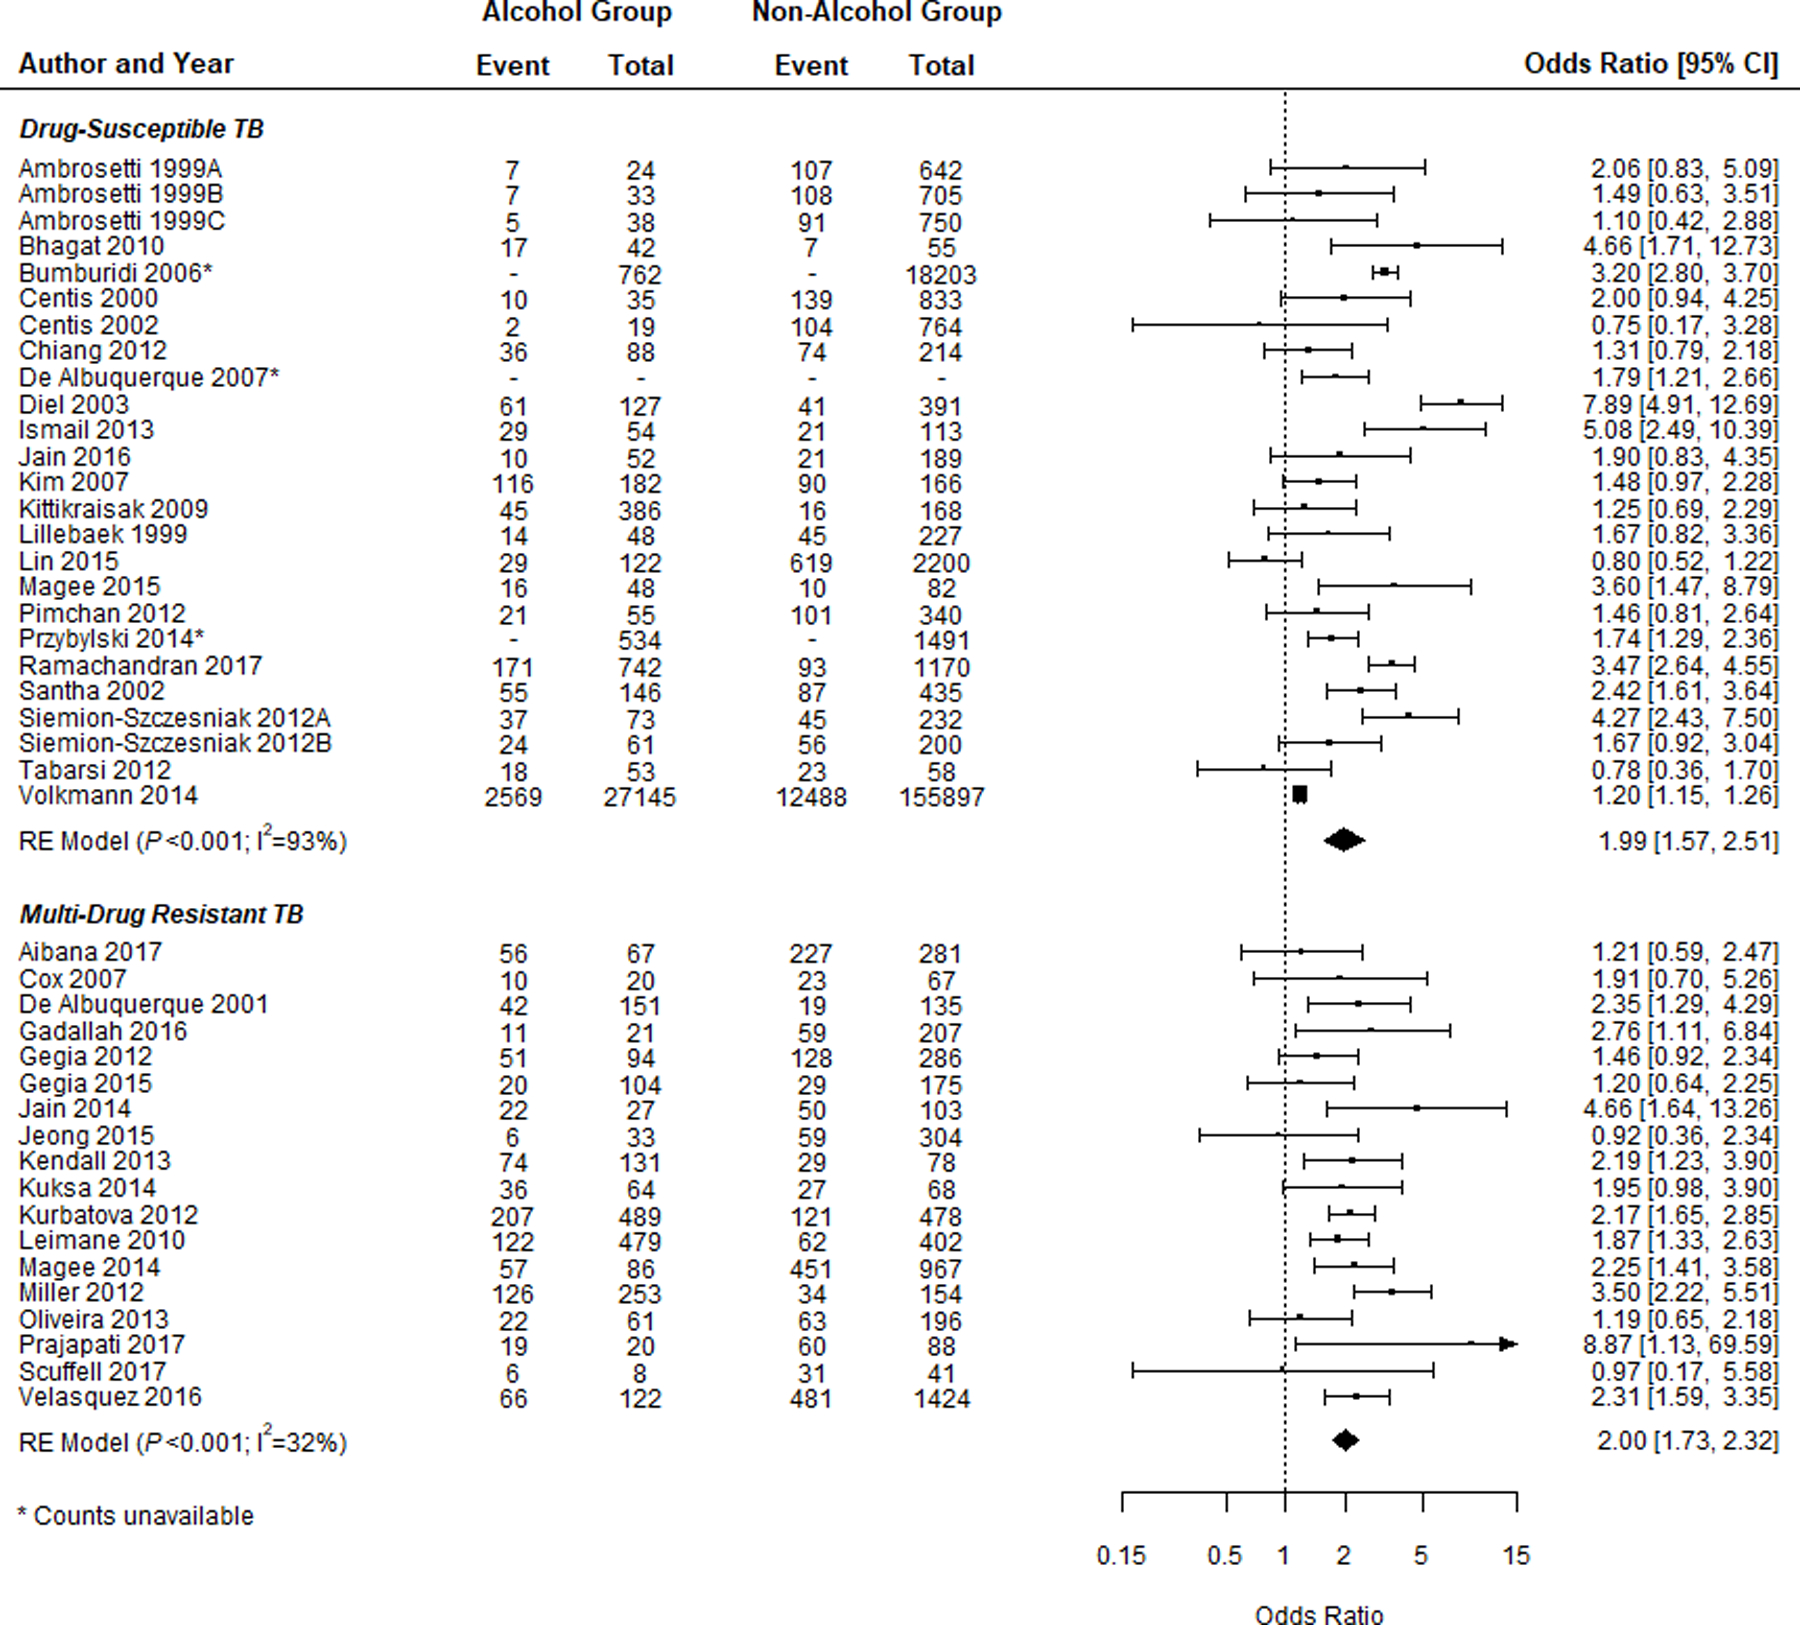
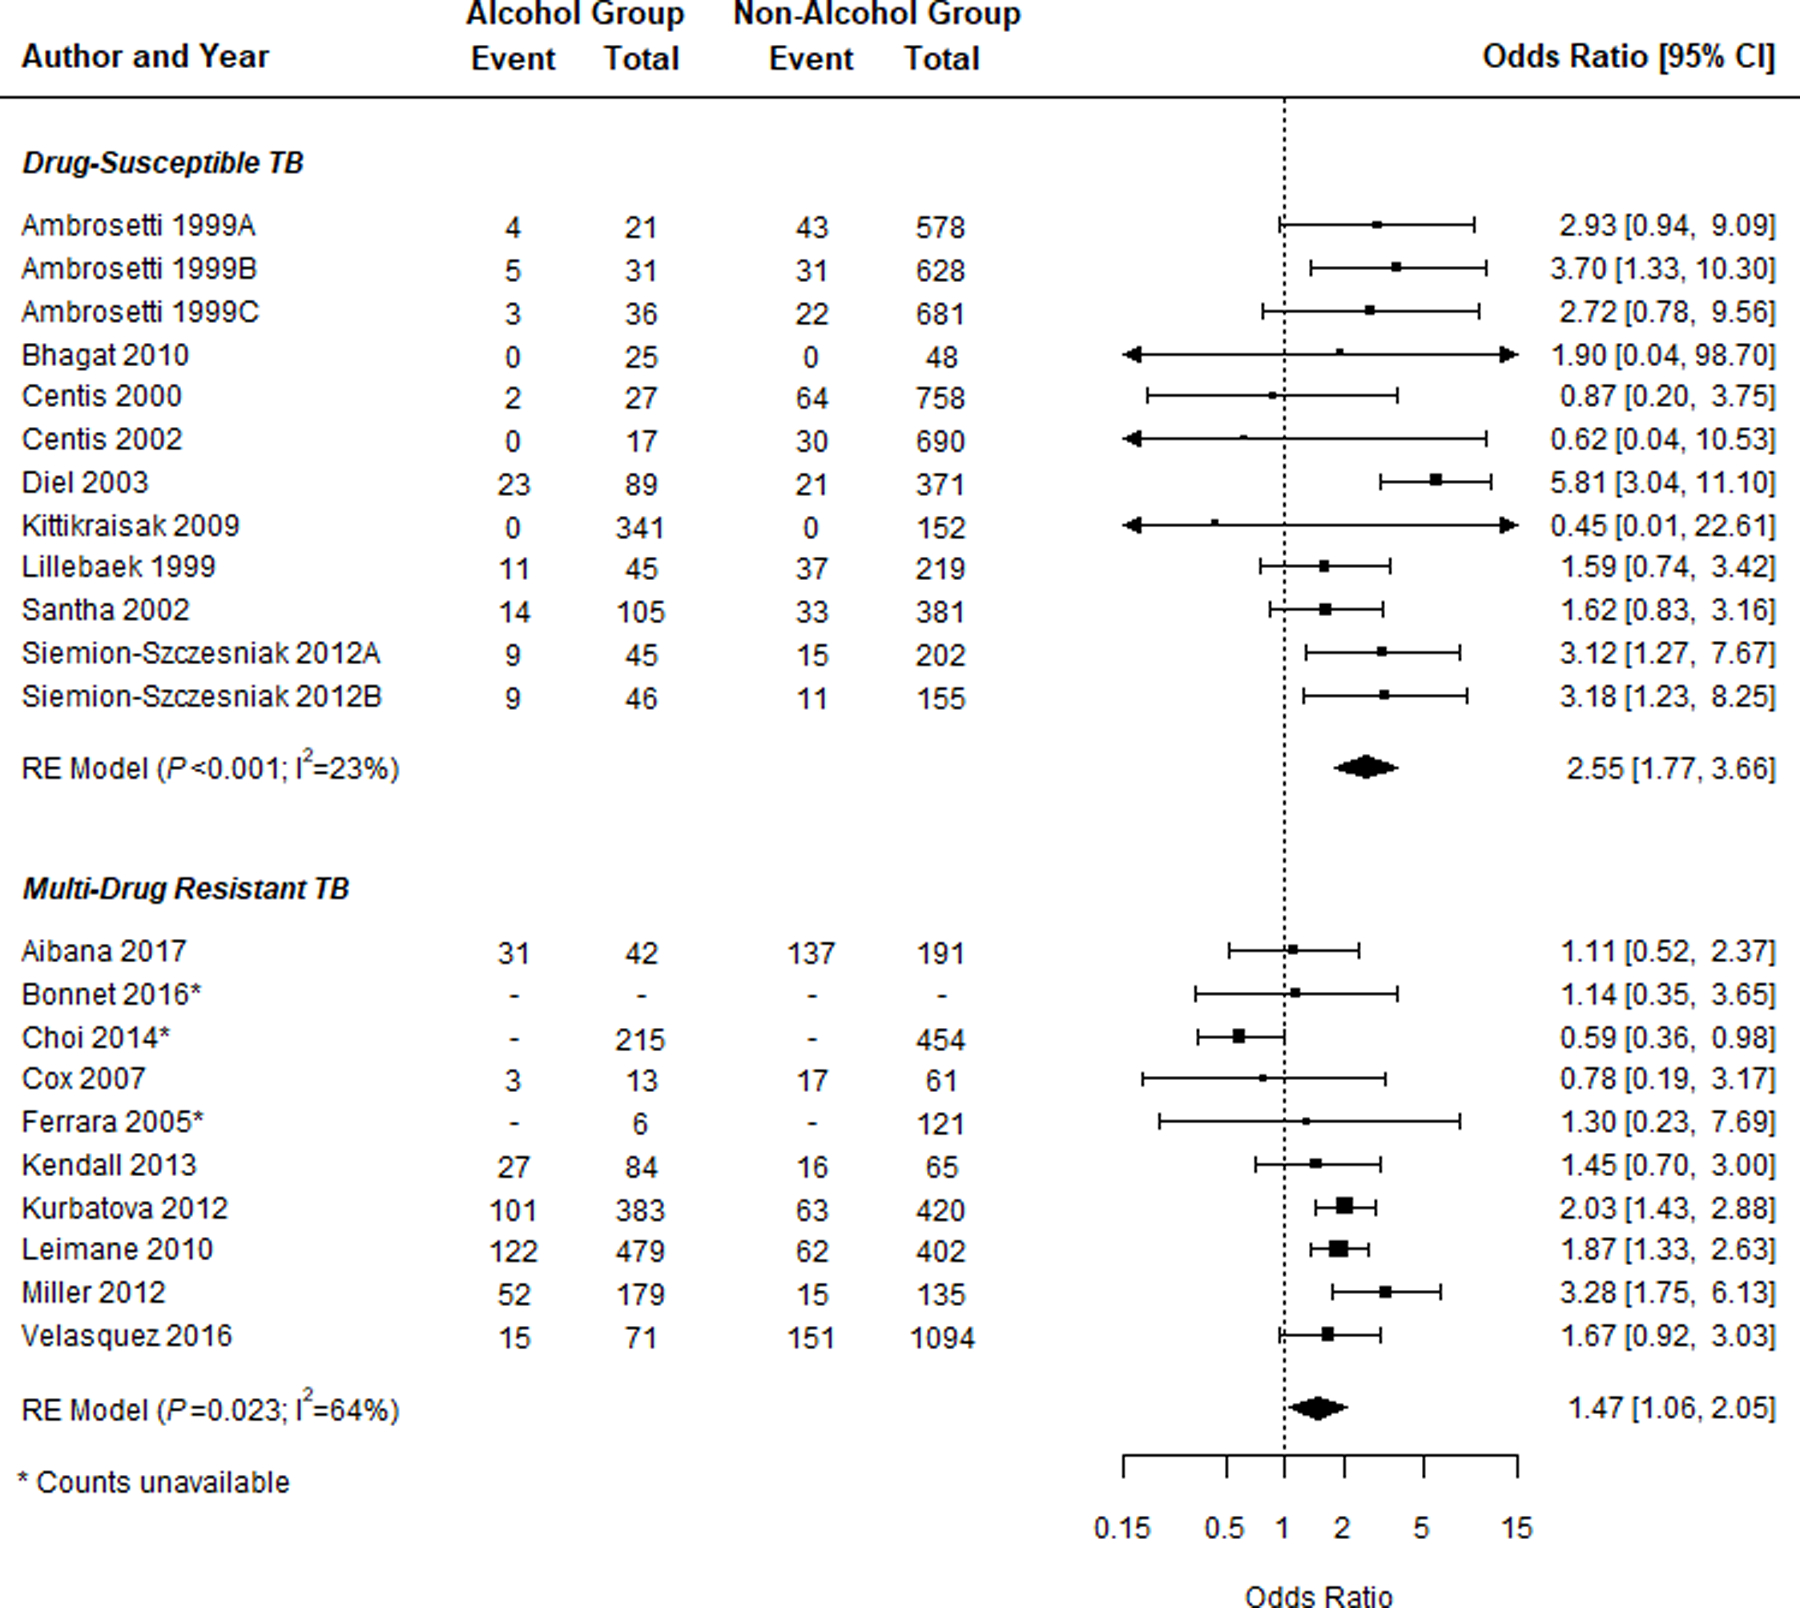
A) Forest plots of the association between alcohol use and Poor Outcome A (i.e., death, failure, and LTFU) for both DS-TB and MDR-TB studies and the breakdown of participants with poor outcome by exposure group. B) Forest plots of the association between alcohol use and Poor Outcome B (i.e., death and failure) for both DS-TB and MDR-TB studies and the breakdown of participants with poor outcome by exposure group. Squares indicate ORs from individual studies; square size reflects the statistical weight of the study. Horizontal lines indicate 95% CIs. Diamonds represent the combined ORs and 95% CIs. The vertical solid line shows no effect (OR = 1). The P values are from tests that the combined ORs equal 1. OR = odds ratio; CI = confidence interval; DS-TB = drug-susceptible tuberculosis; MDR-TB = multidrug-resistant TB; LTFU = loss to follow-up.
Table 1.
A) Meta-analysis results for poor treatment outcomes, studies on drug-susceptible TB
| Treatment outcome | Studies n | Summary effect estimate | 95% CI | I2 % | P value heterogeneity |
|---|---|---|---|---|---|
| Poor outcome A* | 25 | 1.99 | 1.57–2.51 | 93 | <0.001 |
| Poor outcome B† | 12 | 2.55 | 1.77–3.66 | 23 | 0.222 |
| Death | 22 | 1.58 | 1.24–2.00 | 73 | <0.001 |
| Treatment failure | 13 | 3.12 | 1.83–5.33 | 52 | 0.014 |
| LTFU | 29 | 2.25 | 1.74–2.91 | 79 | <0.001 |
| B) Meta-analysis results for poor treatment outcomes, studies on multidrug-resistant TB | |||||
|---|---|---|---|---|---|
| Treatment outcome | Studies n | Summary effect estimate | 95% CI | I2 % | P value heterogeneity |
| Poor outcome A* | 18 | 2.00 | 1.73–2.32 | 32 | 0.098 |
| Poor outcome B† | 10 | 1.47 | 1.06–2.05 | 64 | 0.003 |
| Death | 6 | 1.38 | 1.04–1.83 | 0 | 0.551 |
| Treatment failure | 4 | 1.54 | 1.09–2.17 | 45 | 0.143 |
| LTFU | 15 | 1.87 | 1.56–2.24 | 51 | 0.013 |
Death, treatment failure, and LTFU.
Death and treatment failure.
TB = tuberculosis; CI = confidence interval; LTFU = loss to follow-up.
Table 2.
A) Meta-analysis results of sub-group analyses for treatment outcomes for drug-susceptible TB studies
| Treatment outcome | Variable | Study characteristics | Studies n | Summary effect estimate | 95% CI | I2 % | P value heterogeneity |
|---|---|---|---|---|---|---|---|
| Poor outcome A* | Country TB burden | High burden | 7 | 2.18 | 1.62–2.93 | 67 | <0.001 |
| Not high burden | 18 | 1.92 | 1.42–2.59 | 94 | <0.001 | ||
| Country income | HIC | 14 | 1.75 | 1.26–2.42 | 86 | <0.001 | |
| LMIC | 12 | 2.05 | 1.43–2.95 | 84 | <0.001 | ||
| Type of TB | Pulmonary | 3 | 2.02 | 0.92–4.45 | 95 | <0.001 | |
| Pulmonary and extrapulmonary | 18 | 2.00 | 1.52–2.65 | 89 | <0.001 | ||
| High-quality alcohol definition | Yes | 4 | 3.05 | 1.58–5.89 | 88 | <0.001 | |
| Adjusted effect measure | Yes | 7 | 2.03 | 1.54–2.69 | 88 | <0.001 | |
| Minimally adjusted effect measure | Yes | 3 | 1.63 | 1.21–2.18 | 92 | <0.001 | |
| Poor outcome B† | Country TB burden | High burden | 3 | 1.57 | 0.82–3.01 | 0 | 0.814 |
| Not high burden | 9 | 2.86 | 1.94–4.21 | 26 | 0.214 | ||
| Country income | HIC | 9 | 2.86 | 1.94–4.21 | 26 | 0.214 | |
| LMIC | 3 | 1.57 | 0.82–3.01 | 0 | 0.814 | ||
| Type of TB | Pulmonary | 0 | NA | NA | NA | NA | |
| Pulmonary and extrapulmonary | 10 | 2.37 | 1.52–3.70 | 35 | 0.129 | ||
| High-quality alcohol definition | Yes | 2 | 3.15 | 1.29–7.69 | 84 | 0.011 | |
| Adjusted effect measure | Yes | 1 | 1.80 | 0.42–7.69 | NA | NA | |
| Minimally adjusted effect measure | Yes | 1 | 1.80 | 0.42–7.69 | NA | NA | |
| Death | Country TB burden | High burden | 3 | 1.85 | 0.88–3.89 | 79 | 0.009 |
| Not high burden | 19 | 1.46 | 1.18–1.81 | 49 | 0.009 | ||
| Country income | HIC | 15 | 1.20 | 1.15–1.26 | 38 | 0.065 | |
| LMIC | 6 | 2.15 | 1.58–2.93 | 54 | 0.053 | ||
| Type of TB | Pulmonary | 2 | 1.02 | 0.67–1.55 | 66 | 0.088 | |
| Pulmonary and extrapulmonary | 15 | 1.49 | 1.20–1.85 | 50 | 0.014 | ||
| High-quality alcohol definition | Yes | 4 | 1.49 | 0.96–2.31 | 29 | 0.240 | |
| Adjusted effect measure | Yes | 4 | 2.26 | 1.80–2.83 | 31 | 0.228 | |
| Minimally adjusted effect measure | Yes | 3 | 2.35 | 1.89–2.93 | 8 | 0.337 | |
| Treatment failure | Country TB burden | High burden | 2 | 1.70 | 0.86–3.39 | 47 | 0.168 |
| Not high burden | 11 | 3.90 | 2.06–7.39 | 54 | 0.016 | ||
| Country income | HIC | 9 | 5.27 | 2.68–10.36 | 21 | 0.255 | |
| LMIC | 4 | 1.84 | 1.04–3.23 | 59 | 0.064 | ||
| Type of TB | Pulmonary | 1 | 2.63 | 1.04–6.60 | NA | NA | |
| Pulmonary and extrapulmonary | 10 | 3.99 | 1.85–8.63 | 64 | 0.003 | ||
| High-quality alcohol definition | Yes | 2 | 12.15 | 3.63–40.71 | 0 | 0.447 | |
| Adjusted effect measure | Yes | 2 | 1.85 | 0.80–4.27 | 0 | 0.427 | |
| Minimally adjusted effect measure | Yes | 1 | 1.09 | 0.23–5.11 | NA | NA | |
| Loss to follow-up | Country TB burden | High burden | 14 | 2.36 | 1.95–2.87 | 65 | <0.001 |
| Not high burden | 15 | 1.92 | 1.20–3.08 | 85 | <0.001 | ||
| Country income | HIC | 11 | 1.92 | 1.13–3.24 | 73 | <0.001 | |
| LMIC | 18 | 2.37 | 1.77–3.17 | 82 | <0.001 | ||
| Type of TB | Pulmonary | 5 | 2.20 | 0.93–5.20 | 94 | <0.001 | |
| Pulmonary and extrapulmonary | 18 | 2.10 | 1.68–2.62 | 61 | <0.001 | ||
| High-quality alcohol definition | Yes | 6 | 3.20 | 1.86–5.50 | 85 | <0.001 | |
| Adjusted effect measure | Yes | 8 | 2.12 | 1.58–2.84 | 72 | 0.001 | |
| Minimally adjusted effect measure | Yes | 4 | 1.71 | 1.53–1.92 | 79 | 0.003 |
| B) Meta-analysis results for treatment outcomes, sub-group analyses for MDR-TB | ||||||||||
|---|---|---|---|---|---|---|---|---|---|---|
| Treatment outcome | Group | Study characteristics | Studies n | Summary effect estimate | 95% CI | I2 % | P value heterogeneity | |||
| Poor outcome A* | Country TB burden | High burden | 6 | 2.52 | 2.05–3.11 | 20 | 0.284 | |||
| Not high burden | 11 | 1.73 | 1.46–2.06 | 11 | 0.341 | |||||
| Country MDR-TB burden | High burden | 9 | 2.33 | 1.95–2.77 | 28 | 0.197 | ||||
| Not high burden | 8 | 1.72 | 1.43–2.08 | 17 | 0.292 | |||||
| Country income | HIC | 4 | 1.64 | 1.26–2.13 | 12 | 0.335 | ||||
| LMIC | 13 | 2.13 | 1.73–2.63 | 34 | 0.110 | |||||
| Type of TB | Pulmonary | 3 | 1.81 | 1.15–2.84 | 28 | 0.252 | ||||
| Pulmonary and extrapulmonary | 8 | 2.06 | 1.77–2.40 | 0 | 0.712 | |||||
| High-quality alcohol definition | Yes | 2 | 1.87 | 1.26–2.78 | 68 | 0.079 | ||||
| Adjusted effect measure | Yes | 5 | 1.48 | 0.84–2.61 | 63 | 0.029 | ||||
| Minimally adjusted effect measure | Yes | 2 | 0.85 | 0.43–1.69 | 0 | 0.628 | ||||
| Poor outcome B† | Country TB burden | High burden | 4 | 2.05 | 1.56–2.70 | 25 | 0.263 | |||
| Not high burden | 6 | 1.18 | 0.77–1.82 | 67 | 0.009 | |||||
| Country MDR-TB burden | High burden | 7 | 1.83 | 1.45–2.31 | 24 | 0.249 | ||||
| Not high burden | 3 | 1.11 | 0.55–2.24 | 86 | 0.001 | |||||
| Country income | HIC | 3 | 1.11 | 0.55–2.24 | 86 | 0.001 | ||||
| LMIC | 5 | 1.69 | 1.14–2.49 | 41 | 0.147 | |||||
| Type of TB | Pulmonary | 1 | 0.78 | 0.19–3.17 | NA | NA | ||||
| Pulmonary and extrapulmonary | 5 | 1.85 | 1.49–2.29 | 0 | 0.915 | |||||
| High-quality alcohol definition | Yes | 3 | 0.99 | 0.55–1.8 | 72 | 0.030 | ||||
| Adjusted effect measure | Yes | 1 | 1.10 | 0.56–2.19 | NA | NA | ||||
| Minimally adjusted effect measure | Yes | 1 | 1.10 | 0.56–2.19 | NA | NA | ||||
| Death | Country TB burden | High burden | 4 | 1.63 | 1.10–2.41 | 0 | 0.463 | |||
| Not high burden | 2 | 1.15 | 0.76–1.74 | 0 | 0.992 | |||||
| Country MDR-TB burden | High burden | 5 | 1.38 | 1.04–1.85 | 0 | 0.409 | ||||
| Not high burden | 1 | 1.26 | 0.27–5.83 | NA | NA | |||||
| Country income | HIC | 0 | NA | NA | NA | NA | ||||
| LMIC | 5 | 1.35 | 0.95–1.93 | 0 | 0.411 | |||||
| Type of TB | Pulmonary | 0 | NA | NA | NA | NA | ||||
| Pulmonary and extrapulmonary | 2 | 1.32 | 0.90–1.93 | 0 | 0.598 | |||||
| High-quality alcohol definition | Yes | 1 | 1.15 | 0.62–2.15 | NA | NA | ||||
| Adjusted effect measure | Yes | 0 | NA | NA | NA | NA | ||||
| Minimally adjusted effect measure | Yes | 0 | NA | NA | NA | NA | ||||
| Treatment failure | Country TB burden | High burden | 2 | 1.82 | 1.25–2.66 | 0 | 0.933 | |||
| Not high burden | 2 | 0.73 | 0.33–1.63 | 28 | 0.240 | |||||
| Country MDR-TB burden | High burden | 4 | 1.54 | 1.09–2.17 | 45 | 0.143 | ||||
| Not high burden | 0 | NA | NA | NA | NA | |||||
| Country income | HIC | 0 | NA | NA | NA | NA | ||||
| LMIC | 3 | 1.15 | 0.61–2.17 | 51 | 0.131 | |||||
| Type of TB | Pulmonary | 0 | NA | NA | NA | NA | ||||
| Pulmonary and extrapulmonary | 2 | 1.75 | 1.15–2.68 | 0 | 0.562 | |||||
| High-quality alcohol definition | Yes | 1 | 1.26 | 0.38–4.20 | NA | NA | ||||
| Adjusted effect measure | Yes | 0 | NA | NA | NA | NA | ||||
| Minimally adjusted effect measure | Yes | 0 | NA | NA | NA | NA | ||||
| Loss to follow-up | Country TB burden | High burden | 7 | 1.82 | 1.47–2.25 | 38 | 0.140 | |||
| Not high burden | 7 | 2.14 | 1.53–2.99 | 50 | 0.061 | |||||
| Country MDR-TB burden | High burden | 11 | 1.83 | 1.53–2.19 | 42 | 0.067 | ||||
| Not high burden | 3 | 3.11 | 2.00–4.81 | 0 | 0.790 | |||||
| Country income | HIC | 2 | 3.15 | 1.96–5.07 | 0 | 0.505 | ||||
| LMIC | 11 | 1.83 | 1.50–2.22 | 45 | 0.052 | |||||
| Type of TB | Pulmonary | 3 | 2.76 | 1.94–3.92 | 35 | 0.213 | ||||
| Pulmonary and extrapulmonary | 8 | 1.72 | 1.39–2.13 | 45 | 0.078 | |||||
| High-quality alcohol definition | Yes | 2 | 2.68 | 1.99–3.60 | 0 | 0.334 | ||||
| Adjusted effect measure | Yes | 4 | 2.59 | 1.91–3.53 | 0 | 0.670 | ||||
| Minimally adjusted effect measure | Yes | 1 | 2.10 | 1.10–4.00 | NA | NA | ||||
Death, treatment failure, and LTFU.
Death and treatment failure.
CI = confidence interval; HIC = high-income country; LMIC = low- to middle-income country; LTFU = loss to follow-up; NA = not applicable or available; TB = tuberculosis; MDR-TB = multidrug-resistant TB.
Poor outcome B (excluding loss to follow-up)
Among DS-TB studies, patients who consumed alcohol had significantly higher odds of poor outcome B (i.e., death and treatment failure) than the reference alcohol group (n = 12; OR 2.55, 95% CI 1.77–3.66; Figure 2B, Table 1). This relationship was also observed in MDR-TB studies (n = 10; OR 1.47, 95% CI 1.06–2.05; Figure 2B, Table 1). Sub-group analyses did not reveal a noticeable difference in effect measure for poor outcome B (Table 2). When LTFU was included in the reference outcome group, along with cure and treatment completion, alcohol use remained significantly associated with poor outcome B for both DS-TB (n = 12; OR 2.16, 95% CI 1.55–3.01) and MDR-TB (n = 7; OR 1.44, 95% CI 1.12–1.86 (Supplementary Table S7).
Death
Among DS-TB studies, alcohol use was associated with significantly higher odds of death (n = 22; OR 1.58, 95% CI 1.24–2.00; Table 1; Supplementary Figure S1A). The same relationship was observed among MDR-TB studies (n = 6; OR 1.38, 95% CI 1.04–1.83; Table 1; Supplementary Figure S1A). Sub-group analyses among DS-TB studies conducted in low and middle-income countries showed an increase in the association between alcohol use and death (n = 6; OR 2.15, 95% CI 1.58–2.93; Table 2). When compared only to cure and treatment completion, alcohol use remained significantly associated with death in both DS-TB and MDR-TB patients (DS-TB: n = 16; OR 1.53, 95% CI 1.16–2.01; MDR-TB: n = 5; OR 1.86; 95% CI, 1.34–2.60; Supplementary Table S7).
Treatment failure
Among DS-TB studies, alcohol use was associated with higher odds of treatment failure (n = 13; OR 3.12, 95% CI 1.83–5.33) (Table 1; Supplementary Figure S1B). The same was observed among MDR-TB studies (n = 4; OR 1.54, 95% CI 1.09–2.17; Table 1; Supplementary Figure S1B). Sub-group analyses showed an increase in the association between alcohol use and treatment failure among DS-TB studies conducted in countries not considered high TB burden (n = 11; OR 3.90, 95% CI 2.06–7.39) and high-income countries (n = 9; OR 5.27, 95% CI 2.68–10.36) (Table 2). The relationship between alcohol use and treatment failure for both DS- and MDR-TB remained significant when only cure and treatment completion were used as the reference outcome group (DS-TB: n = 14; OR 3.23, 95% CI 1.75–5.96; MDR-TB: n = 4; OR 2.05, 95% CI 1.44–2.92; Supplementary Table S7).
Loss to follow-up
Alcohol use was associated with an increased odds of LTFU in both DS-TB (n = 29; OR 2.25, 95% CI 1.74–2.91; Table 1; Supplementary Figure S1C) and MDR-TB studies (n = 15; OR 1.87, 95% CI 1.56–2.24; Table 1; Supplementary Figure S1C). Sub-group analyses showed an increase in the association between alcohol use and LTFU in DS-TB studies that reported a higher-quality definition of alcohol use (n = 6; OR 3.20, 95% CI 1.86–5.50; Table 2). Alcohol use remained significantly associated with LTFU when cure and treatment completion were used as the reference outcome for both DS-TB (n = 30; OR 2.71, 95% CI 2.07–3.55) and MDR-TB studies (n = 9; OR 2.18, 95% CI 1.64–2.90; Supplementary Table S7).
Heterogeneity, publication bias, and meta-regression
Considerable heterogeneity was present in many of the main and sub-group analyses, even when outliers were removed (Tables 1 and 2; Supplementary Table S7). Egger’s test for publication bias was significant for the DS-TB analyses of poor outcome A (P = 0.03) and treatment failure (P = 0.03). Visual inspection of funnel plots showed no compelling evidence of publication bias for poor outcome A, but was suggestive of bias for treatment failure due to a lack of small studies with odds ratios below the combined value (Supplementary Figure S2). In meta-regression, the proportions of patients with diabetes mellitus (DM), patients who were smear-positive at diagnosis, illicit drug users, and the WHO region each significantly modified the associations between alcohol use and at least one outcome (Supplementary Table S8). No covariate had a consistently significant impact across all outcomes or TB susceptibility types.
DISCUSSION
In this systematic review and meta-analysis, alcohol use was associated with a 1.5–2-fold increased odds of poor DS-TB and MDR-TB treatment outcomes, relative to minimal or no alcohol exposure. Alcohol use was a risk factor for poor TB outcomes in aggregate, in addition to each poor treatment outcome (treatment failure, death, LTFU) individually. While much of the literature has pointed to poor adherence and retention in care as primary drivers of this association,26–28 our finding that those who consumed alcohol had increased risk of treatment failure and death, independent of LTFU, suggests that the negative impact of alcohol may have biologic drivers as well. Our review reveals that most TB studies that capture alcohol use reported only dichotomous use (i.e., yes/no), relying heavily on medical record documentation or patient self-report. An increased body of TB literature with validated measures of alcohol use may ultimately reveal that the strong associations we highlight in this review are conservative.
With the large number of identified studies, we were able to look at the impact of alcohol on DS- and MDR-TB separately, which had not been done in previous reviews on alcohol use and TB.3,4,29,30 MDR-TB patients globally have a more than two-fold higher rate of poor outcomes than DS-TB patients.1 This indicates a potentially greater number of competing risks for poor outcomes that may diminish the observed effect of alcohol. Even so, our findings indicate that alcohol use contributes to poor outcomes for both forms of TB.
Our sub-group and meta-regression analyses indicated potential for effect modification, but ultimately did not explain the high heterogeneity observed. Sub-group analyses of studies reporting a high-quality alcohol measurement indicated a strengthened relationship between alcohol use and poor treatment outcomes for DS-TB and LTFU for MDR-TB. Sub-group analyses of country income showed a stronger alcohol use effect on treatment failure and death in higher-income countries. Country wealth is positively associated with the number of individuals with problem alcohol use.5 High TB burden countries experiencing economic growth, such as India or South Africa, may become locations where the epidemics of alcohol use and TB co-occur, with potential for explosive impact, similar to that predicted for DM and TB. This analysis was limited however because lower-income and high TB burden countries were largely under-represented. Findings from our meta-regression analyses were ultimately mixed, but highlight the importance of collecting high-quality information on covariates associated with poor treatment outcomes that may have an additive effect with alcohol, namely DM, smear status, and illicit drug use.
Strong associations between alcohol use and poor TB outcomes were observed in this review despite several limitations of the summarized literature. First, misclassification was likely for both treatment outcomes and exposure to alcohol. LTFU was a frequent event in the studies we reviewed, ranging from 4% to 57% in DS-TB and from 0% to 33% in MDR-TB cohort studies, but is a TB outcome for which the appropriate reference group remains unclear. Although primarily considered a poor outcome, LTFU is intermediary, as a patient LTFU may ultimately have a favorable or a poor outcome had they continued treatment. Similarly, treatment failure and death may be a result of poor adherence or borderline LTFU. To account for this, we used two aggregate poor outcome definitions, including and excluding LTFU, and performed sensitivity analyses where each individual poor outcome was compared only to successful outcomes. Inclusion or exclusion of LTFU in the reference group did not meaningfully alter the observed effect. With respect to exposure, very few studies used a higher-quality alcohol use measure. Given that alcohol use is often under-reported,31 misclassification would likely diminish the observed effect and render our findings conservative. This is supported by the observed strengthened effect on all poor outcomes except death in sub-group analyses of DS-TB studies collecting a high-quality alcohol use variable (poor outcome A, OR 3.05; poor outcome B, OR 3.15; failure, OR 12.15; LTFU, OR 3.20; Table 2).
Second, a common methodological issue among the reviewed studies was that few reported hazard ratios (HRs). As highlighted by Huangfu et al., logistic regression is the most commonly used analysis for treatment outcome studies, but survival analysis is often the more appropriate method to account for competing risk and avoid outcome misclassification.32 We attempted to reduce misclassification by including only studies that reported standardized definitions and aggregating outcomes in various combinations. Third, few studies reported adjusted effect measures which may have led to within-study confounding. Finally, we found high heterogeneity in many of our analyses which was not fully explained by secondary analyses or meta-regression, potentially driven by differences in the patient populations (e.g., geography, burden, comorbidities) and alcohol use definitions.
The findings of our meta-analysis indicate a clear, quantifiable relationship between alcohol use and poor TB treatment outcomes, and highlight the need for interventions for TB patients in treatment who consume alcohol. All TB outcome studies should include rigorous alcohol measurements, as a larger body of studies reporting high-quality measures may better illuminate causal mechanisms, a dose-response relationship, and a differential impact of chronic vs. acute problem drinking.33 Numerous validated instruments (e.g., Alcohol Use Disorder Identification Test [AUDIT] or CAGE) can be incorporated easily into data collection for both observational and interventional studies.34,35 Recent treatment guidelines from the WHO, American Thoracic Society (ATS), and the US Centers for Disease Control and Prevention (CDC) lack guidance on how to integrate alcohol use interventions into treatment for active TB.36–38 Our findings suggest that guidelines for treating TB, integrated with interventions that address the impact of alcohol use via both biologic and behavioral mechanisms, are warranted, similar to what has been developed or proposed for integrating TB treatment with HIV and DM care.39–41
Supplementary Material
Acknowledgements
The authors thank A Florea, A Loomens, C Acuna-Villaorduna, C Geadas, C Jeon, F Barbosa, F Grehan, J Kern, and Y Li for their assistance in translating non-English articles; T Holtz, B-H Jeong, and G Velasquez for contributing or clarifying their data and/or methods, allowing for inclusion of their studies in this review.
This work was supported by: the National Institute of Allergy and Infectious Diseases (NIAID; Bethesda, MD, USA; grant numbers R01AI119037 to EJR, CDP, CRH, BM, and KRJ, U19AI111276 to CRH and KRJ); the National Institute of General Medical Sciences Interdisciplinary Training Grant for Biostatisticians (grant number T32 GM74905 to BS); the National Institute on Alcohol Abuse and Alcoholism (grant number U01AA020780 to NG]; the US-India Vaccine Action Program (VAP) Initiative on Tuberculosis (CRDF Global/NIAID) to CRH; and the Providence/Boston Center for AIDS Research supported by the NIAID (grant number P30AI042853 to EJR, CRH, and KRJ). The funders had no role in the design or conduct of this study.
Footnotes
Conflicts of interest: none declared.
References
- 1.World Health Organization. Global tuberculosis report, 2018 WHO/CDS/TB/2018.20. Geneva, Switzerland: WHO, 2018. [Google Scholar]
- 2.Kyu HH, Maddison ER, Henry NJ, et al. The global burden of tuberculosis: results from the Global Burden of Disease Study 2015. Lancet Infect Dis 2018; 18(3): 261–284. [DOI] [PMC free article] [PubMed] [Google Scholar]
- 3.Imtiaz S, Shield KD, Roerecke M, Samokhvalov A V, Lönnroth K, Rehm J. Alcohol consumption as a risk factor for tuberculosis: meta-analyses and burden of disease. Eur Respir J 2017; 50: 1700216. [DOI] [PMC free article] [PubMed] [Google Scholar]
- 4.Simou E, Britton J, Leonardi-Bee J. Alcohol consumption and risk of tuberculosis: a systematic review and meta-analysis. Int J Tuberc Lung Dis 2018; 22(11): 1277–1285. [DOI] [PubMed] [Google Scholar]
- 5.World Health Organization. Global status report on alcohol and health, 2018. Geneva, Switzerland: WHO, 2018. [Google Scholar]
- 6.American Psychiatric Association. Diagnostic and statistical manual of mental disorders: Fifth Edition. Arlington, VA, USA: APA, 2013. [Google Scholar]
- 7.Shin SS, Mathew TA, Yanova G V, et al. Alcohol consumption among men and women with tuberculosis in Tomsk, Russia. Cent Eur J Public Health 2010; 18(3): 132. [DOI] [PMC free article] [PubMed] [Google Scholar]
- 8.Veerakumar AM, Sahu SK, Sarkar S, Kattimani S, Govindarajan S. Alcohol use disorders among pulmonary tuberculosis patients under RNTCP in urban Pondicherry, India. Indian J Tuberc 2015; 62(3): 171–177. [DOI] [PubMed] [Google Scholar]
- 9.Laprawat S, Peltzer K, Pansila W, Tansakul C. Alcohol use disorder and tuberculosis treatment: A longitudinal mixed method study in Thailand. S Afr J Psychiatry 2017; 23(1): 1074. [DOI] [PMC free article] [PubMed] [Google Scholar]
- 10.Peltzer K, Louw J, McHunu G, Naidoo P, Matseke G, Tutshana B. Hazardous and harmful alcohol use and associated factors in tuberculosis public primary care patients in South Africa. Int J Environ Res Public Health 2012; 9(9): 3245–3257. [DOI] [PMC free article] [PubMed] [Google Scholar]
- 11.Volkmann T, Moonan PK, Miramontes R, Oeltmann JE. Tuberculosis and excess alcohol use in the United States, 1997–2012. Int J Tuberc Lung Dis 2014; 19(1): 111–119. [DOI] [PMC free article] [PubMed] [Google Scholar]
- 12.de Albuquerque M d FM, Ximenes RA d A, Lucena-Silva N, et al. Factors associated with treatment failure, dropout, and death in a cohort of tuberculosis patients in Recife, Pernambuco State, Brazil. Cad Saude Publica 2007; 23(7): 1573–1582. [DOI] [PubMed] [Google Scholar]
- 13.Kurbatova EV, Taylor A, Gammino VM, et al. Predictors of poor outcomes among patients treated for multidrug-resistant tuberculosis at DOTS-plus projects. Tuberculosis 2012; 92(5): 397–403. [DOI] [PMC free article] [PubMed] [Google Scholar]
- 14.Miller AC, Gelmanova IY, Keshavjee S, et al. Alcohol use and the management of multidrug-resistant tuberculosis in Tomsk, Russian Federation. Int J Tuberc Lung Dis 2012; 16(7): 891–896. [DOI] [PMC free article] [PubMed] [Google Scholar]
- 15.Molina PE, Happel KI, Zhang P, Kolls JK, Nelson S. Focus on: alcohol and the immune system. Alcohol Res Health 2010; 33(1–2): 97–108. [PMC free article] [PubMed] [Google Scholar]
- 16.Quintero D, Guidot DM. Focus on the lung. Alcohol Res Health 2010; 33(3): 219. [PMC free article] [PubMed] [Google Scholar]
- 17.Saukkonen JJ, Cohn DL, Jasmer RM, et al. An official ATS statement: hepatotoxicity of antituberculosis therapy. Am J Respir Crit Care Med 2006; 174(8): 935–952. [DOI] [PubMed] [Google Scholar]
- 18.Koriakin V, Sokolova G, Grinchar N, Iurchenko L. Pharmacokinetics of isoniazid in patients with pulmonary tuberculosis and alcoholism. Probl Tuberk 1986; 12: 43–46. [PubMed] [Google Scholar]
- 19.Moher D, Liberati A, Tetzlaff J, Altman D; The PRISMA Group. Preferred reporting items for systematic review and meta-analysis: the PRISMA statement. Open Med. 2009; 3(3): e123–130. [PMC free article] [PubMed] [Google Scholar]
- 20.Cochran W The combination of estimates from different experiments. Biometrics 1954; 10: 101–129. [Google Scholar]
- 21.Higgins J, Thompson S. Quantifying heterogeneity in a meta-analysis. Stat Med 2002; 21(11): 1539–1558. [DOI] [PubMed] [Google Scholar]
- 22.Normand S-L. Formulating, evaluating, combining and reporting. Stat Med 1999; 18: 321–359. [DOI] [PubMed] [Google Scholar]
- 23.Baujat B, Mahé C, Pignon J-P, Hill C. A graphical method for exploring heterogeneity in meta-analyses: application to a meta-analysis of 65 trials. Stat Med 2002; 21(18): 2641–2652. [DOI] [PubMed] [Google Scholar]
- 24.Egger M, Davey-Smith G, Altman D. Systematic reviews in health care: meta-analysis in context. 2nd ed. London, UK: BMJ Books, 2001. [Google Scholar]
- 25.The World Bank. World Bank country and lending groups. Washington DC, USA: World Bank, 2018. [Google Scholar]
- 26.Garrido MD, Penna ML, Perez-Porcuna TM, et al. Factors associated with tuberculosis treatment default in an endemic area of the Brazilian Amazon: a case control-study. PLoS One 2012; 7(6): 7. [DOI] [PMC free article] [PubMed] [Google Scholar]
- 27.Gelmanova IY, Keshavjee S, Golubchikova VT, et al. Barriers to successful tuberculosis treatment in Tomsk, Russian Federation: non-adherence, default and the acquisition of multidrug resistance. Bull World Heal Organ 2007; 85(9): 703–711. [DOI] [PMC free article] [PubMed] [Google Scholar]
- 28.Jakubowiak WM, Bogorodskaya EM, Borisov ES, Danilova DI, Kourbatova EK. Risk factors associated with default among new pulmonary TB patients and social support in six Russian regions. Int J Tuberc Lung Dis 2007; 11(1): 46–53. [PubMed] [Google Scholar]
- 29.Rehm JJ, Samokhvalov AV, Neuman MGM, et al. The association between alcohol use, alcohol use disorders and tuberculosis (TB). A systematic review. BMC Public Health 2009; 9(1): 450. [DOI] [PMC free article] [PubMed] [Google Scholar]
- 30.Lönnroth K, Williams BG, Stadlin S, Jaramillo E, Dye C. Alcohol use as a risk factor for tuberculosis: a systematic review. BMC Public Health 2008; 8: 289. [DOI] [PMC free article] [PubMed] [Google Scholar]
- 31.Bajunirwe F, Haberer JE, Boum Y, et al. Comparison of self-reported alcohol consumption to phosphatidylethanol measurement among HIV-infected patients initiating antiretroviral treatment in southwestern Uganda. PLoS One 2014; 9(12): e113152. [DOI] [PMC free article] [PubMed] [Google Scholar]
- 32.Huangfu P, Pearson F, Ugarte-Gil C, Critchley J. Diabetes and poor tuberculosis treatment outcomes: issues and implications in data interpretation and analysis. Int J Tuberc Lung Dis 2017; 21(12): 1214–1219. [DOI] [PubMed] [Google Scholar]
- 33.Myers B, Bouton TC, Ragan EJ, et al. Impact of alcohol consumption on tuberculosis treatment outcomes: a prospective longitudinal cohort study protocol. BMC Infect Dis 2018; 18(1): 488. [DOI] [PMC free article] [PubMed] [Google Scholar]
- 34.Saunders JB, Aasland OG, Babor TF, de la Fuente JR, Grant M. Development of the Alcohol Use Disorders Screening Test (AUDIT). WHO collaborative project on early detection of persons with harmful alcohol consumption. Addiction 1993; 88: 791–804. [DOI] [PubMed] [Google Scholar]
- 35.Mayfield D, McLeod G, Hall P. The CAGE questionnaire: validation of a new alcoholism screening instrument. Am J Psychiatry 1974; 131(10): 1121–1123. [DOI] [PubMed] [Google Scholar]
- 36.Nahid P, Dorman SE, Alipanah N, et al. Executive Summary: Official American Thoracic Society/Centers for Disease Control and Prevention/Infectious Diseases Society of America Clinical Practice Guidelines: treatment of drug-susceptible tuberculosis. Clin Infect Dis 2016; 63(7): 853–867. [DOI] [PMC free article] [PubMed] [Google Scholar]
- 37.World Health Organization. WHO treatment guidelines for drug-resistant tuberculosis WHO/HTM/TB/2016.04. Geneva, Switzerland: WHO, 2016. http://apps.who.int/iris/bitstream/handle/10665/250125/9789241549639-eng.pdf?sequence=1 Accessed November 2019. [Google Scholar]
- 38.World Health Organization. Guidelines of treatment for drug-susceptible tuberculosis and patient care WHO/HTM/TB/2017.05. Geneva, Switzerland: WHO, 2017. http://apps.who.int/iris/bitstream/handle/10665/255052/9789241550000-eng.pdf;jsessionid=CBE386EEEBC3D48EE5F02A6BA68FDB34?sequence=1 Accessed November 2019. [Google Scholar]
- 39.Riza AL, Pearson F, Ugarte-Gil C, et al. Clinical management of concurrent diabetes and tuberculosis and the implications for patient services. Lancet Diabetes Endocrinol 2014; 2(9): 740–753. [DOI] [PMC free article] [PubMed] [Google Scholar]
- 40.Khan FA, Minion J, Al-Motairi A, Benedetti A, Harries AD, Menzies D. An updated systematic review and meta-analysis on the treatment of active tuberculosis in patients with HIV infection. Clin Infect Dis 2012; 55(8): 1154–1163. [DOI] [PubMed] [Google Scholar]
- 41.Onyebujoh PC, Ribeiro I, Whalen CC. Treatment options for HIV-associated tuberculosis. J Infect Dis 2007; 196 (Suppl 1): S35–S45. [DOI] [PMC free article] [PubMed] [Google Scholar]
Associated Data
This section collects any data citations, data availability statements, or supplementary materials included in this article.