

Abstract
The absorption, distribution, metabolism and excretion of molidustat were investigated in healthy male participants. In study 1, a mass balance study, radiolabelled molidustat 25 mg (3.57 MBq) was administered as an oral solution (n = 4). Following rapid absorption, molidustat‐related radioactivity was predominantly distributed in plasma rather than in red blood cells. The total recovery of the administered radioactivity was 97.0%, which was mainly excreted renally (90.7%). Metabolite M‐1, produced by N‐glucuronidation, was the dominant component in plasma (80.2% of the area under the concentration‐time curve for total radioactivity) and was primarily excreted via urine (~85% of dose). Only minor amounts of unchanged molidustat were excreted in urine (~4%) and faeces (~6%). Study 2 investigated the absolute bioavailability and pharmacodynamics of molidustat (part 1, n = 12; part 2, n = 16). Orally administered molidustat immediate release tablets had an absolute bioavailability of 59%. Following intravenous administration (1, 5 and 25 mg), total body clearance of molidustat was 28.7‐34.5 L/h and volume of distribution at steady state was 39.3‐50.0 L. All doses of molidustat transiently elevated endogenous erythropoietin levels, irrespective of the route of administration. Molidustat was considered safe and well tolerated at the administered doses.
Keywords: ADME (absorption, disposition, metabolism, excretion), biotransformation, erythropoietin
1. INTRODUCTION AND BACKGROUND
Erythropoiesis is stimulated by the hormone erythropoietin (EPO), which is produced predominantly in the kidneys in adults. 1 Owing to reduced renal function, patients with chronic kidney disease (CKD) become increasingly unable to produce sufficient EPO to maintain normal red blood cell levels. 2 Consequently, renal anaemia is a common and serious complication of CKD that worsens with disease progression. 3 , 4
The current standard of care for patients with renal anaemia is the use of an erythropoiesis‐stimulating agent (ESA), which supplements insufficient plasma EPO with recombinant human EPO. 5 Although ESAs effectively increase haemoglobin (Hb) levels, they have several well‐documented limitations: most notably, an increased risk of cardiovascular disease and mortality. 6 , 7 , 8 Various explanations for this have been hypothesized, including the high concentrations of ESAs required to achieve Hb level targets, Hb level oscillations and overshoot of target levels, and/or the rapid rate of Hb level increase following ESA administration. 9
The production of EPO is regulated by hypoxia‐inducible factors (HIFs), which induce expression of EPO in hypoxic conditions. In normoxic conditions, HIF‐α subunits are hydroxylated by HIF‐prolyl hydroxylases (HIF‐PHs) resulting in their degradation. 10 HIF‐PH inhibitors mimic the hypoxia‐induced expression of EPO via stabilization of HIFs and thus elevate endogenous EPO levels. 11 HIF‐PH inhibitors may, therefore, provide an alternative treatment for renal anaemia. Molidustat is an orally bioavailable HIF‐PH inhibitor that is being developed for the treatment of renal anaemia 12 and has demonstrated promising results in phase 2 clinical trials. 13
The absolute bioavailability (F) of molidustat varies among species, ranging from 34% in rat to 61% in monkey and 71% in dog. 12 In a first‐in‐man study, molidustat (5‐50 mg) was administered to healthy participants as a single oral dose of a polyethylene glycol (PEG) solution. 14 Molidustat was rapidly absorbed (median time to maximum plasma concentration [t max], 0.25‐0.75 hours) and demonstrated a dose‐dependent increase in maximum plasma concentration (C max) and area under the concentration‐time curve (AUC). The mean terminal half‐life (t½) ranged from 4.64 to 10.4 hours. Importantly, only a small proportion of molidustat (<4%) was excreted in urine. 14 One major metabolite of molidustat (M‐1) has been identified in humans. M‐1 is produced by N‐glucuronidation and is pharmacologically inactive. 15
The use of HIF stabilizers such as molidustat is prohibited in sport by the World Anti‐Doping Agency, owing to their proven ability to efficiently stimulate erythropoiesis. 15 Pharmacokinetic analysis of molidustat and its metabolites may, therefore, provide valuable data for use in sports drug testing, in addition to informing therapeutic usage.
In this article, we characterize the absorption, distribution, metabolism and excretion of molidustat in healthy participants based on the results of two clinical studies. Study 1 was a mass balance study following administration of a radiolabelled molidustat PEG solution, with subsequent metabolite profiling (n = 4). Study 2 was an absolute bioavailability study primarily investigating the pharmacokinetics of molidustat administered as a single oral dose of immediate release (IR) tablets compared with intravenous infusion (n = 28).
2. MATERIALS AND METHODS
2.1. Ethical approval
The protocol for study 1 was approved by the Ethics Committee Northwest and Central Switzerland before study initiation. As required by local law, approval was also granted by the Swiss Agency for Therapeutic Products (reference number 2012DR1145). The study was conducted at a single study centre in Switzerland (Covance Clinical Research Unit AG, Basel). The protocol for study 2 was approved by the Ethics Committee of the North‐Rhine Medical Council and the Federal Institute for Drugs and Medical Devices before study initiation. The study was conducted at a single study centre in Germany (Clinical Research Services Mönchengladbach GmbH, Mönchengladbach).
All participants provided informed consent prior to entry to either of the studies. Both studies were conducted in accordance with the latest revised version of the Declaration of Helsinki, the International Council for Harmonisation of Technical Requirements for Pharmaceuticals for Human Use guidelines for Good Clinical Practice and the Basic & Clinical Pharmacology & Toxicology policy for experimental and clinical studies. 16
2.2. Study 1: Mass balance study
2.2.1. Study design
Study 1 was a non‐randomized, open‐label study that aimed to investigate the metabolism, excretion pattern, mass balance, pharmacokinetics, safety and tolerability of molidustat.
2.2.2. Participants
Participants eligible for inclusion were healthy white men, 45‐65 years of age at the first screening visit, with a body mass index (BMI) of 18‐30 kg/m2, and the ability to understand and follow study‐related instructions. Key exclusion criteria included: any pre‐existing diseases which may affect the absorption, distribution, metabolism or elimination of the study drug; regular use of medicines; donation of blood in the 4 weeks (>100 mL) or 3 months (>500 mL) before first study drug administration; systolic blood pressure <90 mmHg or >150 mmHg; diastolic blood pressure <50 mmHg or > 95 mmHg; heart rate <40 bpm or >100 bpm; and participation in another clinical study during the preceding 3 months.
2.2.3. Study drug administration
Four healthy participants received a single oral dose of molidustat 25 mg in a solution (10 mL) comprising PEG, polysorbate 20 and levomenthol, under fasting conditions. The dose consisted of molidustat 24.04 mg and [14C]molidustat 0.96 mg (3.57 MBq). The associated radiation exposure of 0.88 mSv (effective dose) was within Swiss regulatory limits (0.1‐1 mSv) and International Commission on Radiological Protection category IIa guidelines (<1 mSv). Participants remained in‐house from 1 day before the scheduled dose administration (approximately 12 hours before dosing) until 10 days after dose administration.
2.2.4. Sample collection
Blood samples were collected before dose administration and 0.25, 0.5, 1, 2, 3, 4, 8, 12, 15, 24, 36, 48, 72, 96, 120, 144, 168, 192, 216 and 240 hours after dose administration. Whole blood samples were transferred into potassium ethylenediaminetetraacetic acid tubes and stored at ≤−20°C for subsequent liquid scintillation counting (LSC). The remaining samples were collected in lithium‐heparinized polypropylene tubes and processed for plasma via centrifugation (2000 rpm, 10 minutes) at 4°C. Samples were then divided into aliquots for determination of molidustat concentration, metabolite profiling and radioanalysis.
Urine samples for metabolite profiling and radioanalysis were collected before dose administration and 0‐12 hours and 12‐24 hours after dose administration, and then combined on a 24‐hour basis, up to 10 days after dose administration, and stored at −20°C. Faeces samples for metabolite profiling and radioanalysis were collected before dose administration and combined on a 24‐hour basis, up to 10 days after dose administration, and stored at −20°C. After each collection, faecal samples were homogenized in water. An aliquot of 10 g was taken for determination of total radioactivity (quadruplicates), and two aliquots of 50 g each were used for further processing and analysis of unchanged drug and the metabolite pattern. One vomitus sample was collected, employing the same method used for faeces.
2.2.5. Determination of molidustat concentration by LC–MS/MS
Molidustat concentration was determined in plasma as previously described. 15 Protein precipitation with acetonitrile and subsequent filtration, including an internal standard, were followed by separation employing high‐pressure liquid chromatography and tandem mass spectrometry (LC–MS/MS) detection. The calibration range of the procedure was 0.100‐100 μg/L. Quality control (QC) samples (0.300‐500 μg/L) were determined with an accuracy of 88.0%‐96.6% and a precision of 1.26%‐9.90%.
2.2.6. Total radioactivity analysis
Aliquots of plasma and urine samples were added directly to Irgasafe Plus (PerkinElmer) scintillation cocktail. Aliquots of blood, homogenized faeces and vomitus samples were pre‐treated with Solvable (PerkinElmer) tissue solubilizer before being added to the scintillation cocktail.
Radioactivity was determined using a Packard liquid scintillation counter equipped with disintegrations per minute (dpm) and luminescence options (eg Tri‐Carb 2500 TR, 2550 TR/LL or 2900 TR). All values were corrected with a background of 19 counts per minute (cpm). Based on a background value of 19 cpm, a counting time of 10 minutes and counting efficiencies of 85%‐95%, the limits of quantification were 20‐23 dpm. The limits of detection were 7‐8 dpm (one third of the limit of quantification). For blood and plasma samples, dpm/mL was based on measured dpm/g and assuming a density of approximately 1.0 g/mL.
2.2.7. Pharmacokinetic analysis
Pharmacokinetic parameters were calculated using the model‐independent (compartment‐free) method and the program WinNonlin (version 4.1, Pharsight Corporation), in conjunction with Automation Extension (Bayer Pharma AG).
Based on the plasma concentration‐time data for molidustat, the pharmacokinetic parameters calculated were AUC, AUC to the last data point above the lower limit of quantification (LLOQ; AUC(0‐t last)), AUC from 0 to 12 hours (AUC(0‐12)), C max, t max, t½ and total body clearance (CL) calculated after extravascular administration (ie apparent oral clearance, CL/F). Based on the concentration‐time data for total drug‐related radioactivity in whole blood and plasma, AUC(0‐t last), AUC(0‐12), C max and t max were calculated.
Mean concentrations were calculated if two thirds of individual values were greater than the LLOQ. Values below the LLOQ were imputed by dividing the LLOQ by two. Pharmacokinetic parameters are presented as the geometric mean, geometric coefficient of variation (%CV) and range, unless otherwise stated.
2.2.8. Mass balance
The amount of radioactivity in all collected excreta samples, expressed as a percentage of the administered dose, was calculated to obtain the mass balance of excretion of orally administered [14C]molidustat. Amount excreted into urine (A E,ur [%]) and amount excreted into faeces (A E,faec [%]) was calculated as the cumulative proportions of total radioactivity excreted in urine and faeces, respectively, as percentages of the dose.
2.2.9. Safety
Any adverse events (AEs) occurring during the study were recorded and classified by seriousness, intensity and likelihood of a causal relationship to administration of the study drug. Other safety assessments conducted included physical examination, electrocardiogram (ECG), vital signs measurements and clinical laboratory tests.
2.3. Metabolite profiling of study 1 samples
2.3.1. Sample preparation
Aliquots from individual plasma samples for each time‐point were treated with ice‐cold acetonitrile containing 2% trifluoroacetic acid (TFA) and frozen for 1 hour. After thawing, the samples were homogenized and the proteins were precipitated by centrifugation (2 minutes, 1800 g). After separation of the supernatants, the residues were extracted again with 1 mL ice‐cold acetonitrile containing 2% TFA. The supernatants of each time‐point were combined, and aliquots were concentrated, diluted with solvent B (acetonitrile plus 0.5% formic acid) and subjected to high‐performance liquid chromatography (HPLC; injection volume 80 μL) with offline radioactivity detection by LSC. The extraction recoveries of radiolabelled molidustat‐associated analytes from plasma samples obtained over the first 12 hours after dose administration ranged from 89.3% to 103.5%.
Urine samples were subjected directly, without any treatment or addition of solvent A (0.5% formic acid [pH 2]), to HPLC (injection volume 30‐100 μL) with offline radioactivity detection by LSC.
Aliquots containing approximately 1 g of homogenized faeces were consecutively extracted with a mixture of acetonitrile/methanol/0.1% formic acid and with aqueous acetonitrile (85% acetonitrile) containing 2% concentrated TFA. The obtained suspensions were homogenized by sonication for 20 minutes followed by centrifugation (5 minutes, 4000 rpm). After separation of the supernatants, the work‐up procedure was repeated for the residues. Overall, all four supernatants were combined for each faeces sample and time‐point. Extraction recoveries of radiolabelled molidustat‐associated analytes after work‐up of individual faeces samples ranged from 99.0% to 102.4%. After concentration and addition of solvent A, the samples were subjected to HPLC (injection volume 80 μL, injected radioactivity: 148‐490 dpm) with offline radioactivity detection by LSC.
2.3.2. Analytical HPLC–LSC
Samples were analysed with a Liquid Chromatograph HP 1200 equipped with diode array detector (Hewlett Packard), using the Wallac 1450 MicroBeta® Plus Liquid Scintillation Counter (Wallac) as a detector. The scintillation cocktail used was Ultima‐Flo AP (PerkinElmer). A flow rate of 0.25 mL/min was maintained during the 35‐minute gradient, starting at 2% B and increasing to 20% B at minute 18, 60% B at minute 20 and 80% B at minute 26, and returning to 2% B at minute 31. Data were analysed using the program GINA Star® (version 2.18, Elysia‐Raytest). The radioactivity concentration of each component in the respective matrices was determined by multiplying the total radioactivity present in plasma, urine or faeces with the percentage peak area obtained after HPLC separation, fractionation and offline radioactivity detection by LSC.
2.3.3. Structure elucidation
Identification of molidustat and metabolites in plasma and excreta was confirmed by comparison to authentic standards, high‐pressure liquid chromatography and tandem high‐resolution mass spectrometry (LC–HR/MS/MS) detection, nuclear magnetic resonance (NMR) techniques and HPLC retention times.
2.4. Study 2: Absolute bioavailability study
2.4.1. Study design
Study 2 was conducted in two parts. Part 1 had a non‐randomized, open‐label, parallel‐group, single dose‐escalation design and aimed to evaluate the pharmacokinetics, pharmacodynamics and safety of different intravenous doses of molidustat and to identify the most appropriate intravenous dose of molidustat to be used in part 2 of the study. Part 2 had a randomized, open‐label, twofold cross‐over design and aimed to evaluate the pharmacokinetic profile (particularly the absolute bioavailability), pharmacodynamics and safety of molidustat administered orally as IR tablets compared with intravenous administration.
2.4.2. Participants
Participants eligible for inclusion were healthy white men, 18‐45 years of age at the screening visit, with a BMI of 18‐29.9 kg/m2, and the ability to understand and follow study‐related instructions. Key exclusion criteria included: pre‐existing diseases which may affect absorption, distribution, metabolism or elimination of the study drug; regular use of medicines; donation of blood in the 4 weeks (>100 mL) or 3 months (>500 mL) before the first study drug administration; systolic blood pressure <100 mmHg or >145 mmHg; diastolic blood pressure <50 mmHg or >95 mmHg; heart rate <45 bpm or >95 bpm; and participation in another clinical study during the preceding 3 months.
2.4.3. Study drug administration
In part 1, a single dose of molidustat was administered under fasting conditions as a 30 mL intravenous (iv) infusion over 30 minutes in three consecutive dose steps (1, 5 and 25 mg) with four participants per dose (n = 12); dose escalation was performed only after pharmacokinetic and safety assessment of the previous dose. In part 2, two doses of molidustat, one oral 50 mg dose (2 × 25 mg IR tablets) and one 25 mg dose administered as a 30 mL iv infusion over 30 minutes, were administered to 16 participants under fasting conditions in a cross‐over design with balanced randomization and a wash‐out phase of at least 96 hours between doses. Participants stayed in‐house on two occasions from 1 day before scheduled dose administration (approximately 14 hours before dosing) until 2 days after dose administration.
2.4.4. Sample collection
In parts 1 and 2, blood sampling for pharmacokinetic analysis was conducted: before dose administration; 10, 20, 30, 40 and 50 minutes after dose administration; and 1, 1.5, 2, 3, 4, 6, 8, 12, 24, 30, 36 and 48 hours after dose administration. Blood sampling for pharmacodynamic analysis (endogenous EPO) was performed before dose administration and 4, 6, 8, 12 and 24 hours after dose administration.
In part 2 only, urine was sampled for pharmacokinetic analysis before dose administration and in the intervals 0‐4, 4‐8, 8‐12, 12‐24 and 24‐48 hours after dose administration.
2.4.5. Determination of molidustat and M‐1 concentration
The concentrations of molidustat and its metabolite M‐1 were determined in plasma after protein precipitation with acetonitrile/water/TFA, including an internal standard, and subsequent filtration followed by separation employing LC–MS/MS. The urine samples were diluted 1 + 9 with blank plasma before work‐up, and the plasma method was applied for the work‐up and analysis of the diluted samples.
The calibration range of the procedure in plasma for both analytes was 0.200‐200 μg/L. QC samples (0.500‐160 μg/L) and dilution QC samples (4000‐40 000 μg/L) were determined with an accuracy of 91.2%‐99.3% (molidustat) and 90.6%‐96.5% (M‐1) and a precision of 4.2%‐8.4% (molidustat) and 3.4%‐6.7% (M‐1).The calibration range of the procedure in urine for both analytes was 0.200‐200 μg/Lin diluted samples, corresponding to 2.00‐2000 μg/L for undiluted samples. QC samples (5.00‐1600 μg/L) and dilution QC samples (16 000‐160 000 μg/L) were determined with an accuracy of 93.8%‐101% (molidustat) and 88.8%‐103% (M‐1) and a precision of 2.3%‐5.0% (molidustat) and 2.7%‐7.8% (M‐1).
2.4.6. Pharmacokinetic analysis
The pharmacokinetic parameters were calculated using the model‐independent (compartment‐free) method and WinNonlin (version 5.3, Pharsight Corporation) in conjunction with Automation Extension (Bayer Pharma AG).
Based on the plasma and urine concentration‐time data, the following pharmacokinetic parameters were calculated in part 1: AUC, AUC(0‐t last), AUC normalized by dose (AUC/D), C max, C max normalized by dose (C max/D), t max, t½, CL, volume of distribution at steady state (V ss) and volume of distribution during terminal phase (V z). In part 2, the following pharmacokinetic parameters were calculated for intravenous treatment: AUC, AUC(0‐t last), AUC/D, C max, C max/D, t max, t½, CL, renal clearance (CLR), V ss, V z, mean residence time (MRT) after intravenous administration (MRTiv) and A E,ur. For oral treatment, the pharmacokinetic parameters calculated were AUC, AUC(0‐t last), AUC/D, C max, C max/D, t max, t½, CL/F, CLR, V z after extravascular administration (V z/F), MRT and A E,ur.
Summary statistics for concentrations were calculated if two thirds of individual values were greater than the LLOQ. Concentration values below the LLOQ were imputed by dividing the LLOQ by two. Pharmacokinetic parameters are presented as the geometric mean, geometric %CV and range, unless otherwise stated.
In order to investigate the absolute bioavailability, an explorative analysis of variance (ANOVA) was applied to the logarithm of plasma AUC/D of molidustat from part 2. Point estimates and 90% confidence intervals (CIs) for the “oral dose/intravenous dose” ratios of the pharmacokinetic parameters were calculated by re‐transformation of the least‐squares mean differences and 90% CIs for log‐transformed pharmacokinetic parameters between the oral and intravenous dose derived from the ANOVA. Only participants with valid pharmacokinetic profiles for both doses in part 2 were included.
To compare the AUC of metabolite M‐1 and the AUC of molidustat, the metabolic ratio (MR) was calculated for the molecular weight (MW)‐adjusted AUCs:
The MWs were 314.31 g/mol for molidustat and 490.44 g/mol for metabolite M‐1.
2.4.7. Determination of EPO values
To assess pharmacodynamic effects following administration of molidustat, endogenous EPO values were measured in serum. EPO values were measured by a solid‐phase, two‐site, one‐cycle chemiluminescent enzyme immunometric assay (IMMULITE, Siemens Healthcare Diagnostics), as previously described. 14
2.4.8. Pharmacodynamic analysis
Pharmacodynamic data were summarized by treatment and sampling time‐points using descriptive statistics. The parameters calculated for EPO included C max of absolute values, C max of difference‐to‐baseline adjusted EPO, C max of ratio‐to‐baseline adjusted EPO, AUC(0‐24) of absolute EPO values, AUC(0‐24) of difference‐to‐baseline adjusted EPO and t max. Episodes of the curve below zero were excluded for calculation of the AUCs, and limits of these episodes were determined using linear interpolation.
2.4.9. Safety
Any AEs occurring during the study were recorded and classified by seriousness, intensity and likelihood of a causal relationship to the administration of the study drug. Other safety assessments conducted included physical examination, ECG, measurement of vital signs and clinical laboratory tests. Data for the administration of molidustat 25 mg iv from part 1 and part 2 were pooled for all safety analyses.
3. RESULTS
3.1. Mass balance study
3.1.1. Pharmacokinetics of molidustat in plasma
The concentration‐time profiles and pharmacokinetic parameters of molidustat in plasma following oral administration of molidust 25 mg PEG solution (n = 4) are shown in Figure 1 and Table 1, respectively. Following administration, molidustat was rapidly absorbed (median t max 0.375 hours; range, 0.250‐1.00 hours). After attainment of C max, molidustat concentrations declined with a biphasic profile and an apparent t½ of 11.5 hours. Molidustat plasma concentrations were measurable up to 36 hours after dose administration in two participants and up to 48 hours after dose administration in the remaining two participants (LLOQ 0.1 µg/L).
Figure 1.

Concentrations of molidustat in plasma (µg/L) and of radioactivity in plasma and blood (µgEq/L) following a single oral dose of [14C]molidustat 25 mg (geometric mean/SD, semi‐logarithmic scale, n = 4). LLOQ, lower limit of quantification; SD, standard deviation
Table 1.
Pharmacokinetic parameters of molidustat in plasma and of total radioactivity in plasma and whole blood after administration of an oral dose of [14C]molidustat 25 mg as a PEG solution in healthy male participants (data presented as geometric mean/%CV[range] unless otherwise stated, n = 4)
| Parameter | Unit a | Molidustat | Total radioactivity | |
|---|---|---|---|---|
| Plasma | Plasma | Whole blood | ||
| AUC | μg*h/L | 470/33.7 (289‐584) | — | — |
| AUC(0‐t last) | μg*h/L | 465/34.7 (282‐582) | 2630/23.1 (2090‐3590) | 1350/24.7 (1020‐1830) |
| AUC(0‐12) | μg*h/L | 443/34.8 (268‐554) | 2530/20.4 (2040‐3310) | 1330/22.8 (1020‐1760) |
| C max | µg/L | 282/21.9 (238‐387) | 577/12.1 (504‐650) | 303/13.3 (262‐347) |
| t max | h | 0.375 (0.250‐1.00) b | 1.00 (1.00‐1.00) b | 1.00 (1.00‐1.00) b |
| t½ | h | 11.5/26.2 (8.74‐16.2) | — | — |
| CL/F | L/h | 53.2/33.7 (42.8‐86.6) | — | — |
Abbreviations: AUC(0‐12), AUC from 0 to 12 h; AUC(0‐t last), AUC to the last data point above the lower limit of quantification; AUC, area under the concentration‐time curve; CL/F, total body clearance calculated after extravascular administration; C max, maximum observed plasma concentration; CV, coefficient of variation; PEG, polyethylene glycol; t½, apparent terminal half‐life; t max, time to C max.
The units are μgEq*h/L for total radioactivity AUC, AUC(0‐t last) and AUC(0‐12), and µgEq/L for total radioactivity C max.
Median (range).
3.1.2. Total radioactivity in blood and plasma
The concentration‐time profiles and pharmacokinetic parameters of total radioactivity in plasma and whole blood following oral administration of molidustat 25 mg PEG solution (n = 4) are shown in Figure 1 and Table 1, respectively. Total radioactivity levels in plasma and whole blood peaked 1 hour after dose administration and were measurable in at least two thirds of the participants up to 15 hours after dose administration in plasma and up to 12 hours after dose administration in whole blood (LLOQ 23 dpm). The whole blood‐to‐plasma ratios for total radioactivity were 0.525 for C max and 0.513 for AUC. The AUC of molidustat accounted for 17.7% of the AUC(0‐t last) of total radioactivity, suggesting that metabolites represent a major proportion of the circulating radioactivity.
3.1.3. Excretion and mass balance
The mean total radioactivity recovered from excreta (urine and faeces) was 97.0% (range, 96.5%‐97.5%) within 120 hours after dose administration, indicating almost complete recovery of administered radioactivity (Table 2). No further radioactivity was detected after 120 hours. The majority of radioactivity was present in urine (90.7% [range, 88.1%‐94.2%]) with only minor excretion via faeces (6.27% [range, 2.85%‐8.57%]). The cumulative amount of molidustat‐associated radioactivity excreted is shown in Figure 2. Of radioactivity recovered from urine and faeces, most was recovered within 12 hours (mean, 83.4%) and within 48 hours (mean, 4.52%), respectively, after dose administration. One sample of vomitus was collected from a participant approximately 38 hours after dose administration; however, there was no detectable radioactivity in this sample and it was excluded from further analysis.
Table 2.
Total radioactivity recovered in urine and faeces for molidustat and its metabolites after administration of an oral dose of [14C]molidustat 25 mg as a PEG solution in healthy male participants (n = 4)
| % of dose recovered/SD (range) | |
|---|---|
| 0‐120 h | |
| Total balance | 97.0/0.453 (96.5‐97.5) |
| Urine | 90.7/2.75 (88.1‐94.2) |
| Molidustat | 4.12 |
| M‐1 | 85.2 |
| M‐5 | 0.409 |
| Faeces | 6.27/2.73 (2.85‐8.57) |
| Molidustat | 5.85 |
Abbreviations: PEG, polyethylene glycol; SD, standard deviation.
Figure 2.

Arithmetic mean cumulative amounts of [14C]molidustat‐associated radioactivity (%) excreted in urine and faeces following a single oral dose of [14C]molidustat 25 mg (n = 4)
3.1.4. Safety
One participant reported three treatment‐emergent adverse events (TEAEs; abdominal discomfort, flatulence and vomiting); all were of mild intensity, considered unrelated to the study drug, and were completely resolved by the end of the study without the need for further therapeutic measures (Table S1). No clinically relevant changes in laboratory values, vital signs or ECG findings were observed. Overall, molidustat PEG solution was well tolerated in healthy participants after administration of a single oral 25 mg dose.
3.2. Metabolite profiling
3.2.1. Plasma
The representative HPLC profile in plasma following a single oral dose of molidustat 25 mg is shown in Figure S1A. Molidustat and the N‐glucuronide metabolite M‐1 were the only detectable components. Based on HPLC–LSC analytics, molidustat and M‐1 represented on average 17.4% (range, 10.9%‐24.6%) and 80.2% (range, 75.5%‐86.7%) of the AUC of the total radioactivity in plasma, respectively, which aligned well with the data obtained by LC–MS/MS for molidustat (17.7%).
3.2.2. Excreta
Representative HPLC profiles of urine and faeces following a single oral dose of molidustat 25 mg are shown in Figure S1B,C, respectively. More than 95% of the administered radioactivity present in all investigated excreta could be assigned to known structures (Table 2). Metabolite M‐1 was the predominant component of the radioactivity excreted in urine (≥93%), accounting for 85.2% of the administered dose. Excretion of molidustat only accounted for 4.12% of the administered dose. A second metabolite, M‐5, which was presumed to have arisen from oxidative metabolism and subsequent N‐glucuronidation, was also present as a minor component in urine (0.409% of the dose).
Molidustat represented the majority of excreted radioactivity in faeces (>93%), accounting for 5.85% of the administered dose. The proposed biotransformation pathway of molidustat in vivo is shown in Figure 3.
Figure 3.

Proposed biotransformation pathway of molidustat. aPosition of 14C label
3.3. Absolute bioavailability study
3.3.1. Determination of the pharmacokinetics, safety and tolerability of intravenous molidustat doses (part 1 of study 2)
The concentration‐time profiles and pharmacokinetic parameters of molidustat in plasma observed in part 1 of study 2 are shown in Figure S2 and Table S2, respectively. For all three administered doses, biexponential declines in the plasma concentrations were observed after the peaks at the end of the infusion. Plasma concentrations of molidustat were measurable in at least two thirds of participants until 6, 12 and 24 hours after administration for the 1, 5 and 25 mg doses, respectively. Both C max and AUC increased in a dose‐dependent manner with similar dose‐normalized values. From 1 to 25 mg, apparent t½ increased from 1.34 to 4.01 hours owing to prolonged observation time. CL ranged from 28.9 L/h to 34.5 L/h with no dose‐related differences; V ss was only slightly increased in participants treated with higher doses, ranging from 39.3 L (1 mg) to 50.0 L (25 mg). A molidustat 25 mg iv infusion over 30 minutes was selected for use in part 2 of the study based on the exposure and safety profile observed.
3.3.2. Pharmacokinetics and absolute bioavailability of molidustat (part 2 of study 2)
The concentration‐time profiles of molidustat following administration of a single 30‐minute infusion of molidustat 25 mg iv or oral molidustat 50 mg are shown in Figure 4A. The shapes of the plasma concentration‐time curves for molidustat were similar, with only small differences between the two treatments in the early phase. The respective pharmacokinetic parameters for each formulation administered in part 2 of the study are shown in Table 3. The absolute bioavailability of molidustat 50 mg administered orally as an IR tablet formulation was 59.0% (90% CI: 55.3%‐63.0%). Apparent t½ was prolonged for oral administration compared with intravenous administration (10.1 hours vs 4.81 hours), and MRT was longer than MRTiv (3.92 hours vs 1.63 hours). Following intravenous administration, V ss and V z were 46.9 L and 199 L, respectively, and CL was 28.7 L/h. Following oral administration, V z/F was 707 L and CL/F was 48.6 L/h. CLR (1.30 L/h vs 1.45 L/h) and A E,ur (6.25% vs 4.10%) were similar for intravenous and oral administration.
Figure 4.
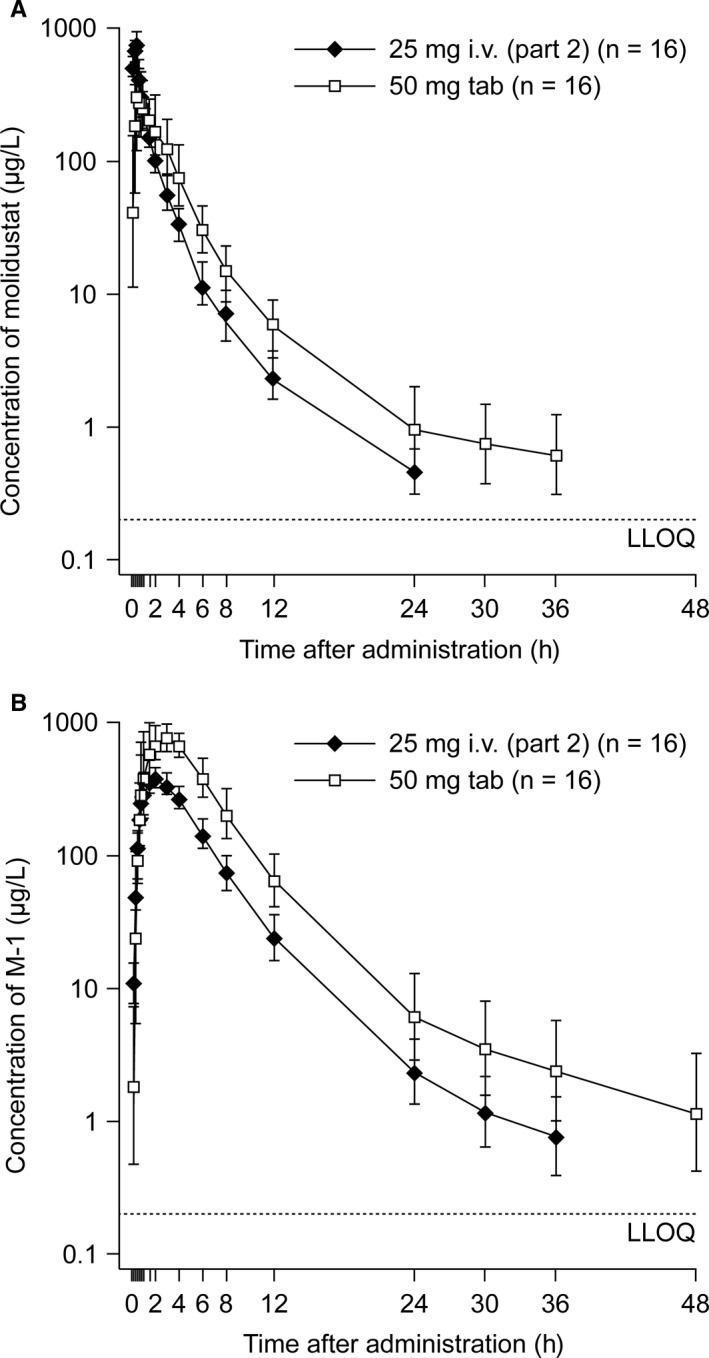
Plasma concentration‐time profiles of molidustat (A) and M‐1 (B) following a single molidustat 25 mg iv infusion over 30 min and a single oral dose of molidustat 50 mg, up to 48 h after each dose (geometric mean/SD, [part 2 of study 2], n = 16, semi‐logarithmic scale). iv, intravenous; LLOQ, lower limit of quantification; SD, standard deviation; tab, tablet
Table 3.
Pharmacokinetic parameters of molidustat in plasma after administration of molidustat 25 mg iv infusion over 30 minutes and a single oral dose of molidustat 50 mg in a cross‐over design in part 2 of study 2 (data presented as geometric mean/%CV [range] unless otherwise stated, n = 16)
| Parameter | Unit | 25 mg iv | 50 mg oral tablet |
|---|---|---|---|
| F | % | — | 59.0 (55.3‐63.0) a |
| AUC | µg*h/L | 871/17.7 (648‐1190) | 1030/23.9 (584‐1540) |
| AUC(0‐t last) | µg*h/L | 868/17.7 (644‐1180) | 1020/23.4 (581‐1490) |
| AUC/D | h/L*10‐3 | 34.8/17.7 (25.9‐47.5) | 20.6/23.9 (11.7‐30.8) |
| C max | µg/L | 798/16.9 (637‐1100) | 503/54.2 (191‐916) |
| C max/D | /L*10‐3 | 31.9/16.9 (25.5‐43.9) | 10.1/54.2 (3.81‐18.3) |
| t max | h | 0.500 (0.333‐0.517) b | 0.583 (0.333‐3.00) b |
| t½ | h | 4.81/53.2 (2.15‐15.0) | 10.1/85.4 (2.81‐31.3) |
| CL | L/h | 28.7/17.7 (21.1‐38.6) | — |
| CL/F | L/h | — | 48.6/23.9 (32.5‐85.7) |
| CLR | L/h | 1.30/127 (0.150‐4.52) | 1.45/113 (0.205‐4.87) |
| V ss | L | 46.9/20.8 (27.2‐67.3) | — |
| V z | L | 199/51.3 (68.3‐512) | — |
| V z/F | L | — | 707/80.2 (147‐1840) |
| MRTiv | h | 1.63/23.2 (1.18‐2.84) | — |
| MRT | h | — | 3.92/38.0 (2.22‐7.59) |
| A E,ur | % | 6.25/4.91 (0.714‐18.2) c | 4.10/3.05 (0.374‐10.6) c |
Abbreviations: A E,ur, amount excreted in urine; AUC(0‐t last), AUC to the last data point above the lower limit of quantification; AUC, area under the concentration‐time curve; AUC/D, AUC normalized by dose; CL, total body clearance; CL/F, total body clearance calculated after extravascular administration; CLR, renal clearance; C max, maximum plasma concentration; C max/D, C max normalized by dose; CV, coefficient of variation; F, absolute bioavailability; iv, intravenous; MRT, mean residence time; MRTiv, MRT after intravenous administration; PEG, polyethylene glycol; t½, apparent terminal half‐life; t max, time to C max; V ss, volume of distribution at steady state; V z, volume of distribution during terminal phase; V z/F, apparent volume of distribution during terminal phase after extravascular administration.
Point estimate (90% confidence interval).
Median (range).
Arithmetic mean ± standard deviation.
3.3.3. Pharmacokinetics of M‐1 (part 2 of study 2)
The concentration‐time curves observed for metabolite M‐1 in plasma following a single administration of either molidustat 25 mg iv or oral molidustat 50 mg are shown in Figure 4B. The shapes of the concentration‐time curves for M‐1 were similar regardless of the route of administration. The pharmacokinetic parameters of M‐1 in plasma following intravenous or oral administration are shown in Table 4. M‐1 was formed quickly with a median t max of 2.00 and 3.00 hours for intravenous and oral administration, respectively. Both AUC and C max of M‐1 were higher for oral administration than for intravenous infusion, but the dose‐normalized values were similar. The apparent t½ of M‐1 was longer following the oral dose (11.1 hours) than the intravenous dose (7.95 hours). CLR and A E,ur were similar for both routes of administration.
Table 4.
Pharmacokinetic parameters of M‐1 in plasma after administration of molidustat 25 mg iv infusion and an oral dose of molidustat 50 mg in part 2 of study 2 (data presented as geometric mean/%CV [range] unless otherwise stated, n = 16)
| Parameter | Unit | 25 mg iv (n = 16) | 50 mg oral tablet (n = 16) |
|---|---|---|---|
| AUC | µg*h/L | 2110/19.0 (1440‐2750) | 4920/16.3 (3610‐6230) |
| AUC(0‐t last) | µg*h/L | 2100/18.9 (1440‐2740) | 4880/16.0 (3610‐6060) |
| AUC/D | h/L*10‐3 | 54.1/19.0 (37.0‐70.4) | 63.0/16.3 (46.3‐799) |
| C max | µg/L | 393/17.0 (295‐528) | 868/16.5 (654‐1120) |
| C max/D | /L*10‐3 | 10.1/17.0 (7.57‐13.5) | 11.1/16.5 (8.38‐14.4) |
| t max | h | 2.00 (1.50‐3.00) a | 3.00 (1.50‐4.02) a |
| t½ | h | 7.95/64.9 (3.47‐26.9) | 11.1/59.4 (4.2‐24.6) |
| MR | 1.55/18.3 (0.922‐1.91) | 3.07/26.7 (1.68‐4.75) | |
| CLR | L/h | 10.2/17.4 (8.09‐15.6) | 8.59/24.5 (5.07‐12.5) |
| A E,ur | % | 55.7/8.04 (42.4‐70.1) b | 55.1/12.2 (27.9‐81.1) b |
Abbreviations: A E,ur, amount excreted in urine; AUC(0‐t last), AUC to the last data point above the lower limit of quantification; AUC, area under the concentration‐time curve; AUC/D, AUC normalized by dose; CLR, renal clearance; C max, maximum plasma concentration; C max/D, C max normalized by dose; CV, coefficient of variation; iv, intravenous; MR, metabolic ratio; t½, apparent terminal half‐life; t max, time to C max.
Median (range).
Arithmetic mean ± standard deviation.
3.3.4. Pharmacodynamics
Endogenous EPO values were measured in both part 1 and part 2 of study 2. In part 1, all doses of molidustat (1, 5 and 25 mg iv) increased geometric mean EPO values, with peak values reached between 6 hours (25 mg) and 12 hours (1 mg) after dose administration. Irrespective of dose, EPO values had decreased to baseline 24 hours after administration. Difference‐to‐baseline adjusted EPO geometric mean C max and AUC(0‐24) were similar for the 1 mg (5.62 IU/L and 67.4 IU/L*h, respectively) and 5 mg (6.05 IU/L and 72.4 IU/L*h, respectively) doses and were higher for the 25 mg dose (15.8 IU/L and 195 IU/L*h, respectively; Table S3). In part 2 of the study, geometric mean EPO values increased following intravenous and oral administration of molidustat, with peak values reached after 6 hours (25 mg iv) and 8 hours (50 mg oral) after dose administration (Figure S3). Absolute geometric mean values of EPO C max and AUC(0‐24) were higher following administration of the molidustat 50 mg oral dose (34.4 IU/L and 552 IU/L*h, respectively) than following the 25 mg iv infusion (25.4 IU/L and 427 IU/L*h, respectively; Table S3). Difference‐to‐baseline adjusted EPO geometric mean C max and AUC(0‐24) values were also higher for the molidustat 50 mg oral dose (25.2 IU/L and 332 IU/L*h, respectively) than for the 25 mg iv infusion (17.7 IU/L and 245 IU/L*h, respectively).
3.3.5. Safety
Safety data for the 12 participants assigned to treatment in part 1 and the 16 randomized participants in part 2 were pooled for evaluation (n = 28). Overall, five participants (17.9%) experienced TEAEs, including four who received an infusion of molidustat 25 mg iv and one who received the 50 mg oral dose. All TEAEs were of mild or moderate intensity and were not considered to be drug‐related by the investigator (Table S1). The only TEAE that was reported in more than one participant was headache (n = 3). There were no serious AEs or deaths. No treatment‐emergent clinically relevant changes in clinical laboratory parameters were observed. No clinically relevant or dose‐dependent changes in heart rate or blood pressure were observed.
4. DISCUSSION
Understanding the absorption, distribution, metabolism and excretion of a drug in healthy participants can provide important insights regarding the potential intrinsic (eg renal and hepatic impairment) and extrinsic factors influencing pharmacokinetic parameters.
In line with previous studies, absorption of molidustat was rapid when administered orally. 14 The absolute bioavailability (F) of molidustat is 59% when administered as oral IR tablets at a dose of 50 mg. The absolute bioavailability is the product of the fraction absorbed (F abs), the non‐metabolized fraction in the gut (F g) and the non‐metabolized fraction in the liver during first pass (F h), that is F = F abs × F g × F h. Because F abs is high (≥90% in study 1; Table 2), the product of F g × F h is between 0.59 and 0.65, indicating that 35%‐41% of the administered molidustat dose is metabolized in the gut wall and/or liver during first pass. Given that the mean CL after intravenous administration in part 2 was 28.7 L/h and the CLR was 1.3 L/h, the systemic non‐renal plasma clearance can be estimated as 27.4 L/h. Assuming that non‐renal plasma clearance mainly occurs in the liver (hepatic clearance) and taking into account the blood‐to‐plasma ratio of 0.621 determined in vitro (data on file), a hepatic blood clearance of 44.1 L/h can be calculated; with a hepatic blood flow of 110 L/h, this results in an estimated extraction ratio of 0.40 and an F h of 0.60. The observed absolute bioavailability of 59% matches perfectly with the calculated value for F h, indicating that F abs and F g are nearly 1.
Based on the total radioactivity whole blood‐to‐plasma ratio, molidustat‐related radioactivity was found to be predominantly distributed in plasma rather than in red blood cells. V ss was 46.9 L following intravenous administration of molidustat in part 2 of study 2, which is within the range of total body water (approximately 0.55‐0.60 L/kg body‐weight). V z was 199 L, which is larger than the volume of total body water; however, the peripheral compartment is less relevant to molidustat distribution because the terminal phase of the molidustat plasma concentration‐time profile starts approximately 12‐24 h after dosing (Figure 4A) and molidustat is rapidly eliminated (>80% of molidustat‐associated radioactivity excreted within 12 hours; Figure 2).
Figure 3 shows the metabolism of molidustat. The majority of molidustat (>85%) is metabolized to the N‐glucuronide M‐1, whereas a minor amount is metabolized to M‐5 (<1%), presumably via oxidative metabolism followed by glucuronidation. The uridine diphosphate glucuronosyltransferase (UGT) isoforms UGT1A1 and UGT1A9 have been identified as the predominant isoforms for the glucuronidation of molidustat (data on file).
In the mass balance study, there was almost complete recovery (97.0%) of the administered radioactivity within 120 hours after dose administration, with the majority recovered from urine. Elimination was rapid, with 83.4% of radioactivity recovered in urine within 12 hours and 4.52% recovered in faeces within 48 hours after dose administration. The amount of molidustat excreted unchanged in urine was lower than expected based on the glomerular filtration rate, body‐weight and observed AUC of molidustat for each participant. This may be due either to slight active reabsorption of molidustat into plasma or glucuronidation of molidustat in the kidneys by UGT1A9, which is a highly expressed UGT isoform in the kidney. 17 However, this is not considered to be clinically relevant. Given that more than 80% of molidustat‐associated radioactivity is eliminated within 12 hours, the apparent terminal phase (beginning approximately 24 hours after dose administration; Figure 4A) is not of relevance for dosing considerations, because it only represents a minor proportion of molidustat disposition.
The mean CL of molidustat following intravenous administration ranged from 28.7 L/h to 34.5 L/h (parts 1 and 2 of study 2), resulting in an effective half‐life of approximately 1 hour. Renal elimination of molidustat was low for both intravenous and oral tablet administration, although a higher percentage of the dose was eliminated in urine as unchanged molidustat after intravenous administration (6.25%) than after the oral tablet dose (4.10%). Renal elimination of M‐1 was similar for both routes of administration (approximately 55%). These results suggest that renal impairment is unlikely to influence the pharmacokinetic parameters of molidustat significantly.
In study 2 (parts 1 and 2), all doses of molidustat (1, 5 and 25 mg) administered as an intravenous infusion and the 50 mg single oral tablet dose increased levels of EPO, with mean peak values reached between 6 and 12 hours after dose administration. EPO C max was higher for the oral 50 mg IR tablet dose (geometric mean, 34.4 IU/L) than for the 25 mg iv dose (geometric mean, 25.4 IU/L), but the difference was smaller for difference‐to‐baseline adjusted C max (geometric mean, 25.5 IU/L vs 17.7 IU/L) and ratio‐to‐baseline C max (geometric mean, 4.02 vs 3.56). Mean EPO AUC(0‐24) and difference‐to‐baseline adjusted AUC(0‐24) EPO values were also higher for the oral 50 mg IR tablet dose than the 25 mg iv dose (Table S3). These differences may be explained by the higher AUC of molidustat observed following administration of the 50 mg oral tablet than the 25 mg iv dose of molidustat (1030 µg*h/L vs 871 µg*h/L).
Study 1 used a relatively low number of participants (n = 4); however, this sample size was sufficient for our objectives. For part 1 of study 2, the small sample size (n = 4 per dose group) and variability in EPO values impairs robust interpretation of the data.
In conclusion, molidustat has an absolute bioavailability of 59% when orally administered as an IR tablet formulation at a dose of 50 mg. Following intravenous administration, CL and V ss were 28.7‐34.5 L/h and 39.3‐50.0 L, respectively, indicating a moderate extraction ratio of 0.4 by the liver and distribution primarily in total body water. Molidustat is predominantly cleared by N‐glucuronidation to M‐1 and excreted in urine, with only minor amounts of unchanged molidustat excreted in urine and faeces. As expected, based on the mode of action, all doses of molidustat transiently increased endogenous levels of EPO. Molidustat was well tolerated by participants in both studies, with all reported TEAEs considered unrelated to the study drug.
CONFLICT OF INTEREST
Silvia Lentini, Dorina van der Mey, Armin Kern, Uwe Thuss, Andreas Kaiser and Michael Gerisch are employed by Bayer AG. Kumi Matsuno is employed by Bayer Yakuhin Ltd. Dorina van der Mey and Michael Gerisch have stock options for Bayer AG, which are unrelated to primary employment. Medical writing support was provided by Cerys Evans, PhD, of Oxford PharmaGenesis, Oxford, UK, and was funded by Bayer Yakuhin Ltd.
Supporting information
Supporting Information
ACKNOWLEDGEMENTS
The authors thank Martina Blombach for technical support in analysing the mass balance studies and Dieter Lang and Peter Schmitt for structural elucidation of metabolites.
Lentini S, van der Mey D, Kern A, et al. Absorption, distribution, metabolism and excretion of molidustat in healthy participants. Basic Clin Pharmacol Toxicol. 2020;127:221–233. 10.1111/bcpt.13409
Lentini and van der Mey contributed equally to this manuscript and are listed in alphabetical order by surname.
DATA AVAILABILITY STATEMENT
Data from this study are not openly available.
REFERENCES
- 1. Bunn HF. Erythropoietin. Cold Spring Harb Perspect Med. 2013;3:a011619. [DOI] [PMC free article] [PubMed] [Google Scholar]
- 2. Babitt JL, Lin HY. Mechanisms of anemia in CKD. J Am Soc Nephrol. 2012;23:1631‐1634. [DOI] [PMC free article] [PubMed] [Google Scholar]
- 3. Astor BC, Muntner P, Levin A, Eustace JA, Coresh J. Association of kidney function with anemia: the Third National Health and Nutrition Examination Survey (1988–1994). Arch Intern Med. 2002;162:1401‐1408. [DOI] [PubMed] [Google Scholar]
- 4. Hsu CY, McCulloch CE, Curhan GC. Epidemiology of anemia associated with chronic renal insufficiency among adults in the United States: results from the Third National Health and Nutrition Examination Survey. J Am Soc Nephrol. 2002;13:504‐510. [DOI] [PubMed] [Google Scholar]
- 5. Yamamoto H, Nishi S, Tomo T, et al. 2015 Japanese Society for Dialysis Therapy: guidelines for renal anemia in chronic kidney disease. Renal Replacement Therapy 2017;3:36. [Google Scholar]
- 6. Singh AK, Szczech L, Tang KL, et al. Correction of anemia with epoetin alfa in chronic kidney disease. N Engl J Med 2006;355:2085‐2098. [DOI] [PubMed] [Google Scholar]
- 7. Bello NA, Lewis EF, Desai AS, et al. Increased risk of stroke with darbepoetin alfa in anaemic heart failure patients with diabetes and chronic kidney disease. Eur J Heart Fail 2015;17:1201‐1207. [DOI] [PMC free article] [PubMed] [Google Scholar]
- 8. Pfeffer MA, Burdmann EA, Chen CY, et al. A trial of darbepoetin alfa in type 2 diabetes and chronic kidney disease. N Engl J Med 2009;361:2019‐2032. [DOI] [PubMed] [Google Scholar]
- 9. Unger EF, Thompson AM, Blank MJ, Temple R. Erythropoiesis‐stimulating agents – time for a reevaluation. N Eng J Med 2010;362:189‐192. [DOI] [PubMed] [Google Scholar]
- 10. Koury MJ, Haase VH. Anaemia in kidney disease: harnessing hypoxia responses for therapy. Nat Rev Nephrol 2015;11:394‐410. [DOI] [PMC free article] [PubMed] [Google Scholar]
- 11. Flamme I, Oehme F, Ellinghaus P, Jeske M, Keldenich J, Thuss U. Mimicking hypoxia to treat anemia: HIF‐stabilizer BAY 85–3934 (molidustat) stimulates erythropoietin production without hypertensive effects. PLoS ONE 2014;9:e111838. [DOI] [PMC free article] [PubMed] [Google Scholar]
- 12. Beck H, Jeske M, Thede K, et al. Discovery of molidustat (BAY 85‐3934): a small‐molecule oral HIF‐prolyl hydroxylase (HIF‐PH) inhibitor for the treatment of renal anemia. ChemMedChem. 2018;13:988‐1003. [DOI] [PMC free article] [PubMed] [Google Scholar]
- 13. Macdougall IC, Akizawa T, Berns JS, Bernhardt T, Krueger T. Effects of molidustat in the treatment of anemia in CKD. Clin J Am Soc Nephrol. 2019;14:28‐39. [DOI] [PMC free article] [PubMed] [Google Scholar]
- 14. Böttcher M, Lentini S, Arens ER, et al. First‐in‐man–proof of concept study with molidustat: a novel selective oral HIF‐prolyl hydroxylase inhibitor for the treatment of renal anaemia. Br J Clin Pharmacol. 2018;84:1557‐1565. [DOI] [PMC free article] [PubMed] [Google Scholar]
- 15. Dib J, Mongongu C, Buisson C, et al. Mass spectrometric characterization of the hypoxia‐inducible factor (HIF) stabilizer drug candidate BAY 85–3934 (molidustat) and its glucuronidated metabolite BAY‐348, and their implementation into routine doping controls. Drug Test Anal. 2017;9:61‐67. [DOI] [PubMed] [Google Scholar]
- 16. Tveden‐Nyborg P, Bergmann TK, Lykkesfeldt J. Basic & Clinical Pharmacology & Toxicology policy for experimental and clinical studies. Basic Clin Pharmacol Toxicol. 2018;123:233‐235. [DOI] [PubMed] [Google Scholar]
- 17. Margaillan G, Rouleau M, Fallon JK, et al. Quantitative profiling of human renal UDP‐glucuronosyltransferases and glucuronidation activity: a comparison of normal and tumoral kidney tissues. Drug Metab Dispos. 2015;43:611‐619. [DOI] [PMC free article] [PubMed] [Google Scholar]
Associated Data
This section collects any data citations, data availability statements, or supplementary materials included in this article.
Supplementary Materials
Supporting Information
Data Availability Statement
Data from this study are not openly available.