Abstract
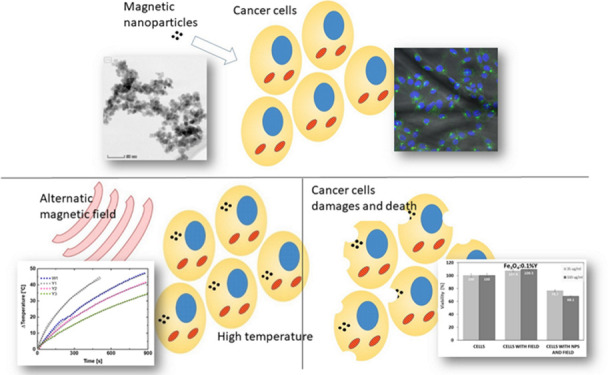
Magnetic nanoparticles of Fe3O4 doped by different amounts of Y3+ (0, 0.1, 1, and 10%) ions were designed to obtain maximum heating efficiency in magnetic hyperthermia for cancer treatment. Single-phase formation was evident by X-ray diffraction measurements. An improved magnetization value was obtained for the Fe3O4 sample with 1% Y3+ doping. The specific absorption rate (SAR) and intrinsic loss of power (ILP) values for prepared colloids were obtained in water. The best results were estimated for Fe3O4 with 0.1% Y3+ ions (SAR = 194 W/g and ILP = 1.85 nHm2/kg for a magnetic field of 16 kA/m with the frequency of 413 kHz). The excellent biocompatibility with low cell cytotoxicity of Fe3O4:Y nanoparticles was observed. Immediately after magnetic hyperthermia treatment with Fe3O4:0.1%Y, a decrease in 4T1 cells’ viability was observed (77% for 35 μg/mL and 68% for 100 μg/mL). These results suggest that nanoparticles of Fe3O4 doped by Y3+ ions are suitable for biomedical applications, especially for hyperthermia treatment.
1. Introduction
Magnetic iron oxide nanoparticles (NPs) already attracted a significant scientific interest due to their exceptional magnetic properties showing great potential in bio-related applications. The most commonly studied are hematite (α-Fe2O3: rhombohedral crystal structure), maghemite (γ-Fe2O3: cubic), and magnetite (Fe3O4), which is isostructural with γ-Fe2O3 with one important feature relying on iron cations having two different valence states (Fe2+ and Fe3+ with a ratio of 1:2). Among all of them, the most interesting are maghemite and magnetite due to their ferrimagnetic character, which by far surpasses the magnetic behavior of hematite. Fe3O4 belongs to the spinel ferrite family with a general chemical formula of AB2O4 and crystallizes in a cubic system (Fd3̅m space group). The main disadvantage in contrast to maghemite can be found as a potential risk of complete Fe2+ oxidation into Fe3+ resulting in a chemical transformation of Fe3O4 (FeFe2O4) into γ-Fe2O3 or even α-Fe2O3.1 Unfortunately, the oxidation step between Fe3O4 and γ-Fe2O3 can be hardly detected by the X-ray powder diffraction technique since their diffraction patterns are pretty much the same and the sample color does not differ that much as well (dark brown or even black). It is much easier to recognize whether Fe3O4 transformed into α-Fe2O3 since the latter one crystallizes in a rhombohedral system (R3̅c) giving a totally different diffraction and there is a significant change in a sample color (from dark almost black brown into red). The importance of this critical issue has several straightforward consequences: (1) change in magnetic behavior, which is critical in view of potential bio-related applications; (2) an oxidation process itself, which leads to the well-known Fenton reaction, creation of the reactive oxide species (ROS), and programmed cell death; and (3) lack of chemical stability of the material itself, which can be detrimental to the engineered material properties (efficacy of the heat induction).
Previous studies have shown that ferrite NPs have already attracted considerable attention due to their outstanding magnetic properties and high prospect in biomedical applications such as magnetic drug delivery, magnetic resonance imaging, magnetic separation, or hyperthermia.2−6 Despite the issues described above, magnetite NPs are used in cancer diagnostics and therapy3,7 and were also approved by the Food and Drug Administration (FDA) as contrast agents in magnetic resonance. In addition, the second and third phases of clinical research using Fe3O4 NPs in hyperthermia as cancer therapy are already carried out in Germany with a lack of noticeable toxic effects.8
Fe3O4 has an inverse spinel structure. Large oxygen ions are tightly packed in a cubic order, while smaller Fe3+ ions fill completely the eight sites of the tetrahedral subnetwork. The octahedral positions are occupied by Fe2+ and Fe3+ ions. Because the magnetic spins of the tetra- and octahedral networks are arranged in the opposite direction, the structure is ferrimagnetic.9 Magnetic properties of magnetite result from the separation of 5d orbitals. Orbitals are divided into subgroups due to the presence of a field of ligands, in this case, oxide. This means that all Fe3+ and Fe2+ ions have one pair of paired electrons and four unpaired electrons. In octahedral coordination (where the d orbit divides into two subgroups Eg and T2g), iron ions are ferromagnetically coupled via a so-called double exchange mechanism. One of the electrons from a paired pair can be exchanged between two octahedral coordinates. In contrast, Fe3+ ions in tetra- and octahedral sites are coupled antiferromagnetically by an oxygen atom, which means that Fe3+ spins zero each other, so only unpaired Fe2+ spins in an octahedral coordination contribute to magnetization.10
The Fe2+ ions in Fe3O4 can be replaced with another divalent transition metal M2+ (for example, M = Zn, Mn, Ni, Co, Cu, etc.), which gives MFe2O4 ferrite an inverted spinel structure. The magnetization is dependent mainly on unpaired d electrons from M2+. However, when M2+ is small enough, MFe2O4 can adopt a spinel structure in which two Fe3+ occupy octahedral sites, and M2+ occupies tetrahedral sites, and there is no anti-ferromagnetic coupling between the two Fe3+ ions. The structure provides a higher magnetization value than that of the reverse spinel structure of MFe2O4.11−16
Iron ion nanoparticles doped with metal ions, such as CoFe2O4, NiFe2O4, and MnFe2O4, have strong magnetic properties and improved, for example, contrast effects in magnetic resonance imaging (MRI), which are much better than those of conventional Fe3O4 NPs.17 Nevertheless, the use of these M2+-doped iron oxide nanoparticles in biomedical research is severely hampered by the high levels of toxicity associated with the presence of these transition metals (Co, Ni, and Mn).18−20
One of the widely studied dopants is Zn ions to iron oxide nanoparticles, which have a high magnetization value, which significantly increases their MRI contrast and hyperthermic effects. Their initial in vitro and in vivo studies showed that Zn2+-doped Fe3O4 is non-toxic and potentially useful in biology and medicine.21,22
Another type of Fe3O4 dopant used to improve magnetic properties is lanthanide ions (Ln3+). Lanthanide ions are an interesting class of dopants due to the unique optical and magnetic properties associated with their f electron configurations.23,24 Magnetite doping can change its magnetic, dielectric, and structural properties by adding, e.g., trivalent cations such as Nd3+, Cr3+, Y3+, or In3+. Rare-earth cations such as La3+, Sm3+, or Dy3+, by substituting Fe3+ in the octahedral position, release iron ions to coordinate in the tetrahedral position, which alleviates the lattice tension. Due to this, the amount and type of Ln3+ doping changed the magnetization, permeability, and electrical resistance of magnetite.25−32 For example, Milanović et al.25 observed decreasing saturation magnetization after In3+ ion doping of ZnFe2O4, but after Y3+ ion doping, they observed increasing magnetization compared with undoped NPs but only for small amount of dopants (0.15%). They suggest that Y3+ ions stabilize Fe3+ ions in the octahedral sites, thus reducing the tendency toward inversion.25
In the work, Fe3O4 NP doping with yttrium ions was used to increase the magnetization of the material for magnetic hyperthermia treatment. The addition of yttrium ions reaches their maximum in the range from 1 to 1.5 mol % (relative to moles of Fe3+). With a further increase of the dopant, the second nanocrystalline phase precipitates. For now, the Fe3O4 NP doping by Y3+ ions was not investigated for a magnetic increase and hyperthermia application.
Hyperthermia is a therapeutic procedure based on heating the selected tissue above normal physiological temperatures. It can be sought as an alternative cancer therapy that induces less side effects in contrast to radio- or chemotherapy. Hyperthermia is usually carried out in two distinct temperature regimes:33−36 (1) at high temperature, above 48 °C for an irreversible treatment of cancer cells. The effect of temperature is drastic and non-reversible, highly efficient but risky due to collateral damages with possible tumor or tissue total ablation upon exceeding the vaporization temperature of water.36,37 (2) A clinically relevant temperature ranging at 41–48 °C for hyperthermia treatment leads to protein denaturation, cell function inactivation, oxidative stress, or rapid necrotic cell death.38 During therapy, cell apoptosis or thermal shock protein expression is induced; tissue processes include changes in pH or perfusion and oxygenation of the tumor microenvironment. The effectiveness of the therapy mainly depends on the achieved temperature, time of exposure, and characteristics of the cancer cells.39
For the most advantageous feature of hyperthermia in neoplastic disease treatment compared with classic techniques like surgery, chemotherapy, and radiotherapy, hyperthermia tends to be less invasive but has to be combined with traditional methods in order to increase overall efficacy. However, treatment toward recovery from cancer requires localized, controlled, and efficient heating. This important task can be fulfilled by designing and developing alternative techniques utilizing nanoparticle-based systems for non-contact heating by specific stimulation for heat induction.
In the case of magnetic nanoparticles for magnetothermal therapy, heating is realized by taking advantage of their magnetic properties. Generally speaking, the effect can be achieved by using an alternating magnetic field (AMF) on NPs, which will eventually heat up inductively due to the following mechanisms originating from power loss under the AMF:
-
(1)
Hysteresis losses during the irreversible magnetization process (usually can be estimated by taking into account the area of the hysteresis loop), which work mostly for particles that are not in the superparamagnetic state (no area of loop, no contribution of this mechanism in total particle heating, a characteristic for particles with a size above the superparamagnetic regime)
-
(2)
Eddy currents, but this depends strongly on the electric conductivity of the material; once the dielectric material is taken into account, this type of loss has very low contribution (ferrites’ case).40
-
(3)
So-called residual losses being identified specifically as Néel and Brownian relaxations, which are strongly dependent on particle size, shape, agglomeration, etc.41
When the particles are in a superparamagnetic state, i.e., they are below the certain critical particle size (for Fe3O4, approximately 30 nm),42 residual losses (Néel and Brownian relaxations) upon magnetization–demagnetization cycles5 are dominant in heat generation. The Néel relaxation mechanism refers to the rotating of the magnetic moments within each particle (inner particle relaxation), whereas Brownian relaxation is connected with rotation of the entire nanoparticle with the setting of magnetic moments in accordance with the field direction (outer particle relaxation).43,44
The magnetic nanoparticles (MNPs) are introduced into the cells by endocytosis. The leaky vasculature of cancerous tissue absorbs larger amounts of MNPs than those of normal tissue.45,46 Moreover, the biomolecules such as antibodies can be easily attached to the MNPs. In addition, MNPs like iron oxides can be used as a magnetic factor in multifunctional nanoconstructs for use in diagnostic imaging capabilities and targeting drugs.47,48
The main aim of present studies was to synthesize stable Fe3O4 NPs doped with Y3+ ions by using a fast and efficient single-step process, which will be suitable for magnetic hyperthermia treatment with one ultimate goal relying on investigations of cell viability after magnetic hyperthermia treatment on breast cancer 4T1 cells.
2. Experimental Methods
2.1. Synthesis
All chemicals were purchased from Sigma-Aldrich. For the synthesis of Fe3O4 NPs, 8 mmol of FeCl3·6H2O and 4 mmol of FeSO4·7H2O were dissolved in water and sonicated for 30 min. Then, 5 mL of NH4OH (25%) was added at a rate of approximately 2 drops/min. The mixture was sonicated for 10 min and then centrifuged and washed twice with ethanol/water (1/4). The product was finally washed with water to get rid of the ammonia residue.
The syntheses of Y3+-doped Fe3O4 NPs were carried out analogously to the synthesis of the Fe3O4 sample. The Y3+ ions were added to the starting materials with appropriate molar ratios of Y3+ calculated from the formula: Y3+xFe2+Fe3+2–xO4. For 0.1% Y3+, 0.004 mmol of YCl3·6H2O was added, for 1% Y3+, 0.04 mmol of YCl3·6H2O, for 10% Y3+, 0.4 mmol of YCl3·6H2O, and for 50% Y3+, 2 mmol of YCl3·6H2O were added.
2.2. X-ray Diffractometry (XRD), Transmission Electron Microscopy (TEM), and Scanning Electron Microscopy (SEM) Characterization
X-ray powder diffraction measurements of the Fe3O4:Y samples were performed by using a Philips X’Pert Pro Alpha1 MPD (Panalytical) laboratory diffractometer using Cu Kα1 radiation, in the wide 2θ range. The samples’ crystallographic properties were analyzed by Rietveld refinement with help of the Fullprof 2k program (Rodriguez-Carvajal, J., 2016, FullProf, ver. 5.8).
The particle size and morphology of samples were also determined by SEM using a Zeiss Auriga Neon 40 microscope at an acceleration voltage of 5 kV.
HR TEM investigations were conducted on an FEI Talos F200X transmission microscope at 200 kV. The measurements were performed in TEM and STEM modes using high-angle annular dark field imaging (HAADF). An energy-dispersive X-ray spectroscopy (EDX) detector was used for mapping element distribution. The samples for the TEM observations were prepared by dropping the colloid particle dispersion on a carbon film supported on a 300 mesh copper grid.
2.3. Magnetic Characterization
Magnetization measurements including saturation magnetization, zero-field cooling (ZFC), and field cooling (FC) measurements were performed on a Quantum Design MPMS XL - 7 SQUID magnetometer. FC-ZFC measurements were collected in the range of 2.0 to 300.0 K at an applied magnetic field of 20.0 mT. Field dependent hysteresis loops of magnetization (M–H) were measured at a temperature of 310.0 K with an applied field range from 0 to 5.0 T.
2.4. Hyperthermia Measurements
The specific absorption rate (SAR) and intrinsic loss of power (ILP) of the pure magnetic colloids (concentration of 3 mg/mL in 1.5 mL) were measured with a commercial AC field generator (DM100 by nB nanoscale Biomagnetics, Spain) working at f = 413 kHz and field amplitude H0 of 16 kA/m.
2.5. Cell Culture
All in vitro studies were carried out with 4T1 cells (mice mammary gland cancer cells; ATCC CRL2539). Initially, 4T1 cells were grown in Dulbecco’s Modified Eagle Medium (DMEM) supplemented with 10% v/v of fetal bovine serum at 37 °C in a humidified atmosphere of 5% CO2.
2.6. In Vitro Toxicity Study
To determine the cell viability, different colorimetric assays (i.e., MTT, Presto Blue, CyQuant, Live/Dead) were used. The 4T1 cells were cultured through the night in 96-well plates (10,000 cells/well) at 37 °C and 5% CO2. Subsequently, cells were incubated with fresh medium containing different concentrations of MNPs (0, 5, 10, 25, and 35 mg/mL) for 16 h. Cells treated only with medium served as negative controls. After incubation with MNPs, media of each well were removed, and cells were washed twice with PBS (only from wells designed for CyQuant assay, we removed only 50% of medium and left over 100 μL of medium). Then, cells were treated:
For MTT assays, 150 μL of MTT in DMEM solution (10% of MTT stock solution reagent, 5 mg/1 mL) to each well was added. After 3 h of incubation, the medium was removed, and created formazan crystals were dissolved in dimethyl sulfoxide (100 μL of DMSO/well).
For PrestoBlue assay, 100 μL of 10% PrestoBlue reagent in DMEM solution was added and left in the incubator for 1 h.
For CyQuant assay, to each well (containing 100 μL of non-removed DMEM), 97.6 μL of fresh DMEM with 0.4 μL of direct nucleic acid stain and 2 μL of direct background suppressor was added and incubated for 1 h.
For live/dead assay, cells were incubated for 45 min with 99.75 μL of PBS solution with 0.05 μL of calcein and 0.2 μL of ethidium homodimer-1.
The plate was read using a Promega GLOMAX Discover GM3000 microplate reader, for MTT assay, with an absorbance mode at a wavelength of 560 nm; the others assays were read in the fluorescence mode with different excitation wavelength and emission wavelength ranges depending on assays used, i.e., ex = 520 nm, em = 580–640 nm (PrestoBlue); ex = 475 nm, em = 500–550 nm (CyQuant); ex = 475 nm, em = 500–550 nm; and ex = 520 nm, em = 580–640 nm. All experiments were performed four times. Results are given as means (with standard deviations) of the values obtained in these four repetitions.
2.7. In Vitro Hyperthermia Measurements
For in vitro magnetic hyperthermia experiments, 4T1 cells were cultured as described above and seeded into cell culture dishes (3.5 mm of diameter) at 105 cells/dish with 2 mL of DMEM and incubated overnight. Then, MNP solution was added at concentrations of 35 μg/mL (0.7 ng, 0.003 nmol of MNPs/cell, that is, 0.002 nmol of Fe/cell) or 100 μg/mL (2.0 ng, 0.008 nmol of MNPs/cell, that is, 0.006 nmol of Fe/cell). The additional dishes, each containing cells without MNPs, were used as a control. Cells were incubated for 16 h. Next day, media with and without MNPs were collected from each dish, and cells were washed three times with PBS to remove the non-incorporated NPs. Cells were flooded by fresh medium and exposed to AMF.
The magnetic hyperthermia experiments on 4T1 cells were divided with the four samples: the first two groups consisting of as-cultured blank 4T1 cells (without MNPs) and MNP-loaded 4T1 cells were not exposed to magnetic fields and were analyzed at the end of the experiment in order to compare the natural viability of the cell culture. The second two groups, blank and MNP-loaded 4T1 cells, were exposed to the AMF at the selected frequency of f = 423 kHz and amplitude H = 16 kA/m, and an application time of 30 min was chosen. All experiments were carried out utilizing the D5 series G2 driver equipped with a PC70 coil and CAT sample holder designed for cell culture measurements (atmosphere and temperature control; nB nanoScale Biomagnetics, Spain). After field exposure, cell viability was measured using MTT assay.
2.8. TEM Imaging of the Fe3O4 MNPs inside the 4T1 Cells
The presence of the Fe3O4 NPs inside the 4T1 cells was confirmed by TEM imaging. Upon incubation with 5 μg/mL Fe3O4 NPs for 16 h, the 4T1 cells pellets were fixed with 2% paraformaldehyde and 2.5% glutaraldehyde in 0.1 M cacodylate buffer, pH = 7.4 at 4 °C for 2 h. The samples were washed three times in cacodylate buffer, post-fixed with 1% osmium tetroxide for 1 h, dehydrated in the graded series of ethanol (from 30% to 99.8%) and propylene oxide, embedded in Epon resin, and polymerized at 60 °C for 24 h. After resin polymerization, the samples were sectioned (60 nm) using a MTXL ultramicrotome (RMC, U.S.A.). The ultrathin sections were collected on copper grids and examined by a JEM-1011 transmission electron microscope (JOEL, Japan). The operating voltage of the microscope was 80 kV.
2.9. Multiphoton Confocal Microscopy Imaging
Immunofluorescence confocal microscopy using a Zeiss 710 NLO system was the main technique for imaging Fe3O4 NPs inside 4T1 cells. The three channels were observed: the first, with excitation at 488 nm (continuous laser) and a detecting range of 495–572 nm, was used to image the lysosomes marked with antibodies conjugated with AlexaFluor488 dye; the second, with excitation at 705 nm (femtosecond laser), was used for imaging the nucleus marked by the Hoechst marker while detecting in the 425–475 nm range; and the third channel for MNPs imaging was performed in a visible light transmission mode. Samples for confocal microscopy imaging were prepared according to the earlier described procedure.49
3. Results and Discussion
3.1. Synthesis and Structural Characterization
The crystal structure was examined by the XRD technique. The diffraction patterns for W1, Y1, Y2, and Y3 samples (Figure 1) are single-phase materials with a spinel structure (space group: Fd3̅m). The lattice parameters of the samples were determined using the Rietveld method in the Supporting Information (Table S1) (obtained results can indicate a non-stoichiometric character of the samples).50 The graphical fitting results can be found in Figure S1 in the Supporting Information. The lattice parameters values are slightly increasing with increasing Y3+ concentration. The averaged dimensions of the nanocrystallites were assessed using the Scherrer method:
| 1 |
where D is the grain size, β0 is the apparatus broadening, β is the full width at half maximum, θ is the angle, k is a constant (usually equal to 0.9), and λ is an X-ray wavelength.51 The results of the Rietveld refinement together with crystallite sizes are gathered in Table 1.
Figure 1.
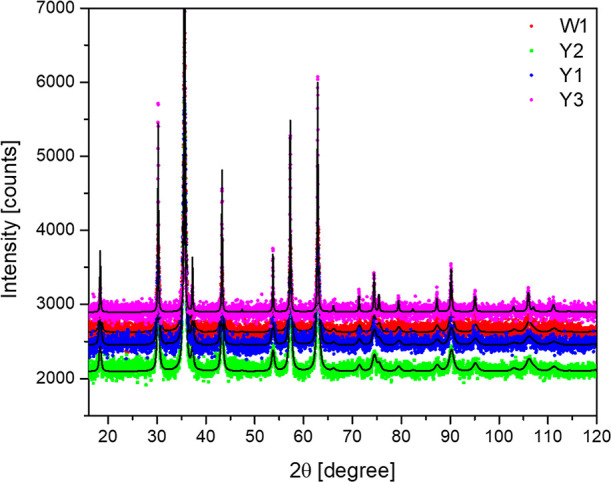
X-ray diffraction patterns of the Fe3O4 NPs as a function of Y3+ cation content.
Table 1. Lattice Parameter a and Nanoparticle Size Extracted from the XRD Data.
| sample | percent of Y3+ | lattice parameter [Å] | crystallite size [nm] |
|---|---|---|---|
| W1 | 0% | 8.3466(8) | 14 ± 3 |
| Y1 | 0.1% | 8.3469(8) | 13 ± 2 |
| Y2 | 1% | 8.3467(6) | 14 ± 3 |
| Y3 | 10% | 8.3543(2) | 56 ± 7 |
It is well known that the incorporation of the trivalent cations such as Nd3 +, Cr3+, Y3+, or In3+ into the structure of the magnetite affects strongly magnetic, dielectric, and structural properties of the Fe3O4 NPs. Rare-earth cations such as La3+, Sm3+, or Dy3+, by substituting Fe3+ in octahedral position, can force the Fe3+ ion for preferential occupation of the tetrahedral crystallographic site. This will ease the crystal lattice tension, and therefore the density of the Fe3+ ions will increase the permeability, and as a logical consequence, the resistance of NPs will increase.25−27 In this work, the intention of using as a dopant Y3+ cations was to increase the magnetization of the magnetite. The comparison of the literature data suggests that Y3+ will preferentially enter the octahedral sites29 and, as a result of radius incompatibility (ionic radii: Y3+ at eightfold coordination, 1.019 Å and Fe3+ at eightfold coordination, 0.78 Å),52 the cell volume will expand, and therefore the a cell parameter has to increase accordingly.27 Actually, this trend is consistent with the Rietveld refinement until maximum Y3+ concentration is achieved (10 mol %) at the Fe3+ octahedral site. This phenomenon (together with charge incompatibility) has to be always taken into account at the stage of the given material synthesis planning.
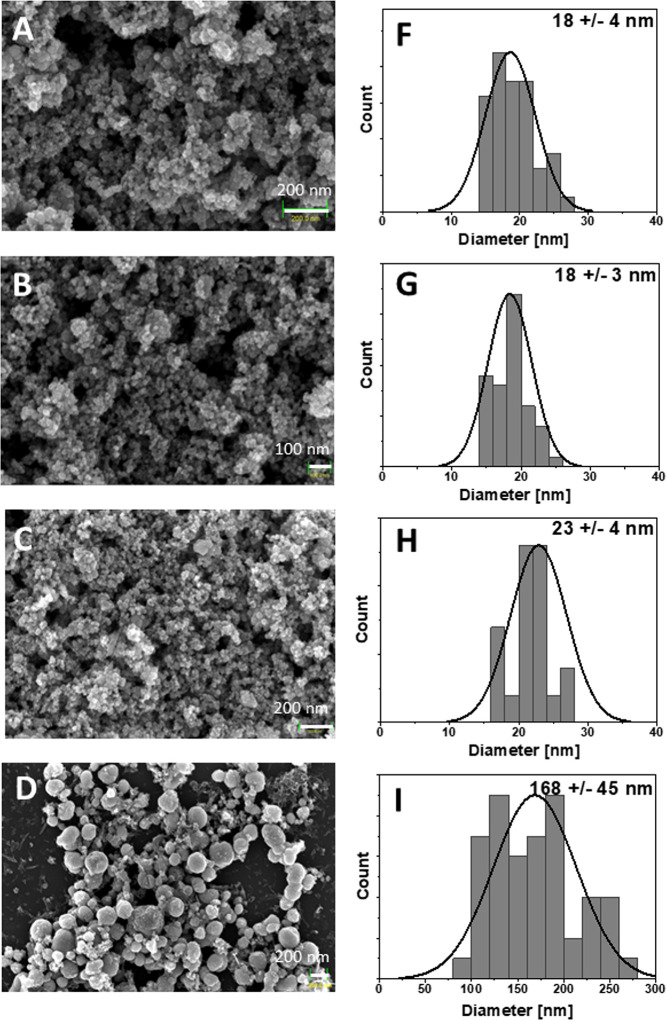
The sample morphology and particle size of the Fe3O4 NPs doped by the Y3+ ions were characterized by using SEM techniques (Figure 2). The normal distribution was fitted to the size distribution histograms obtained from the analysis of SEM images. The size and particle distribution (standard deviation (SD)) were calculated and are presented in Table 2.
Figure 2.
SEM images and histograms of Fe3O4 NPs doped by Y3+ ions. (A, F) Fe3O4 (W1), (B, G) 0.1% Y3+-doped Fe3O4 (Y1), (C, H) 1% Y3+-doped Fe3O4 (Y2), and (D, I) 10% Y3+-doped Fe3O4 (Y3) MNPs.
Table 2. Diameter and Standard Deviation (SD) of the MNPs.
| sample | diameter [nm] | SD |
|---|---|---|
| W1 | 18 | 4 |
| Y1 | 18 | 3 |
| Y2 | 23 | 4 |
| Y3 | 168 | 45 |
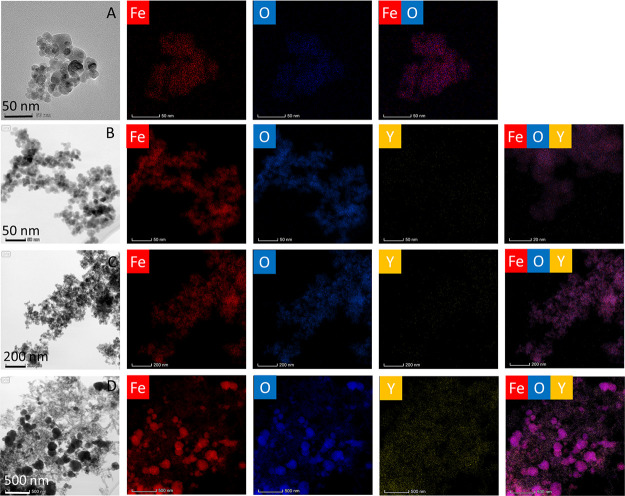
As one can see, the W1, Y1, and Y2 materials are composed of polydisperse NPs with SDs of approximately 3–4 nm. It can be noticed that the particle size of the Y1–Y3 magnetite samples doped with yttrium ions increases upon the increase of the Y3+ cation content. The mean particle size of the Y3 sample is approximately 170 nm with an SD of 45 nm. This behavior might point out two things: either fast particle growth, which might be promoted by the increased Y3+ amount, or the formation of one or several thermodynamically more favored and stable unknown amorphic phases, which can be more convincingly related. The SEM results clearly indicate particle agglomeration, which is accordance with the TEM results (Figure 3).
Figure 3.
TEM and EDX mapping of Fe3O4 NPs doped by Y3+ ions. (A) Fe3O4 (W1), (B) 0.1% Y3+-doped Fe3O4 (Y1), (C) 1% Y3+-doped Fe3O4 (Y2), and (D) 10% Y3+-doped Fe3O4 (Y3) MNPs.
Elemental analysis and mapping of the Fe3O4 NP compositions was conducted by means of EDX spectroscopy connected with TEM microscopy in order to confirm the crucial ratio between elements (Table 3). As it can be seen, the ratios between iron and oxygen ions are in a good correspondence with theoretical values. The same has been observed in the case of Y3+ doping. The results of element mapping are shown in Figure 3. Elemental colocalizations of Fe, Y, and O elements were found indicating the homogenous distribution of all elements within Fe3O4 NPs.
Table 3. Elemental Analysis of EDX of Fe3O4 NPs Doped with Yttrium Ions.
| 2Fe3+Fe2+/O2– (%) |
Y3+/2Fe3+Fe2+ (%) |
|||
|---|---|---|---|---|
| sample | theoretical value | experimental value | theoretical value | experimental value |
| W1 | 75.0 | 55.2 ± 9.4 | ||
| Y1 | 75.0 | 53.0 ± 9.1 | 0.10 | 0.20 ± 0.02 |
| Y2 | 74.5 | 53.4 ± 9.0 | 0.70 | 0.70 ± 0.06 |
| Y3 | 70.3 | 52.0 ± 9.0 | 6.80 | 7.30 ± 0.70 |
3.2. Magnetic Properties
In order to determine the blocking temperature for the samples, the zero ZFC/FC measurements were performed. After exceeding this temperature, the system becomes superparamagnetic. The ZFC/FC measurements consist of cooling the sample without a magnetic field then slowly heating it in the magnetic field and cooling it again in the same field. The relation between magnetization and temperature was measured (Figure 4A) in the temperature range from 2.0 to 300.0 K in an external magnetic field of 20.0 mT. The blocking temperature was not determined because the samples in the entire temperature range exhibited ferromagnetic properties. This is illustrated by the gap (hysteresis) between the two ZFC/FC graph curves (Figure 4A).
Figure 4.
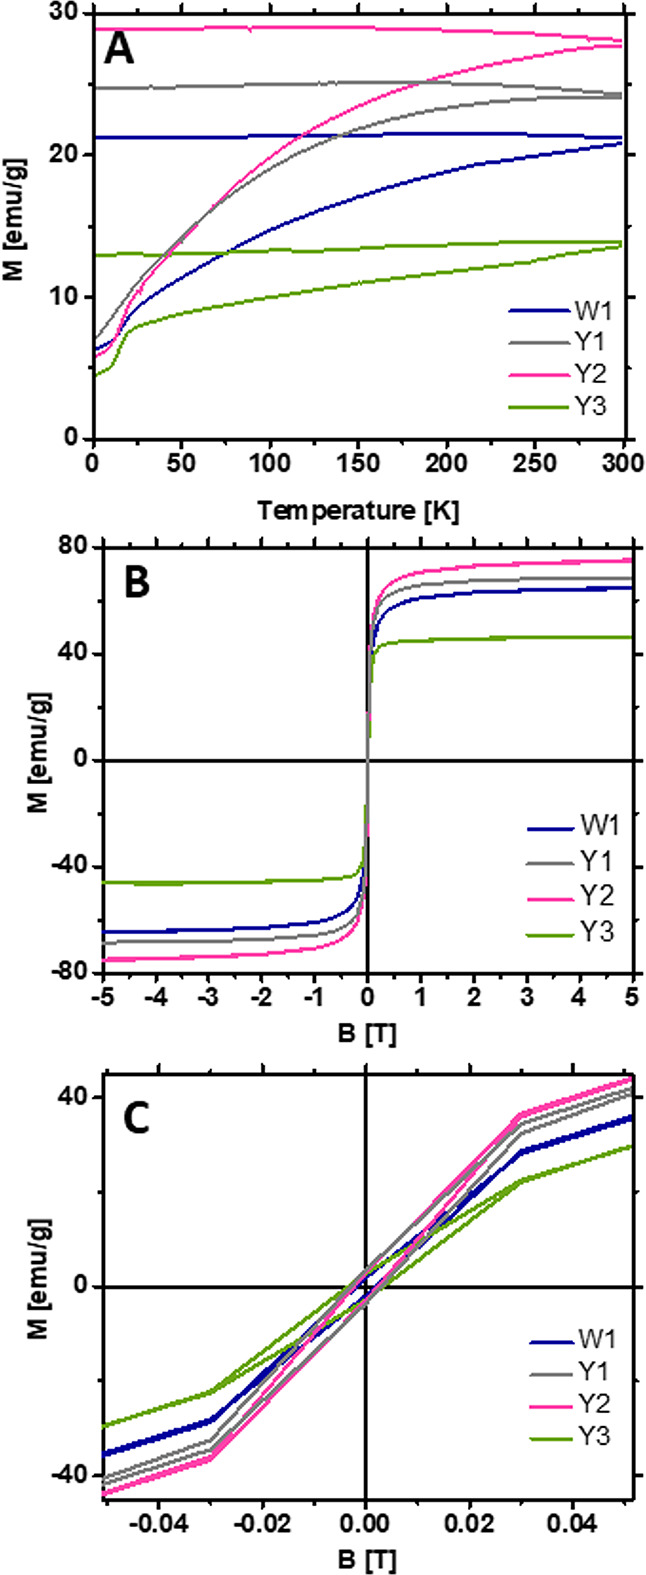
(A) ZFC/FC plot of W1 and Y1–Y3 samples. (B) Hysteresis loops at 310 K. (C) Zoom of the hysteresis loops at 310 K.
The ferromagnetic properties of the samples were confirmed by the measurement of magnetization (M) as a function of the external magnetic field (B) (Figure 4B,C). The highest magnetization was obtained for the Y2 sample doped with 1 mol % yttrium (75 emu/g). Both samples Y1 and Y2 achieved higher magnetization than that of the sample without Y3+ ions, W1. The saturation magnetization of the samples decreased with the higher concentration of Y3+ ions (Y3).
Standard error propagation was estimated for SQUID measurements. The accuracy of mass measurement was Δm = 10–4 g, and the accuracy of magnetic moment measurement was Δμ = 10–8 emu. The standard deviation of six measurements of M(B) (made at the same temperature) was σM = 1 emu/g. An error account was made using eq 2. The estimated maximal measurement uncertainty dM of the magnetization depending on the magnetic field was 2.5 emu/g.
| 2 |
where m is the sample mass and <μ> is the magnetic moment.
The dependence of samples’ saturation magnetization on the concentration of yttrium ions is shown in Figure 5. The maximum magnetization is achieved by the sample Y1 (1% of Y3+), which confirms that the magnetization increases with the doping concentrations to reach the maximum. Then, the magnetization decreases with a further increase of the percentage of doping.
Figure 5.
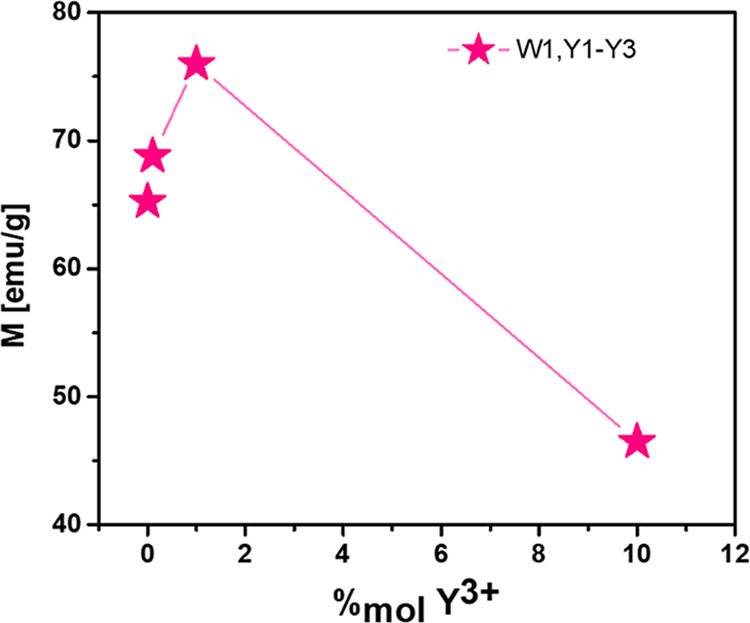
Graph of dependence of magnetization on % yttrium doping. Points are connected by a line to show the trend.
The magnetization of ferrites comes from the difference in the net magnetic moment of the ions at the tetrahedral and octahedral lattice sites. A–B super-exchange interactions prevail over intrasublattice A–A and B–B interactions (Néel model).53 Therefore, the saturation of magnetization comes from the sum of vectors of the net magnetic moments of the individual A and B sublattices.26,29,30 The magnetization directly shows the distribution of the Fe3+ ions between the two sublattices. If the Fe3+ ions occupy both octahedral and tetrahedral sites, the ferrimagnetic ordering will be observed. It is known that the magnetization is higher in MNPs than in bulk materials because of the formation of a partially inversed spinel. The location of Fe3+ ions on tetrahedral sites causes Fe3+A–O–Fe3+B superexchange interactions and the increase of magnetization is observed.
By substituting Fe3+ ions by non-magnetic Y3+ ions, the magnetization of the octahedral coordination should be reduced, resulting in a decrease in magnetization. However, with a small amount of Y3+ addition (up to 1%), the trend is opposite. In the case of small Y3+ concentrations, the magnetization increases. There are two possible explanations of the observed effect: first, if non-magnetic Y3+ ions at low concentrations enter spinel tetrahedral sites, leaving Fe3+ in octahedral sites, this can also lead to an increase of magnetization. However, the literature data suggests that Y3+ should prefer the octahedral sites.27,52 Second, the presence of Y3+ ions increases the size of nanoparticles, which increases blocking temperature and saturation magnetization for low dopant concentrations. Although further increasing Y3+ doping keeps increasing the size of the MNPs, finally, this leads to the decrease of saturation magnetization because non-magnetic yttrium replaces magnetic iron in octahedral sites.27,52
3.3. Hyperthermia Effect of MNPs in Solution
The most commonly used parameter for estimation of the heat conversion efficacy on MNPs under action of AMF is the SAR. The SAR is defined as the power (P, measured in W) produced per sample unit mass (mMN, measured in g) (eq 3).
| 3 |
However, the SAR depends on the frequency of the magnetic field (f, measured in Hz) as well as the intensity of the magnetic field (H, measured in kA/m). In order to make possible the comparison of obtained values between different laboratories, it is by far more appropriate to use the so-called ILP (eq 4) parameter. The ILP is given by the simple formula presented below and allows for the presentation of the experimental values regardless of measurement conditions:54
| 4 |
Both SAR and ILP parameters contain important information regarding the amount of dispersed heat energy induced by AMF. The exact measurement relies on calorimetric experiments performed under adiabatic conditions. This approach allows for complete minimization of heat exchange, which might occur between the measured system and surroundings. However, this critical condition is very difficult to achieve in a laboratory apparatus (time-consuming). Therefore, in reality, the SAR and ILP are measured under pseudo-adiabatic conditions, and afterward, analytical models are used allowing the most accurate determination of the SAR and/or ILP. In this work, the Box–Lucas (eq 5) model was used, which fits the least squares curve:
| 5 |
If A and λ are known (from fitting eq 5), then the SAR (eq 6) can be directly calculated
where  , Ts is the
temperature, τ–1 is the characteristic cooling
time, C is the heat capacity of nanoparticles. The
starting temperature (t0) can be omitted
in the calculation because it is only taken into account in measurements
where the initial temperature difference is different from zero (for
the curve graph ΔT(t)).
| 6 |
The applied analytical method causes an error of a few percent, while other analytical methods, such as the distribution method, introduce an error of several percent. Ultimately, these parameters are determined to estimate the quality of the produced MNPs in terms of generated heat, comparing them with the results obtained for another type of nanomaterial.55
Measurement of the hyperthermia effect was carried out in an aqueous solution. The samples had a similar concentration of approximately 3 mg/mL. The increase of temperature was measured by a system of optical thermometers with a measuring range of error of ±0.2 °C in an external magnetic field of 16 kA/m with a frequency of 413 kHz. The theoretical model was adapted to the measurement data. Figure 6 shows the increase of temperature as a function of time. The fastest temperature rise was generated by the Y1 sample, which heated the aqueous solution at 45 °C in a very short time (less than 9 min). A similar temperature was obtained by the W1 sample. However, this temperature was achieved after a significantly longer time (almost two times). Application of the theoretical model to recorded data allowed calculation of the SAR and ILP. All values presented in Table 4 correspond to the heat generation rates of the samples. The highest value of the SAR and ILP parameters was obtained from the sample Y1 (SAR = 194 ± 27 W/kg; ILP = 1.85 ± 0.26 nHm2/kg).
Figure 6.
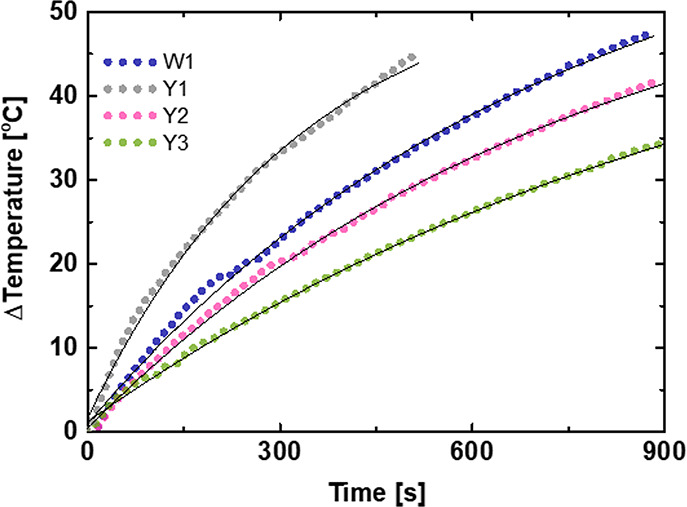
Measurement of the hyperthermic effect for samples W1 and Y1–Y3.
Table 4. SAR and ILP Parameters for Samples W1 and Y1–Y3.
| sample | SAR (W/g) | ILP (nHm2/kg) |
|---|---|---|
| W1 | 120 ± 17 | 1.15 ± 0.09 |
| Y1 | 194 ± 27 | 1.85 ± 0.26 |
| Y2 | 101 ± 14 | 0.97 ± 0.14 |
| Y3 | 76 ± 11 | 0.73 ± 0.10 |
In hyperthermia, the exposure time is an important factor. Therefore, the shorter time of heat generation by MNPs and action of AMF means that they are more suitable for use in magnetic hyperthermia. It can be concluded that the Y1 sample meets these criteria best in comparison with other samples. The ILP value for the Y1 sample is within the range of literature values (Table 5). The ILP of the Y1 sample, compared to the reference iron oxide samples, is generally higher, except for one sample,56 suggesting its high efficiency in magnetic hyperthermia. It should be noted that the parameters of hyperthermia depend on many factors, including the coverage of nanoparticles and their size, composition, and method of synthesis. Therefore, it is difficult to directly compare the results with the results for the same type of nanoparticles but with different physical properties.
Table 5. Comparison of ILP Parameters for Y1 and Reference Samples.
3.4. Cytotoxicity Assays
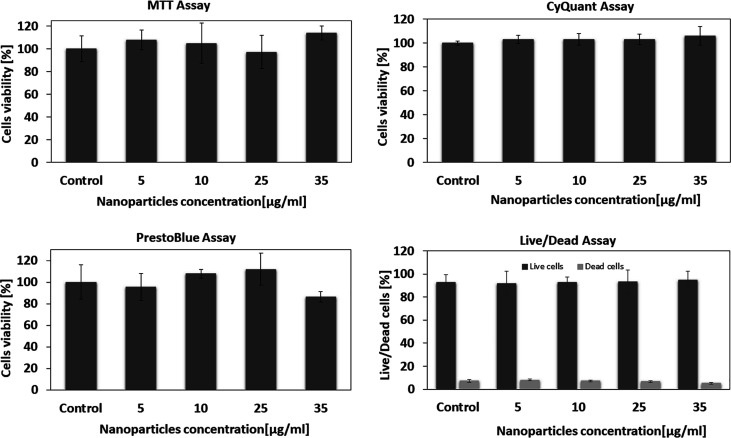
In order to investigate the cytotoxicity of Fe3O4 NPs on 4T1 cells, several tests (MTT, CyQuant, PrestoBlue, and live/dead assays) were performed (Figure 7). No significant difference in the cell proliferation was observed in the absence or presence of 5–35 μg/mL MNPs in all viability tests (see Figure 7). The cellular viabilities were estimated at approximately 100% in all tests for all concentrations of MNPs. These data show that the Fe3O4 NPs have relatively low cytotoxicity after 16 h of incubation for all concentrations.
Figure 7.
Cell viability values estimated from the MTT, CyQuant, PrestoBlue, and live/dead assays vs the concentration of the Fe3O4 NPs. Cells were incubated with 0–35 μg/mL MNPs at 37 °C for 16 h. Each data point is represented as mean (SD from four trials).
3.5. Cellular Uptake Studies
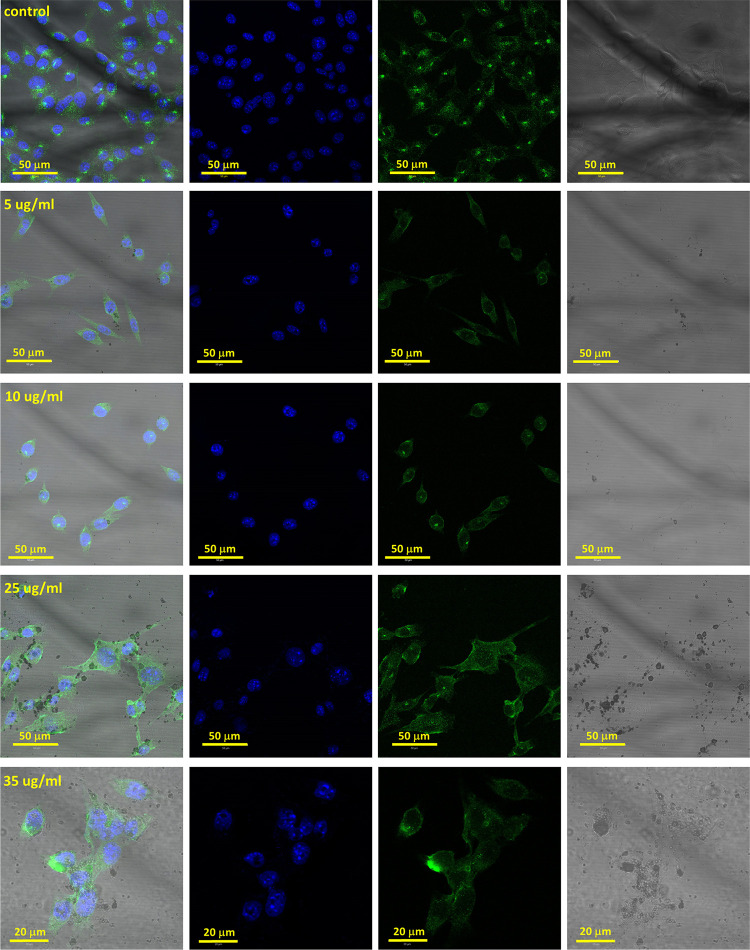
Cellular uptake of MNPs by 4T1 cells was visualized by confocal imaging (Figure 8). Cells stained by the MNPs were visualized at transmitted light. In addition, the 4T1 cells were stained by antibodies to lysosomes conjugated with AlexaFluor 488, green color. The nucleus was stained by Hoechst 33342, blue color. The overlay of the MNP channel and cell channel indicates that the MNPs entered into the cells and locate within the cytoplasm.
Figure 8.
4T1 cells with Fe3O4 NPs depend on the NP concentration. The time of incubation was 16 h. The MNP concentrations were 5, 10, 25, and 35 μg/mL. The blue color indicates the nuclei of the cells. The green color indicates the lysosomes. The Fe3O4 NPs were measured in transparent light.
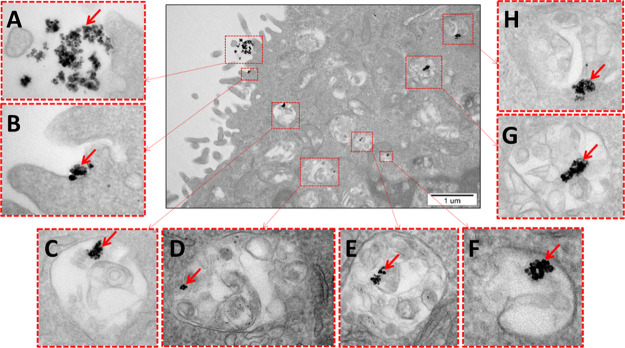
The various stages of internalization of the Fe3O4 NPs and their location inside the cells were obtained by TEM measurements (Figure 9). In order to improve MNP uptake, the cellular internalization mechanisms and accumulation of MNPs in murine mammary carcinoma (4T1) cells were studied. The results of the investigation have shown that MNPs have the ability to enter cells via a form of active transport. The Fe3O4 NPs are internalized into the cell by invaginations of the cell membrane (Figure 9A,B) that surround and enclose MNPs by forming endocytic vesicles. The up-taken MNPs entrapped into intracellular vesicles are next translocated to the perinuclear region of cell. The Fe3O4 NPs are never released to the cell cytoplasm but are always localized in selected vesicular organelles such as endosomes or subsequent lysosomes (Figure 9C–H). The above observations suggest that the endocytosis process is involved in cellular internalization of the MNPs. Long-term incubation with MNPs present inside cells did not indicate significant ultrastructural changes in comparison to control cells.
Figure 9.
TEM images of the Fe3O4 NPs (5 μg/mL) inside the 4T1 cells. (A, B) Various stages of MNP internalization and (C–H) their localization in vesicles after 16 h of incubation at 37 °C (red arrows indicate the nanoparticle aggregates).
3.6. In Vitro Hyperthermia
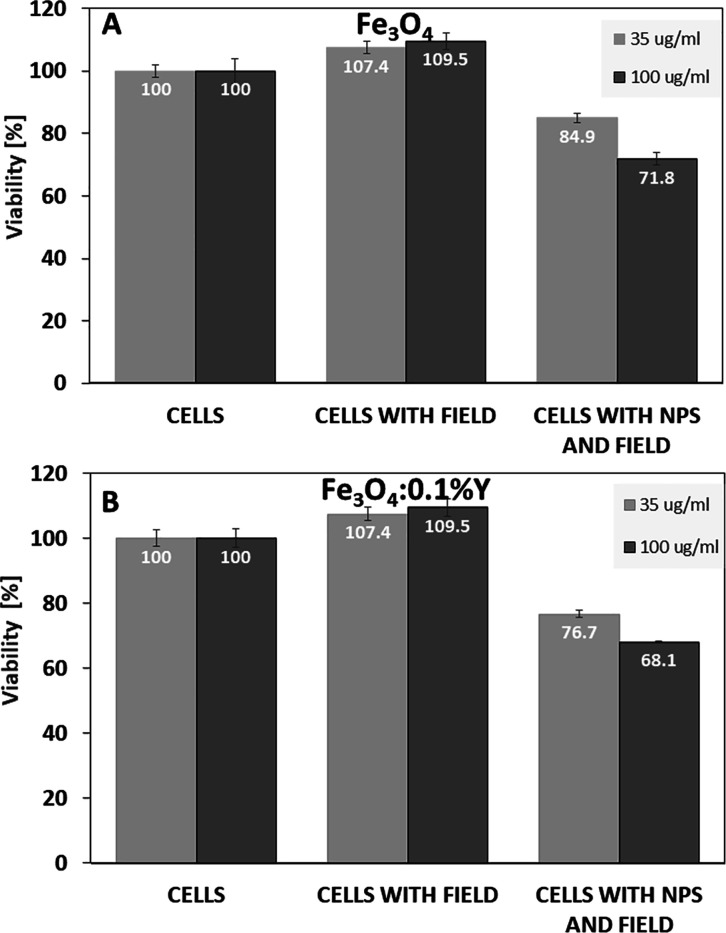
We studied the effects of Fe3O4 and Fe3O4:0.1% Y on 4T1 cells in the presence of an AMF based on procedures described previously.61 4T1 cells with MNPs (35 and 100 μg/mL) were exposed to a magnetic field for 30 min. The exposure to the magnetic field cells in the absence of MNPs did not show any significant effect on the cell viability. The AMF without MNPs did not cause any damages to the cells. The cell viability was reduced to approximately 85% when the cells were incubated with 35 μg/mL Fe3O4 NPs and to approximately 72% with 100 μg/mL Fe3O4 NPs in the presence of the AMF (Figure 10A). However, the viability of the cells was significantly more reduced when the cells were incubated with Fe3O4 nanoparticles doped by 0.1% Y3+ ions exposed to the AMF (Figure 10B). The Fe3O4:0.1% Y NPs with a concentration of 35 μg/mL reduced the cell viability by 77% and with a concentration of 100 μg/mL, reduced the cell viability by 68% when the cells were exposed to the AMF for 30 min (Figure 10B). This implies that the hyperthermia treatment was effective for the Y3+-doping sample more than without doping Fe3O4 nanoparticles. Our research showed that Y3+-doped Fe3O4 NPs can work much better than without the doping.
Figure 10.
Hyperthermia treatment experiment on the 4T1 cells with (A) Fe3O4 and (B) Fe3O4:0.1%Y NPs in 35 μg/mL and 100 μg/mL concentrations. The MTT assay was performed directly after applying the magnetic field for 30 min. The applied magnetic field was 20 mT with the frequency of 423 kHz. The temperature of the environment was 37 °C.
Others researchers studied the magnetic hyperthermia effect of MNPs with different sizes and different coatings on cancer cells. For example, Thorat et al.62 measured the cytotoxicity of polymer-coated La0.7Sr0.3MnO3 MNPs on L929 cancer cells in much higher concentrations until 2 mg/mL. They did not observe any toxicity. Patil et al.63 studied Fe3O4 NPs coated with oleic acid and betaine HCl. They observed that more than 60% MCF cells were killed within 20 min of magnetic hyperthermia exposure. The 90 min of hyperthermia exposure was required to kill approximately 86–97% of MCF cells, but the concentration of MNPs they used was much higher than in our case (from 0.1 to 2 mg/mL for 105 cells in the cited paper; 35 and 100 μg/mL in this paper). To compare these results, we have to use the same concentration and conditions for the in vitro hyperthermia measurements.
4. Conclusions
The Fe3O4 MNPs doped by different amounts of Y3+ ions (0, 0.1, 1, and 10%) were synthetized. The crystal structures examined by the XRD technique confirm single-phase spinel ferities for all samples. The MNPs’ size increases with the increase of the Y3+ cation content. The as-prepared MNPs are ferromagnetic at room temperature. This is illustrated by the gap (hysteresis) between the two ZFC/FC graph curves. The maximum magnetization is achieved by the sample with 1% Y3+, which confirms that the magnetization increases with the doping concentrations to reach the maximum. Then, the magnetization decreases with the further increase of the percentage of doping. The saturation magnetization of the MNPs increases with the increase of Y dopants until reaching 1% Y3+, indicating that the small amount of Y3+ ions doped stabilizes Fe3+ in octahedral sites, reducing the tendency toward inversion. Then, the decrease of saturation magnetization is observed indicating the lowering of the number of Fe3+A–O–Fe3+B superexchange interactions.
The magnetic hyperthermia of MNPs in water was measured. The specific absorption rate (SAR) and intrinsic loss of power (ILP) values were obtained. The best results were estimated for Fe3O4 with 0.1% Y3+ ions (SAR = 194 W/g and ILP = 1.85 nHm2/kg). The excellent biocompatibility with low cell cytotoxicity of Fe3O4:Y nanoparticles was observed by four independent cytotoxicity tests (MTT, CyQuant, PrestoBlue, and live/dead assays). The cellular viabilities were estimated at 100% in all tests for all concentrations of MNPs. The various stages of internalization of the MNPs and their location inside the cells were obtained by TEM and confocal microscopy measurements. The results of the investigation have shown that MNPs have the ability to enter cells via a form of active transport (endocytosis).
Data on magnetic hyperthermia on the 4T1 cells with Fe3O4:Y MNPs suggest that it can be used in future cancer treatment. This method can be better than chemotherapy, which has impact for viability of other healthy cells. The results showed that Fe3O4 NPs doped by 0.1% Y3+ ion reduced significantly the viability of cancer cells and can be better for future treatment applications than Fe3O4 without doping. The Fe3O4:0.1% Y NPs with a concentration of 35 μg/mL reduced the cell viability by 77% and with a concentration of 100 μg/mL, reduced the cell viability by 68% when the cells were exposed to the AMF for 30 min. In comparison, incubation with the MNPs without doping reduced the cell viability by 85% when the cells were incubated with 35 μg/mL Fe3O4 NPs and approximately 72% with 100 μg/mL Fe3O4.
The Fe3O4 NPs additionally can be easily functionalized by antibodies for targeted drug therapy, which protects healthy cells from damages. In addition, the Fe3O4 NPs can be exploited for imaging and other diagnostic applications simultaneously, which is not possible by other hyperthermia processes.
Acknowledgments
The research was supported by the project financed by NCN: DEC-2014/15/D/ST5/02604 and project co-financed by the European Union from the European Regional Development Fund under the Operational Programme Innovative Economy, 2007–2013, and Panda2 no. 501-D312-56-0000002. This work has been done in the NanoFun laboratories co-financed by the European Regional Development Fund with the Innovation Economy Operational Program no. POIG.02.02.00-00025/09/.
Supporting Information Available
The Supporting Information is available free of charge at https://pubs.acs.org/doi/10.1021/acs.jpcc.9b11043.
Calculation details and graphs of the lattice parameters of the all samples determined using the Rietveld method (PDF)
The authors declare no competing financial interest.
Supplementary Material
References
- Bate G.Magnetic Oxides Part 2; Craik D. J.John Wiley & Sons: New York, 1975, pp 705. [Google Scholar]
- Arruebo M.; Fernández-pacheco R.; Ibarra M. R.; Santamaría J. Magnetic nanoparticles for drug delivery. Nano Today 2007, 2, 22–32. 10.1016/S1748-0132(07)70084-1. [DOI] [Google Scholar]
- Pradhan P.; Giri J.; Samanta G.; Sarma H. D.; Mishra K. P.; Bellare J.; Banerjee R.; Bahadur D. Comparative evaluation of heating ability and biocompatibility of different ferrite-based magnetic fluids for hyperthermia application. J. Biomed. Mater. Res. B. Appl. Biomater. 2007, 81B, 12–22. 10.1002/jbm.b.30630. [DOI] [PubMed] [Google Scholar]
- Huff T. B.; Tong L.; Zhao Y.; Hansen M. N.; Cheng J. X.; Wei A. Hyperthermic effects of gold nanorods on tumor cells. Nanomedicine 2007, 2, 125–132. 10.2217/17435889.2.1.125. [DOI] [PMC free article] [PubMed] [Google Scholar]
- Kim D. H.; Nikles D. E.; Brazel C. S. Synthesis and characterization of multifunctional chitosan-MnFe2O4 nanoparticles for magnetic hyperthermia and drug delivery. Materials 2010, 3, 4051–4065. 10.3390/ma3074051. [DOI] [PMC free article] [PubMed] [Google Scholar]
- Kim D. H.; Nikles D. E.; Johnson D. T.; Brazel C. S. Heat generation of aqueously dispersed CoFe2O4 nanoparticles as heating agents for magnetically activated drug delivery and hyperthermia. J. Magn. Magn. Mater. 2008, 320, 2390–2396. 10.1016/j.jmmm.2008.05.023. [DOI] [Google Scholar]
- Na H. B.; Song I. C.; Hyeon T. Inorganic nanoparticles for MRI contrast agents. Adv. Mater. 2009, 21, 2133–2148. 10.1002/adma.200802366. [DOI] [Google Scholar]
- van Landeghem F. K. H.; Maier-Hauff K.; Jordan A.; Hoffmann K.-T.; Gneveckow U.; Scholz R.; Thiesen B.; Brück W.; von Deimling A. Post-mortem studies in glioblastoma patients treated with thermotherapy using magnetic nanoparticles. Biomaterials 2009, 30, 52–57. 10.1016/j.biomaterials.2008.09.044. [DOI] [PubMed] [Google Scholar]
- Schulz M. J.; Shanov V. N.; Yun Y.. Nanomedicine design of particles, sensors, motors, implants, robots, and devices; Artech House: MA, USA: 2009, p.549. [Google Scholar]
- Thapa D.; Palkar V. R.; Kurup M. B.; Malik S. K. Properties of magnetite nanoparticles synthesized through a novel chemical route. Mater. Lett. 2004, 58, 2692–2694. 10.1016/j.matlet.2004.03.045. [DOI] [Google Scholar]
- Lee J. H.; Huh Y. M.; Jun Y.; Seo J.; Jang J.; Song H. T.; Kim S.; Cho E. J.; Yoon H. G.; Suh J. S.; et al. Artificially engineered magnetic nanoparticles for ultra-sensitive molecular imaging. Nat. Med. 2007, 13, 95–99. 10.1038/nm1467. [DOI] [PubMed] [Google Scholar]
- Mendoza-Garcia A.; Sun S. Recent advances in the high-temperature chemical synthesis of magnetic nanoparticles. Adv. Funct. Mater. 2016, 26, 3809–3817. 10.1002/adfm.201504172. [DOI] [Google Scholar]
- Wu L.; Mendoza-Garcia A.; Li Q.; Sun S. Organic phase syntheses of magnetic nanoparticles and their applications. Chem. Rev. 2016, 116, 10473–10512. 10.1021/acs.chemrev.5b00687. [DOI] [PubMed] [Google Scholar]
- Zhao Z.; Chi X.; Yang L.; Yang R.; Ren B. W.; Zhu X.; Zhang P.; Gao J. Cation exchange of anisotropic-shaped magnetite nanoparticles generates high-relaxivity contrast agents for liver tumor imaging. Chem. Mater. 2016, 28, 3497–3506. 10.1021/acs.chemmater.6b01256. [DOI] [Google Scholar]
- Szczerba W.; Żukrowski J.; Przybylski M.; Sikora M.; Safonova O.; Shmeliov A.; Nicolosi V.; Schneider M.; Granath T.; Oppmann M.; et al. Pushing up the magnetisation values for iron oxide nanoparticles via zinc doping: X-ray studies on the particle’s sub-nano structure of different synthesis routes. Phys. Chem. Chem. Phys. 2016, 18, 25221–25229. 10.1039/C6CP04221J. [DOI] [PubMed] [Google Scholar]
- Bram S.; Gordon M. N.; Carbonell M. A.; Pink M.; Stein B. D.; Morgan D. G.; Aguilà D.; Aromi G.; Skrabalak S. E.; Losovyj Y.; et al. Zn2+ ion surface enrichment in doped iron oxide nanoparticles leads to charge carrier density enhancement. ACS Omega 2018, 3, 16328–16337. 10.1021/acsomega.8b02411. [DOI] [PMC free article] [PubMed] [Google Scholar]
- Liang X.; Wang X.; Zhuang J.; Chen Y.; Wang D.; Li Y. Synthesis of nearly monodisperse iron oxide and oxyhydroxide nanocrystals. Adv. Funct. Mater. 2006, 16, 1805–1813. 10.1002/adfm.200500884. [DOI] [Google Scholar]
- Colognato R.; Bonelli A.; Bonacchi D.; Baldi G.; Migliore L. Analysis of cobalt ferrite nanoparticles induced genotoxicity on human peripheral lymphocytes: comparison of size and organic grafting-dependent effects. Nanotoxicology 2007, 1, 301–308. 10.1080/17435390701817359. [DOI] [Google Scholar]
- Pacchierotti F.; Bellusci M.; La Barbera A.; Padella F.; Mancuso M.; Pasquo A.; Grollino M. G.; Leter G.; Nardi E.; Cremisini C.; Giardullo P. Biodistribution and acute toxicity of a nanofluid containing manganese iron oxide nanoparticles produced by a mechanochemical process. Int. J. Nanomed. 2014, 9, 1919–1929. 10.2147/IJN.S56394. [DOI] [PMC free article] [PubMed] [Google Scholar]
- Asmatulu R.; Garikapati A.; Misak H. E.; Song Z.; Yang S.-Y.; Wooley P. Cytotoxicity of magnetic nanocomposite spheres for possible drug delivery systems. ASME Int. Mech. Eng. Congr. Expo. 2012, 10, 911–918. 10.1115/IMECE2010-40269. [DOI] [Google Scholar]
- Jang J.-t.; Nah H.; Lee J.-H.; Moon S. H.; Kim M. G.; Cheon J. Critical enhancements of MRI contrast and hyperthermic effects by dopant-controlled magnetic nanoparticles. Angew. Chem., Int. Ed. 2009, 48, 1234–1238. 10.1002/anie.200805149. [DOI] [PubMed] [Google Scholar]
- Zhu S.; Xu X.; Rong R.; Li B.; Wang X. Evaluation of zinc-doped magnetite nanoparticle toxicity in the liver and kidney of mice after sub-chronic intragastric administration. Toxicol. Res. 2016, 5, 97–106. 10.1039/C5TX00292C. [DOI] [PMC free article] [PubMed] [Google Scholar]
- Groman E. V.; Bouchard J. C.; Reinhardt C. P.; Vaccaro D. E. Ultrasmall mixed ferrite colloids as multidimensional magnetic resonance imaging, cell labeling, and cell sorting agents. Bioconjugate Chem. 2007, 18, 1763–1771. 10.1021/bc070024w. [DOI] [PubMed] [Google Scholar]
- De Silva C. R.; Smith S.; Shim I.; Pyun J.; Gutu T.; Jiao J.; Zheng Z. Lanthanide(III)-doped magnetite nanoparticles. J. Am. Chem. Soc. 2009, 131, 6336–6337. 10.1021/ja9014277. [DOI] [PubMed] [Google Scholar]
- Milanović M.; Moshopoulou E. G.; Stamopoulos D.; Devlin E.; Giannakopoulos K. P.; Kontos A. G.; Eleftheriadis K.; Gini M. I.; Nikolić L. M. Structure and magnetic properties of Zn1-xInxFe2O4 and ZnYxFe2-xO4 nanoparticles prepared by coprecipitation. Ceram. Int. 2013, 39, 3235–3242. 10.1016/j.ceramint.2012.10.011. [DOI] [Google Scholar]
- Verma S.; Chand J.; Singh M. Effect of In3+ ions doping on the structural and magnetic properties of Mg0.2Mn0.5Ni0.3InxFe2-xO4 spinel ferrites. J. Magn. Magn. Mater. 2012, 324, 3252–3260. 10.1016/j.jmmm.2012.04.053. [DOI] [Google Scholar]
- Ishaque M.; Islam M. U.; Khan M. A.; Rahman I. Z.; Genson A.; Hampshire S. Structural, electrical and dielectric properties of yttrium substituted nickel ferrites. Phys. Rev. B: Condens. Matter 2010, 405, 1532–1540. 10.1016/j.physb.2009.12.035. [DOI] [Google Scholar]
- Shinde T. J.; Gadkari A. B.; Vasambekar P. N. Effect of Nd3+ substitution on structural and electrical properties of nanocrystalline zinc ferrite. J. Magn. Magn. Mater. 2010, 322, 2777–2781. 10.1016/j.jmmm.2010.04.026. [DOI] [Google Scholar]
- Xing Q.; Peng Z.; Wang C.; Fu Z.; Fu X. Doping effect of Y3+ ions on the microstructural and electromagnetic properties of Mn–Zn ferrites. Phys. B 2012, 407, 388–392. 10.1016/j.physb.2011.11.003. [DOI] [Google Scholar]
- Shirsath S. E.; Toksha B. G.; Jadhav K. M. Structural and magnetic properties of In3+ substituted NiFe2O4. Mater. Chem. Phys. 2009, 117, 163–168. 10.1016/j.matchemphys.2009.05.027. [DOI] [Google Scholar]
- Cvejić Z.; Rakić S.; Jankov S.; Skuban S.; Kapor A. Dielectric properties and conductivity of zinc ferrite and zinc ferrite doped with yttrium. J. Alloys Compd. 2009, 480, 241–245. 10.1016/j.jallcom.2009.01.133. [DOI] [Google Scholar]
- Hashim M.; Alimuddin; Kumar S.; Shirsath S. E.; Kotnala R. K.; Chung H.; Kumar R. Structural properties and magnetic interactions in Ni0.5Mg0.5Fe2–xCrxO4 (0≤x≤1) ferrite nanoparticles. Powder Technol. 2012, 229, 37–44. 10.1016/j.powtec.2012.05.054. [DOI] [Google Scholar]
- Yonezawa M.; Otsuka T.; Matsui N.; Tsuji H.; Kato K. H.; Moriyama A.; Kato T. Hyperthermia induces apoptosis in malignant fibrous histiocytoma cells in vitro. Int. J. Cancer 1996, 66, 347–351. . [DOI] [PubMed] [Google Scholar]
- Sellins K. S.; Cohen J. J. hyperthermia induces apoptosis in thymocytes. Radiat. Res. 1991, 126, 88–95. 10.2307/3578175. [DOI] [PubMed] [Google Scholar]
- Christophi C.; Winkworth A.; Muralihdaran V.; Evans P. The treatment of malignancy by hyperthermia. Surg. Oncol. 1998, 7, 83. 10.1016/S0960-7404(99)00007-9. [DOI] [PubMed] [Google Scholar]
- Welch A. J.; Motamedi M.; Rastegar S.; LeCarpentier G. L.; Jansen D. Laser thermal ablation. Photochem. Photobiol. 1991, 53, 815–823. 10.1111/j.1751-1097.1991.tb09896.x. [DOI] [PubMed] [Google Scholar]
- Goldstein L. S.; Dewhirst M. W.; Repacholi M.; Kheifets L. Summary, conclusions and recommendations: adverse temperature levels in the human body. Int. J. Hyperthermia 2009, 19, 373–384. 10.1080/0265673031000090701. [DOI] [PubMed] [Google Scholar]
- Jaque D.; Maestro L. M.; del Rosal B.; Haro-Gonzalez P.; Benayas A.; Plaza J. L.; Rodríguez E. M.; Solé J. G. Nanoparticles for photothermal therapies. Nanoscale 2014, 6, 9494–9530. 10.1039/C4NR00708E. [DOI] [PubMed] [Google Scholar]
- Raaphorst G. P.; Freeman M. L.; Dewey W. C. Radiosensitivity and recovery from radiation damage in cultured CHO cells exposed to hyperthermia at 42.5 or 45.5 degrees C. Radiat. Res. 1979, 79, 390–402. 10.2307/3575104. [DOI] [PubMed] [Google Scholar]
- Dutz S.; Hergt R. Magnetic particle hyperthermia — a promising tumour therapy?. Nanotechnology 2014, 25, 452001. 10.1088/0957-4484/25/45/452001. [DOI] [PubMed] [Google Scholar]
- Zhang Y.; Zhai Y.. Magnetic induction heating of nano-sized ferrite particle. In advances in induction and microwave heating of mineral and organic materials; Stanislaw Grundas, IntechOpen, 2011, 483–502. [Google Scholar]
- Dunlop D. J. Superparamagnetic and single-domain threshold sizes in magnetite. J. Geophys. Res. 1973, 78, 1780–1793. 10.1029/JB078i011p01780. [DOI] [Google Scholar]
- Carrey J.; Mehdaoui B.; Respaud M. Simple models for dynamic hysteresis loop calculations of magnetic single-domain nanoparticles: Application to magnetic hyperthermia optimization. J. Appl. Phys. 2011, 109, 083921 10.1063/1.3551582. [DOI] [Google Scholar]
- Dutz S.; Hergt R. Magnetic nanoparticle heating and heat transfer on a microscale: Basic principles, realities and physical limitations of hyperthermia for tumour therapy. Int. J. Hyperthermia 2013, 29, 790–800. 10.3109/02656736.2013.822993. [DOI] [PubMed] [Google Scholar]
- Jordan A.; Scholz R.; Wust P.; Schirra H.; Schiestel T.; Schmidt H.; Felix R. Endocytosis of dextran and silan-coated magnetite nanoparticles and the effect of intracellular hyperthermia on human mammary carcinoma cells in vitro. J. Magn. Magn. Mater. 1999, 194, 185–196. 10.1016/S0304-8853(98)00558-7. [DOI] [Google Scholar]
- Jordan A.; Scholz R.; Wust P.; Fähling H.; Felix R. Magnetic fluid hyperthermia (MFH): Cancer treatment with AC magnetic field induced excitation of biocompatible superparamagnetic nanoparticles. J. Magn. Magn. Mater. 1999, 201, 413–419. 10.1016/S0304-8853(99)00088-8. [DOI] [Google Scholar]
- Nasongkla N.; Bey E.; Ren J.; Ai H.; Khemtong C.; Guthi J. S.; Chin S. F.; Sherry A. D.; Boothman D. A.; Gao J. Multifunctional polymeric micelles as cancer-targeted, MRI-ultrasensitive drug delivery systems. Nano Lett. 2006, 6, 2427–2430. 10.1021/nl061412u. [DOI] [PubMed] [Google Scholar]
- Mornet S.; Vasseur S.; Grasset F.; Duguet E. Magnetic nanoparticle design for medical diagnosis and therapy. J. Mater. Chem. 2004, 14, 2161–2175. 10.1039/b402025a. [DOI] [Google Scholar]
- Kowalik P.; Elbaum D.; Mikulski J.; Fronc K.; Kaminska I.; Morais P. C.; De Souza P. E.; Nunes R. B.; Veiga-Souza F. H.; Gruzel G.; et al. Upconversion fluorescence imaging of HeLa cells using ROS generating SiO2-coated lanthanide-doped NaYF4 nanoconstructs. RSC Adv. 2017, 7, 30262–30273. 10.1039/C6RA25383K. [DOI] [Google Scholar]
- Hong J. H.; Kim W. S.; Lee J. I.; Hur N. H. Exchange coupled magnetic nanocomposites of Sm(Co1-xFex)5 / Fe3O4 with core/shell structure. Solid State Commun. 2007, 141, 541–544. 10.1016/j.ssc.2006.12.030. [DOI] [Google Scholar]
- Klug P.; Alexander L. E.. X-ray diffraction procedure; Wiley: New York, 1954. [Google Scholar]
- Shannon R. D. Revised effective ionic radii and systematic studies of interatomic distances in halides and chalcogenides. Acta Cryst. 1976, 32, 751–767. 10.1107/S0567739476001551. [DOI] [Google Scholar]
- Neel L. Magnetic properties of ferrites: ferrimagnetism and antiferromagnetism. Ann. Phys. 1948, 3, 137–198. [Google Scholar]
- Ortega D.; Pankhurst Q. A.. Nanoscience: Volume 1: Nanostructures through Chemistry; O’Brien P., Royal Society of Chemistry, 2012, 60–88. [Google Scholar]
- Kallumadil M.; Tada M.; Nakagawa T.; Abe M.; Southern P.; Pankhurst Q. A. Suitability of commercial colloids for magnetic hyperthermia. J. Magn. Magn. Mater. 2009, 321, 1509–1513. 10.1016/j.jmmm.2009.02.075. [DOI] [Google Scholar]
- Bonvin D.; Arakcheeva A.; Millán A.; Piñol R.; Hofmann H.; Ebersold M. M. Controlling structural and magnetic properties of IONPs by aqueous synthesis for improved hyperthermia. RSC Adv. 2017, 7, 13159. 10.1039/C7RA00687J. [DOI] [Google Scholar]
- Surowiec A.; Miaskowski Z.; Budzyński M. Investigation of magnetite Fe3O4 nanoparticles for magnetic hyperthermia. Nukleonika 2017, 62, 183–186. 10.1515/nuka-2017-0028. [DOI] [Google Scholar]
- Bordelon D. E.; Cornejo C.; Grüttner C.; Westphal F.; DeWeese T. L.; Ivkov R. Magnetic nanoparticle heating efficiency reveals magneto-structural differences when characterized with wide ranging and high amplitude alternating magnetic fields. J. Appl. Phys. 2011, 109, 124904. 10.1063/1.3597820. [DOI] [Google Scholar]
- Kolenko Y. V.; Bañobre-López M.; Rodróguez-Abreu C.; Carbó-Argibay E.; Sailsman A.; Piñeiro-Redondo Y.; Cerqueira M. F.; Petrovykh D. Y.; Kovnir K.; Lebedev O. I.; et al. Large-scale synthesis of colloidal Fe3O4 nanoparticles exhibiting high heating efficiency in magnetic hyperthermia. J. Phys. Chem. C 2014, 118, 8691–8701. 10.1021/jp500816u. [DOI] [Google Scholar]
- Lima E. Jr.; De Biasi E.; Vasquez Mansilla M.; Saleta M. E.; Granada M.; Troiani H. E.; Effenberger F. B.; Rossi L. M.; Rechenberg H. R.; Zysler R. D. Heat generation in agglomerated ferrite nanoparticles in an alternating magnetic field. J. Phys. D: Appl. Phys. 2013, 46, 045002 10.1088/0022-3727/46/4/045002. [DOI] [Google Scholar]
- Prasad N. K.; Rathinasamy K.; Panda D.; Bahadur D. Mechanism of cell death induced by magnetic hyperthermia with nanoparticles of γ-MnxFe2-xO3 synthesized by a single step process. J. Mater. Chem. 2007, 17, 5042–5051. 10.1039/b708156a. [DOI] [Google Scholar]
- Thorat N. D.; Otari S. V.; Patil R. M.; Khot V. M.; Prasad A. I.; Ningthoujam R. S.; Pawar S. H. Enhanced colloidal stability of polymer coated La0.7Sr0.3MnO3 nanoparticles in physiological media for hyperthermia application. Colloids Surf., B 2013, 111, 264–269. 10.1016/j.colsurfb.2013.06.014. [DOI] [PubMed] [Google Scholar]
- Patil R. M.; Thorat N. D.; Shete P. B.; Otari S. V.; Tiwale B. M.; Pawar S. H. In vitro hyperthermia with improved colloidal stability and enhanced SAR of magnetic core/shell nanostructures. Mater. Sci. Eng., C 2016, 59, 702–709. 10.1016/j.msec.2015.10.064. [DOI] [PubMed] [Google Scholar]
Associated Data
This section collects any data citations, data availability statements, or supplementary materials included in this article.


