Abstract
Early atherosclerosis depends upon responses by immune cells resident in the intimal aortic wall. Specifically, the healthy intima is thought to be populated by vascular dendritic cells (DC) that, during hypercholesterolemia, initiate atherosclerosis by being the first to accumulate cholesterol. Whether these cells remain key players in later stages of disease is unknown. Using murine lineage tracing models and gene expression profiling, we reveal that myeloid cells present in the intima of the aortic arch are not DCs but instead specialized aorta intima resident macrophages (MacAIR) that depend upon Csf-1 and sustained by local proliferation. Although MacAIR comprise the earliest foam cells in plaques, their proliferation during plaque progression is limited. After months of hypercholesterolemia, their presence in plaque is overtaken by recruited monocytes, which induce MacAIR-defining genes. These data redefine the lineage of intimal phagocytes and suggest that proliferation is insufficient to sustain generations of macrophages during plaque progression.
INTRODUCTION:
Despite improvement in cardiovascular disease (CVD) outcomes following cholesterol-lowering treatment, the high rate of CVD in western society remains a health concern1,2. Atherosclerosis of the arteries is a root-cause for many CVD outcomes like myocardial infarction or stroke, and is manifested by the formation of cellular plaque in the arterial intima. Plaque progression is associated with deposition of cholesterol and inflammatory cells, leading to restriction of blood flow and the potential for thrombosis if plaques reach the point of instability3,4. Macrophages are the most abundant hematopoietic cells present in developing murine plaque and participate in the progression of disease through production of inflammatory mediators, clearance of cellular debris, cholesterol storage, and reverse cholesterol transport. Mechanisms regulating the recruitment, differentiation, and function of macrophages represent a promising target for therapeutic intervention5-7.
Myeloid cells reside in the intima of the lesser curvature of the aortic arch, and at major branch points of arteries, in mice and humans even without observable plaques8,9. These sites have highest vulnerability to form atheroma. Cells present in the intima were originally identified as vascular dendritic cells (DCs), due to expression of historically relevant DC markers CD11c and MHC II. However, outside of secondary lymphoid tissues these proteins are not restricted to DCs and are shared with some tissue-resident macrophages8,10-13. Functionally, these cells were proposed to mobilize into the bloodstream following TLR stimulation via CCR7-mediated signaling, a key mediator of DC migration, and they also possessed the capacity to present antigen to T cells in culture14,15. On the other hand, they acquired and sequestered lipid in hypercholesterolemic mice16, a feature typically associated with macrophages, especially foam cell formation. Studies using transgenic mice containing a CD11c (Itgax) promoter driving the human diphtheria toxin receptor (CD11c-DTR) to deplete the intima myeloid cells indicate they serve as major drivers of atherogenesis16. Furthermore, considering that these cells can locally proliferate15 and that proliferation has been identified as a possible major mode of foam cell expansion during disease progression17, it seemed possible that these cells might serve as a major source of foam cells throughout plaque progression. Yet, this question remains unanswered. Thus, we embarked upon studies to clarify the origin and examine the contribution of aortic intima myeloid cells in atherosclerotic disease progression.
Using single cell RNA sequencing (scRNA-seq) of total leukocytes from nascent aortae, we show that myeloid cells in the aortic arch fail to express DC genes, but uniformly expressed a unique macrophage gene signature suggesting a bona fide ‘aorta intima resident macrophage’ (MacAIR) population. Further findings that they depend upon Colony Stimulating Factor 1 (CSF-1) fits with this conclusion. Using embryonic labeling, parabiosis, and mixed bone marrow chimeric approaches we identified that MacAIR were seeded in the tissue by monocytes, but once the niche was filled, they were maintained independent of circulating cells by local proliferation. Fate mapping MacAIR in atherosclerosis models showed that they differentiate into foamy macrophages prior to the recruitment of monocytes, and depletion of the MacAIR prior to cholesterol feeding resulted in delayed lesion onset. However, prolonged hypercholesterolemia led to the complete loss of the resident-derived foamy cells, as they were ultimately replaced entirely by recruited blood monocytes.
RESULTS
Gene expression analysis of aortic leukocytes in steady state
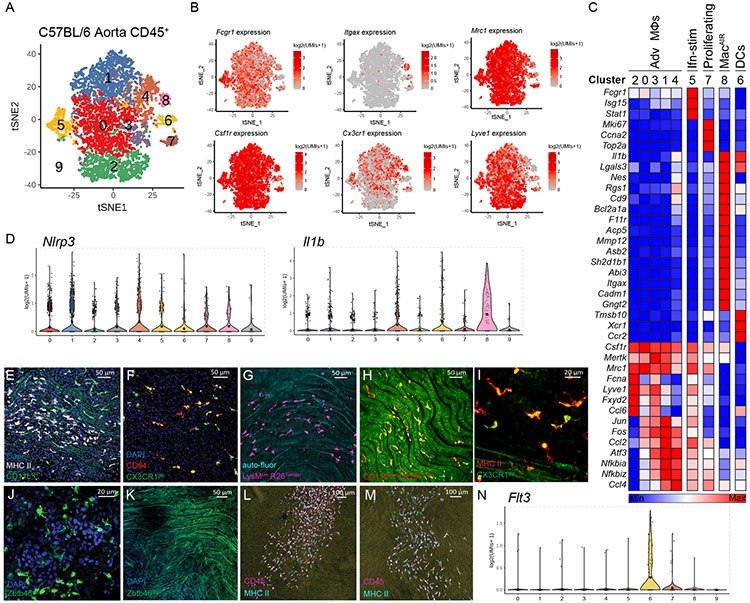
scRNA-seq of total CD45+ leukocytes isolated from dissociated C57BL/6 mouse aorta dispersed into ten unique clusters identified by an unsupervised clustering algorithm (Figure 1A). Macrophages expressing Mafb, Csf1R (CD115), MerTK, and Fcgr1 (CD64)18 were the major cells present. Adventitia macrophages expressing Lyve1 and Mrc1 (CD206) accounted for seven of the ten clusters (Figure 1B). Only cluster 8 fit the criteria of so-called “vascular dendritic cells (DCs)”, co-expressing Itgax (encoding CD11c) and Cx3cr18,9. However, rather than identifying as DCs, these cells were enriched in macrophage genes. A small population of classical Xcr1+ dendritic cells were identified (cluster 6 Figure 1C); these lacked macrophage genes and may correspond to CD103+ classical DCs (cDC1) associated with aortic valves and adventitia14. This Xcr1+ cluster was not consistent with being the previously reported vascular DCs from aortic intima due to lack of Cx3cr1. Cluster 9 was CD45− and likely represented smooth muscle cells. No lymphocytes were observed, consistent with a paucity of T or B cells subsets observed by imaging in the steady state C57BL/6 aorta.
Figure 1.
Profiling aorta intima resident macrophages (MacAIR) in the steady state.
(A) scRNA-seq analysis of CD45+ cells isolated from 8-week old C57BL/6 mouse aorta. tSNE dimensionality reduction and unsupervised clustering were performed using Seurat package identifying 10 unique clusters. (B) Expression of principal myeloid markers (Fcgr1, Itgax, Mrc1, Csf1r, Cx3cr1 and Lyve1) shown on tSNE plot of C57BL/6 scRNA-seq data. (C) Heatmap displaying averaged gene expression profiles per cluster of unique gene signatures of C57BL/6 scRNA-seq data. (D) Violin plot of Nlrp3 and Il1b gene expression in C57BL/6 scRNA-seq data. (E) CD11c-YFP reporter animals were stained for MHC II antigen and Dapi (nuclei) then imaged for presence of myeloid cells in the intima of the aortic arch; CD11c (green), Dapi (blue) and MHC II (white). (F) CX3CR1gfp/+ (green) reporter mouse aorta was immunostained for CD64 (red) and imaged by confocal microscopy. (G) LysMcre Rosa26-lsl-Tomato mice were assessed for Tomato protein (magenta) expression by en face whole mount confocal microscopy, autofluorescence (cyan). (H) CD115-creER Rosa26-lsl-Tomato CX3CR1gfp/+ mice were treated with tamoxifen diet for 3 weeks, then aorta were imaged for presence of Tomato (red) and GFP (green) in the intima of the aortic arch. (I) CX3CR1gfp/+ (green) reporter mouse aorta was stained for MHC II (red) and imaged by confocal microscopy. (J-K) Zbtb46gfp bone marrow was transplanted into irradiated C57BL/6 recipients, reconstituted mice were assayed for GFP+ (green) cells in spleen (J) and Aorta (K). (L) Flt3−/− or (M) Flt3L−/− aorta stained for CD45 (Magenta) and MHC II (Cyan) and imaged by confocal microscopy. (N) Violin plot of Flt3 expression in C57BL/6 scRNA-seq data. scRNA-seq data (A-D, N) were derived by pooling ten C57BL/6 mouse aorta for digestion and FACS sorting, then sequencing. Heat map (C) was derived by pooling mean expression data from defined clusters. Imaging data (E-I) are representative images of n=5, (J-M) are representative of n=3.
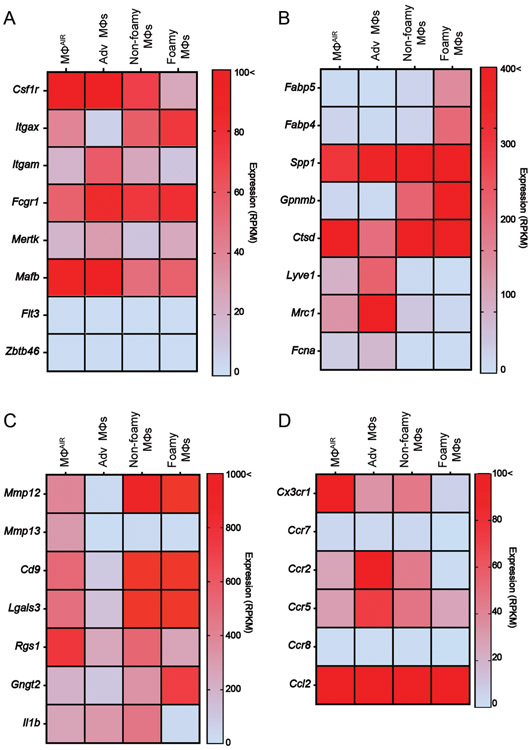
Cluster 8 expressing Itgax (CD11c) and Cx3cr1 (Figure 1B) also co-expressed Fcgr1 and Csf1R, leading us to define these cells as a bona fide macrophages, heretofore referred to as aortic intima resident macrophages (MacAIR) (Figure 1B). No other cells in our analysis co-expressed these defining genes. Consistent with other macrophage lineages, MacAIR expressed distinct genes compared to other immune cells in the aorta, with the 15 most significantly enriched genes highlighted (Figure 1C). These included genes encoding the matrix remodeling metalloprotease MMP12 and inflammatory cytokine IL-1β. However, genes expressing processing molecules for IL-1β such as NLRP3 were not detectable, suggesting the cells may reside in the aortic intima in a primed state (Figure 1D). Importantly MacAIR did not express DC-restricted genes including Zbtb46, Xcr1, Mycl, or Ccr7. The MacAIR lineage classification and specific gene signature were replicated through independent FACS sorting of MacAIR for bulk RNA-seq analysis (Extended Figure 1).
Adventitia macrophages were identified as clusters 0, 1, 2, 3, 4, 5, 7 based on overlapping expression of Mrc1, Fcgr1, and Csf1R19-21. Adventitia macrophages expressed genes distinct from MacAIR including Ccl2, Ccl6, and Lyve1 (Figure 1C). Lastly, a subpopulation of macrophages resembling adventitia cells expressed an interferon-signature including Isg15 and Stat1, as well as a proliferating macrophage pool with high mKi67 expression (Figure 1C). The contributions of these adventitia macrophage populations in aorta homeostasis or disease will need to be validated and further addressed in future studies.
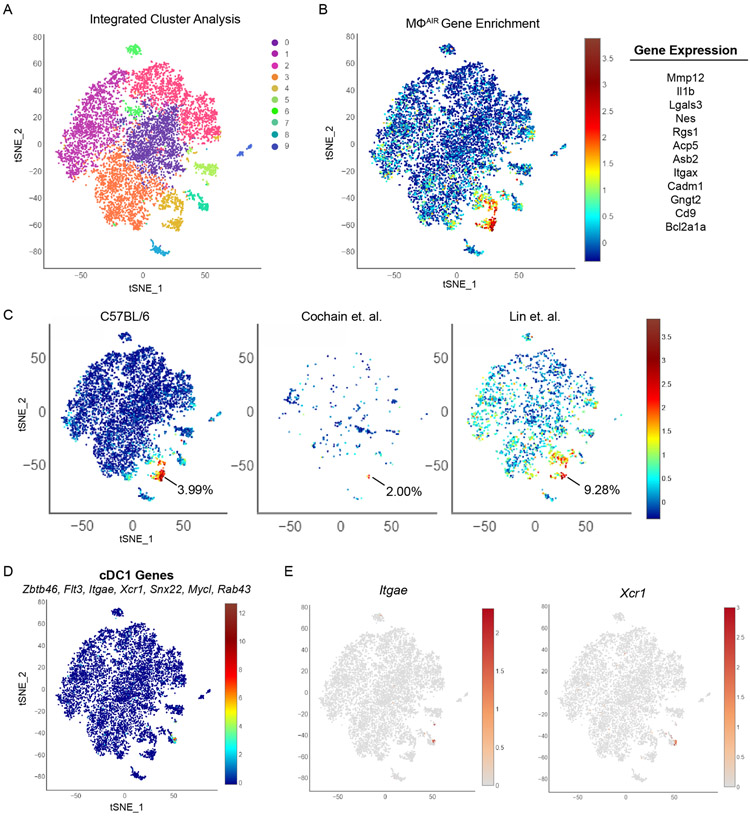
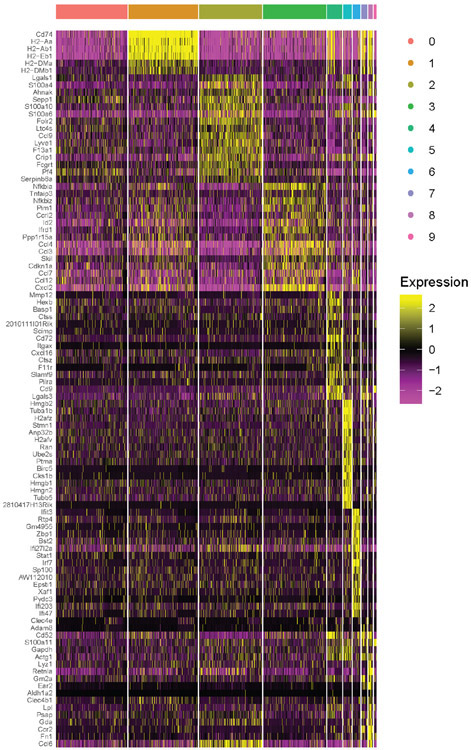
MacAIR were detected in other published aorta scRNA-seq datasets. By integrating scRNA-seq data from the C57BL/6 aorta with two published aorta leukocyte datasets22,23, a MacAIR cluster was identified independent from other macrophage populations or cDC1 cells (Extended Figure 2, Extended Figure 3). Using co-expression of Mmp12, F11r, Asb2, and Gngt2 as defining feature of MacAIR lineage, we identified ~3.99% of cells were associated with the MacAIR lineage in our study, whereas prior studies found 2.0%22 and 9.28%23. Thus, the MacAIR population is relatively rare, but detectable across multiple datasets.
Characterization of aorta intima resident macrophages
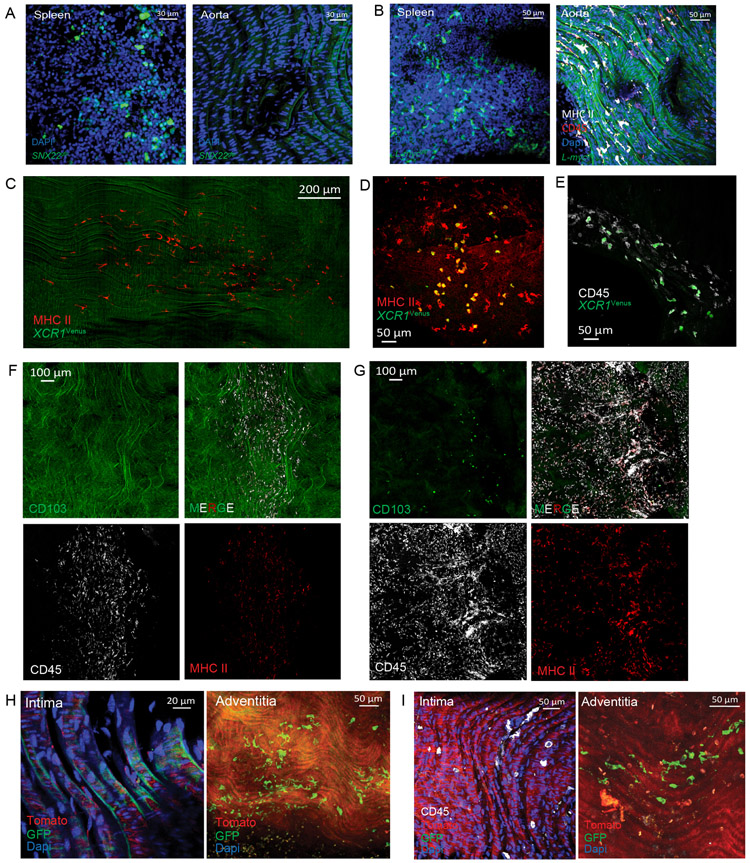
To profile the MacAIR population in the aortic intima we combined antibody labeling and fluorescent reporter mouse strains. Staining for MHC II and CD64 identified a uniform population of macrophages in the lesser curvature of the aortic arch of mice fed a normal chow diet (Figure 1E, 1F). Animals expressing fluorescent reporter proteins under control of the CD11c and CX3CR1 promoters also homogenously identified MacAIR (Figure 1E, 1F). Finally, using Cre-recombinase mediated excision under control of the Lysozyme M (Lyz2) or CD115 promoters to target conditional expression of fluorescent proteins under the Rosa26-locus was also an effective approach to identify MacAIR cells (Figure 1G, 1H). MHC II staining in aortic intima of CX3CR1gfp/+ reporter mice served to identify these cells (Figure 1I). Cells resembling MacAIR were previously found at arterial branches9. Using a GFP-reporter mouse strain to identify definitive DCs, Zbtb46gfp DCs were observed in tissues like spleen known to contain DCs, but GFP was not detected in MacAIR cells in the aorta (Figure 1J, 1K). Similar outcomes were observed in the Snx22GFP/+ and L-mycGFP/+ reporter strains (Extended Figure 4A-B)24. Mice with impaired DC development, Flt3−/− or Flt3L−/− strains, showed no loss of MacAIR cells and Flt3 expression was absent from Cluster 8 (Figure 1L-N). XCR1+ cDC1s were detected by scRNA-seq analysis, so we sought to determine whether these cells were localized to the intima or adventitia of the aorta. Using XCR1-venus reporter mice or CD103 antibody staining, we observed that cDC1 cells were present in the adventitia and aortic valves, but not the intima region of the aorta (Extended Figure 4C-G). These multiple approaches validated our interpretation of RNA sequencing data and confirmed MacAIR to be macrophages present in the intima of non-diseased aortae.
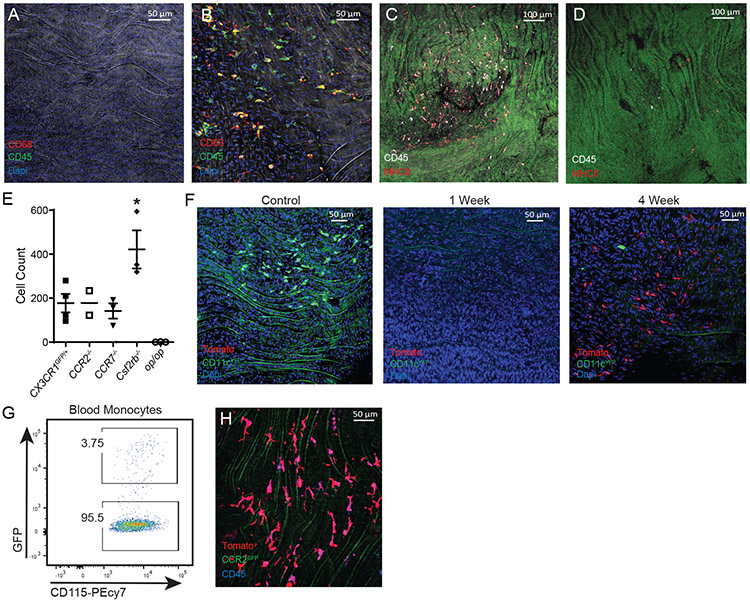
Numerous mechanisms regulate tissue entry and maintenance of macrophages25. We interrogated known pathways to identify whether common myeloid migratory or growth factors controlled MacAIR entry or maintenance in the aorta. Indeed, we observed a complete loss of MacAIR in the absence of Csf1, using op/op mutant mice (Figure 2A). IL-34, by contrast, was not required for MacAIR (Figure 2B)26. Tamoxifen-induced deletion of Csf1r, the receptor for CSF-1 or IL-34, in the adult mouse led to an ~80% reduction of MacAIR in the intima (Figure 2C, 2D), suggesting that Csf1-signaling is required for continued maintenance of MacAIR. In contrast to the necessity of Csf1r, Csf2rβ−/− mice conversely showed a dramatic expansion of MacAIR (Figure 2E).
Figure 2.
Aorta intima resident macrophages (MacAIR) are Csf1-dependent.
Aorta from (A) op/op (Csf1-mutant) and (B) IL-34−/− mice were stained for CD68 (red) and CD45 (green) and imaged by confocal microscopy with Dapi (blue). Aorta from (C) control or (D) tamoxifen treated CD115creER Csf1rf/f mice were stained for CD45 (white) and MHC II (red) in and imaged by confocal microscopy. (E) Quantification of MacAIR numbers in the aortic arch of CX3CR1gfp/+ (Cntl), CCR2−/−, CCR7−/−, Csf2rb−/−, and op/op mice. (F) CD11c-YFP reporter mice were irradiated, then reconstituted with Tomato-expressing bone marrow. Aorta were isolated from mice at 0, 1, and 4 weeks, then imaged for presence of YFP+ (green) and Tomato+ (red) cells by confocal microscope, Dapi (blue) identifies nuclei. (G-H) Competitive bone marrow chimera approach was performed with 50/50 ratio of CCR2gfp/gfp:LysMcre Rosa26-lsl-Tomato donor. After 8 weeks, (G) blood monocytes were >95% derived from GFP-negative bone marrow, confirming dependence on CCR2. (H) Aorta from bone marrow chimera mice reconstituted with 50/50 CCR2gfp/gfp:LysMcre Rosa26-stop-tomato donor bone marrow were stained for CD45 (blue) and imaged for GFP (green) and Tomato (red). Imaging data (A-D) are representative of n=3, (E) is n=2-4 mice per group as depicted in graph, (F) was performed with n=5 mice from two independent experiments, (G-H) was performed with n=3 mice from two independent experiments. Statistical analysis was performed by one-way ANOVA with multiple comparisons (CX3R1gfp/+ (Cntl) vs Csf2rb−/−, *P=0.0181), error bars are presented SEM.
Tissue-resident macrophages are typically self-maintained through proliferation, requiring only limited support from monocytes in homeostasis27. However, some macrophage populations, such as small peritoneal macrophages 13 or those elicited in inflammation arise from monocytes. To determine whether MacAIR were self-maintained, we first studied the Ccr2−/− mouse, which possesses a severe reduction in circulating monocytes28. We observed no reduction in MacAIR, consistent with a tissue-resident macrophage phenotype (Figure 2E). Similar results were found in the Ccr7−/− mouse aorta, as previously reported15.
Bone marrow chimera approaches revealed MacAIR were sensitive to irradiation (10 gy), repopulating the intima within 4 weeks following bone marrow transplantation (Figure 2F). The newly seeded MacAIR were dependent on CCR2 as assessed in mice set up with a 50%/50% mixture of CCR2-deficient (GFP-expressing) with CCR2-sufficient (tomato-expressing) donor marrow (Figure 2G, 2H). Thus, MacAIR are typical macrophage-lineage cells dependent on monocytes for repopulation following irradiation.
Fate-mapping MacAIR development and maintenance
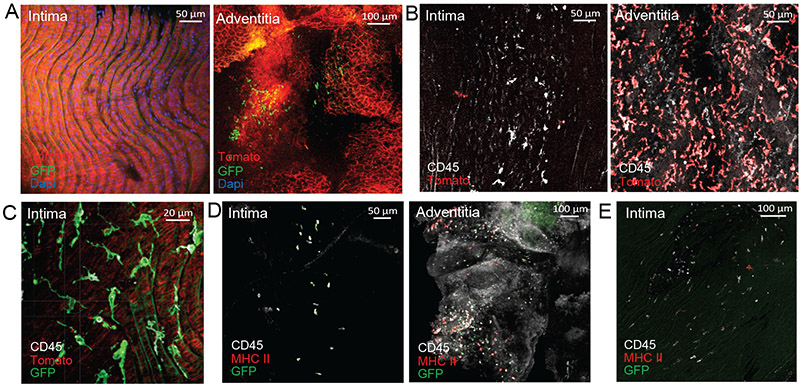
Macrophage origins have been proposed to influence macrophage function in a variety of models27,29,30. Pregnant dams, expressing tamoxifen-inducible reporter alleles (Rosa26mTmG) under control of the CD115-promoter and injected with tamoxifen at E8.5, E11.5, or E14.5 to show yolk sac or fetal liver-derived origins, respectively, displayed no labeling of MacAIR in adult mice (Figure 3A, Extended Figure 4H-I). This contrasted with other macrophage populations with known yolk-sac or embryonic origins20,31, including adventitia macrophages (Figure 3A, right panel). To resolve a timeline for initial seeding, we performed lineage fate-mapping using the CX3CR1creER/+ R26TdTomato reporter system by pulse-labeling pregnant dams at E18.5 to label cells that develop during late embryogenesis. 10-week old animals taken from E18.5 labeled mothers showed partial labeling of the MacAIR populations (<20%), whereas adventitia macrophages were heavily labeled (>95%). These data suggest that adventitia monocytes seed prior to MacAIR and that the majority of MacAIR cells seed postnatally. Use of Flt3-cre constitutive reporter mice to identify cells developing from hematopoietic stem cell progenitors showed full labeling of MacAIR, indicating origin from definitive hematopoiesis (Figure 3C).
Figure 3.
Aorta intima resident macrophages (MacAIR) develop from bone marrow progenitors and seed the aorta at birth.
(A) Embryonic labeling at E8.5 was performed using CD115creER Rosa26-mTmG mice. Aorta were collected from adult animals and assessed for GFP (green) and Tomato (red) expression in MacAIR (left) and adventitia (right) by confocal microscopy (Dapi, blue). (B) Embryonic labeling of CX3CR1creER/+ Rosa26-lsl-Tomato mice was performed at E18.5. Immune cells were identified in the aortic arch by CD45 (white) staining, along with Tomato (red) expression in the aortic arch (left) and adventitia (right) by confocal microscopy. (C) Aorta from Flt3cre Rosa26-mTmG mice were stained with CD45 antibody (white) and imaged for GFP (green) and Tomato (red) expression in the aortic arch. (D) CCR2gfp/+ postnatal day 1 (P1) pups were stained for CD45 (white) and MHC II (red), and were imaged by en face confocal microscopy showing intima (left) and adventitia (right). (E) CCR2gfp/+ postnatal day 4 (P4) pups were stained for CD45 (white) and MHC II (red), then imaged by confocal microscopy, showing intima (left) and adventitia (right) macrophages expressing GFP (green), CD45, and MHC II. Images are representative of (A) n=8 from three independent experiments (B) n=3 from two independent experiments, (C) n=5 from two independent experiments, (D) n=4 from two independent experiments (E) n=5 animals from two independent experiments.
To determine when MacAIR develop, we examined CCR2gfp/+ newborn pups at postnatal day 1 (P1) and P4. In these mice, circulating monocytes are express GFP and recently recruited monocyte-derived cells maintain GFP for a period of time following tissue entry. At P1, a few CD45+ GFP+ cells were present in the intima of the aortic arch, but none expressed MHC II (Figure 3D). By P4, MacAIR were GFP− MHC II+, suggesting transition into a self-maintained macrophage population (Figure 3E). We conclude that some MacAIR cells develop late in utero, but the majority derive from infiltrating monocytes shortly after birth.
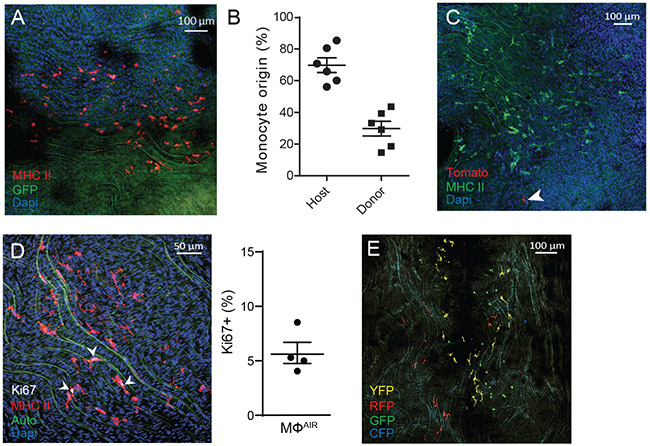
We next examined macrophage proliferation32,33 using parabiosis, a surgical method to connect the microvasculature of animal pairs, examining parabionts at two weeks or five months after pairing. Fluorescent reporter mice (either CX3CR1gfp/+ or Rosa-mTmG) were paired with C57BL/6 mice. At 2-weeks of pairing, MacAIR population did not turn over, but blood monocytes were mixed at ~30% (Figure 4A, 4B). 6-months of shared circulation showed <1% of MacAIR replaced by cells originating from the parabiont (Figure 4C). Figure 4C arrow identifies a single cell observed to originate from parabiont after 6-months of pairing. Therefore, MacAIR cells do not require constant maintenance from outside progenitors for continued persistence in the tissue.
Figure 4.
Aorta intima resident macrophages (MacAIR) maintain independent of circulating progenitors and proliferate within the tissue.
(A) Parabiosis was performed to surgically link the microvasculature of CX3CR1gfp/+ reporter mice with C57BL/6 for 2 weeks, then sacrificed and assessed for transfer of cells between animals. Whole-mount immunostaining of MHC II (red) shows no cross-over of GFP+ cells between parabionts. (B) Blood analysis of 2-week parabiotic pairs shows donor/host ratios for monocytes. (C) Parabiosis was performed surgically linking the microvasculature of (cre-negative) Rosa26-mTmG reporter mice (all cells Tomato+) with C57BL/6 for 5 months, then sacrificed and assessed for cellular turn over. Whole mount confocal imaging of MHCII (green) identified resident macrophages and rare Tomato+ (red) cells were observed. (D) Aorta from C57BL/6 mice were stained for Ki67 (white) and MHC II (red) expression, imaged by confocal microscopy, and counted for the frequency of Ki67+ cells within the MacAIR population in the intima. (E) CX3CR1creER Rosa26-lsl-Confetti mice were pulsed with tamoxifen to induce recombination of stochastic fluorescent reporter alleles. Mice were left on chow diet for 4 weeks, then assessed by confocal imaging for clustering of cells of similar color to represent cellular proliferation within the tissue. Data are representative of (A) n=9 from three independent experiments, (B) representative of n=6 pairs from three independent experiments, (C) n=5 mice from two independent experiments, (D) n=4 mice across two independent experiments, and (E) n=3 from independent experiments. Error bars on graphs are presented as SEM.
To assess whether MacAIR expressed proliferation markers within tissues, we stained for Ki67, an established marker of the cell cycle34. In 12-week old C57BL/6 mice, Ki67+ macrophages and non-macrophages were observed in the intima of the aortic arch. Approximately 5.72% of MacAIR were proliferating among ~233 MacAIR cells counted across four samples (Figure 4D). By interrogating scRNA-seq data from WT mice, we found 2.5% of MacAIR transcriptionally expressed mKi67. Unsupervised cluster analysis originally localized this small fraction to the “proliferation” cluster 7. However, when filtering all macrophages based on genes most highly enriched in the MacAIR cluster, a number of cells resembling the resident macrophage population were observed in the proliferating cluster (expressing common proliferation genes mKi67 and CyclinD1). The increased percentage of Ki67-protein detected in the aorta compared to the mRNA expression could be attributed to the longevity of proteins to sustain in the cells compared to short-lived mRNA.
To further examine local proliferation, we utilized a pulse-chase labeling approach in combination with a stochastic (confetti) reporter system. In this approach, cells undergoing proliferation will deposit daughter cells in close association with the parent cell resulting in clusters of similarly colored cells. This method applies well for macrophages since they are typically not considered migratory cells within aorta35. Mice were pulsed with tamoxifen to induce reporter expression. After 4 weeks, MacAIR clustered in close association with cells of the same reporter color (Figure 4E), supporting the conclusion that MacAIR undergo a slow rate of local proliferation and do not require monocyte recruitment for homeostatic maintenance.
Deletion of MacAIR reduced lipid deposition and delays lesion initiation
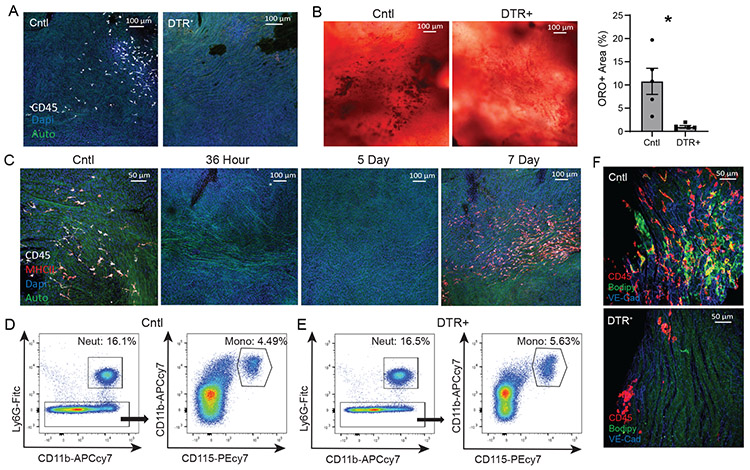
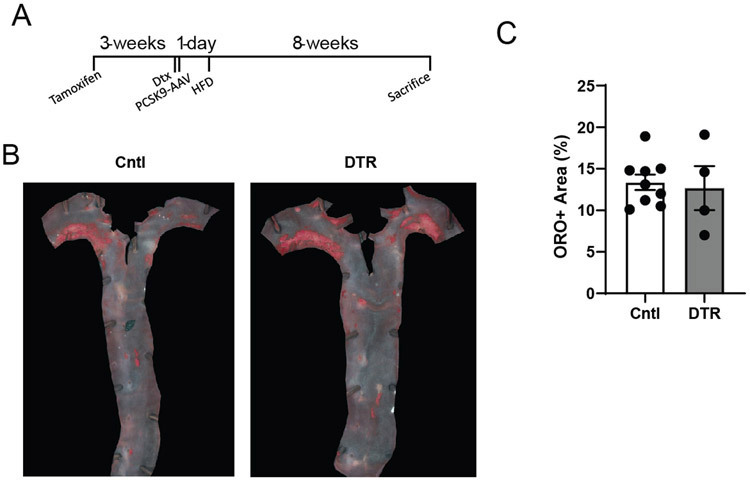
Previously, MacAIR depletion using the CD11c-DTR mouse model reduced the amount of lipid deposition in the aortic arch in early lesions16. Repeating this approach by adoptively transferring CD11c-DTR bone marrow into irradiated Ldlr−/− recipients showed efficient depletion of the MacAIR population 24 hours after diphtheria toxin injection (Figure 5A). Furthermore, feeding HFD for 5 days resulted in punctate deposition of neutral lipids in control aorta, whereas in the absence of MacAIR, lipid deposition was limited (Figure 5B). To perform this experiment without depleting all CD11c-expressing cells like systemic DCs, we utilized an inducible DTR expression system to induce deletion of a more restricted population. Using CX3CR1creER x CD115-lsl-DTR, we pulsed animals with tamoxifen to induce recombination of the DTR allele only in cells expressing both CX3CR1 and CD115. Since MacAIR are long-lived in the tissue and proliferate, they will maintain expression of DTR. To restrict DTR expression to only resident cells, we rested the mice on chow diet for 21 days to allow monocytes to arise from DTR-negative progenitors. This approach avoids deletion of many resident macrophage populations in the mouse, since CX3CR1 is not maintained in mature cells: such as alveolar, peritoneal, and splenic macrophages36. DTR-mediated depletion showed rapid loss of MacAIR that persisted for ~7 days before recovering to normal cellular density (Figure 5C). Monocyte or neutrophil levels were unaffected after diphtheria exposure (Figure 5D, 5E). This conditional-DTR expression approach attenuated cellular accumulation and lipid deposition in the aortic arch following induction of hypercholesterolemia by PCSK9-AAV injection, followed by 5 days of HFD feeding (Figure 5F). However, following the single DTR-mediated depletion, loss of resident macrophages did not have long-term effects on plaque size when animals were fed HFD for extended periods of time (Extended Figure 5). This may be due to the rapid replacement of MacAIR following depletion, allowing for a delay in initiation, but that after weeks of HFD that difference is no longer measurable. These results are consistent with the hypothesis that MacAIR contribute to early lesions through formation of lipid-loaded cells and could potentially act as mediators of endothelial activation to promote monocyte recruitment.
Figure 5.
Aorta intima resident macrophages (MacAIR) promote monocyte recruitment in early atherosclerotic lesions.
(A) C57BL/6 (Cntl) or CD11c-DTR (DTR+) mice were assessed for MacAIR depletion in the aortic arch following diphtheria toxin (Dtx) injection, staining for CD45 (white). (B) C57BL/6 (Cntl) or CD11c-DTR bone marrow was adoptively transferred into irradiated Ldlr−/− mice, followed by 8-week reconstitution. Mice were then injected with diphtheria toxin on day 0 and fed HFD for 5 days, then aorta were collected and stained for oil red o (neutral lipid) in the aortic arch and quantified. (C) CX3CR1creER/+ x CD115-stop-DTR mice were treated with tamoxifen to conditionally express DTR on MacAIR. Mice were rested for three weeks, then given Dtx to determine depletion and recovery kinetics of MacAIR; Control (day 0, no Dtx), 36 hr post Dtx treatment, 5 day post Dtx treatment, and 7 days post treatment. Samples are co-stained for CD45 (white) and MHCII (red). (D-E) CX3CR1creER/+ x CD115-stop-DTR or control mice were treated with tamoxifen, rested for three weeks, then given Dtx to determine depletion of circulating myeloid cells at 24 hours. (F) CX3CR1creER/+ x CD115-stop-DTR or control mice were treated with tamoxifen, then rested on chow diet. Mice then received i.v. injection of PCSK9-AAV virus to promote hypercholesterolemia and the following day mice were given Dtx and placed on HFD. After 5 days, aorta were isolated and assessed for CD45+ cells (red) and co-stained with bodipy (neutral lipid, green) and VE-cadherin (blue). Data are representative of (A-B) represent 2 independent experiments with 5 animals per group. (C-E) representative images from three independent experiments. (F) Representative images from 2 independent experiments with 5 animals per group. Statistical analysis was performed using nonparametric T-test (*p=0.0079), and error bars represent SEM.
Contributions of intima resident macrophages to atherosclerotic lesion development
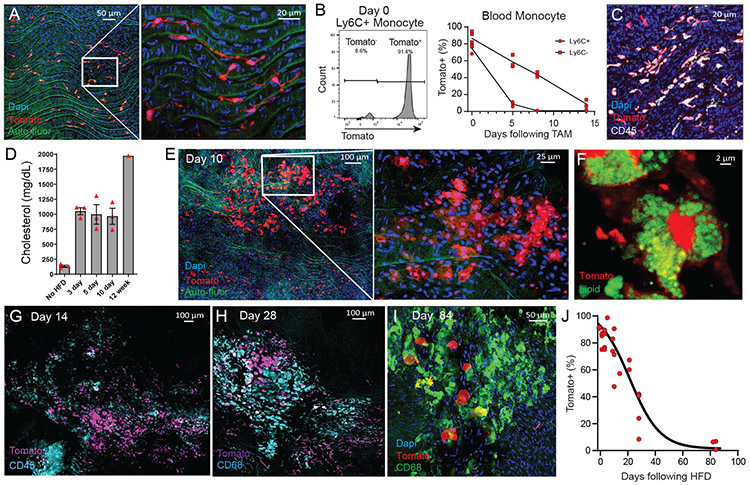
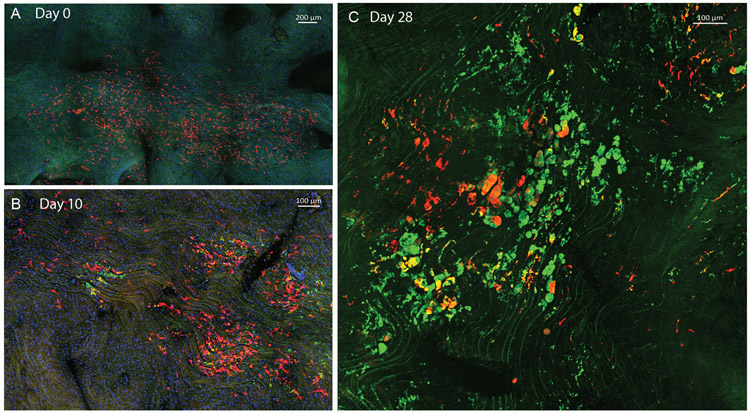
We next sought to fate-map the contribution of MacAIR to atherosclerosis progression. Using CX3CR1creER Rosa−lsl-Tomato Ldlr−/− mice following tamoxifen-induced expression of fluorescent Tomato, we observed uniform labeling of MacAIR (Figure 6A), as well as (~80%) classical and (~90%) nonclassical monocytes in the circulation (Figure 6B). However, resting the mouse on chow diet cleared the blood of labeled monocytes. After ~14 days monocytes were predominantly unlabeled (Figure 6B) and MacAIR remained uniformly Tomato-labeled (Figure 6C). Thereafter, mice were placed on HFD to induce hypercholesterolemia and lesion initiation, with the ability to track resident (Tomato+) and recruited (Tomato−) cells during disease progression. Following HFD, hypercholesterolemia could be detected in the serum within 3 days (Figure 6D), but at 3 days no noticeable morphological changes to MacAIR were observed. MacAIR morphology was visually changed to resemble foamy macrophage-appearing cells in the arterial intima by 10 days HFD feeding (Figure 6E). Regions of foamy-cell morphology were adjacent to regions of resident macrophages that maintained normal morphology, suggesting that exposure to elevated cholesterol levels alone was not sufficient to promote foamy cell formation of all MacAIR in the artery wall. Importantly, lipid staining showed that intima resident macrophages were lipid-loaded foam cells (Figure 6F). Within two weeks of HFD treatment, recruited monocytes (Tomato−) presented in the plaques, homing in on the central plaque area with labeled Tomato+ MacAIR–derived foamy cells (Figure 6G, 6H). Similar results were obtained using a bone marrow chimera approach (Extended Figure 6). These data suggest that MacAIR are key initiators of the lesion, defining its early center. However, when disease progression continued for 84 days, a negligible number of Tomato-labeled MacAIR–derived macrophages were observed in plaque (Figure 6I). This replacement of MacAIR was quantified over time (Figure 6J). It appears that resident macrophage proliferation within the lesion is insufficient for long-term maintenance of foam cells, and rather that monocytes are necessary to maintain plaque macrophages beyond early time points.
Figure 6.
Fate-mapping aorta intima resident macrophages in the progression of atherosclerosis.
(A) CX3CR1creER Rosa26-lsl-Tomato Ldlr−/− mice were treated with tamoxifen by oral gavage three times over a week, then sacrificed and imaged by en face whole mount confocal microscopy. (B) Blood monocyte labeling efficiency following tamoxifen treatment of CX3CR1creER Rosa26-lsl-Tomato Ldlr−/− mice, showing Tomato expression as assessed by flow cytometry for classical monocytes (CD115+ CD11b+ Ly6G− Ly6C+) at day 0 (left panel). Labeling kinetics for classical and non-classical monocytes in the blood tracked for 14 days after tamoxifen treatment (right panel). (C) Following tamoxifen treatment, CX3CR1creER Rosa26-lsl-tomato Ldlr−/− mice were rested on chow diet for three weeks, then assayed by whole mount en face confocal microscopy for Tomato (red) labeling of MacAIR co-stained with CD45 (white). (D) Serum cholesterol levels of CX3CR1creER Rosa26-lsl-tomato Ldlr−/− mice following labeling regiment and started on HFD feeding.(E-I) Following tamoxifen treatment, CX3CR1creER Rosa26-lsl-tomato Ldlr−/− mice were rested on chow diet for three weeks, then fed HFD for 10-days (E-F), 14 days (G), 28 days (H), and 84 days (I). MacAIR were tracked based on expression of Tomato and recruited cells were stained by antibody labeling, as indicated on the micrographs. (J) Following MacAIR labeling, the frequency of Tomato+ cells was calculated across the course of disease, from 0-84 days of HFD feeding. Data are derived from (A) n=9 from three independent experiments, (B) n=6 from two independent experiments, (C) n=6 from two independent experiments, (D) n=13 from a single experiment, (E-J) n=26 across all time points from three independent experiments. Error bars are presented as SEM.
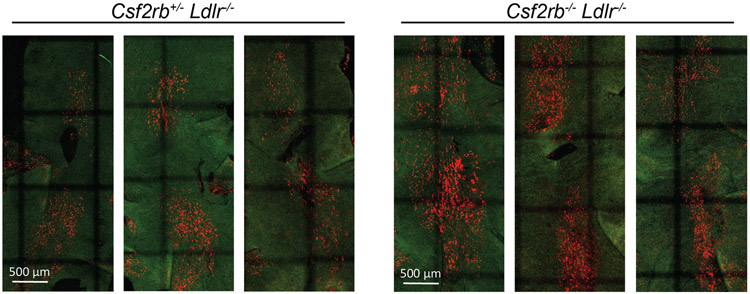
We next crossed the Csf2rb−/− strain with expanded numbers of MacAIR (Figure 2E) to Ldlr−/− mice to determine if early plaque was likewise expanded. HFD-induced monocytosis and plaque is reduced in Csf2rb−/− ApoE−/− mice 37. Csf2-deficient mice were also have defective efferocytosis38. In our experiment, Csf2rb−/− Ldlr−/− or Csf2rb+/− Ldlr−/− littermate controls were fed HFD for 12-days to observe where the expanded presence of macrophages would exacerbate lesion initiation. Indeed, Csf2rb−/− Ldlr−/− mice showed elevated numbers of foamy macrophages in plaque-prone areas (Extended Figure 7). However, many regions of the intima had abundant numbers of macrophages present without overt foamy macrophage development. This may support the concept that endothelial cells crosstalk with macrophages is an important event for the initiation of atherosclerotic lesions.
Programming macrophages by intima microenvironment in steady state and disease
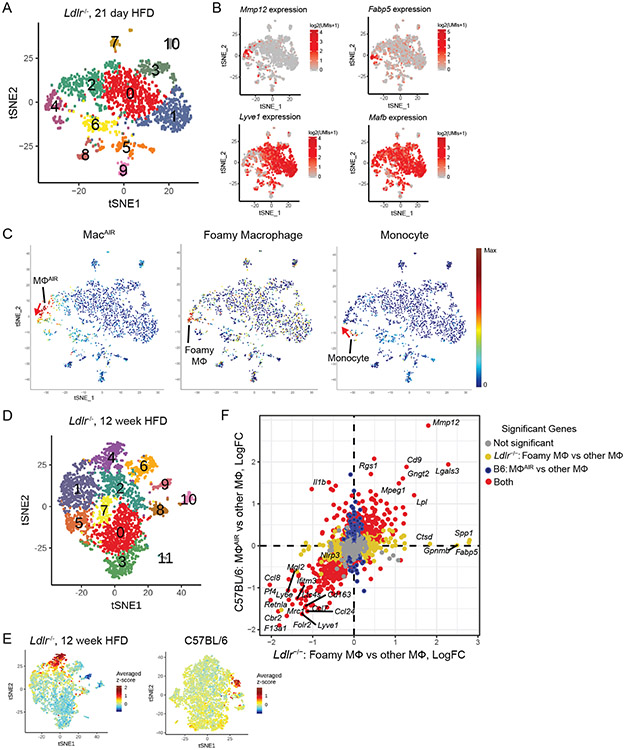
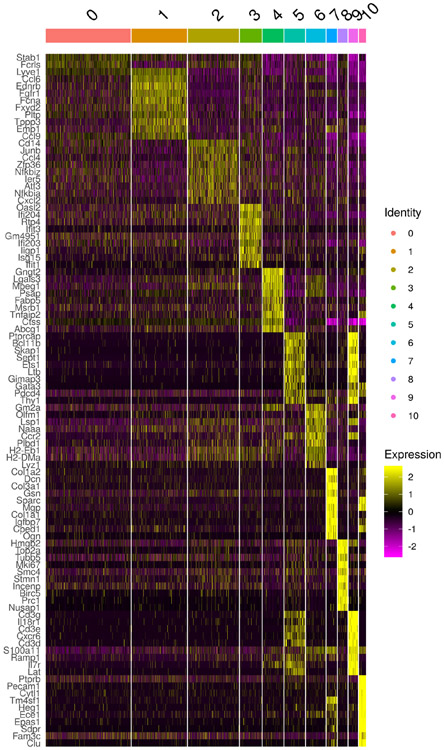
To further examine the genetic identity of foamy macrophages derived from dual origins, resident and recruited, we performed scRNA-seq on total leukocytes (CD45+) from the aorta of 21-day HFD fed Ldlr-deficient mice. At this time point, we observed a mixed source for foamy cell formation within plaque. Unsupervised clustering identified 11 unique clusters with differential gene expression (Extended Figure 8). Clusters 0, 1, 2, 3 associated with adventitia macrophages, identified by Mafb and Lyve1 co-expression (Figure 7B). MacAIR (expressing Mmp12, Il1b, Lgals3, Nes, Rgs1, Acp5, Asb2, Itgax, Cadm1, Gngt2, Cd9, Bcl2a1a) were partially responsible for the cells present in Cluster 4 (Figure 7C). A small population of classical monocytes were identified by expression of Ccr2, Ly6c2, and Hp (Figure 7C)39. To compare these populations with foamy macrophages, we utilized a set of genes enriched in foamy macrophages defined by our prior study (Fabp4, Ctsl, Atp6v0d2, Gpnmb, Fabp5, Htra1, Epb41l3, Pld3)19. Foamy macrophages localized to a unique region of Cluster 4 in close association with MacAIR- and monocyte-defined regions (Figure 7C). Since there was only a single foamy cell cluster in the day 21 HFD scRNA-seq analysis and this population is in close association with both the MacAIR and monocytes, we conclude that resident macrophage- and monocyte-derived foamy cells converge onto a uniform foamy macrophage profile regardless of cell origin.
Figure 7.
Aorta intima microenvironment promotes shared gene programs between resident macrophages in the steady state and disease.
(A) scRNA-seq analysis of CD45+ cells isolated from atherosclerotic mice fed HFD for 21-days, tSNE dimensionality reduction and unsupervised clustering were performed to identify 11 unique clusters. (B) Expression of Mmp12, Fabp5, Lyve1 and Mafb is shown by tSNE plot with color corresponding to expression levels. (C) MacAIR, foamy macrophages, and monocytes are identified by previously defined gene sets, with all populations being restricted to the cluster 4 population. With a single-foamy macrophage population present, suggesting convergence from origins corresponding to MMP12+ MacAIR or Ly6C+ monocytes (marked with red arrow). (D) tSNE plot of scRNA-seq data derived from total CD45+ cells isolated from 12-week HFD fed Ldlr−/− mice (Kim et. al. 2018), identifying 12-unique clusters. (E) The top 100 foamy macrophage genes were identified by differential expression of cluster 4 vs all other macrophage clusters (0, 1, 2, 3, 5, 7, 8) in scRNA-seq dataset of 12-week HFD fed Ldlr−/− mice. Averaged expression of these 100 genes is shown in original dataset (left panel) and in C57Bl/6 scRNA-seq dataset (right panel) localizing to the MacAIR population (cluster 8). (F) Differential expression comparison between cluster 8 enrichment in C57BL/6 compared to all other macrophages on Y-axis and cluster 4 (foamy macrophage) compared to all other macrophages in Ldlr−/− 12-week HFD atherosclerotic aorta on X-axis. Grey dots represent non-significant genes, yellow represent genes enriched only in foamy macrophages, blue represents genes enriched in B6 cluster 8, and red represents genes that are significantly modulated in both foamy cells and also in cluster 8. scRNA-seq data (A-F) were derived by pooling aorta from 10 mice for each group, followed by digestion and FACS sorting, then sequencing.
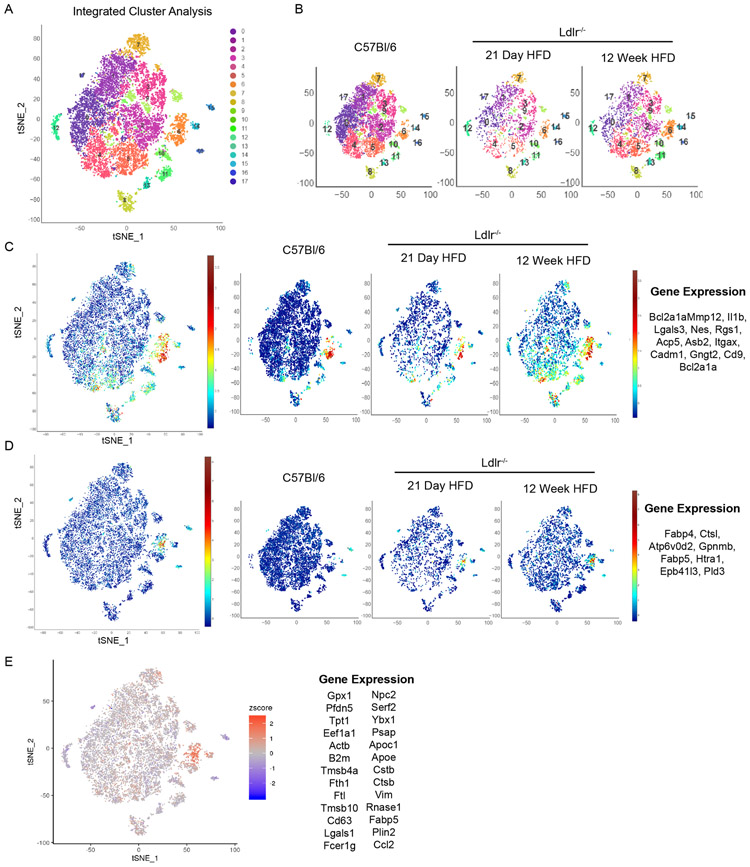
Based on this close connection of foamy macrophages and MacAIR, we sought to identify genes driven by residence in the aortic intima microenvironment and to determine whether there was a relationship in transcript expression of the MacAIR population to macrophages localized to the aortic intima in atherosclerotic lesions. Our recently described total leukocyte scRNA-seq data from 12-week HFD fed Ldlr−/− aorta19 were processed simultaneously with the C57Bl/6 scRNA-seq dataset described in Figure 1 and interrogated for association between macrophage subsets. As was previously described19, tSNE cluster analysis reveals 12 populations derived from total leukocytes in atherosclerotic aorta, with clusters 1, 2, 4, 6 localizing to the aortic intima/plaque region (Figure 7D). Cluster 4 from the 12-week HFD feeding dataset represented foamy macrophages from the atherosclerotic plaque, whereas clusters 1 and 6 represented potentially inflammation-driving monocyte derived cells19. We applied the top 100 enriched genes identifying the foamy macrophage cluster 4 in the 12-week HFD aorta against the C57Bl/6 dataset. As expected this gene set was enriched in cluster 4 of the 12-week HFD analysis, but surprisingly the genes also enriched in cluster 8 (MacAIR) population in the C57Bl/6 samples, despite the original MacAIR population not being a major contributor to foamy macrophages at the 12-week HFD fed time point (Figure 7E). Furthermore, by integrating our three scRNA-seq approaches (C57Bl/6, day 21 HFD Ldlr−/−, and 12-week HFD Ldlr−/−) into a single analysis, we observed 16-unique clusters that were represented in all samples (Extended Figure 9A-B). Significant overlap was observed between MacAIR and Foamy gene clusters into cluster 6 when previously defined genes were assessed (Extended Figure 9C-D).
Next, we determined whether murine foamy macrophages resembled foamy macrophages defined by recent scRNA-seq analysis of human atheroma samples40. There was no overt overlap in gene expression between MacAIR and the human atheroma macrophages, which may be due to the advanced nature of the human samples used. However, by applying the top 26 differentially expressed genes in the human foamy macrophage analysis, we observed localization of these genes to the same foamy cluster defined in our scRNA-seq analysis, suggesting a high degree of overlap between murine and human foamy macrophage gene expression. Not all of the human genes were individually expressed in the murine foamy cell Cluster 6. Some genes, such as Tmsb10 was enriched in non-macrophage populations, Ccl2 and Rnase1 were enriched in non-foamy macrophages, and a number of genes including B2m, Actb, Apoe, Ftl, and Fcer1g were only modestly differentially expressed between macrophage clusters and across all time points in our mouse dataset. However, many genes enriched in the human analysis showed high specificity with the foamy-macrophage cluster suggesting significant overlap in the data analysis (Gpx1, Cd63, Lgals1, Psap, Apoc1, Cstb, Ctsb, Vim, Fabp5, Plin2, and Fth1). Comparing these datasets with our top differentially expressed genes for integrated scRNA-seq analysis (Extended Figure 10), we defined analogous populations between human cluster 1 and our integrated cluster 2 (enriching for antigen presentation genes and CD74). However, other clusters defined by the human analysis were not conserved in our approach.
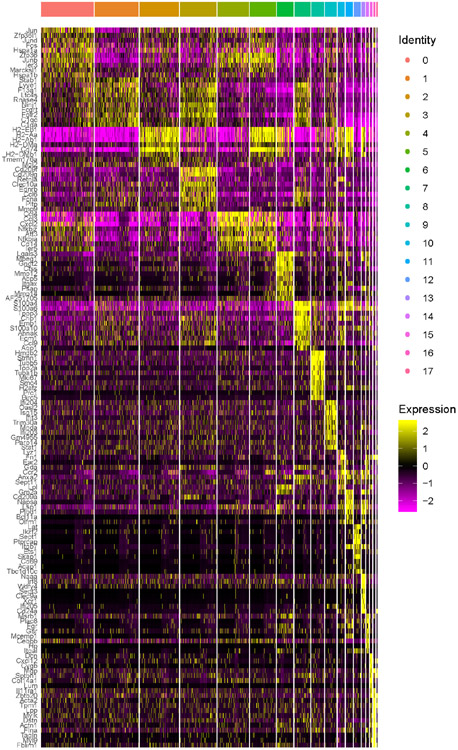
Foamy cells may require prolonged residence before fully inducing microenvironment-driven gene signatures that overlap with the resident macrophage profile. Since cluster 8 from C57BL/6 and cluster 4 from 12-week HFD fed Ldlr−/− samples were most genetically overlapping, we sought to determine which genes were most enriched between clusters as well as identify unique genes that drove their potential functional differences. Published leukocyte datasets isolated from chow fed Ldlr−/− mice did not define sufficient numbers of macrophages to be used for this approach. Therefore, we performed differential expression analysis of cluster 8 versus all other macrophages in the C57BL/6 scRNA-seq dataset and directly compared it to analysis of cluster 4 versus all other macrophages in the Ldlr−/− 12-week HFD dataset. We identified genes that enriched in both MacAIR and foamy macrophages (red dots) in the upper-right quadrant, including Mmp12, Lgals3, Cd9, and Lpl (Figure 7F), suggesting that this set of genes may be important regulators of survival within the aortic intima microenvironment. Genes enriched in intima macrophages, but not foamy cells included Il1b. Genes expressed by foamy macrophages but not MacAIR included Spp1, Fabp5, Gpnmb, and Ctsd. Other genes enriched in the foamy cell cluster included Trem2-associated genes, recently described to be induced by lipid loading in macrophages in metabolic and fatty liver disease41,42. Finally, genes that were shared by adventitia genes could be observed in the lower-left quadrant. Surprisingly, there was only limited adventitia macrophage diversity between WT and atherosclerotic conditions, which can be observed by limited genes located along the X or Y axis in the negative numerical fields. That Il1b was significantly expressed in only MacAIR without inflammasome components such as Nlrp3 suggested the MacAIR may be present in the tissue in a poised inflammatory state (Figure 1G, 1H). Together, these data identify shared microenvironment gene programs between MacAIR that reside in the intima in the steady state with monocyte-derived macrophages that form into foamy macrophages within the intima during atherosclerosis. Given that our lineage tracing analysis revealed foamy macrophages at later time points are not derived from MacAIR but nonetheless express many MacAIR genes raises the possibility that a resident MacAIR is necessary for at least some aspects of foam cell identity or differentiation.
DISCUSSION:
Our study addresses the diversity of immune cells in the aorta during the steady state and during atherosclerotic disease progression and provides a glimpse into the temporal evolution of plaque. The diversity of plaque immune cells is of great interest given the recent approaches to target the immune response for the reduction of cardiovascular-related deaths5,43. The Canakinumab Anti-inflammatory Thrombosis Outcome Study (CANTOS) was a double-blinded placebo controlled study that showed a reduction in cardiovascular-related deaths in cholesterol-controlled patients given canakinumab. Yet, the sources of IL-1β during disease progression remain poorly defined. We recently described non-foamy macrophages residing in the arterial intima, arising from newly recruited monocytes, to be highly inflammatory cells within the artery, whereas foamy macrophages from plaques were observed to be largely devoid of inflammatory cytokine mRNA19,44. Here, we find MacAIR constitutively express Il1b, but do not express genes for processing, like Nlrp3. Given the importance of MacAIR to disease initiation, it will be interesting to determine the MacAIR are the initial source of IL-1β to promote local inflammation.
Our study suggests that MacAIR cells infiltrate the artery around birth and arise from monocyte progenitors, thereafter adopting self-renewing capacity. This timeline for infiltration is consistent with dramatic changes in blood pressure that occur around birth, with increased cardiac output and arterial pressure45. These rapid and dramatic shifts accompany a myriad of changes including smooth muscle expansion and extracellular matrix remodeling46. These changes, associated with endothelial damage and onset of turbulent flow, may promote the recruitment of monocytes to the intima that in turn develop into MacAIR.
MacAIR were originally defined as vascular DCs, a designation that fit with the understanding at the time that cells highly expressing CD11c and MHC II were often DC. Following upon a now more sophisticated understanding of how macrophages and DCs differ, we revisited this designation and re-defined the myeloid population residing in the intima of the aortic arch to be of the macrophage lineage, termed MacAIR. While a CD103+ DC population was observed by gene expression analysis, these cells were not found in the aortic arch, but localized to the adventitia. Previously, MacAIR were observed to accumulate lipid in nascent arteries and proposed to promote foam cell formation within the lesion beds16. Using fluorescent labeling approaches to track the contributions of distinct myeloid lineages, we identify MacAIR to be the cells that differentiate into the first foamy cells within the arterial intima, in general agreement with past studies16. It was also clear from past studies that these intimal cells were proliferative, although a recruited vascular precursor was also proposed8,12. Using parabiosis as well as lineage pulse-labeling approach, we find that MacAIR cells largely maintain themselves in intimal tissue in the steady state, independent of recruited cells. This ability is shared with many tissue-resident macrophages in the body. However, in the context of inflammation, our data indeed support the concept that monocytes can act as progenitors that take up the phenotype of MacAIR cells, consistent with previous findings8,12.
While parabiosis has been a staple in the experimental approaches used to study macrophage turnover and origin in the last several years, we stress the importance of using bona fide lineage tracing systems for validation. In this respect, our finding that MacAIR proliferation is incapable of sustaining a major subset of plaque macrophages over time seems at odds with the findings of Robbins et al. that argued most plaque macrophage expansion was due to local proliferation17. The major argument used in their study was based on the outcome of parabiosis experiments. In retrospect, this method, used in the absence of lineage tracing techniques, resulted in incomplete ability to distinguish bone marrow derived monocytes from resident macrophages. This may have occurred because Ly6Chi monocytes, which are produced in greater abundance from the bone marrow during atherosclerosis, flooded the mouse with many newly produced Ly6Chi monocytes that the sharing of this subset between partner parabionts was minimal, potentially leading to an overestimate of local macrophage proliferation relative to recruitment. Our studies strongly emphasize the critical role of recruited monocytes in driving expansion of plaque macrophages during atherosclerosis, as we reveal that few original MacAIR cells are retained in advanced plaque.
Here we also clarify the lineage of intima-residing macrophages, MacAIR. Using in-depth genetic approaches, we define a gene expression cluster unique to MacAIR population. Lineage tracking and knockout mouse models resolved the ontogeny and functional maintenance of this population in homeostasis. Using depletion and fate-mapping approaches, we further determined their contribution to atherosclerotic plaque formation. Finally, combining our new analysis with published findings, we have concluded that foamy macrophages derived from dual origins, differentiate into a single foamy-macrophage cluster, and that foamy macrophages converge to express a subset of microenvironment-driven genes that are partly shared with the original resident macrophage gene profile.
ONLINE METHODS:
Mice
Animal strains used for experiments included: B6 (C57BL/6, Jackson Laboratory (Jax) 000664), Ldlr−/− (B6.129S7-Ldlrtm1Her/J, Jax 002207), CX3CR1creER (B6.129P2(C)-Cx3cr1tm2.1(cre/ERT2)Jung/J, Jax 020940), CX3CR1gfp (B6.Cg-PtprcaCx3cr1tm1Litt/LittJ, Jax 008451), CD115-stop-DTR (C57BL/6-Tg(Csf1r-HBEGF/mCherry)1Mnz/J, Jax 024046), Rosa26-lsl-tomato (B6.Cg-Gt(ROSA)26Sortm9(CAG-tdTomato)Hze/J, Jax 007909), Rosa26-mTmG (B6.129(Cg)-Gt(ROSA)26Sortm4(ACTB-tdTomato,-EGFP)Luo/J, Jax 007676), CCR2gfp (B6(C)-Ccr2tm1.1Cln/J, Jax 027619), LysMcre (B6.129P2-Lyz2tm1(cre)Ifo/J, Jax 004781), Csf2rb−/− (B6.129S1-Csf2rbtm1Cgb/J, Jax 005940), CD115creER (FVB-Tg(Csf1r-cre/Esr1*)1Jwp/J, Jax 019098) were backcrossed to full B6 background at the Washington University Mouse Genetics Core, Csf1rflox (B6.Cg-Csf1rtm1.2Jwp/J, Jax 021212), Op/Op (B6;C3Fe al a-Csf1op/J, Jax 000231), CCR7−/− (B6.129P2(c)-Ccr7tm1Rfor/J, Jax 006621), CD11c-YFP (B6.Cg-Tg(Itgax-Venus)1Mnz/J, Jax 008829), Zbtb46gfp (129S-Zbtb46tm1Kmm/J, Jax 018534), L-Mycgfp (B6.129S6(C)-Mycltm1.1Kmm/J, Jax 024666), Snx22GFP (B6.129S6-Snx22tm1.1Kmm/J, Jax 031837), CD11c-DTR (B6.FVB-1700016L21RikTg(Itgax-DTR/EGFP)57Lan/J, Jax 004509), Rosa26-lsl-Confetti (Gt(ROSA)26Sortm2(CAG-Brainbow2.1)Cle/J, Jax 013731), Flt3L−/− (C57BL/6-Flt3ltm1lmx/TacMmjax, Jax 37395), Flt3−/− (Flk2−/−)47, Flt3cre (TG(Flt3-cre)48, IL-34−/− (IL-34LacZ/LacZ)26, and XCR1Venus 49. Animals were placed into experiments between 6-10 weeks of age. All mice were bred and housed in specific pathogen free conditions maintained by either the Washington University School of Medicine Division of Comparative Medicine or the University of Minnesota Medical School Research Animal Resources. Facilities were maintained at ambient temperature of ~23-24 degrees Celsius, with 12/12-hour light/dark cycle, food available ad libitum, humidity not reported. Cages were changed weekly and water was either changed twice-weekly or freely available through Lixit valve. All experiments and procedures were approved by either Washington University School of Medicine Animal Studies Committee or the University of Minnesota Medical School Institutional Animal Care and Use Committee.
High fat diet/Tamoxifen/Dt treatment:
HFD was purchased from Envigo Teklad diet #TD.88137 adjusted calories diet (42% from fat). Tamoxifen diet from Envigo Teklad diet #TD.130857 (500 mg/Kg) was used. Diets were provided ad libitum. For tamoxifen gavage, tamoxifen (Sigma Aldrich #T5648) was diluted in sterile corn oil to 20 mg/mL and gavaged 200 μL per mouse/day for three consecutive days. Diphtheria toxin (Sigma Aldrich) was provided by i.p. injection at 200 ng/mouse in a 200 μl injection.
Bone marrow Chimera:
Recipient mice were irradiated with 1100 rad using a Cesium irradiation source. Mice were rested for 4 hours, then 5×10^6 donor bone marrow cells were adoptively transferred by i.v. injection to the recipient. Mice were allowed to reconstitute for 8 weeks prior to experimentation, with >95% of hematopoietic cells deriving from donor origins.
Whole-mount imaging:
Aorta were isolated and fixed in 4% paraformaldehyde/30% sucrose overnight and prepared by manually removing the perivascular adipose tissue, then lumen was exposed by cutting longitudinally along the greater curvature of the aortic arch. Samples were blocked and permeabilized in a 5% donkey serum, 1% Triton x-100, PBS buffer for 1 hour rotating at room temperature. Antibodies were diluted 1:500 and incubated overnight in 4-degrees Celsius. Samples were washed 3 times in 1 mL PBS, then stained with secondary antibody (1:1000 dilution) and further incubated at 4-degrees Celsius for 3 hours. Samples were washed 3 times in PBS and imaged by confocal microscopy. For Ki67-staining, aorta samples from C57BL/6 mice were freshly isolated, then incubated directly into fixation/permeabilization buffer (Biolegend, Cat 421403) for 1 hour rotating at room temperature. Samples were then washed in permeabilization buffer for an additional hour rotating at room temperature. Antibody staining was then performed, as described above. All images were collected using a 4-laser upright Leica SPE, 4-laser inverted Leica SP8, or a 7-laser inverted Leica SP8 microscopes, all with full spectral detectors. Image collection was performed using Leica LAS X software, and analysis was performed using Leica LAS X or Imaris (Bitplane) v8 and v9 software.
Bulk and Single-Cell RNA sequencing:
Analysis of total CD45+ cells from chow fed C57BL/6 (n = 10) or CX3CR1creER/+ Rosa26-lsl-Tomato Ldlr−/− mice (n = 10) that were treated with tamoxifen 3-weeks prior to being fed high-fat diet for 21 days, were pooled and digested with an enzyme mixture19. Aortic single cells were stained with anti-CD45 antibody (Biolegend, clone 30-F11) and propidium iodide (PI). Live CD45+ cells were sorted out using FACS AriaIII (BD Bioscicences). Sorted cells were resuspended in a final concentration of ~100 cells/μL in 1X PBS containing 0.04% bovine serum albumin (BSA). Approximately ~17,400 cells were partitioned into nanoliter-scale Gel Bead-In-EMulsions (GEMs) to achieve single cell resolution for a maximum recovery of 10,000 individual cells per sample. Utilizing the v2 Chromium™ Single Cell 3ʹ Library Kit and Chromium instrument (10x Genomics, Pleasanton, CA), poly-adenylated mRNA from an individual cell was tagged with a unique 16-bp 10x barcode and a 10- bp Unique Molecular Identifier (UMI). Full-length cDNA was then amplified to generate sufficient quantity for library construction. Enzymatic fragmentation and size selection were used to optimize cDNA amplicon size (~400 bp) for library construction. The final library was sequence ready and contains four unique sample indices. The concentration of the 10x single-cell library was accurately determined through qPCR (Kapa Biosystems, Wilmington, MA) to produce cluster counts appropriate for the HiSeq4000 platform (Illumina). Read lengths (26 × 98 nt) were generated targeting ~50,000 reads per cell.
For bulk RNA-seq, the aortic intimal cells were prepared from C57BL/6 mice, stained for intima macrophage markers CD64, MHCII, and CD11c-expression and sorted out. For adventitia macrophages from 26-week HFD fed ApoE−/− mice (n=6), samples were prepared by separating adventitia from aorta as described previously19, following by sorting CD64+ live macrophages. The libraries were prepared from cell lysates in Cell Lysis Buffer (Takara-Clontech, Kusatsu, Japan) containing 5% RNase inhibitor. Double stranded (ds)-cDNA was prepared using the SMARTer Ultra Low RNA Kit for Illumina Sequencing (Takara-Clontech) according to manufacturer’s instructions. cDNA was fragmented using a Covaris E220 sonicator with the following parameter, duty cycle, 10; intensity, 5; cycles/burst, 200; time, 180 seconds. The cDNAs were blunt ended, supplemented with an A base at the 3ʹ end, and then ligated with Illumina sequencing adapters. The ligated fragments were amplified for 12 cycles using primers that incorporated unique index tags. The amplified fragments were sequenced on an Illumina HiSeq-3000 using single reads extending 50 bases.
Alignment, barcode assignment and UMI counting using CellRanger v 2.0.2 was used to perform sample demultiplexing, barcode processing, and single-cell 3ʹ counting. “Cellranger mkfastq” was used to demultiplex raw base call files from the HiSeq4000 sequencer into sample-specific FASTQ files. Files were demultiplexed with 98%+ perfect barcode match, and 72%+ q30 reads. Subsequently, FASTQ files for each sample were processed with “cellranger count” to align reads to the mm10 mouse genome. The default estimated cell count value of 10,000 was used. For CD45+ cells from C57bl/6 mice (n = 10) CellRanger estimated 6277 cells with greater or equal to 1601 UMIs, with 2109 genes detected at average (median value). For Ldlr−/− mice (n = 10) fed a high-fat diet for 21 days CellRanger estimated 2447 cells with greater of equal to 2056 UMIs, with 2527 genes detected at average (median value). Other barcodes in both experiments were considered noise and low-quality cells and were filtered out. For analysis, Seurat package50 (version 3.0) was used and Cell Ranger filtered genes by barcode expression matrices were used as analysis inputs. The fraction of mitochondrial genes was calculated for every cell, and cells with a mitochondrial fraction > 5% were filtered out. After visual analysis of detected RNA vs detected genes plot, for Ldlr−/− dataset we also filtered out cells with lower than 3167 UMIs, since they were of lower quality compared to the rest of the dataset. After all filtering procedures, 5994 cells were left in scRNA-seq of C57bl/6 mice and 2132 cells were left in scRNA-seq of Ldlr−/− mice (n = 10) fed a high-fat diet for 21 days.
UMI counts and fraction of mitochondrial reads were two sources of unwanted variation and were removed with the “RegressOut” function. Expression measurements for each cell were normalized to total expression and then scaled to 10,000, after which log normalization was performed.
For both datasets, dimensionality reduction and clustering the most variable genes were detected using the “FindVariableGenes” function using “mean.var.plot” as a selection method and a principal component analysis (PCA) was run with these genes only. Thresholds of 7 principal components (PCs) for scRNA-seq of C57bl/6 mice and 20 PCs for scRNA-seq of Ldlr−/− mice were identified using the elbow method applied to explained variance by each component. We used these identified numbers of PCs in downstream methods. Cells were then represented with t-SNE plots. We applied the “RunTSNE” function to normalized data using the identified above number of principal components. For clustering, we used “FindClusters”, which implements shared nearest neighbor (SNN) modularity optimization-based clustering algorithm on identified above number of principal components with a resolution of 0.6. For both datasets, we identified cluster markers using “FindMarkers” function using MAST method. Only genes detected in 25% of the cells of the cluster and with at least 0.25 log fold change were considered as markers and tested for differential expression. All p-values were corrected for testing multiple genes (Bonferroni correction).
For Figure 7F panel, we used previously described dataset from Kim et al.19 and performed differential expression (using MAST method51) of foamy macrophage (cluster 4) against other MФs. Then, using scRNA-seq of C57bl/6 mice, we performed differential expression of MacAIR (cluster 8) against other MФs. We then made a scatter plot for genes present in both comparisons using log fold changes in both comparisons as coordinates. Genes were colored if Bonferroni corrected p value was < 0.01 at least in one comparison.
Integrated scRNA-seq analysis was done using Seurat v3 and SCTransform52. Briefly, SCTransform was applied to filtered gene-expression matrices from 3 datasets: B6 WT, 21-day HFD and 12-week HFD. Percentage of mitochondrial content was regressed out during this step. Next steps were SelectIntegrationFeatures, PrepSCTIntegration, FindIntegrationAnchors and IntegrateData as recommended by Seurat guidelines. This procedure created an integrated normalized dataset. PCA analysis was performed and first 20 principal components were used further to generate tSNE dimensionality reductions, clustering was also performed using these 20 principal components. tSNE was run using FIt-SNE as an implementation53. Graph-based clustering was run using FindNeighbors and FindClusters with resolution 0.6. The same pipeline was used to integrate datasets B6 WT, GSM3507491 (regression group)23 and GSM2882368 (healthy aorta)22, but clustering resolution was set to 0.3. To generate heatmaps we used FindConservedMarkers with MAST differential expression to obtain markers conserved in all three samples. DoHeatmap was used to generate heatmaps. To obtain the number of proliferating cells MacAIR in integrated analysis of B6 WT, Lin et al., and Cochain et al. we used genes F11r, Mmp12, Asb2, Gngt2 to identify intimal macs within the proliferative cluster. For each of these genes we calculated Z-score across all the cells. We averaged the Z-score, and labeled cells with Z-score > 2.5 as MacAIR lineage.
Bulk RNA-seq data acquisition, quality control, and processing RNA-seq reads were aligned to the Ensembl 76 top-level assembly with STAR (version 2.0.4b). Gene counts were derived from the number of uniquely aligned unambiguous reads by Subread:featureCount (version 1.4.5). Transcript counts were produced by Sailfish (version 0.6.3). Sequencing performance was assessed for total number of aligned reads, total number of uniquely aligned reads, genes and transcripts detected, ribosomal fraction, known junction saturation, and read distribution over known gene models with RSeQC (version 2.3).
Flow cytometry:
For blood analysis, whole blood was collected from the facial vein into EDTA treated tubes and 10 μL were used for cell count using a Nexcelom cellometer. Red blood cells (rbc) were lysed using RBC lysis buffer (ebioscience) for 5 minutes on the benchtop. Prior to staining, single cell suspensions were blocked with anti-CD16/32 antibody (2.4G2, Biolegend) diluted 1:1,000, then stained for specific antigens. Antibodies conjugated to Alexa488, Fitc, Alexa647, PE, PEcy7, APCcy7, PerCPefluor710, Pacblue, and Brilliant Violet605 were used at 1 μg/mL in 50 μL volume, including anti-CD45 (clone 30-F11), anti-CD11c (clone N418), anti-CD11b (M1/70), anti-CD64 (clone X54-5/7.1), anti-CD115 (clone AFS98), anti-Ly6G (clone 1A8), anti-Ly6C (clone HK1.4) from Biolegend. Cells were stained for 30 minutes on ice, then washed and assessed by flow cytometry using a BD x-20 or Fortessa instrument, using FACS Diva software v8. Analysis was performed using Flowjo v10 (Treestar). Gating strategies for sorting aorta macrophages were previously published in detail and blood gating strategy is outlined in Supplemental Figure 119,54.
Cholesterol analysis:
Serum was collected by centrifuging clotted blood at 2700 rpm in a table top centrifuge for 10 minutes. Samples were assayed using a Wako diagnostics Cholesterol-E kit (999-02601) following manufacturer’s instructions.
Oil red o staining:
Aorta were fixed in 4% paraformaldehyde overnight, then cleaned of perivascular adipose. Samples were incubated in propylene glycol for 5 minutes in microcentrifuge tubes. Samples were then transferred into Oil Red O (ORO) solution (Sigma O1516) for 3 hours. Aorta were washed 3 times in water, then imaged using widefield microscopy.
Parabiosis:
Mice of the same age, sex, and weight were used for parabiosis studies. The surgery was performed by anesthetizing animals with a ketamine/xylazine mixture. Incision sites shaved, then sterilized with ethanol and iodine. Incisions were made on complementary sides of the animal pair from the knee up to the elbow of the same side. Animals were sutured at the arm and leg, then skin was connected by 7 mm stainless steel clips. Mice were treated with 150 μL buprenorphine (30 μg/mL) with 500 μl dextrose daily for pain management. Wound clips were removed two weeks post-surgery.
Statistical analysis:
Statistical analysis was performed in GraphPad Prism V8.2.0 software. When two groups were compared, non-parametric student T-test was performed with a Mann-Whitney post-test. When multiple groups were being compared a one-way ANOVA was performed with multiple comparisons. Significance was determined by a p–value <0.05, with exact p-values reported in figure legends. All graphs are presented with error bars depicting standard error of mean (SEM).
Data Availability
Gene expression data (bulk RNA-seq or scRNA-seq) have been uploaded to Gene Expression Omnibus (GEO) repository for public availability under accession GSE116271, GSE116239, GSE154817, and GSE154921. All other data that support the findings presented in this study are available from the corresponding author upon reasonable request.
Extended Data
Extended Data Fig. 1.
Profiling aorta macrophage populations by bulk RNA-seq Bulk sorted MacAIR from C57BL/6 mice and adventitia, intima non-foamy, and intima foamy macrophages from 26-week HFD fed ApoE−/− mice were profiled for gene expression by RNA-seq19. Gene groupings for (A) macrophage and DC genes, (B) foamy and adventitia macrophage genes, (C) MacAIR enriched genes, and (D) genes associated with chemokine signaling in myeloid cells. Data are mean expression values derived from pooled macrophages from two biological replicates for MacAIR derived from 10-pooled aorta each, and three biological replicates each for ApoE−/− samples from 6-pooled aorta each.
Extended Data Fig. 2.
MacAIR are detected across multiple scRNA-seq approaches (A) scRNA-seq data from C57BL/6 total CD45+ cells was integrated with two published studies where CD45+ aorta cells from chow-fed Ldlr−/− mice22 and atherosclerosis regression samples23, identifying 10 unique clusters. (B) Top 12 enriched MacAIR genes were used to define MacAIR cluster as cluster 4, presented as relative expression. (C) MacAIR cells were detectable in all three datasets with a relative abundance between 2.00-9.28%. (D) cDC1 genes (Zbtb46, Flt3, Itgae, Xcr1, Snx22, Mycl, and Rab43) were interrogated against the integrated dataset, defining a unique DC population. (E) Itgae and Xcr1 gene expression plotted on integrated t-SNE cluster map.
Extended Data Fig. 3.
Differential gene expression between clusters of integrated dataset of C57BL/6, Ldlr−/−, and regression scRNA-seq experiments Top differentially expressed genes are listed with expression level across the 10 unique groups identified by unsupervised clustering of the integrated data of C57BL/6, chow fed Ldlr−/−22, and regression23 scRNA-seq datasets.
Extended Data Fig. 4.
Profiling myeloid cells in the aorta Spleen and aorta samples from (A) SNX22gfp and (B) L-Mycgfp reporter mice were assessed for presence of cDC1 in respective tissues, GFP (green) and Dapi (blue). In panel B aorta, sample was co-stained with CD45 (red) and MHC II (white) antibody. Aorta from XCR1-venus reporter mice were isolated and stained for MHC II (red) or CD45 (white) expression by antibody labeling, then imaged in whole-mount for presence of cDC1 in the (C) aortic arch intima, (D) adventitia, and (E) aortic valve. C57Bl/6 (WT) aorta was isolated and stained for CD103 (green), MHC II (red), and CD45 (white) by antibody labeling and imaged by confocal microscopy for cDC1 presence in the (F) intima of the aortic arch or (G) the adventitia of the aorta. Embryonic labeling was performed using CD115creER Rosa26-mTmG mice. Aorta were collected from adult animals and assessed for GFP (green) and Tomato (red) expression in mice labeled at (H) E11.5, and co-stained with CD45 (white) in mice labeled at (I) E14.5. Data are representative of (A) n=3, (B) n=3, (C-E) n=6 in two experiments, (F-G) n=6 in two experiments, (H) n=3, and (I) n=5 in two experiments.
Extended Data Fig. 5.
Atherosclerotic plaque development in the aorta of hypercholesterolemic mice following acute depletion of MacAIR (A) Following the schematic, CX3CR1creER CD115-stop-DTR mice were used to conditionally express DTR on MacAIR cells by gavage with tamoxifen, waiting three weeks to allow circulating cells to repopulation from DTR-negative progenitors. MacAIR cells were depleted by i.p. injection of diphtheria toxin and hypercholesterolemia induced by i.v. injection of AAV-PCSK9. Mice were started on HFD the following day. Mice were sacrificed and assessed for plaque area in the aortic arch by oil red o (ORO) staining. (B) Representative images of ORO staining and en face imaging. (C) Quantification of plaque area on the aortic arch. Data are from n=7, Cntl and n=4 for DTR-group and are the result of a single experiment, error bars represent SEM.
Extended Data Fig. 6.
Fate-mapping MacAIR during atherosclerosis progression in bone marrow transplant model Recipient Ldlr−/− mice were lethally irradiated and reconstituted with CX3CR1creER Rosa26-lsl-Tomato bone marrow. Mice were rested for 8-weeks for full hematopoietic reconstitution, then treated with tamoxifen by gavage to induce Tomato expression in CX3CR1-expressing cells, including MacAIR. (A) Three weeks after tamoxifen labeling, MacAIR remained Tomato+ (red) positive. Mice were then fed HFD and assessed for plaque development at (B) 10 days and (C) 28 days. MacAIR can be observed by Tomato-expression, whereas recruited cells were stained with CD68 (green) antibody. Samples are all en face whole mount confocal images of the aortic arch. Images are representative of n=3 for each time point.
Extended Data Fig. 7.
Csf2rb−/− Ldlr−/− mice fed HFD for 12 days Csf2rb+/− Ldlr−/− or Csf2rb−/− Ldlr−/− mice were fed HFD for 12 days to induce atherosclerotic lesions in the aortic arch. Aorta were stained for MHC II (red) and imaged by tile scanning whole mount confocal microscopy for macrophage burden and morphologic changes associated with foamy cell development. Three representative images (n=7 for Csf2rb+/− Ldlr−/−) or (n=4 Csf2rb−/− Ldlr−/−) were selected from a single experiment.
Extended Data Fig. 8.
Differential gene expression analysis of scRNA-seq of CD45+ cells from Ldlr−/− aorta after 21-days HFD feeding The top 10 enriched genes for each cluster are reported for scRNA-seq analysis of total CD45+ cells from Ldlr−/− mice fed HFD for 21 days.
Extended Data Fig. 9.
Integrated scRNA-seq analysis across atherosclerosis progression (A) scRNA-seq data from sorted CD45+ aorta cells isolated from C57Bl/6, 21-day HFD Ldlr−/−, and 12-week HFD Ldlr−/− mice was integrated and clustered into 16 populations. (B) All clusters were represented across unique time points. (C) MacAIR geneset (Mmp12, Il1b, Lgals3, Nes, Rgs1, Acp5, Asb2, Itgax, Cadm1, Gngt2, Cd9, Bcl2a1a) expression analysis of integrated cluster map and across time points. (D) Foamy macrophage geneset (Fabp4, Ctsl, Atp6v0d2, Gpnmb, Fabp5, Htra1, Epb41l3, Pld3) expression analysis of integrated cluster map and across time points. (E) Human foamy macrophage geneset (Gpx1, Pfdn5, Tpt1, Eef1a1, Ctb, B2m, Tmsb4x, Fth1, Ftl, Tmsb10, Cd63, Lgals1, Fcer1g, Npc2, Serf2, Ybx1, Psap, Apoc1, Apoe, Cstb, Ctsb, Vim, RnaseI, Fabp5, Plin2, Ccl2) expression analysis in the murine integrated scRNA-seq cluster map, suggesting shared gene expression programs between human and murine foamy macrophage subsets.
Extended Data Fig. 10.
Differential gene expression from integrated scRNA-seq analysis across atherosclerosis time course scRNA-seq data from sorted CD45+ aorta cells isolated from C57Bl/6, 21-day HFD Ldlr−/−, and 12-week HFD Ldlr−/− mice were integrated and clustered into 16 populations. Top 10 differentially expressed genes are shown for each cluster.
Supplementary Material
ACKNOWLEDGEMENTS:
Flt3cre mice were provided by Dr. Douglas Mann, Washington University School of Medicine (WUSM); Flt3−/−, Flt3L−/−, SNZ22gfp, L-Mycgfp, and Zbtb46gfp mice were provided by Dr. Kenneth Murphy (WUSM); IL-34−/− and CCR2gfp mice were provided by Dr. Marco Colonna (WUSM); op/op mice were provided by Dr. Emil Unanue (WUSM); Csf2rb−/− mice were provided Dr. Brian Edelson (WUSM). We would also like to thank Maddison Vail (UMN), the WUSM Flow Cytometry Core Facility, WUSM McDonnell Genome Institute, and WUSM GTAC Genome Technology Access Center for technical assistance on this study.
RESEARCH SUPPORT:
The authors declare no competing financial interests. Research was supported by National Institutes of Health (NIH) R00 HL138163 to J.W.W., AHA 16SDGG30480008 to B.H.Z., T32 AI007313 to C.G.T., P01 AI35296 to B.T.F., and NIH R37 AI049653 and DP1DK109668 to G.J.R. J.W.W. was supported by NIH 2T32DK007120-41 and AHA 17POST33410473. J-H.C. was supported by Korean Health Technology R&D Project HI15C0399, Ministry of Health, Welfare & Family Affairs, South Korea. K.Z. was supported by Government of Russian Federation (Grant 08-08).
Footnotes
ONLINE CONTENT:
A detailed description of experimental design, reagents, and software used for this study can be found online in our Life Sciences Reporting Summary. Additional references, methods, and supplemental information are also available online.
REFERENCES:
- 1.Geovanini GR & Libby P Atherosclerosis and inflammation: Overview and updates. Clinical Science 132, 1243–1252 (2018). [DOI] [PubMed] [Google Scholar]
- 2.Benjamin EJ et al. Heart Disease and Stroke Statistics-2019 Update: A Report From the American Heart Association. Circulation 139, e56–e66 (2019). [DOI] [PubMed] [Google Scholar]
- 3.Libby P, Lichtman AH & Hansson GK Immune Effector Mechanisms Implicated in Atherosclerosis: From Mice to Humans. Immunity 38, 1092–1104 (2013). [DOI] [PMC free article] [PubMed] [Google Scholar]
- 4.Williams JW, Huang L. hao & Randolph GJ Cytokine Circuits in Cardiovascular Disease. Immunity 50, 941–954 (2019). [DOI] [PMC free article] [PubMed] [Google Scholar]
- 5.Ridker PM et al. Antiinflammatory therapy with canakinumab for atherosclerotic disease. N. Engl. J. Med 377, 1119–1131 (2017). [DOI] [PubMed] [Google Scholar]
- 6.Randolph GJ Mechanisms that regulate macrophage burden in atherosclerosis. Circulation Research 114, 1757–1771 (2014). [DOI] [PMC free article] [PubMed] [Google Scholar]
- 7.Dick SA, Zaman R & Epelman S Using High-Dimensional Approaches to Probe Monocytes and Macrophages in Cardiovascular Disease. Front. Immunol 10, 1–7 (2019). [DOI] [PMC free article] [PubMed] [Google Scholar]
- 8.Jongstra-Bilen J et al. Low-grade chronic inflammation in regions of the normal mouse arterial intima predisposed to atherosclerosis. J. Exp. Med 203, 2073–2083 (2006). [DOI] [PMC free article] [PubMed] [Google Scholar]
- 9.Choi JH et al. Identification of antigen-presenting dendritic cells in mouse aorta and cardiac valves. J. Exp. Med 206, 497–505 (2009). [DOI] [PMC free article] [PubMed] [Google Scholar]
- 10.Meredith MM et al. Expression of the zinc finger transcription factor zDC (Zbtb46, Btbd4) defines the classical dendritic cell lineage. J. Exp. Med 209, 1153–1165 (2012). [DOI] [PMC free article] [PubMed] [Google Scholar]
- 11.Satpathy AT et al. Zbtb46 expression distinguishes classical dendritic cells and their committed progenitors from other immune lineages. J. Exp. Med 209, 1135–1152 (2012). [DOI] [PMC free article] [PubMed] [Google Scholar]
- 12.Zhu SN, Chen M, Jongstra-Bilen J & Cybulsky MI GM-CSF regulates intimal cell proliferation in nascent atherosclerotic lesions. J. Exp. Med 206, 2141–2149 (2009). [DOI] [PMC free article] [PubMed] [Google Scholar]
- 13.Kim K-W et al. MHC II + resident peritoneal and pleural macrophages rely on IRF4 for development from circulating monocytes. J. Exp. Med 213, (2016). [DOI] [PMC free article] [PubMed] [Google Scholar]
- 14.Choi JH et al. Flt3 signaling-dependent dendritic cells protect against atherosclerosis. Immunity 35, 819–831 (2011). [DOI] [PubMed] [Google Scholar]
- 15.Roufaiel M et al. CCL19-CCR7-dependent reverse transendothelial migration of myeloid cells clears Chlamydia muridarum from the arterial intima. Nat. Immunol 17, 1263–1272 (2016). [DOI] [PubMed] [Google Scholar]
- 16.Paulson KE et al. Resident intimal dendritic cells accumulate lipid and contribute to the initiation of atherosclerosis. Circ. Res 106, 383–390 (2010). [DOI] [PubMed] [Google Scholar]
- 17.Robbins CS et al. Local proliferation dominates lesional macrophage accumulation in atherosclerosis. Nat. Med 19, 1166–1172 (2013). [DOI] [PMC free article] [PubMed] [Google Scholar]
- 18.Gautier EL et al. Gene-expression profiles and transcriptional regulatory pathways that underlie the identity and diversity of mouse tissue macrophages. Nat. Immunol 13, 1118–1128 (2012). [DOI] [PMC free article] [PubMed] [Google Scholar]
- 19.Kim K et al. Transcriptome analysis reveals nonfoamy rather than foamy plaque macrophages are proinflammatory in atherosclerotic murine models. Circ. Res 123, (2018). [DOI] [PMC free article] [PubMed] [Google Scholar]
- 20.Ensan S et al. Self-renewing resident arterial macrophages arise from embryonic CX3CR1 + precursors and circulating monocytes immediately after birth. Nat. Immunol 17, (2016). [DOI] [PubMed] [Google Scholar]
- 21.Lim HY et al. Hyaluronan Receptor LYVE-1-Expressing Macrophages Maintain Arterial Tone through Hyaluronan-Mediated Regulation of Smooth Muscle Cell Collagen. Immunity 49, 326–341.e7 (2018). [DOI] [PubMed] [Google Scholar]
- 22.Cochain C et al. Single-cell RNA-seq reveals the transcriptional landscape and heterogeneity of aortic macrophages in murine atherosclerosis. Circ. Res 122, 1661–1674 (2018). [DOI] [PubMed] [Google Scholar]
- 23.Lin J. Da et al. Single-cell analysis of fate-mapped macrophages reveals heterogeneity, including stem-like properties, during atherosclerosis progression and regression. JCI insight 4, (2019). [DOI] [PMC free article] [PubMed] [Google Scholar]
- 24.Wumesh KC et al. L-Myc expression by dendritic cells is required for optimal T-cell priming. Nature 507, 243–247 (2014). [DOI] [PMC free article] [PubMed] [Google Scholar]
- 25.Perdiguero EG & Geissmann F The development and maintenance of resident macrophages. Nature Immunology (2016). doi: 10.1038/ni.3341 [DOI] [PMC free article] [PubMed] [Google Scholar]
- 26.Wang Y et al. IL-34 is a tissue-restricted ligand of CSF1R required for the development of Langerhans cells and microglia. Nat. Immunol 13, 753–760 (2012). [DOI] [PMC free article] [PubMed] [Google Scholar]
- 27.Williams JW, Giannarelli C, Rahman A, Randolph GJ & Kovacic JC Macrophage Biology, Classification, and Phenotype in Cardiovascular Disease: JACC Macrophage in CVD Series (Part 1). J. Am. Coll. Cardiol 72, (2018). [DOI] [PMC free article] [PubMed] [Google Scholar]
- 28.Serbina NV & Pamer EG Monocyte emigration from bone marrow during bacterial infection requires signals mediated by chemokine receptor CCR2. Nat. Immunol (2006). doi: 10.1038/ni1309 [DOI] [PubMed] [Google Scholar]
- 29.Lavin Y et al. Tissue-resident macrophage enhancer landscapes are shaped by the local microenvironment. Cell 159, 1312–1326 (2014). [DOI] [PMC free article] [PubMed] [Google Scholar]
- 30.Zhu Y et al. Tissue-Resident Macrophages in Pancreatic Ductal Adenocarcinoma Originate from Embryonic Hematopoiesis and Promote Tumor Progression. Immunity 47, 323–338.e6 (2017). [DOI] [PMC free article] [PubMed] [Google Scholar]
- 31.Epelman S et al. Embryonic and adult-derived resident cardiac macrophages are maintained through distinct mechanisms at steady state and during inflammation. Immunity 40, 91–104 (2014). [DOI] [PMC free article] [PubMed] [Google Scholar]
- 32.Hashimoto D et al. Tissue-resident macrophages self-maintain locally throughout adult life with minimal contribution from circulating monocytes. Immunity 38, 792–804 (2013). [DOI] [PMC free article] [PubMed] [Google Scholar]
- 33.Davies LC et al. Distinct bone marrow-derived and tissue-resident macrophage lineages proliferate at key stages during inflammation. Nat. Commun 4, (2013). [DOI] [PMC free article] [PubMed] [Google Scholar]
- 34.Scholzen T & Gerdes J The Ki-67 protein: From the known and the unknown. Journal of Cellular Physiology 182, 311–322 (2000). [DOI] [PubMed] [Google Scholar]
- 35.Williams JW et al. Limited Macrophage Positional Dynamics in Progressing or Regressing Murine Atherosclerotic Plaques-Brief Report. Arterioscler. Thromb. Vasc. Biol 38, (2018). [DOI] [PMC free article] [PubMed] [Google Scholar]
- 36.Yona S et al. Fate Mapping Reveals Origins and Dynamics of Monocytes and Tissue Macrophages under Homeostasis. Immunity 38, 79–91 (2013). [DOI] [PMC free article] [PubMed] [Google Scholar]
- 37.Wang M et al. Interleukin-3/granulocyte macrophage colony-stimulating factor receptor promotes stem cell expansion, monocytosis, and atheroma macrophage burden in mice with hematopoietic ApoE deficiency. Arterioscler. Thromb. Vasc. Biol 34, 976–984 (2014). [DOI] [PMC free article] [PubMed] [Google Scholar]
- 38.Subramanian M, Thorp E & Tabas I Identification of a non-growth factor role for GM-CSF in advanced atherosclerosis: Promotion of macrophage apoptosis and plaque necrosis through IL-23 signaling. Circ. Res 116, e13–e24 (2015). [DOI] [PMC free article] [PubMed] [Google Scholar]
- 39.Ingersoll MA et al. Comparison of gene expression profiles between human and mouse monocyte subsets. Blood 115, (2010). [DOI] [PMC free article] [PubMed] [Google Scholar]
- 40.Fernandez DM et al. Single-cell immune landscape of human atherosclerotic plaques. Nat. Med 25, 1576–1588 (2019). [DOI] [PMC free article] [PubMed] [Google Scholar]
- 41.Jaitin DA et al. Lipid-Associated Macrophages Control Metabolic Homeostasis in a Trem2-Dependent Manner. Cell 178, 686–698.e14 (2019). [DOI] [PMC free article] [PubMed] [Google Scholar]
- 42.Xiong X et al. Landscape of Intercellular Crosstalk in Healthy and NASH Liver Revealed by Single-Cell Secretome Gene Analysis. Mol. Cell 75, 644–660.e5 (2019). [DOI] [PMC free article] [PubMed] [Google Scholar]
- 43.Ridker PM et al. Low-dose methotrexate for the prevention of atherosclerotic events. N. Engl. J. Med 380, 752–762 (2019). [DOI] [PMC free article] [PubMed] [Google Scholar]
- 44.Zernecke A et al. Meta-Analysis of Leukocyte Diversity in Atherosclerotic Mouse Aortas. Circ. Res 127, 402–426 (2020). [DOI] [PMC free article] [PubMed] [Google Scholar]
- 45.Wiesmann F et al. Developmental changes of cardiac function and mass assessed with MRI in neonatal, juvenile, and adult mice. Am. J. Physiol. - Hear. Circ. Physiol 278, (2000). [DOI] [PubMed] [Google Scholar]
- 46.Wagenseil JE & Mecham RP Vascular extracellular matrix and arterial mechanics. Physiological Reviews 89, 957–989 (2009). [DOI] [PMC free article] [PubMed] [Google Scholar]
Online References
- 47.Mackarehtschian K et al. Targeted disruption of the flk2/flt3 gene leads to deficiencies in primitive hematopoietic progenitors. Immunity 3, 147–161 (1995). [DOI] [PubMed] [Google Scholar]
- 48.Benz C, Martins VC, Radtke F & Bleul CC The stream of precursors that colonizes the thymus proceeds selectively through the early T lineage precursor stage of T cell development. J. Exp. Med 205, 1187–1199 (2008). [DOI] [PMC free article] [PubMed] [Google Scholar]
- 49.Ohta T et al. Crucial roles of XCR1-expressing dendritic cells and the XCR1-XCL1 chemokine axis in intestinal immune homeostasis. Sci. Rep 6, (2016). [DOI] [PMC free article] [PubMed] [Google Scholar]
- 50.Stuart T et al. Comprehensive Integration of Single-Cell Data. Cell 177, 1888–1902.e21 (2019). [DOI] [PMC free article] [PubMed] [Google Scholar]
- 51.Finak G et al. MAST: A flexible statistical framework for assessing transcriptional changes and characterizing heterogeneity in single-cell RNA sequencing data. Genome Biol. 16, (2015). [DOI] [PMC free article] [PubMed] [Google Scholar]
- 52.Hafemeister C & Satija R Normalization and variance stabilization of single-cell RNA-seq data using regularized negative binomial regression. Genome Biol. 20, (2019). [DOI] [PMC free article] [PubMed] [Google Scholar]
- 53.Linderman GC, Rachh M, Hoskins JG, Steinerberger S & Kluger Y Fast interpolation-based t-SNE for improved visualization of single-cell RNA-seq data. Nat. Methods 16, 243–245 (2019). [DOI] [PMC free article] [PubMed] [Google Scholar]
- 54.Williams JW et al. Thermoneutrality but Not UCP1 deficiency suppresses monocyte mobilization into blood. Circ. Res 121, (2017). [DOI] [PMC free article] [PubMed] [Google Scholar]
Associated Data
This section collects any data citations, data availability statements, or supplementary materials included in this article.
Supplementary Materials
Data Availability Statement
Gene expression data (bulk RNA-seq or scRNA-seq) have been uploaded to Gene Expression Omnibus (GEO) repository for public availability under accession GSE116271, GSE116239, GSE154817, and GSE154921. All other data that support the findings presented in this study are available from the corresponding author upon reasonable request.


