

Abstract
Background:
In light of increasing concern of potential adverse effects of caffeine intake in children, recent estimates of caffeine consumption among a representative sample of young children are needed.
Objective:
To provide estimates of caffeine intake in children, in absolute amount (mg) and in relation to body weight (mg/kg), examine the association of caffeine consumption with socio-demographic factors, and describe trends in caffeine intake among children in the United States.
Design:
We analyzed caffeine intake among 3280 children aged 2–19 y who participated in a 24-h dietary recall as part of NHANES, a nationally representative sample of the US population with a cross-sectional design, in 2009–2010. The association of caffeine consumption with socio-demographic factors was also determined. Trends over time were examined in 18,530 children aged 2–19 y, between 2001 and 2010. Analyses were conducted for all children, and repeated for caffeine consumers.
Results:
Seventy one percent of US children consumed caffeine on a given day. Median caffeine intakes (mg) for 2–5, 6–11, and 12–19 y olds were 1.3, 4.5, and 13.6, respectively; and 4.7, 9.1 and 40.6, respectively among children who consumed caffeine. Non-Hispanic black children had lower caffeine intake compared to non-Hispanic white counterparts. Caffeine intake correlated positively with age; this association was independent of body weight. On a given day, 10% and <5% of 12–19 y and 2–11 y olds, respectively consumed more than the maximum guideline of 2.5 mg/kg caffeine by Health Canada. A significant linear trend of decline in caffeine intake was noted (2001 −2010) for all children and among consumers. Specifically, intake decreased by 3.0 and 4.6 mg for 2–5 and 6–11 y old caffeine consumers, respectively.
Conclusion:
A majority of US children consumed caffeine. Caffeine intake was highest among 12–19 y, and remained stable over the 10-y study period in this age group.
INTRODUCTION
Caffeine is a commonly consumed stimulant present naturally in or added to food and beverages. Caffeine consumption in children has received considerable interest due to the concern of adverse health effects. Caffeine intake of 100– 400 mg has been associated with increased nervousness, jitteriness, and fidgetiness (1, 2). Because of continued brain development involving myelination and pruning processes, children may be particularly sensitive to caffeine (3, 4). There is some evidence that links caffeine intake in children to sleep dysfunction, elevated blood pressure, impairments in mineral absorption and bone health, as well as increased alcohol use/dependence (1, 5–7). Additionally, routine use of caffeine often as part of sugar-sweetened beverages may contribute to weight gain and dental cavities (8). Caffeine toxicity in children has also been described and involves tachycardia, CNS agitation, gastrointestinal disturbance, nausea and diuresis (6, 9, 10). Health Canada provides specific guidance for children to limit their daily caffeine intake to 2.5 mg/kg body weight (6, 11). Although no maximal intake guidelines have been set in the US, the American Academy of Pediatrics (AAP) underscores that “caffeine and other stimulant substances contained in energy drinks have no place in the diet of children” (12).
In contrast, caffeine consumption has also been associated with certain health benefits such as increased endurance, attention, and vigilance, and reduced reaction time in some studies (9, 13, 14). Perceived positive effects on mood and cognition as well as physical performance may encourage preteens and adolescents to consume caffeinated products (2, 15, 16).
The published literature on caffeine consumption in a representative sample of US children is based on older data namely the US Department of Agriculture Continuing Survey of Food Intakes by Individuals (CSFII) 1994 to 1996 and 1998 (16, 17). In addition, caffeine intake from beverages from the 1999 US Share of Intake Panel (SIP) survey among caffeine consumers has also been published (18). A 2010 FDA report also presented findings from the analysis of older data from NHANES 2005–2006 (19). Given the current debate among policy makers on the safety of caffeine intake by children (1, 12, 18) and deliberations to evaluate maximal intake recommendations, it is important to describe caffeine intake among children and adolescents from more recent data available on a nationally representative sample such as NHANES.
The trends in beverage consumption have changed over time (16, 20) and several specialty coffee beverages and energy drinks (containing caffeine) have been introduced in the last decade, some marketed especially to youth (12, 15, 16). Furthermore, pre-teens and adolescents (12–17 y) are the fastest growing segment of the population for caffeine use (1, 16). Therefore, it is important to also examine trends in caffeine intake by age in the recent decade. To our knowledge, few reports have described the trends in caffeine consumption in the US (16, 21). Thus, our objective was to provide estimates of the distribution of caffeine intake, in absolute amounts and in mg/kg body weight, in a representative sample of American children (2–19 y) using the most recent dietary data available from NHANES, i.e. 2009–2010, in relation to demographic characteristics, and to examine the trends in caffeine consumption between 2001 and 2010 among children and adolescents.
SUBJECTS AND METHODS
Study Design
NHANES is a series of large, complex, stratified, multistage probability surveys of the US civilian, non-institutionalized population, conducted by the National Center for Health Statistics (NCHS), CDC (22). Briefly, NHANES is conducted yearly, on approximately 5,000 individuals, and data are publicly released every 2 years on approximately 10,000 individuals. Participants in NHANES are administered a series of questionnaires in a detailed in-home interview, followed by a scheduled visit at the Mobile Examination Center (MEC). At the MEC visit, participants receive a physical examination as well as a dietary interview, commonly referred to as “What We Eat in America” component of NHANES. The NHANES protocol was approved by the NCHS’s Research Ethics Review board. Informed consent was obtained from persons aged ≥18 y. For participants younger than 18 y, written parental consent was obtained and child assent was obtained for those 7–17 y. The most recent available data on caffeine intake from NHANES (from the 2009–2010 survey) were used for the current analysis to describe caffeine consumption by demographic characteristics; data from this single survey cycle was sufficient to provide stable national estimates. We used NHANES data from 2001 to 2010 (2001–2002, 2003–2004, 2005–2006, 2007–2008, and 2009–2010 survey cycles) to conduct the trends analysis; due to changes in dietary data collection methodology upon merging of the CSFII with NHANES in 1999–2000, data from 1999–2000 were not included in the trends analysis. The unweighted total examination response rate for the 5 survey cycles examined, for participants 2–19 y of age, ranged from 81–88% (23).
Dietary interview
The type and quantity of all foods and beverages consumed in a single 24-h period, specifically the 24-h period before the dietary interview (from midnight to midnight) at the MEC, were collected by trained interviewers with the use of a computer-assisted dietary interview system with standardized probes i.e. the USDA’s Automated Multiple-Pass Method (AMPM). This computer program is designed to enhance complete and accurate data collection while reducing respondent burden (24, 25). For children aged ≤5 y, interviews were obtained through proxies, generally a parent. Proxies also assisted with the dietary interviews of children aged 6–11 y. Dietary intakes were self-reported for participants aged ≥12 y. Since 2003–2004, a second, telephone-administered, 24-h recall has been collected (3–10 days after the first 24-h recall at the MEC), but only one 24-h dietary recall was included in this analysis to maximize comparability between surveys. Furthermore, one 24-h recall is sufficient to estimate population means because the effects of random errors associated with dietary recall, including day-to-day variability, are generally assumed to cancel out if days of the week are evenly represented (26).
Caffeine intake for all foods and beverages consumed during the 24-h period was calculated by using the USDA Food and Nutrient Database for Dietary Studies (27). Caffeine intake was estimated by summing the caffeine consumed for each food and beverage during the 24-h recall.
Demographic variables
Sex, age, race-Hispanic origin, and poverty income ratio (PIR) were used. Age was categorized as 2–5, 6–11, and 12–19 y, consistent with NHANES sample-selection methods (28). Self-reported race-Hispanic ethnicity was categorized as non-Hispanic white, non-Hispanic black, Mexican American and other. Participants with a race-Hispanic ethnicity categorized as “other” were included in overall estimates but findings on this group are not reported (due to small sample size and unstable variance estimates for a very heterogeneous group). Socio-economic status was defined by using the poverty income ratio (PIR), an index calculated by dividing family income by a federal poverty threshold specific to family size, defined by the US Census Bureau (29). PIR was categorized as ≤130%, 131% to 349%, and ≥350%; for reference, family income corresponding to 130% PIR qualifies for the Supplemental Nutrition Assistance Program (formerly the Food Stamp Program) and free school meals (30).
Analytic population
All children and adolescents, aged 2–19 y who participated in the examination component of NHANES were eligible for the dietary interview. In each survey cycle, a small proportion (4–6%) of participants were excluded because their 24-h recall did not meet the standards of reliability or breast milk was consumed during the 24-hour period (31). The final analytic sample, after exclusions, was comprised of 4288, 3824, 4029, 3159, and 3280 participants aged 2–19 y in 2001–2002, 2003–2004, 2005–2006, 2007–2008, and 2009–2010, respectively.
Data analysis
Statistical analyses were conducted by using SAS version 9.3 (SAS Institute Inc) and SUDAAN version 11.0 (RTI International). Caffeine intake on a given day was examined in absolute amount (mg) and in relation to body weight (mg/kg) in all analyses. Caffeine intake displayed a skewed distribution; approximately 30% of the analytic population did not report any caffeine intake during the 24-h recall period. Thus, logarithmically (base 10) transformed data on caffeine intake were used to test statistical hypotheses because they were identified (using the Box-Cox procedure in SAS) to be more consistent with a normal distribution (32, 33). To accommodate respondents who reported no caffeine consumption on the day of recall, caffeine intakes of zero were set to 0.0001 to allow performing the log base 10 transformation. Extreme values were examined to determine whether they exerted undue influence. Plots of dietary sample weight versus caffeine intake demonstrated that the extreme values were not associated with influential weights. Preliminary analyses indicated that exclusion of these extreme values did not change the results; thus, no exclusions or corrections were made.
Dietary sample weights were used to account for differential probability of selection and to adjust for nonresponse, noncoverage and sample design. These publically available sample weights also include a poststratification step to balance recalls across days of the week (31).
Weighted, untransformed estimates of the 50th (median), 75th, 90th, and 95th percentiles, and percentage (and SE), were computed for children and adolescents (ages 2–19 y) by demographic characteristics. Statistical hypotheses regarding the proportion of children consuming caffeine in relation to socio-demographic variables were tested on weighted, untransformed percentages. Hypotheses concerning caffeine intake (mg and mg/kg) in relation to socio-demographic variables were tested using weighted means of the log transformed variable. SEs were estimated using Taylor series linearization. Statistical hypotheses were tested using Wald F tests with an α level of 0.05. If the hypothesis that the mean or percentage of all of the subgroups being equal was rejected, pairwise t tests were performed. Adjustment for multiple comparisons was made by using the Bonferroni method (34). Linear trends in log-transformed caffeine intake by age and PIR were determined using orthogonal contrast matrices (35). We also tested for linear trends in log-transformed caffeine intake across the survey periods, between 2001 to 2010, using orthogonal contrast matrices (35); tests were conducted for all children and within age groups over time. Analyses were carried out for all children in the analytical population and repeated for children who consumed caffeine (“consumers” only).
RESULTS
A majority (71%) of 2–19 y olds consumed caffeine on a given day (Table 1). A linear trend was noted in the proportion of 2–19 y olds who consumed caffeine with age but not with PIR. No differences were seen between males and females in terms of % of children who consumed caffeine. However, differences were noted in caffeine consumption by race-ethnicity: non-Hispanic black children (56%) were less likely to consume caffeine than non-Hispanic white (75%) or Mexican American (72%) children (Table 1); however, no differences between non-Hispanic white or Mexican American children were noted.
Table 1.
Percentage of US children 2–19 y who consumed caffeine on a given day, by demographic characteristics: NHANES 2009–20101
| Characteristics | n | % (SE) | P value2,3 |
|---|---|---|---|
| All children | 3280 | 71.0 (1.0) | |
| Age (y) | |||
| 2–5 | 861 | 58.3 (2.4) | <0.01 |
| 6–11 | 1154 | 74.9 (1.7) | |
| 12–19 | 1265 | 74.5 (2.2) | |
| Sex | |||
| Male | 1712 | 70.6 (1.9) | NS |
| Female | 1568 | 71.5 (1.3) | |
| Poverty income ratio (%)4 | |||
| ≤130 | 1422 | 70.0 (1.8) | NS |
| 131–349 | 1023 | 74.2 (1.9) | |
| ≥350 | 555 | 69.6 (2.7) | |
| Race-Hispanic ethnicity5 | |||
| Non-Hispanic white | 1101 | 74.9 (1.8)a | <0.001 |
| Non-Hispanic black | 654 | 56.3 (2.2)b | |
| Mexican American | 914 | 71.7 (2.0)a |
All values are percentages ± SEs. NS, P ≥ 0.05.
Test of linear trend for ordinal variables (age and poverty income ratio).
Wald F test, for sex and race-Hispanic origin, significance P < 0.05.
Different superscript letters represent a statistically significant difference between categories compared using t test adjusted by the Bonferroni method for multiple comparisons.
Poverty income ratio is an index calculated by dividing family income by a federal poverty threshold specific to family size, defined by the US Census Bureau.
Other race category not shown.
The distribution of caffeine intake (mg) on a given day by selected demographic characteristics (Table 2) showed that the median caffeine intake by US children 2–19 y of age was 4.6 mg. An increasing linear trend in caffeine intake was noted by age. No significant associations were found between PIR and caffeine intake. Non-Hispanic black children consumed significantly less caffeine than non-Hispanic white or Mexican American children (Table 2). No differences in caffeine intake between non-Hispanic white and Mexican American children were noted.
Table 2.
Caffeine intake on a given day, by demographic characteristics, for US children 2–19 y: NHANES 2009–20101
| Caffeine (mg/d) | |||||
|---|---|---|---|---|---|
| Characteristics | Median2 | 75th Percentile |
90th Percentile |
95th Percentile |
P value3,4 |
| All | 4.6 | 30.8 | 94.6 | 147.6 | |
| Age (y) | |||||
| 2–5 | 1.3 | 5.9 | 13.4 | 23.8 | <0.0001 |
| 6–11 | 4.5 | 19.2 | 49.7 | 72.3 | |
| 12–19 | 13.6 | 70.9 | 147.9 | 260.5 | |
| Sex | |||||
| Male | 4.7 | 30.0 | 102.1 | 169.5 | NS |
| Female | 4.5 | 31.3 | 85.1 | 132.5 | |
| Poverty income ratio (%)5 | |||||
| ≤130 | 4.5 | 30.2 | 77.4 | 131.7 | NS |
| 131–349 | 5.5 | 36.4 | 106.5 | 141.9 | |
| ≥350 | 3.6 | 26.5 | 88.9 | 153.0 | |
| Race-Hispanic ethnicity6 | |||||
| Non-Hispanic white | 6.4a | 43.2 | 112.0 | 177.9 | <0.0001 |
| Non-Hispanic black | 1.3b | 9.7 | 55.2 | 93.1 | |
| Mexican American | 4.2a | 22.7 | 70.3 | 112.8 | |
Medians and percentiles calculated from untransformed weighted data; 5th and 25th percentiles are not presented and were essentially equal to 0 due to a high proportion of children who did not consume any caffeine. n=3280.
All statistical tests were performed on log transformed means.
Test of linear trend for ordinal variables age and poverty income ratio.
Wald F test, for sex and race-Hispanic origin, significance P < 0.05.
Different superscript letters represent a statistically significant difference between categories compared using t test adjusted by the Bonferroni method for multiple comparisons.
Poverty income ratio is an index calculated by dividing family income by a federal poverty threshold specific to family size, defined by the US Census Bureau.
Other race category not shown.
When these analyses were restricted to children who consumed caffeine, i.e. “consumers” only (Table 3) the median caffeine intake on a given day was 12.4 mg. The significant linear trend for caffeine intake and age remained, with the oldest age group (12–19 y olds) having the highest caffeine intake (40.6 mg). Non-Hispanic black children consumed significantly less caffeine (8.0 mg) than non-Hispanic white children (14.4 mg) (Table 3). No other race-ethnic group differences were noted.
Table 3.
Caffeine intake among consumers of caffeine on a given day, by demographic characteristics, for US children 2–19 y: NHANES 2009–20101
| Caffeine (mg) | ||||||
|---|---|---|---|---|---|---|
| Characteristics | n | Median2 | 75th percentile |
90th percentile |
95th percentile |
P value3,4 |
| All | 2230 | 12.4 | 52.2 | 116.6 | 184.0 | |
| Age (y) | ||||||
| 2–5 | 485 | 4.7 | 10.3 | 20.9 | 36.1 | <0.0001 |
| 6–11 | 826 | 9.1 | 31.4 | 58.5 | 85.3 | |
| 12–19 | 919 | 40.6 | 96.6 | 186.3 | 284.4 | |
| Sex | ||||||
| Male | 1154 | 12.1 | 56.2 | 124.0 | 223.6 | NS |
| Female | 1076 | 12.6 | 49.0 | 105.3 | 148.0 | |
| Poverty income ratio (%)5 | ||||||
| ≤130 | 952 | 14.3 | 51.6 | 98.9 | 155.3 | NS |
| 131–349 | 717 | 11.6 | 55.4 | 119.4 | 184.2 | |
| ≥350 | 382 | 9.5 | 48.7 | 113.3 | 204.4 | |
| Race-Hispanic ethnicity6 | ||||||
| Non-Hispanic white | 819 | 14.4a | 60.1 | 137.3 | 220.2 | <0.01 |
| Non-Hispanic black | 367 | 8.0b | 41.3 | 89.4 | 109.6 | |
| Mexican American | 633 | 11.6a,b | 42.5 | 91.5 | 131.5 | |
Medians and percentiles calculated from untransformed weighted data. n=2230.
All statistical tests were performed on log transformed means.
Test of linear trend for ordinal variables age and poverty income ratio.
Wald F test, for sex and race-Hispanic origin, significance P < 0.05.
Different superscript letters represent a statistically significant difference between categories compared using t test adjusted by the Bonferroni method for multiple comparisons.
Poverty income ratio is an index calculated by dividing family income by a federal poverty threshold specific to family size, defined by the US Census Bureau.
Other race category not shown.
When caffeine intake (mg) was expressed in relation to body weight (kg), the median caffeine consumption for US children 2–19 y of age was 0.15 mg/kg (Table 4). The associations of caffeine intake (mg/kg) with age and race-ethnicity were similar as noted for caffeine intake in absolute amount (mg). Non-Hispanic black children had significantly lower caffeine intake (0.04 mg/kg) compared to other race-ethnicities examined (Table 4).
Table 4.
Caffeine intake in relation to body weight (mg per kg) on a given day, by demographic characteristics, for US children 2–19 y: NHANES 2009–20101
| Caffeine (mg/kg) | |||||
|---|---|---|---|---|---|
| Characteristics | Median2 | 75th percentile |
90th percentile |
95th percentile |
P value3,4 |
| All | 0.15 | 0.75 | 1.78 | 2.70 | |
| Age (y) | |||||
| 2–5 | 0.11 | 0.36 | 0.86 | 1.43 | <0.01 |
| 6–11 | 0.15 | 0.62 | 1.68 | 2.49 | |
| 12–19 | 0.22 | 1.13 | 2.45 | 3.27 | |
| Sex | |||||
| Male | 0.15 | 0.72 | 1.83 | 2.98 | NS |
| Female | 0.15 | 0.80 | 1.69 | 2.58 | |
| Poverty income ratio (%)5 | |||||
| ≤130 | 0.15 | 0.77 | 1.71 | 2.76 | NS |
| 131–349 | 0.17 | 0.86 | 1.87 | 2.70 | |
| ≥350 | 0.13 | 0.63 | 1.47 | 2.44 | |
| Race-Hispanic ethnicity6 | |||||
| Non-Hispanic white | 0.19a | 0.90 | 2.09 | 3.02 | <0.001 |
| Non-Hispanic black | 0.04b | 0.28 | 1.07 | 1.55 | |
| Mexican American | 0.14a | 0.65 | 1.47 | 2.21 | |
Medians and percentiles calculated from untransformed weighted data. 5th and 25th percentiles are not presented and were essentially equal to 0 due to a high proportion of children who did not consume any caffeine. n=3280.
All statistical tests were performed on log transformed means.
Test of linear trend for ordinal variables age and poverty income ratio.
Wald F test, for sex and race-Hispanic origin, significance P < 0.05.
Different superscript letters represent a statistically significant difference between categories compared using t test adjusted by the Bonferroni method for multiple comparisons.
Poverty income ratio is an index calculated by dividing family income by a federal poverty threshold specific to family size, defined by the US Census Bureau.
Other race category not shown.
When the analyses of caffeine intake (mg/kg) were restricted to children who consumed caffeine, i.e. “consumers” only (Table 5) the median caffeine intake was 0.40 mg/kg on a given day. A linear trend in caffeine intake (mg/kg) with age was again observed. As for the results concerning absolute amount (mg) of caffeine ingested among consumers only, the finding that non-Hispanic black children consumed significantly lower caffeine (0.24 mg/kg) than non-Hispanic white children (0.47 mg/kg) remained unaltered (Table 5). No other race-ethnic differences were noted.
Table 5.
Caffeine intake in relation to body weight (mg per kg) on a given day among caffeine “consumers”, by demographic characteristics, for US children 2–19 y: NHANES 2009–20101
| Caffeine (mg/kg) | |||||
|---|---|---|---|---|---|
| Characteristics | Median2 | 75th Percentile |
90th Percentile |
95th Percentile |
P value3,4 |
| All | 0.40 | 1.13 | 2.27 | 3.18 | |
| Age (y) | |||||
| 2–5 | 0.29 | 0.62 | 1.34 | 1.34 | <0.01 |
| 6–11 | 0.30 | 0.90 | 1.80 | 2.77 | |
| 12–19 | 0.64 | 1.47 | 2.66 | 3.65 | |
| Sex | |||||
| Male | 0.39 | 1.18 | 2.49 | 3.26 | NS |
| Female | 0.40 | 1.09 | 2.11 | 2.77 | |
| Poverty income ratio (%)5 | |||||
| ≤130 | 0.44 | 1.10 | 2.19 | 3.47 | NS |
| 131–349 | 0.43 | 1.24 | 2.46 | 3.04 | |
| ≥350 | 0.31 | 0.86 | 1.79 | 3.10 | |
| Race-Hispanic ethnicity6 | |||||
| Non-Hispanic white | 0.47a | 1.32 | 2.58 | 3.28 | <0.01 |
| Non-Hispanic black | 0.24b | 0.74 | 1.46 | 1.86 | |
| Mexican American | 0.35a,b | 0.93 | 1.81 | 2.56 | |
Medians and percentiles calculated from untransformed weighted data. n=2230.
All statistical tests were performed on log transformed means.
Test of linear trend for ordinal variables age and poverty income ratio.
Wald F test, for sex and race-Hispanic origin, significance P < 0.05.
Different superscript letters represent a statistically significant difference between categories compared using t test adjusted by the Bonferroni method for multiple comparisons.
Poverty income ratio is an index calculated by dividing family income by a federal poverty threshold specific to family size, defined by the US Census Bureau.
Other race category not shown.
Caffeine intake did not differ by sex or poverty level whether expressed as total intake (mg) or in relation to body weight (mg/kg) for all children 2–19 y of age, or among caffeine “consumers” 2–19 y of age (Tables 2–5).
We estimated the 90th and 95th percentiles of caffeine intake by various socio-demographic factors to provide national estimates that may be useful for policy makers in future evaluations of the upper end of the distribution. As expected, the 90th percentile levels of caffeine intake were lower among all children compared to those in caffeine consumers (Table 2 and Table 4, respectively). The 90th percentile values for caffeine intake in mg/kg among consumers were 1.34 for 2–5 y olds, 1.80 for 6–11 y olds and 2.66 for 12–19 y olds (Table 5). Our data indicate that 10% of children 12–19 y of age, and less than 5% of younger children (2% of 2–5 y and 5% of 6–11 y olds) consumed more than 2.5 mg/kg caffeine, a level suggested as upper limit of daily caffeine intake for children by Health Canada (6).
We also examined trends in caffeine intake from 2001 to 2010. The caffeine intake among 2–19 y old children decreased overall in the 10-y study period for all children (Figure 1 Panel A; n= 18,530 and P < 0.05) and among caffeine consumers only (Figure 1 Panel B; n= 12,776 and P < 0.001). No major trends were noted for specific age groups among all children (caffeine consumers and non-consumers) (Figure 1 Panel A). However, when trends analyses were restricted to caffeine consumers only, 2–5 y and 6–11 y olds showed a significant decrease in caffeine intake from 2001–2002 to 2009–2010 (Figure 1 Panel B; P for trend < 0.001 for both age groups); the magnitude of these changes, however, was small, by 3.0 and 4.6 mg among children 2–5 and 6–11 y, respectively. Identical findings were noted with caffeine intake expressed as mg/kg body weight (data not shown) for all children (consumers and non-consumers of caffeine) as well as for children who consumed caffeine.
Figure 1. Trends over time in caffeine intake on a given day (mg) in US children aged 2–19 y: 2001–2010.
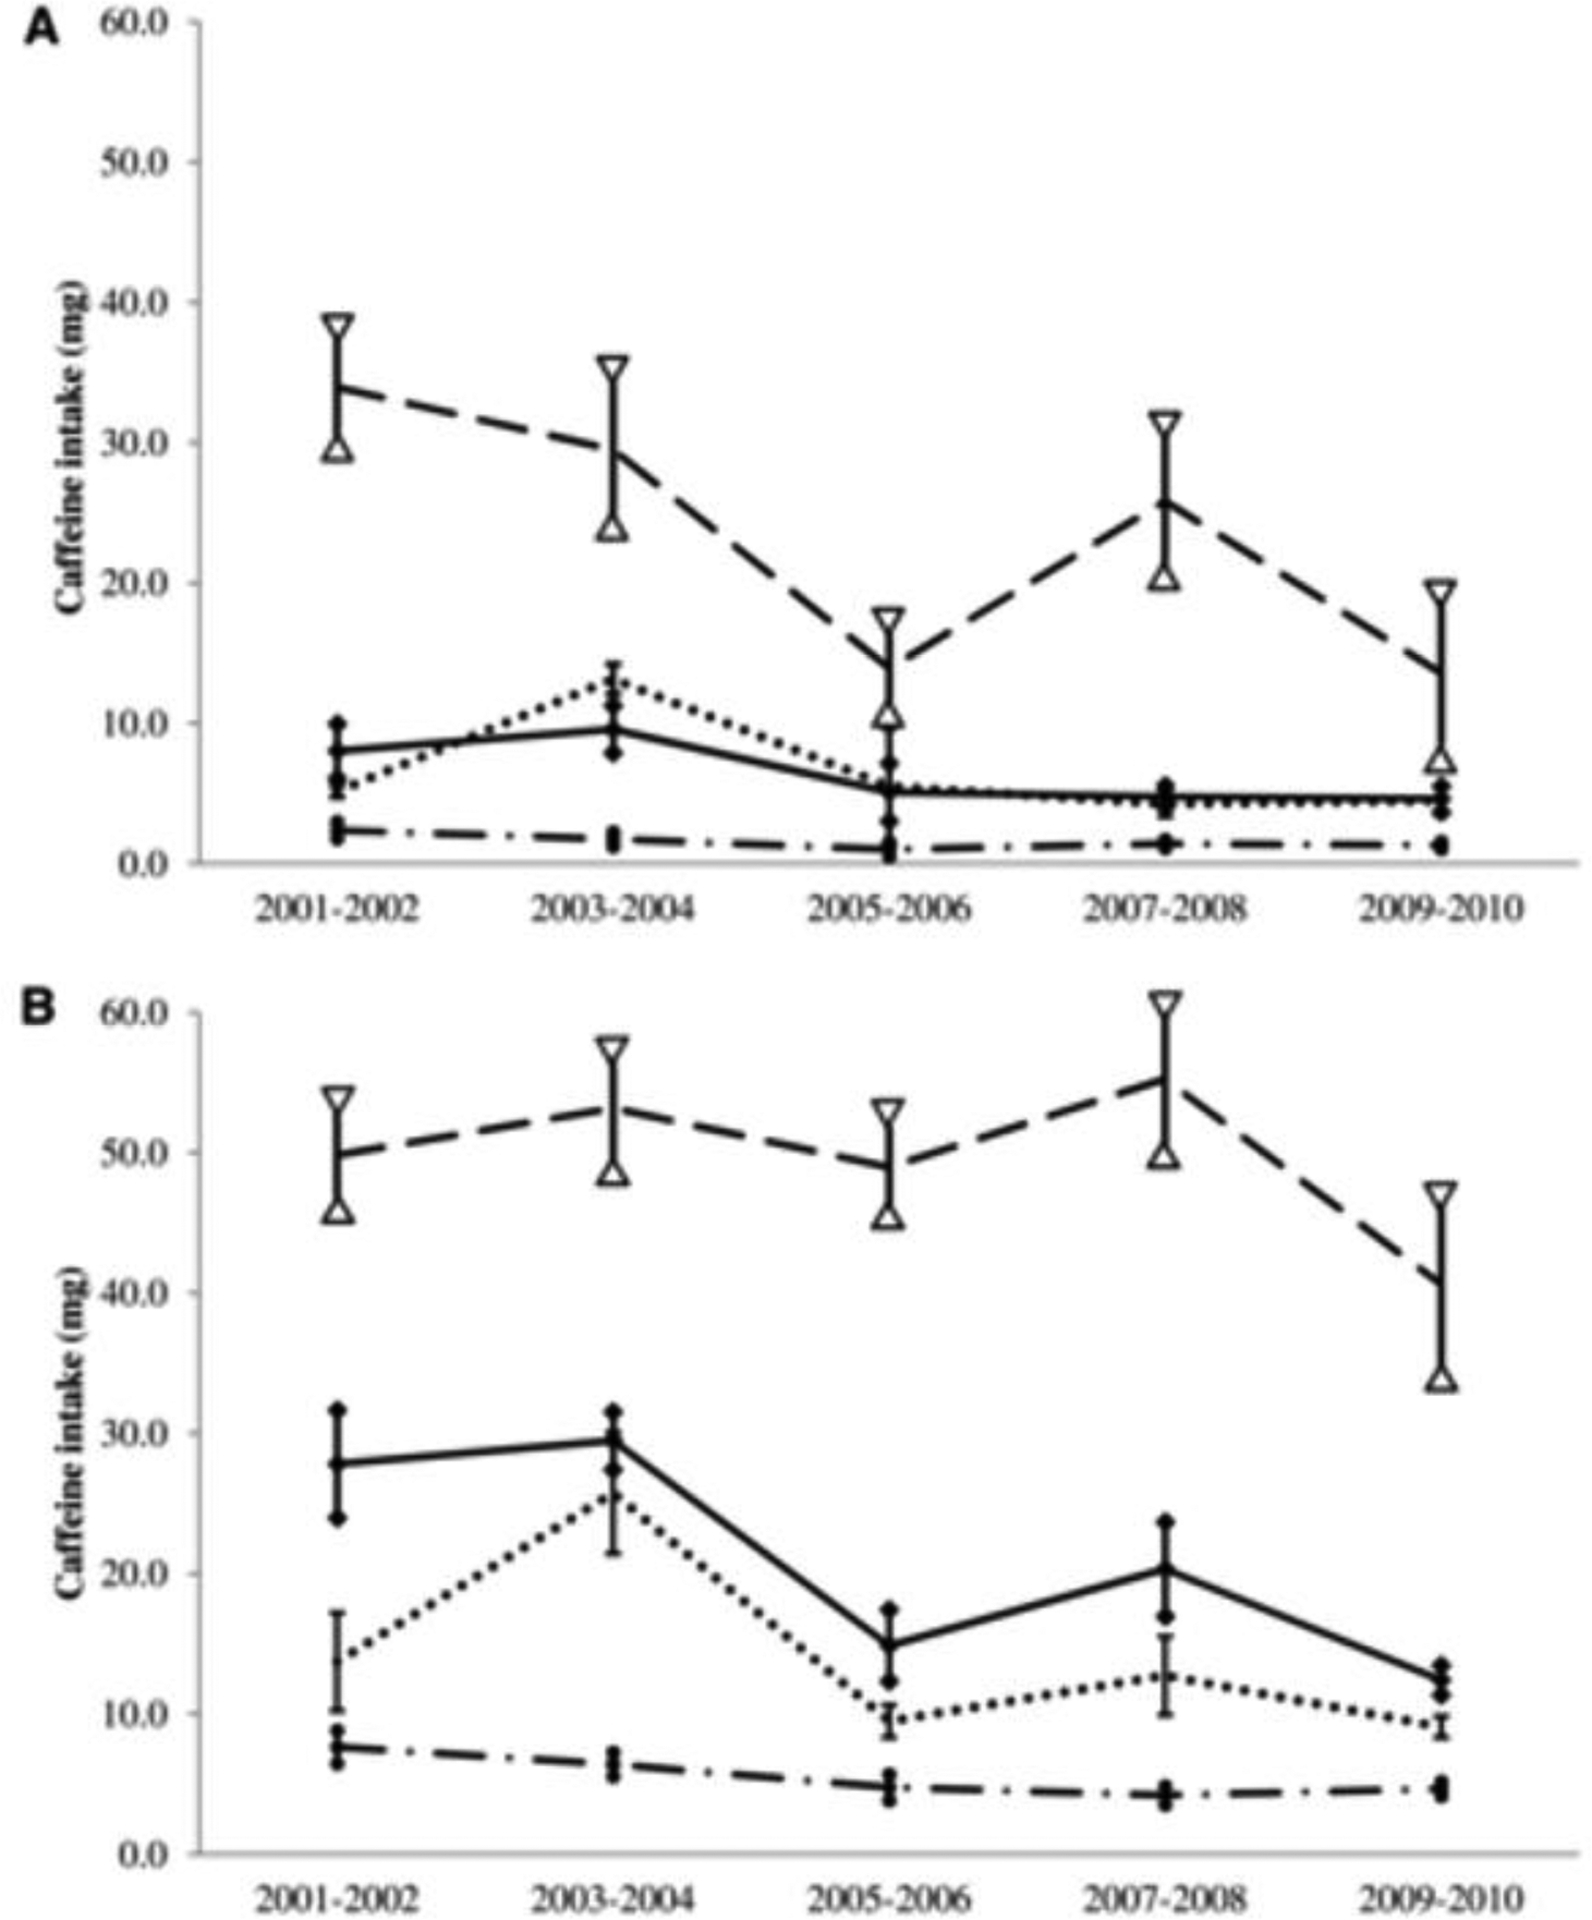
Trends are shown for all children aged 2–19 y (A) (n = 18,530) and caffeine consumers aged 2–19 y (B) (n = 12,776). P-linear trend < 0.05 by using the t statistic for all children 2–19 y of age (A); NS for specific age groups (A). P-linear trend < 0.001 by using the t statistic for caffeine consumers 2–19 y of age, and P-linear trend < 0.001 for both 2–5- and 6–11-y-old groups (B). Error bars represent ± 1 SE; bars capped by diamonds, circles, dashes, and triangles represent variations for all (solid line), 2–5-y-old (dashed and dotted line), 6–11-y-old (dotted line), and 12–19-y-old (dashed line) children, respectively.
DISCUSSION
Caffeine intake in children has received much attention due to potential adverse health effects (1, 2, 10, 36). Most healthy persons tolerate caffeine well; however there is a large variation among individuals in their response to caffeine (37, 38). Estimates of caffeine consumption among a nationally representative sample of young children based on recent data may be informative for updating recommendations. To our knowledge this is the first report of caffeine intake in US children examined both in absolute amount (mg) and in mg/kg body weight, and its associations with socio-demographic factors, from the most recently available national data from NHANES 2009–2010. In addition, trends in caffeine consumption (in mg and mg/kg) over a decade (2001–2010) are reported for the first time.
In the current study, 71% of US children ages 2–19 y consumed caffeine on a given day. To our knowledge, no other directly comparable national estimates are available for children and adolescents up to 19 years of age. Our finding that 58% of 2–5 y olds and 75% of 6–11 y olds consumed caffeine on a given day is lower than the estimates reported by Frary et al. (16) based on older national data from the CSFII in these age groups. In that study 76% of 2–5 y olds and 86% of 6–11 y olds consumed caffeine. For older children, Frary et al (16) reported that 91 and 88% of 12–17 y old males and females, respectively, consumed caffeine on a given day. Due to the differences in ages reported, no direct comparison can be made for older children.
We found that over half of US children aged 2–5 y and 3 in 4 children aged 6 y and over consumed caffeine on a given day. This finding is important given that food habits form early and continue into later years, and in light of the AAP recommendation that “caffeine and other stimulant substances contained in energy drinks have no place in the diet of children” (12).
We noted a positive linear trend between age and caffeine consumption (expressed as mg or mg/kg) as has been reported in other studies (16, 18, 19, 39). This association is likely driven by biological changes such as disrupted sleep rhythm in puberty (40) as well as psycho-social factors (1, 15). Limited comparative estimates of caffeine intake are available from large representative studies (16, 18, 19, 41). Besides differences in the study design, methodologies, time periods, and the use of different age and gender groups, additional complexity arises because most studies report mean intakes (despite a skewed distribution for caffeine). For comparison purposes, we computed mean caffeine intakes (and associated SE) for 2–5, 6–11 and 12–19 y olds. These were 5.8 (0.45); 17.2 (1.1) and 58.3 (6.4) mg, respectively among all children; and 10.0 (1.0); 23.0 (1.4) and 78.3 (7.4), respectively among caffeine consumers. These estimates are similar to those reported for NHANES 2005–06 (19) but lower than those reported for caffeine consumers in the SIP survey (1–5 y: 13.5 mg/d) (18) and in the CSFII in mid- to late-1990s (2–5 y olds: 16 mg) (16).
Caffeine is generally regarded as a safe substance; however, FDA has suggested using > 90th percentile to indicate “heavy consumption” of caffeine (18, 19). Our results show that among adolescents ages 12–19 y, the caffeine intake at the 90th percentile is 2.45 mg/kg. Interestingly, this is identical to the maximal consumption limit suggested for children by Health Canada (6, 11) that was based on reported behavioral effects by Bernstein et al (42). Based on NHANES 2009–2010, we found that 10% of children 12–19 y of age, and less than 5% of younger children consumed more than 2.5 mg/kg caffeine on a given day.
Children may metabolize caffeine differently than adults (18) and show a large variation in body weight across childhood, and recommendations to limit caffeine intake have been based on body weight for children by Health Canada (6, 11). Few reports have examined caffeine intake in children expressed as mg/kg and they presented findings among caffeine consumers only (16, 18, 21, 41). Thus, there is no comparative literature on caffeine consumption among all children (caffeine consumers and non-consumers) as provided in this study.
Our estimates of caffeine intake (mg/kg) among caffeine consumers were generally lower than previously reported (16, 18, 21). Frary et al (16) based on older CSFII data reported 0.4, 0.4, 0.5 and 0.6 mg/kg for 2–5 y, 6–11 y, 12–17 y old boys, and 12–17 y old girls, respectively as compared to our estimates of 0.3 mg/kg for 2–5 and 6–11 y olds. Barone and Roberts (21) reviewed studies up to early 1990s and found that caffeine intake (mg/kg) declined between 1975 and 1989. Our finding of a significant linear decreasing trend from 2001 to 2010 suggests that this trend has likely continued since that report (21) and could explain our lower estimates.
We also examined socio-demographic patterns in caffeine consumption as related to race-Hispanic origin, and income. Our finding that non-Hispanic black children consumed significantly less caffeine compared to non-Hispanic white children is consistent with findings from the Bogalusa study (39), and the CSFII (17). However, this is the first report showing higher caffeine intake by Mexican American compared to non-Hispanic black children. In the current study, we did not find any difference in caffeine intake in relation to socioeconomic status that is contrary to findings from a small study involving 24 to 32 mo old children (43). Others have reported lower caffeine intake by female compared to male children (44); this difference being more pronounced particularly at older ages (16, 19). However, we did not find a significant association with gender, consistent with the findings from the SIP survey (18).
Overall, the findings for the association of caffeine intake with socio-demographic factors were consistent whether caffeine intake was expressed in absolute amount or in mg/kg. Moreover, the results were similar when analyses were conducted with all children or with consumers only. The only exception was that the differences in caffeine intake by race-Hispanic ethnicity were less prominent in consumers only. Specifically, caffeine intake of non-Hispanic black and Mexican American children was no longer statistically different among consumers.
Lastly our results from trends analysis showed a significant, albeit small, decline over the 10-y study period (2001 to 2010) in caffeine intake among all children, as well as among caffeine consumers only, regardless of how caffeine intake was expressed (i.e. mg or mg/kg). The decrease in caffeine intake (mg) observed over this period was significant only in the younger age groups (ages <12 y) suggesting that caffeine intake by adolescents (ages 12–19 y), who consumed the highest amounts of caffeine among all age groups examined, remained stable over the 10-y study period. In view of increasing choice of products containing caffeine such as energy drinks targeted to youth, another possibility is that children may be replacing some of their caffeine intake from sodas by other caffeinated products such as energy drinks. This hypothesis fits well with the findings from NHANES showing a decrease in soda along with a significant increase in energy or sport drink consumption among 2–19 y olds (20).
The NHANES design allows the estimation of caffeine consumption on a representative sample and the examination of the association of caffeine consumption with socio-demographic factors including race-Hispanic ethnicity. The continuous nature of NHANES since 1999 offers the possibility of evaluating trends over time from different survey cycles that used the same data collection methodology, and that are linked to nutrient data banks that are updated periodically to capture new products introduced during the survey years. The current analyses are based on a single 24-h recall, that is sufficient to estimate population level estimates because the random errors associated with dietary recall, including day-to-day variability, can be generally assumed to cancel out if days of the week are evenly represented (26). The database used in this study did not include caffeine intake from herbals, supplements, or medications as in previous reports.
In conclusion, this study provides updated national estimates of caffeine intake among children that may be useful in the context of the mounting evidence of adverse health effects associated with high caffeine intake while balancing the benefits of caffeine. Future research should identify the contribution of specific foods and beverages to caffeine intake as well as the chief sources of caffeine among children and adolescents.
ACKNOWLEDGEMENT
We are grateful to Dr. Margaret Carroll for her expert guidance with statistical analyses. NA was responsible for concept development, supervision of statistical analysis by KH, and wrote the manuscript with input from all authors. KH conducted the analysis with input from NA. All authors reviewed and provided critical feedback on the manuscript. NA and KH are responsible for the final content of the manuscript. None of the authors have any conflict of interest to declare.
This work was not supported by any external grant.
Footnotes
None of the authors have any conflict of interest to declare.
Publisher's Disclaimer: Disclaimer: The findings and conclusions in this report are those of the authors and do not necessarily represent the official position of the National Center for Health Statistics, Centers for Disease Control and Prevention.
REFERENCES
- 1.Temple JL. Caffeine use in children: what we know, what we have left to learn, and why we should worry. Neuroscience and biobehavioral reviews 2009;33(6):793–806. [DOI] [PMC free article] [PubMed] [Google Scholar]
- 2.Temple JL, Dewey AM, Briatico LN. Effects of acute caffeine administration on adolescents. Experimental and clinical psychopharmacology 2010;18(6):510–20. [DOI] [PubMed] [Google Scholar]
- 3.De Bellis MD, Keshavan MS, Beers SR, et al. Sex differences in brain maturation during childhood and adolescence. Cerebral cortex 2001;11(6):552–7. [DOI] [PubMed] [Google Scholar]
- 4.White AM. Understanding adolescent brain development and its implications for the clinician. Adolescent medicine: state of the art reviews 2009;20(1):73–90, viii-ix. [PubMed] [Google Scholar]
- 5.Arria AM, Caldeira KM, Kasperski SJ, Vincent KB, Griffiths RR, O’Grady KE. Energy Drink Consumption and Increased Risk for Alcohol Dependence. Alcoholism-Clinical and Experimental Research 2011;35(2):365–75. [DOI] [PMC free article] [PubMed] [Google Scholar]
- 6.Nawrot P, Jordan S, Eastwood J, Rotstein J, Hugenholtz A, Feeley M. Effects of caffeine on human health. Food additives and contaminants 2003;20(1):1–30. [DOI] [PubMed] [Google Scholar]
- 7.Savoca MR, MacKey ML, Evans CD, Wilson M, Ludwig DA, Harshfield GA. Association of ambulatory blood pressure and dietary caffeine in adolescents. American journal of hypertension 2005;18(1):116–20. [DOI] [PubMed] [Google Scholar]
- 8.Lim S, Zoellner JM, Lee JM, et al. Obesity and sugar-sweetened beverages in African-American preschool children: a longitudinal study. Obesity 2009;17(6):1262–8. [DOI] [PubMed] [Google Scholar]
- 9.Hughes JR, Hale KL. Behavioral effects of caffeine and other methylxanthines on children. Experimental and clinical psychopharmacology 1998;6(1):87–95. [DOI] [PubMed] [Google Scholar]
- 10.Seifert SM, Schaechter JL, Hershorin ER, Lipshultz SE. Health effects of energy drinks on children, adolescents, and young adults. Pediatrics 2011;127(3):511–28. [DOI] [PMC free article] [PubMed] [Google Scholar]
- 11.Health Canada. Internet: http://www.hc-sc.gc.ca/hl-vs/iyh-vsv/food-aliment/caffeine-eng.php#he (accessed 26 August 2013).
- 12.Sports drinks and energy drinks for children and adolescents: are they appropriate? Pediatrics 2011;127(6):1182–9. [DOI] [PubMed] [Google Scholar]
- 13.European Food Standard Agency Panel on Dietetic Products Nutrition and Allergies. Internet: http://www.efsa.europa.eu/en/efsajournal/doc/2053.pdf (accessed 26 August 2013).
- 14.Leviton A Behavioral correlates of caffeine consumption by children. Clinical pediatrics 1992;31(12):742–50. [DOI] [PubMed] [Google Scholar]
- 15.Bunting H, Baggett A, Grigor J. Adolescent and young adult perceptions of caffeinated energy drinks. A qualitative approach. Appetite 2013;65:132–8. [DOI] [PubMed] [Google Scholar]
- 16.Frary CD, Johnson RK, Wang MQ. Food sources and intakes of caffeine in the diets of persons in the United States. Journal of the American Dietetic Association 2005;105(1):110–3. [DOI] [PubMed] [Google Scholar]
- 17.Ahuja A, Perloff BP. Caffeine and Theobromine Intakes of Children: Results From CSFII 1994–96, 1998. Family Economics and Nutrition Review 2001;13(2):5. [Google Scholar]
- 18.Knight CA, Knight I, Mitchell DC, Zepp JE. Beverage caffeine intake in US consumers and subpopulations of interest: estimates from the Share of Intake Panel survey. Food and chemical toxicology : an international journal published for the British Industrial Biological Research Association 2004;42(12):1923–30. [DOI] [PubMed] [Google Scholar]
- 19.Somogyi LP. Caffeine Intake by the US Population. Food and Drug Administration, 2010. [Google Scholar]
- 20.Kit BK, Fakhouri TH, Park S, Nielsen SJ, Ogden CL. Trends in sugar-sweetened beverage consumption among youth and adults in the United States: 1999–2010. The American Journal of Clinical Nutrition 2013;98(1):180–8. [DOI] [PMC free article] [PubMed] [Google Scholar]
- 21.Barone JJ, Roberts HR. Caffeine consumption. Food and chemical toxicology : an international journal published for the British Industrial Biological Research Association 1996;34(1):119–29. [DOI] [PubMed] [Google Scholar]
- 22.CDC. National Center for Health Statistics. National Health and Nutrition Examination Survey data Hyattsville MD: US Department of Health and Human Services C, 2009–2010. Internet: http://wwwn.cdc.gov/nchs/nhanes/search/nhanes09_10.aspx (accessed 15 July 2013). [Google Scholar]
- 23.CDC. National Center for Health Statistics. Internet: http://www.cdc.gov/nchs/nhanes/response_rates_CPS.htm (accessed 15 July 2013).
- 24.Blanton CA, Moshfegh AJ, Baer DJ, Kretsch MJ. The USDA Automated Multiple-Pass Method accurately estimates group total energy and nutrient intake. The Journal of Nutrition 2006;136(10):2594–9. [DOI] [PubMed] [Google Scholar]
- 25.Thompson FE S A. Dietary Assessment Methodology Edtion ed. In: Coulston AMBC, Ferruzzi MG, ed. Nutrition In The Prevention And Treatment Of Disease. Boston: Academic Press, 2013. [Google Scholar]
- 26.Gibson R Principles of Nutritional Assessment. 2nd ed. Oxford: Oxford University Press, 2005. [Google Scholar]
- 27.US Department of Agriculture. Agricultural Research Service: Food Surveys Research Group. Internet: http://www.ars.usda.gov/Services/docs.htm?docid=12085 (accessed 16 July 2013).
- 28.Curtin LR, Mohadjer LK, Dohrmann SM, et al. The National Health and Nutrition Examination Survey: Sample Design, 1999–2006. Vital and health statistics Series 2, Data evaluation and methods research 2012(155):1–39. [PubMed] [Google Scholar]
- 29.United States Census Bureau. Internet: http://www.census.gov/hhes/www/poverty/methods/definitions.html (accessed 26 August 2013).
- 30.US Department of Agriculture. Food and Nutrition Service. Internet: http://www.fns.usda.gov/ORA/menu/Published/SNAP/FILES/Other/BuildingHealthyAmerica.pdf (accessed 26 August 2013).
- 31.CDC. National Center for Health. Internet: http://www.cdc.gov/nchs/nhanes/nhanes1999-2000/DRXTOT.htm (accessed 15 July 2013).
- 32.Korn E, Graubard B. Analysis of health surveys. New York, NY: John Wiley & Sons Inc., 1999. [Google Scholar]
- 33.Wolter K Introduction to variance estimateion. New York, NY: Springer-Verlag, 1985. [Google Scholar]
- 34.Miller R Developments in multiple comparsions. J Am Stat Assn 1977;72:779–88. [Google Scholar]
- 35.Winer B Statistical principles in experimental design. New York, NY: McGraw-Hill Companies, 1971. [Google Scholar]
- 36.Seifert SM, Seifert SA, Schaechter JL, et al. An analysis of energy-drink toxicity in the National Poison Data System. Clinical toxicology 2013;51(7):566–74. [DOI] [PubMed] [Google Scholar]
- 37.Castellanos FX, Rapoport JL. Effects of caffeine on development and behavior in infancy and childhood: a review of the published literature. Food and chemical toxicology: an international journal published for the British Industrial Biological Research Association 2002;40(9):1235–42. [DOI] [PubMed] [Google Scholar]
- 38.Retey JV, Adam M, Khatami R, et al. A genetic variation in the adenosine A2A receptor gene (ADORA2A) contributes to individual sensitivity to caffeine effects on sleep. Clinical pharmacology and therapeutics 2007;81(5):692–8. [DOI] [PubMed] [Google Scholar]
- 39.Arbeit ML, Nicklas TA, Frank GC, Webber LS, Miner MH, Berenson GS. Caffeine intakes of children from a biracial population: the Bogalusa Heart Study. Journal of the American Dietetic Association 1988;88(4):466–71. [PubMed] [Google Scholar]
- 40.Carskadon MA. Sleep in adolescents: the perfect storm. Pediatric clinics of North America 2011;58(3):637–47. [DOI] [PMC free article] [PubMed] [Google Scholar]
- 41.Knight CA, Knight I, Mitchell DC. Beverage caffeine intakes in young children in Canada and the US. Canadian journal of dietetic practice and research : a publication of Dietitians of Canada = Revue canadienne de la pratique et de la recherche en dietetique : une publication des Dietetistes du Canada 2006;67(2):96–9. [DOI] [PubMed] [Google Scholar]
- 42.Bernstein GA, Carroll ME, Crosby RD, Perwien AR, Go FS, Benowitz NL. Caffeine effects on learning, performance, and anxiety in normal school-age children. Journal of the American Academy of Child and Adolescent Psychiatry 1994;33(3):407–15. [DOI] [PubMed] [Google Scholar]
- 43.Skinner JD, Carruth BR, Houck KS, Morris M, Moran J 3rd, Coletta F. Caffeine intake in young children differs by family socioeconomic status. Journal of the American Dietetic Association 2000;100(2):229–31. [DOI] [PubMed] [Google Scholar]
- 44.Ellison RC, Singer MR, Moore LL, Nguyen US, Garrahie EJ, Marmor JK. Current caffeine intake of young children: amount and sources. Journal of the American Dietetic Association 1995;95(7):802–4. [DOI] [PubMed] [Google Scholar]