Abstract
Background -
It is difficult to non-invasively phenotype atrial fibrillation (AF) in a way that reflects clinical endpoints such as response to therapy. We set out to map electrical patterns of disorganization and regions of reentrant activity in AF from the body surface using electrocardiographic imaging (ECGI), calibrated to panoramic intracardiac recordings and referenced to AF termination by ablation.
Methods -
Bi-atrial intracardiac electrograms of 47 AF patients at ablation (30 persistent, 29 male, 63±9 years) were recorded with 64-pole basket catheters and simultaneous 57-lead body surface ECGs. Atrial epicardial electrical activity was reconstructed and organized sites were invasively and non-invasively tracked in 3D using phase singularity (PS). In a subset of 17 patients, sites of AF organization were targeted for ablation.
Results -
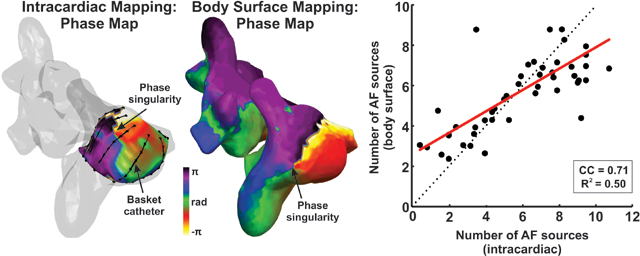
Body surface mapping showed greater AF organization near intracardially-detected drivers than elsewhere, both in PS density (2.3±2.1 vs 1.9±1.6, p=0.02) and number of drivers (3.2±2.3 vs 2.7±1.7, p=0.02). Complexity, defined as the number of stable AF reentrant sites, was concordant between non-invasive and invasive methods (r2 =0.5, CC=0.71). In the subset receiving targeted ablation, AF complexity showed lower values in those in whom AF terminated than those in whom AF did not terminate (p<0.01).
Conclusions -
AF complexity tracked non-invasively correlates well with organized and disorganized regions detected by panoramic intracardiac mapping, and correlates with the acute outcome by ablation. This approach may assist in bedside monitoring of therapy or in improving the efficacy of ongoing ablation procedures.
Keywords: atrial fibrillation, electrophysiology mapping, electrocardiography, mapping, reentrant driver
Journal Subject Terms: Atrial Fibrillation, Electrophysiology, Arrhythmias, Electrocardiology (ECG), Imaging
Graphical Abstract
Introduction
There is great interest in improving therapies for atrial fibrillation (AF) due to the suboptimal outcomes of current pharmacological and interventional approaches. In the case of ablation, pulmonary vein isolation (PVI) success rarely exceeds 50–70% in patients with persistent or paroxysmal AF1. New approaches have been developed based on the identification and elimination of atrial regions2–6 including reentrant or focal drivers2 or fastest regions4 evaluated by intracardiac electrograms. Guiding ablation to localized drivers may improve success in meta-analyses7–8, and trended to be superior to PVI in subgroups of a recent randomized trial9 except when also combined with ablation of lines or complex electrograms. Clearly, improved methods of detecting sites for AF ablation are needed.
We hypothesized that body surface mapping can detect relevant features of intracardiac organization and disorganization in AF, with the ultimate goal of guiding bedside management or ablation. Non-invasive tools have the potential to supplement intracardiac AF mapping3,6. Electrocardiographic Imaging (ECGI) allows non-invasive reconstruction of atrial epicardial electrical activity and characterization of the fibrillatory process3. This technique has been used to localize atrial regions causing arrhythmia by identifying electrical reentries, shown as singularities in non-invasive phase maps, which can successfully guide ablation3. While phase maps may code any rotational activation as a singularity, this can be clarified by examining activation sequence10. In AF mapping, the severity has been linked to the number of ablated regions needed to terminate AF, suggesting that non-invasive metrics may be useful to characterize AF and identify ablation targets. Nevertheless, few studies have validated body surface metrics against intracardiac measures.
The purpose of this paper was to compare functional AF features between non-invasive phase mapping and panoramic intracardiac phase and activation mapping with a basket-type catheter. To achieve this, we recorded simultaneous intracardiac and non-invasive electrograms and applied phase mapping in patients undergoing ablation including a subset with targeted ablation at localized reentrant drivers. We reasoned that, for consistent comparison between intracardiac and body surface sources to be consistent, the same source identification method should be used in both cases. Therefore, we opted to analyze only reentrant sources, which comprise > 80% of sources in several studies2–3 and can be measured by parallel approaches.
Methods
All code is publicly available at https://www.ncbi.nlm.nih.gov/pubmed/27790158.
Inclusion Criteria
We recruited 47 patients referred for AF ablation in two centers: Hospital General Universitario Gregorio Marañón (HGUGM, Madrid, Spain, N=30) and Stanford Hospital (SH, CA, USA, N=17). Patients underwent institution-specific ablation strategies: the cohort from HGUGM received conventional Pulmonary Vein Isolation (PVI) ablation, whereas patients from the SH received prospective ablation at regions of interest (rotational or focal sites) identified by a commercial system (RhythmView; Abbott, Inc), followed by conventional PVI ablation. In this paper, analysis focused on detecting reentrant activity by an open-source algorithm11. The protocol was approved by each local Institutional Ethics Committees and all patients gave informed consent. The goal of this study was to correlate non-invasive to invasive AF mapping in a variety of patients. Patient’s demographics are presented in Table 1, where significant difference between PVI and driver-guided ablation cohort can be found in persistent/ paroxysmal, male/female distribution, AF history and number of previous ablations. Also, a subset of the PVI ablation cohort (N=13, 28%) was derived from a mitral valvuloplasty procedure that was performed prior to the AF ablation procedure.
Table 1.
Cohort description
| Driver-guided ablation + PVI | P value (Guided vs PVI) | |||
|---|---|---|---|---|
| N | 47 | 17 | 30 | - |
| Paroxysmal AF (%) | 20 (43%) | 3 (18%) | 17 (57%) | 0.009 |
| Male (%) | 21 (45%) | 14 (82%) | 7 (23%) | < 0.001 |
| Age (years) | 63 ± 13 | 67 ± 9 | 61 ± 14 | 0.13 |
| AF history (months) | 55 ± 56 | 85 ± 70 | 36 ± 32 | 0.01 |
| Previous ablations | 1.1 ± 0.9 | 0.6 ± 1.0 | 1.4 ± 0.8 | 0.004 |
| Valvuloplasty | 13 (28%) | 0 (0%) | 13 (43%) | 0.001 |
| Acute termination (%) | 12 (26%) | 7 (41%) | 5 (17%) | 0.06 |
Electrophysiological Study and Ablation
Classes I and III antiarrhythmic medications were discontinued for >5 half-lives (>30 days for amiodarone). Catheters were advanced to the right atrium (RA), coronary sinus, and transeptally to left atrium (LA). In patients arriving in sinus rhythm, AF was induced using electrical burst pacing. Contact basket catheters (64 poles) were positioned in RA, then LA for AF mapping, based on 3-dimensional electroanatomic imaging (NavX, St Jude Medical). In 22 patients of the PVI ablation cohort, 2 basket catheters were simultaneously positioned at LA and RA.
Radiofrequency energy was delivered via an irrigated catheter (Cool-Flex /TactiCath/Sapphire-Blue, St Jude Medical) at 25 to 35 W. In patients undergoing driver-guided ablation, lesions were applied for 15 to 30 s at each site identified by the RhythmView system, successively, to cover areas of 2 to 3 cm2 as described by Miller et al12. An example of the lesion set in a driver-guided ablation is shown in Figure S1. PVI was performed in all patients by circumferential point-by-point ablation or cryoablation of left and right PV pairs (Artic Front, Medtronic Inc.) with verification of PV isolation using dedicated circular mapping catheters.
Data Acquisition
Unipolar electrograms (EGM) from basket catheters were recorded with 0.05 to 500 Hz bandpass filtering, at 1 kHz sampling prior to the ablation protocol. Raw electrograms from 64 basket and other intracardiac channels (eg, coronary sinus) and 12-lead ECG were exported from Bard (LabSystem Pro), Prucka (GE Cardiolab) or Boston Scientific (ClearsignTM) recorders for off-line analysis. Basket electrode positions and atrial anatomy meshes were extracted from the electro-anatomical navigation system (Ensite NavX System) that enabled atrial anatomy reconstruction. Figure 1.A shows a single basket position snapshot, of the 2–3 used for mapping each chamber13.
Figure 1.
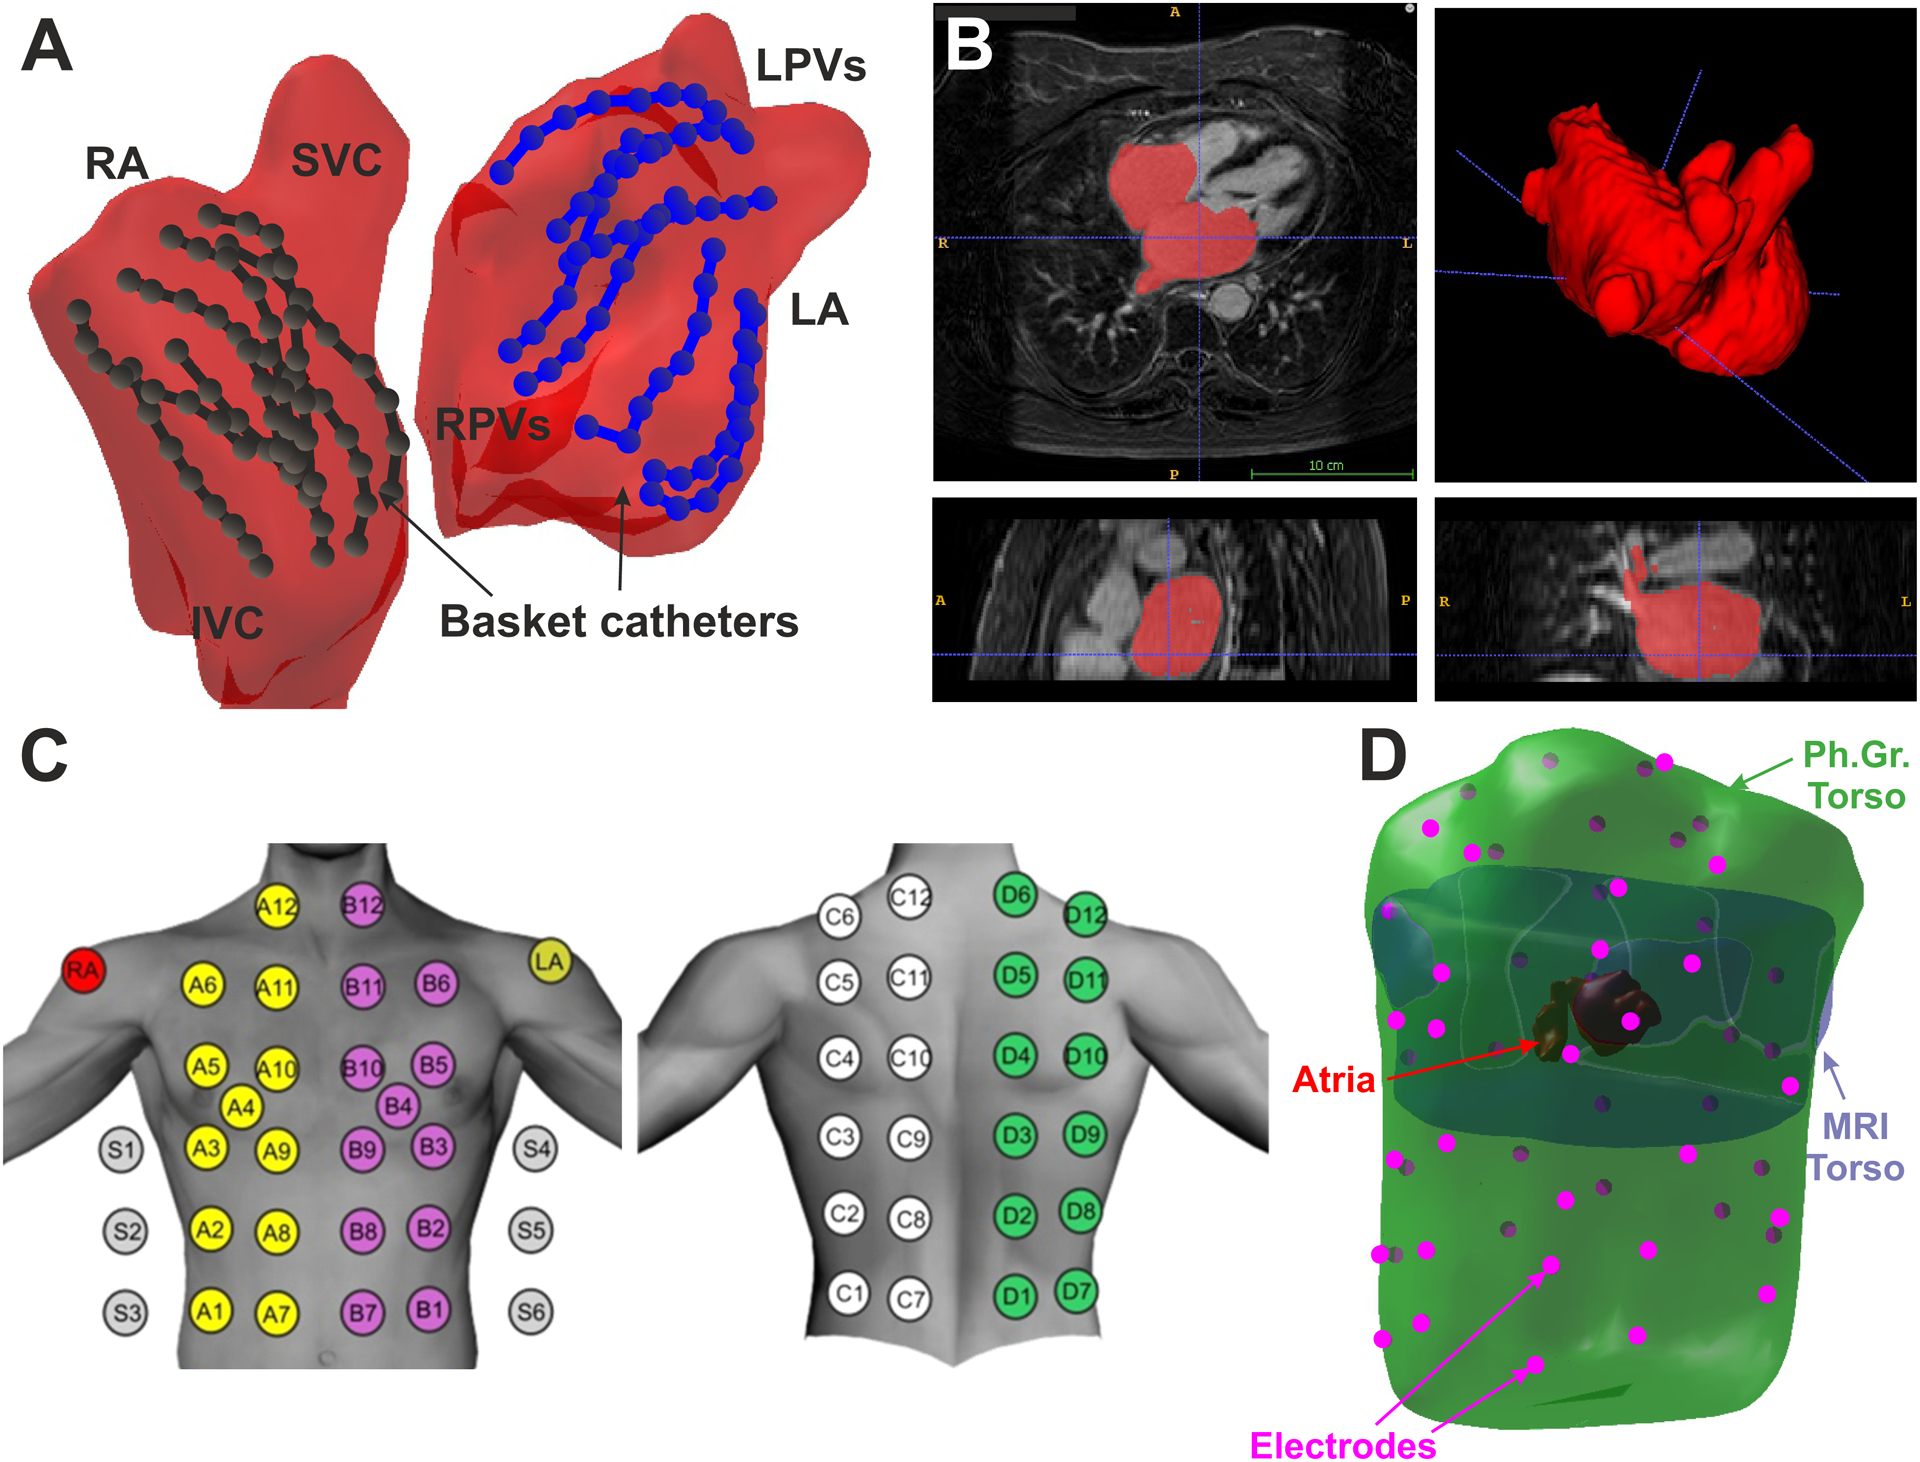
Schematic view of the experiment set-up. A. Atrial anatomy (red) with 2 basket catheters in left (blue) and right (black) atria. B. Atrial anatomy segmentation from CT scan. C. Surface ECG electrode distribution. D. 3D meshes of the CT torso (purple), photogrammetry torso (green), atrial anatomy (red) and surface electrodes (pink).
CT images were acquired 2–3 days prior to the ablation procedure. Atria and torso anatomy were obtained by segmentation of CT images by using ITK-SNAP14 (Fig. 1.B). Additionally, the torso anatomy, together with the surface electrode location was obtained by two techniques, depending on the ablation protocol. In patients derived for conventional PVI ablation, photographic images from multiple points of view were obtained for each patient wearing the recording electrodes and torso images were processed by photogrammetry to reconstruct the torso anatomy with the surface electrode positions15. In patients undergoing driver-guided ablation, fluoroscopy images of the surface electrodes were recorded during the Electrophysiological study and processed to identify and co-register the electrode positions in the torso anatomy. Anatomical models obtained with the different technologies were co-registered by using an algorithm based on rigid transformations guided by fiducial points manually marked in both atrial models (PVs, LAA, RAA, superior vena cava (SVC) and inferior vena cava (IVC)) or torso models (anterior and posterior axillae, nipples, low scapula and xiphoid appendix)16 (Fig. 1.D).
Multichannel electrocardiograms (ECGI) were recorded with surface ECG leads during the electrophysiological study6. Signals were acquired simultaneously with intracardiac recordings on the commercial with 0.05 to 500 Hz bandpass filtering at 1 kHz sampling frequency and were exported for off-line analysis. 57 surface electrodes were distributed as follows: 24 electrodes on the anterior, 24 on the posterior, 3 on each lateral side of the torso and 3 extra leads in order to obtain a Wilson Central Terminal (Figure 1.C).
Data Management
Simultaneous intracardiac and body surface signals from 160 AF episodes (3.4 ± 1.8 per patient) with an average duration of 4.9 ± 1.4 seconds were used for the reentrant activity analysis.
For intracardiac signal analysis, first the average QRS complex was computed and subtracted for each of the electrogram channel. Next, intracardiac atrial signals were baseline-subtracted6, 17 and low-pass filtered with a 10th-order Butterworth filter with a cut-off frequency of 20 Hz. Intracardiac signals were then prepared for phase analysis by a 2 Hz bandwidth elliptic band-pass filter centered at the Highest Dominant Frequency (HDF) of each basket catheter18, obtained as the 95th percentile of the dominant frequencies (DF) of the basket signals. Then, intracardiac basket signals were interpolated in a 1026-node mesh created by using the location of the 64 basket electrodes (Figure 2.A) and phase filtered using the Hilbert transform. Phase singularities (PS) (> 1 rotation) were then detected in this 3D phase mesh as described in our previous works19.
Figure 2.
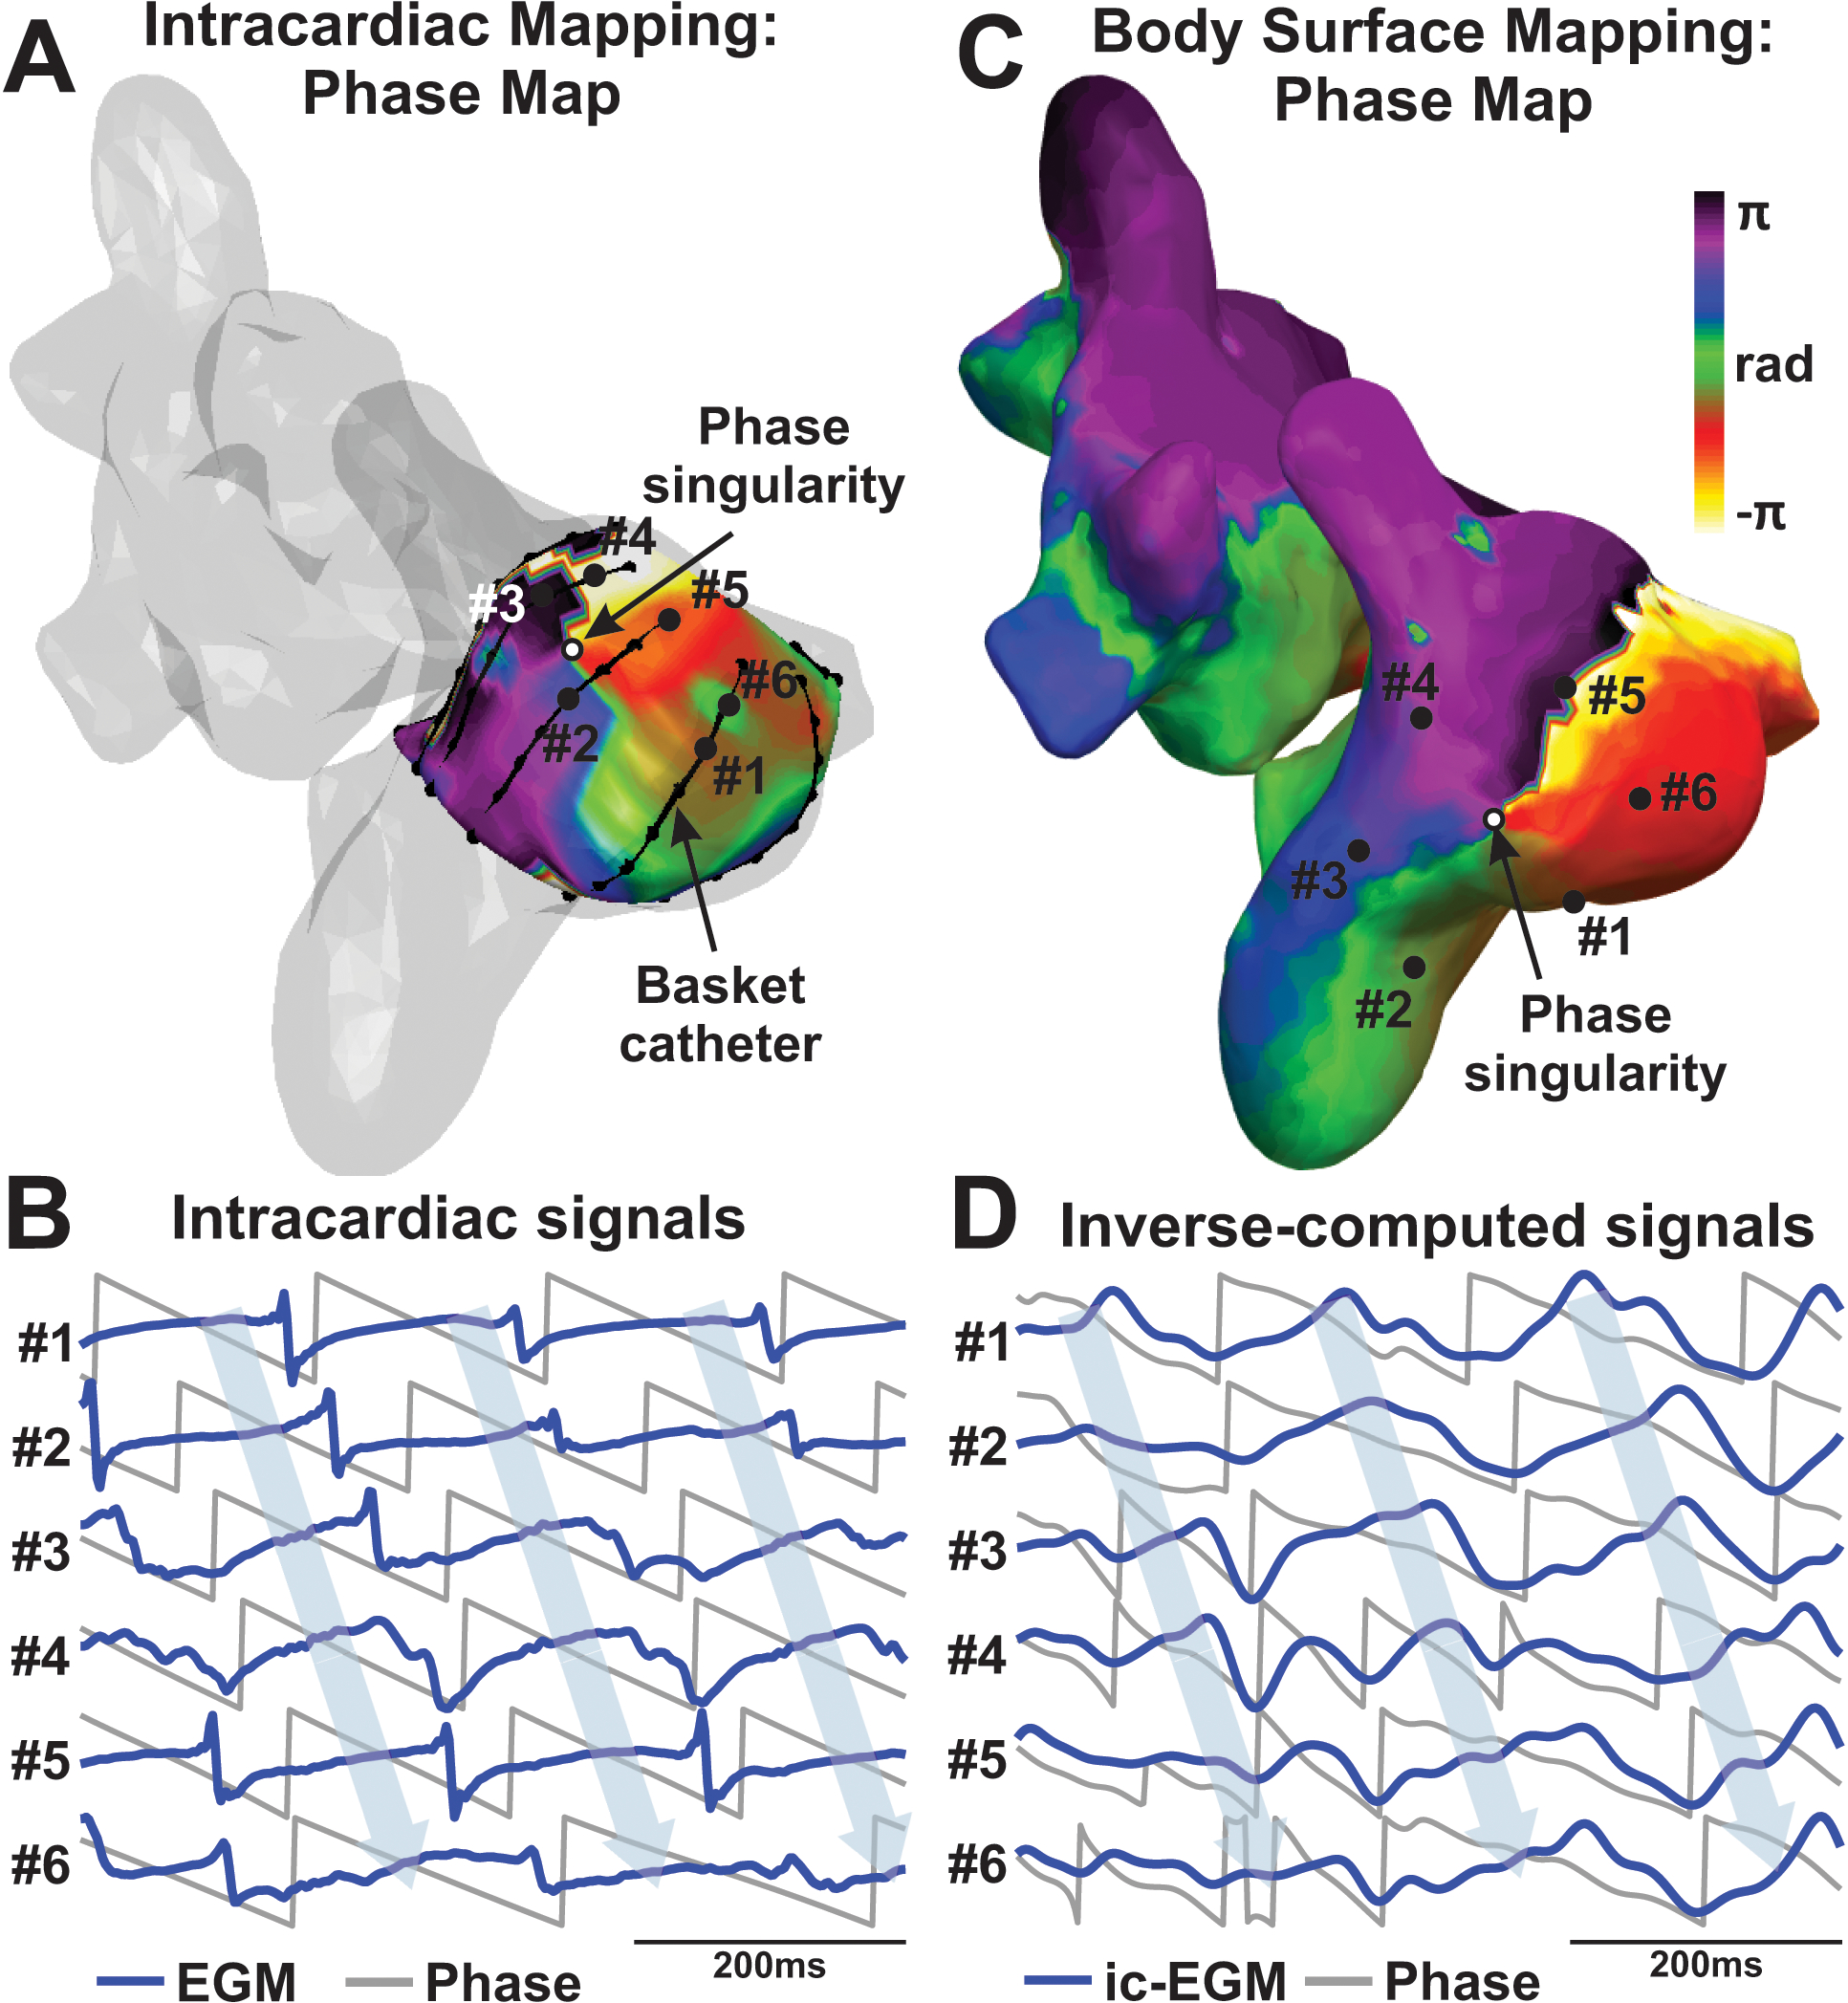
Localized reentry in AF co-localizes between intracardiac and body surface maps. A. Phase distribution from the intracardiac signals with reentry marked. Atrial anatomy is depicted in transparent gray. B. Activation sequence verifies reentry on intracardiac signals at the marked basket positions. C. Phase distribution from the inverse-computed signals at precisely the same time point as A, showing reentry in the free wall of the right atrium. D. Activation sequence is also shown from inverse-computed signals at the marked atrial positions. Voltage signals in blue and Phase transform in gray. Ic-EGM: inverse-computed EGM.
For the body surface analysis, a QRST removal algorithm was applied to each ECG channel6,20. Then, baseline of surface ECG signals was estimated by decimation to 50 Hz and a posterior filtering with a Butterworth 10th-order low-pass filter with a cut-off frequency of 2 Hz. This signal was interpolated to the sample frequency and subtracted from the original signal. Surface signals were then low-pass filtered with a 10th-order Butterworth filter with a cut-off frequency of 20 Hz. We estimated the inverse-computed epicardial signals, or non-invasive signals, by applying the zero-order Tikhonov’s method on the filtered surface ECG signals over the torso and atrial anatomy. The optimal regularization parameter was chosen at the first local maximum value of the curvature of the L-curve21. Finally, non-invasive signals on the atrial mesh were phase-transformed using the Hilbert method, and stable PS (> 1 rotation) were then detected in the 3D phase mesh and considered as rotational activity sites19 (Figure 2C).
Statistical Analysis
Continuous data are represented as mean ± SD. Normality was evaluated using the Kolmogorov–Smirnov test. Comparisons between 2 groups were made with Student t tests for independent samples if normally distributed, or if not normally distributed, with the Mann–Whitney U test. Nominal values were expressed as n (%) and compared with χ2 tests. Paired t test was used for paired comparisons with continuous variables. A probability of <0.05 was considered statistically significant.
Results
Individual reentrant activity identification
In order to assess the ability of body surface mapping to identify localized reentrant activity during AF episodes, we analyzed non-invasive phase signals at the location of the reentrant patterns detected by intracardiac mapping. Figure 2A shows the phase map of the intracardiac signals for a case in which the basket catheter was located at the right atria. In this case, the phase map of the intracardiac signals showed a stable phase singularity (Panel A) in the anatomic position close to lateral Superior Vena Cava (SVC) and Right Atrial (RA) junction. The reentrant activity could also be observed in the individual intracardiac signals surrounding this location, marked as #1-#6 in Panel A and depicted in Panel B. These six intracardiac signals (blue) showed consecutive phase evolutions (gray signals) verified by consecutive activation sequences, from #1 to #6, corresponding to reentry identified in the phase map. Non-invasive signals were analyzed during the same time interval as Panels A-B, and the corresponding phase map is depicted in Panel C. In this case, a phase singularity could be observed in the RA wall, marked with an arrow, at 17 mm from the intracardially-detected reentry from Panel A. This non-invasive reentrant activity could also be observed on the sequence of non-invasive signals (Panel D) surrounding the phase singularity location, marked from #1 to #6 in the figure. Both non-invasive signal traces (blue) and the corresponding phase transform (grey) confirm the reentrant activity in the RA.
Reentrant activity measurements
A systematic comparison between intracardiac and non-invasively detected reentries is depicted in Figure 3. Reentrant activity detected at phase maps from both intracardiac and body surface recordings is summarized in spatial histograms, showing a summation of reentrant activity (PS) detected in each atrial region. For an individual AF episode with two basket catheters, one in each atrium, the intracardiac phase map (Panel A) showed the presence of reentrant activity in the antrum of the left pulmonary veins and at the roof of the right atria (marked with red colors). For the same episode, the non-invasive reentrant map (Panel B), also showed reentrant activity in antrum of the left pulmonary veins and the superior vena cava antrum, as well as in the right atrial appendage and low lateral right wall.
Figure 3.
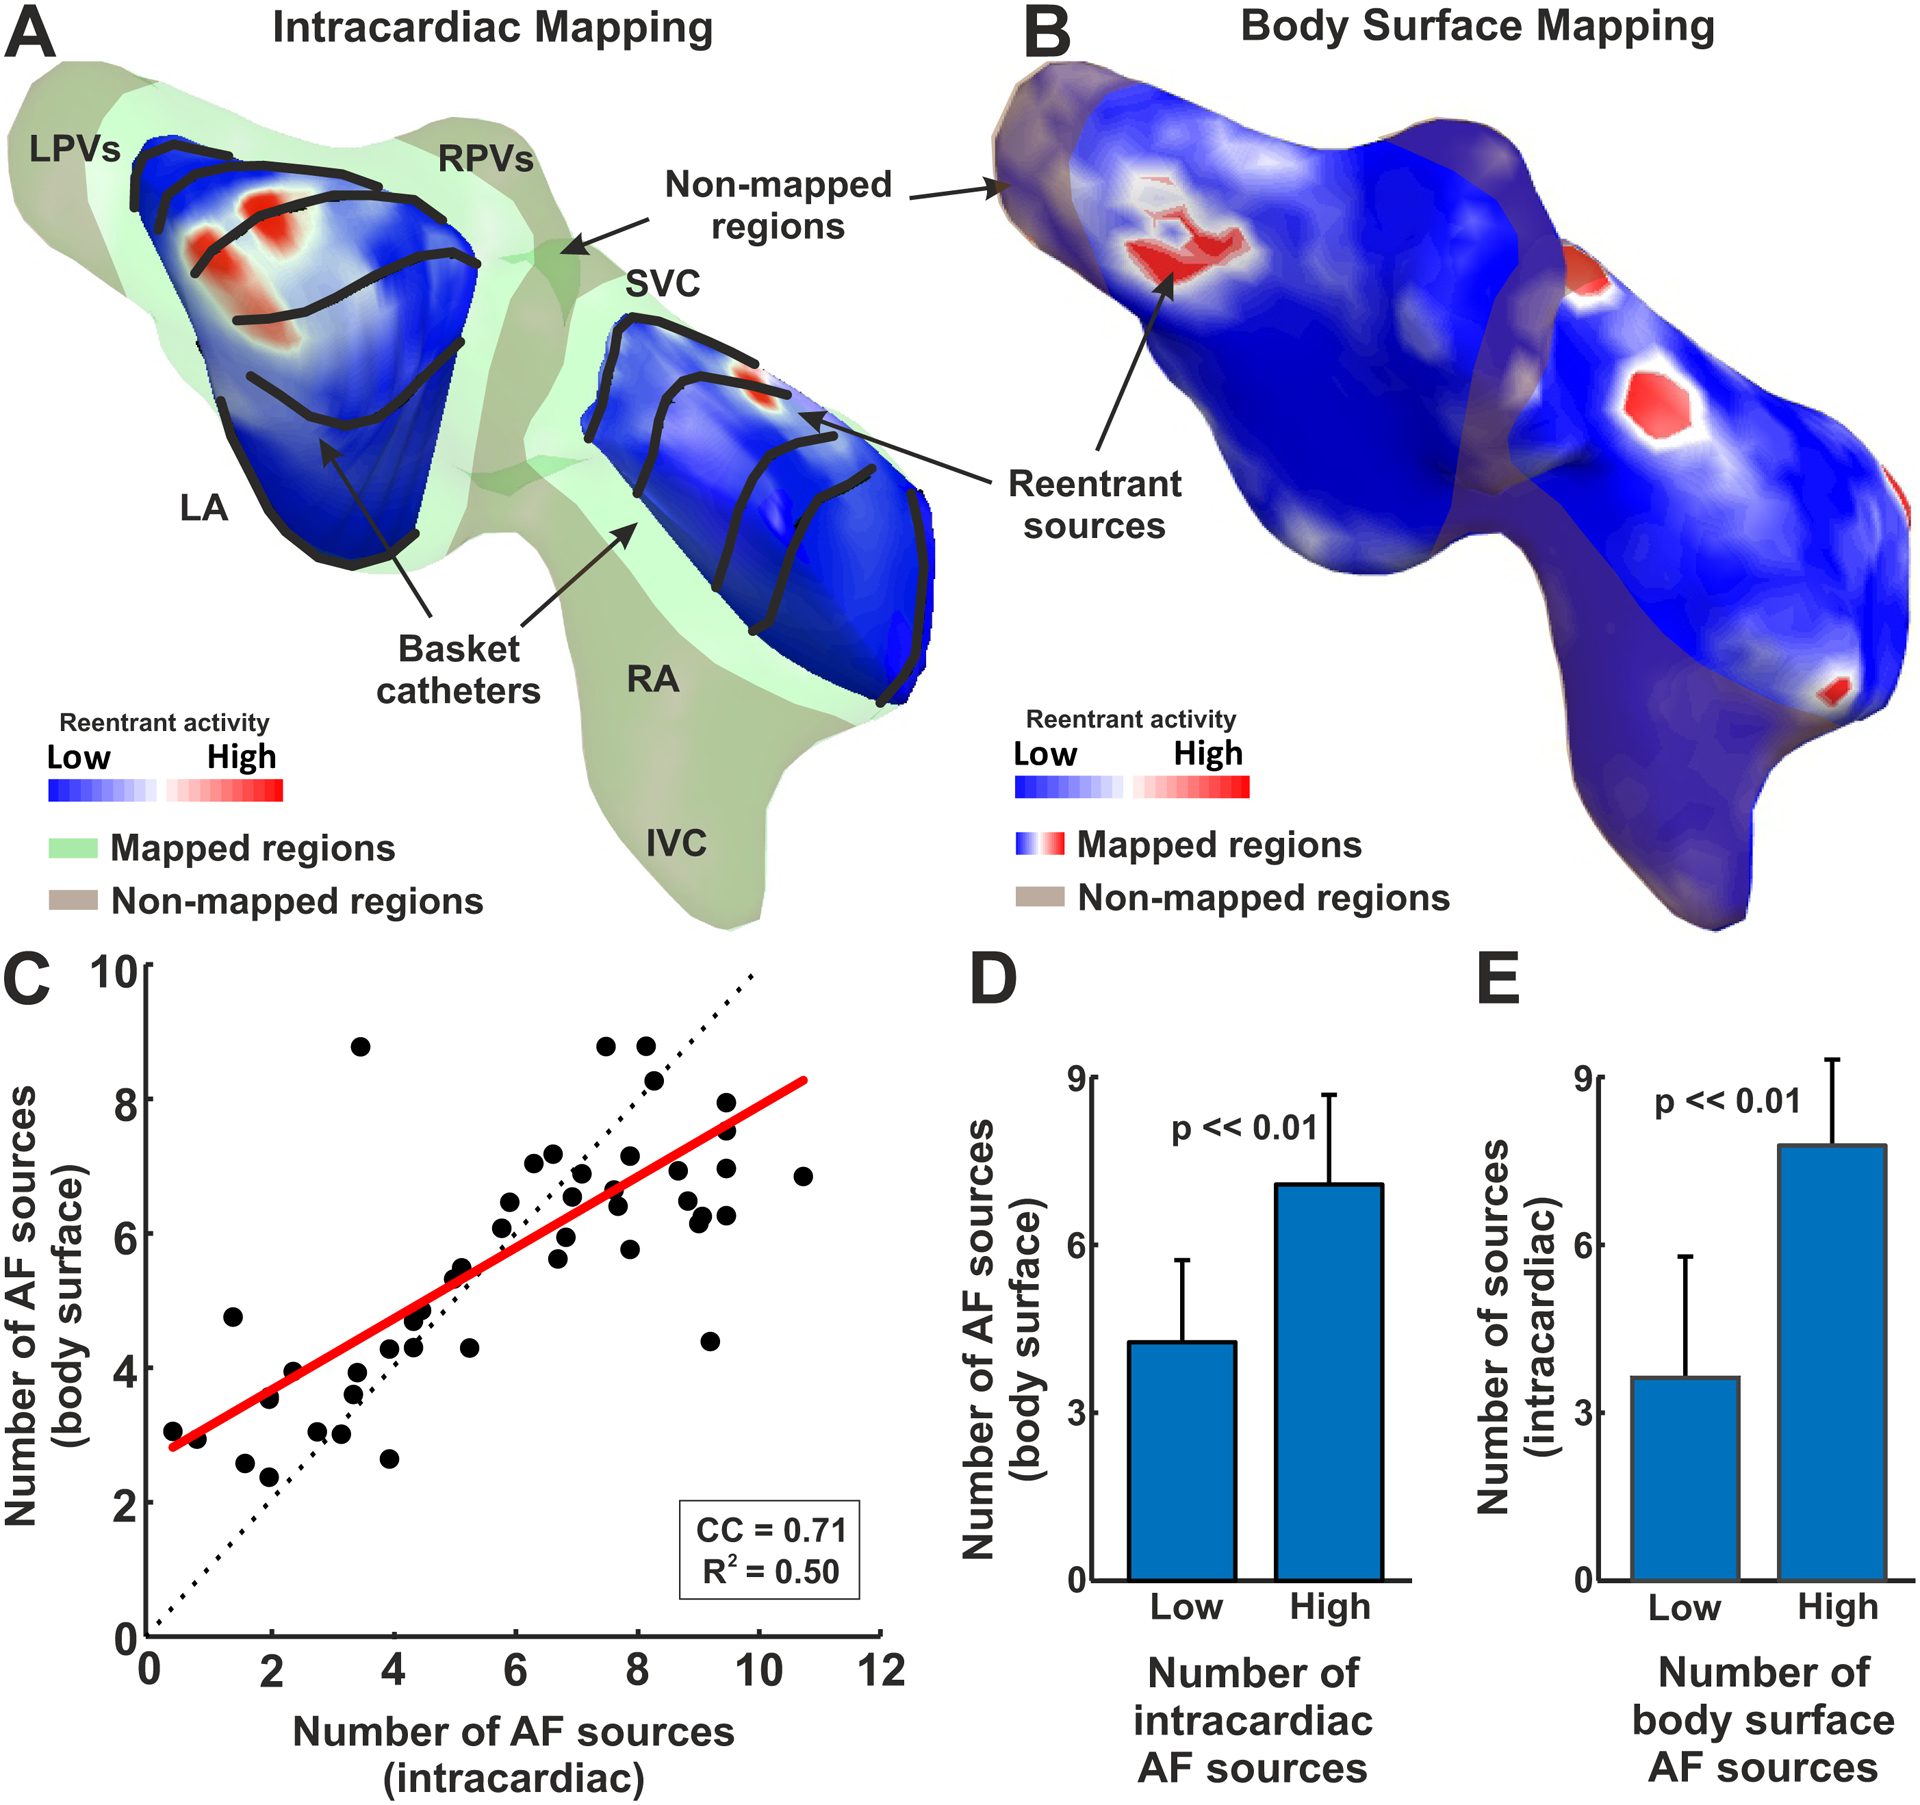
Comparison of intracardiac and body surface AF sources. A. Intracardiac basket-reconstructed reentry distribution map from patient #26. B. Body surface reentry distribution map for same patient in A. C. Comparison of intracardiac vs body surface number of sources at basket-mapped regions. D. Body surface reentrant sources for 50% of patients with low and high number of intracardiac AF sources respectively. E. Intracardiac AF sources for 50% of patients with low and high number of body surface sources respectively.
To systematically compare the presence of intracardiac and non-invasive reentries, the number of body surface reentries were compared with the number of intracardiac AF sources (Fig. 3C). We made this comparison in atrial regions mapped by intracardiac mapping, which mapped 77.4 ± 15.6 % of each atrium (Fig 3.C), similar to recent analyses using new basket designs22. For this purpose, reentrant intracardiac and non-invasive activity was measured as the number of reentrant sites in the histogram. Specifically, regions with >10% of overall reentrant activity (sources) were marked as intracardiac reentry regions. The number of observed body surface AF sources correlated with the number of intracardiac reentrant sources (R2=0.50, CC=0.71, p<0.01).
Measurements of the presence of reentrant activity were used to discriminate patients with low and high reentrant activity. In Panels D and E, the patient cohort was separated by the median (50th percentile) of patients with lower versus higher reentrant intracardiac and non-invasive drivers, respectively. In panel D, patients were separated by the presence of low or high intracardiac reentry activity, thresholded by the median number of intracardiac sources (6.1). These groups differed in body surface reentrant activity measures (4.2±1.5 vs 7.1±1.6, p<<0.01). Panel E shows patients separated by low and high non-invasive rotor presence thresholded by the median number (5.9) of body surface sources, which also showed differences in intracardiac reentrant activity presence: 3.7 ± 2.1 vs 7.8 ± 1.6, p<<0.01.
Local comparison of body surface and intracardiac reentrant activity
Colocalization of intracardiac and body surface AF reentrant sites was systematically measured for the whole cohort (Fig. 4). The presence of non-invasive individual phase singularities and stable rotors was measured at the atrial regions where the intracardiac mapping showed stables reentries (>10% of overall reentrant activity). The regions in which intracardiac reentrant activity was detected covered 16.5 ± 8.8 % of the atrial anatomy. Remaining atrial regions mapped by the basket, with no detected intracardiac reentries, represented 35.5 ± 17.0 % of atrial anatomy (p<<0.01). The sum of both areas (52.0 ± 15.7%, reentry regions + rest) did not cover the entire atrial area due to the lack of basket placement in both atria and some anatomical regions not covered by baskets (brown regions in Figure 3.A).
Figure 4.
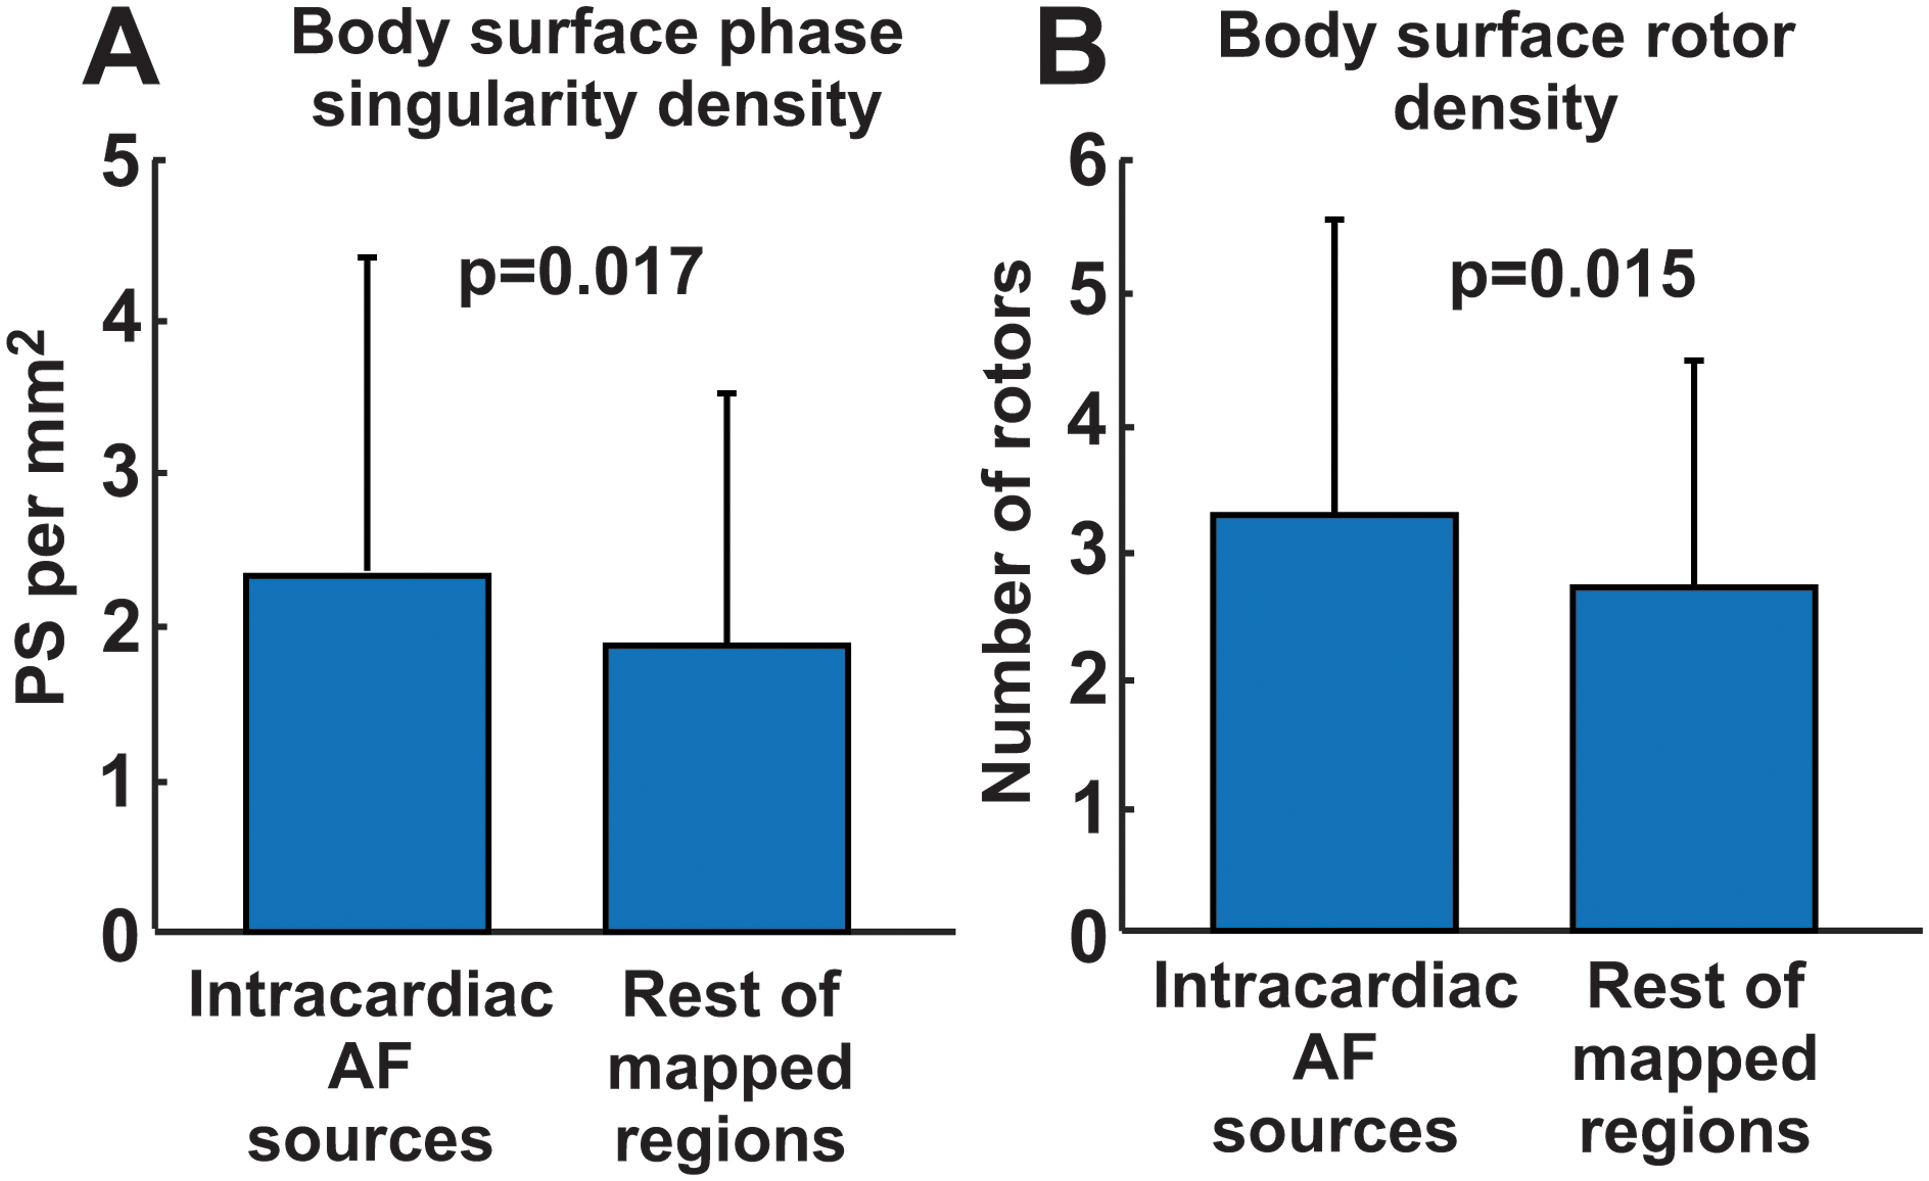
Local comparison of intracardiac and body surface reentrant activity. A. Body surface Phase Singularity density at the intracardially-detected source regions vs at the rest of atrial anatomy mapped. B. Body surface stable rotor density at the intracardially-detected source regions vs in remaining mapped atrial anatomy.
Reentry activity in AF detected non-invasively was higher at regions identified as reentrant sites than at regions not identified as reentrant sites on intracardiac maps (2.3±2.1 vs 1.9±1.6 PSs per mm2; p=0.017, Fig. 4.A) when considering individual phase singularity density, and 3.2±2.3 vs 2.7±1.8 reentrant sites (p=0.015, Fig. 4.B).
Finally, we performed a detailed comparison of reentrant sources in the posterior LA wall, which were also regions best mapped by basket catheters. As observed in Figure S2, the proportion of reentrant sources detected by intracardiac and body surface mapping was similar, mostly being at the left PVs (42% vs 47% of sources) and the LA roof (27% vs. 19%).
Body surface reentrant activity and impact of ablation
Non-invasive reentry mapping measurements were compared with acute clinical outcomes of ablation, and AF terminated during the ablation protocol in 41% of the guided-ablation cohort (Table S1).
Figure 5.A–B shows the body surface reentrant activity maps for representative patients in whom driver-guided ablation did and did not acutely terminate AF, respectively. Overall, patients in whom driver-guided ablation acutely terminated AF during the procedure (N=7, figure 6.A), had less global non-invasive reentrant regions (5.8 ± 3.1) than those in which AF did not terminate (N=10, 9.8 ± 4.5, p<0.001). We observe that this parameter can be a reasonable predictor of guided-ablation acute success, since its ROC curve presented an area under the curve of 0.88 (see Figure S3), with a specificity of 85.7% and a sensitivity of 80.0% when using a threshold of 7.5 body surface drivers.
Figure 5.
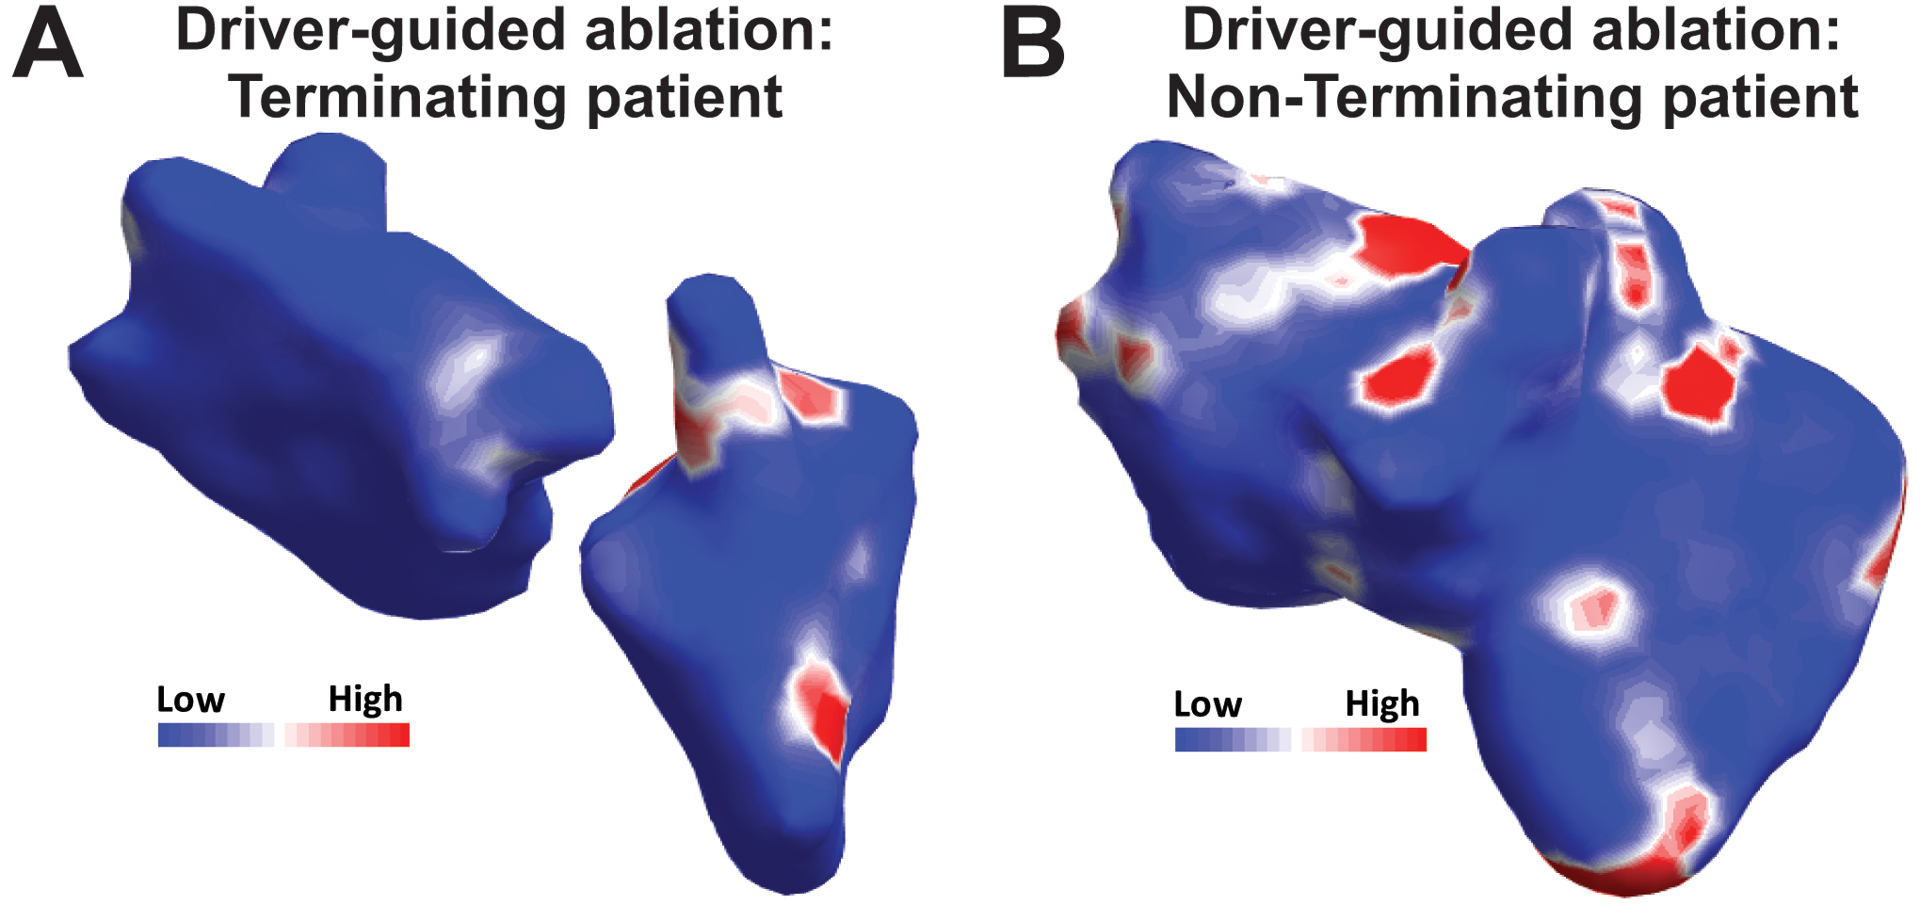
Body surface mapping in termination and non-termination patients. Body surface rotor map from a patient in which driver-guided ablation acutely terminated (A) or did not terminate AF (B).
Figure 6.
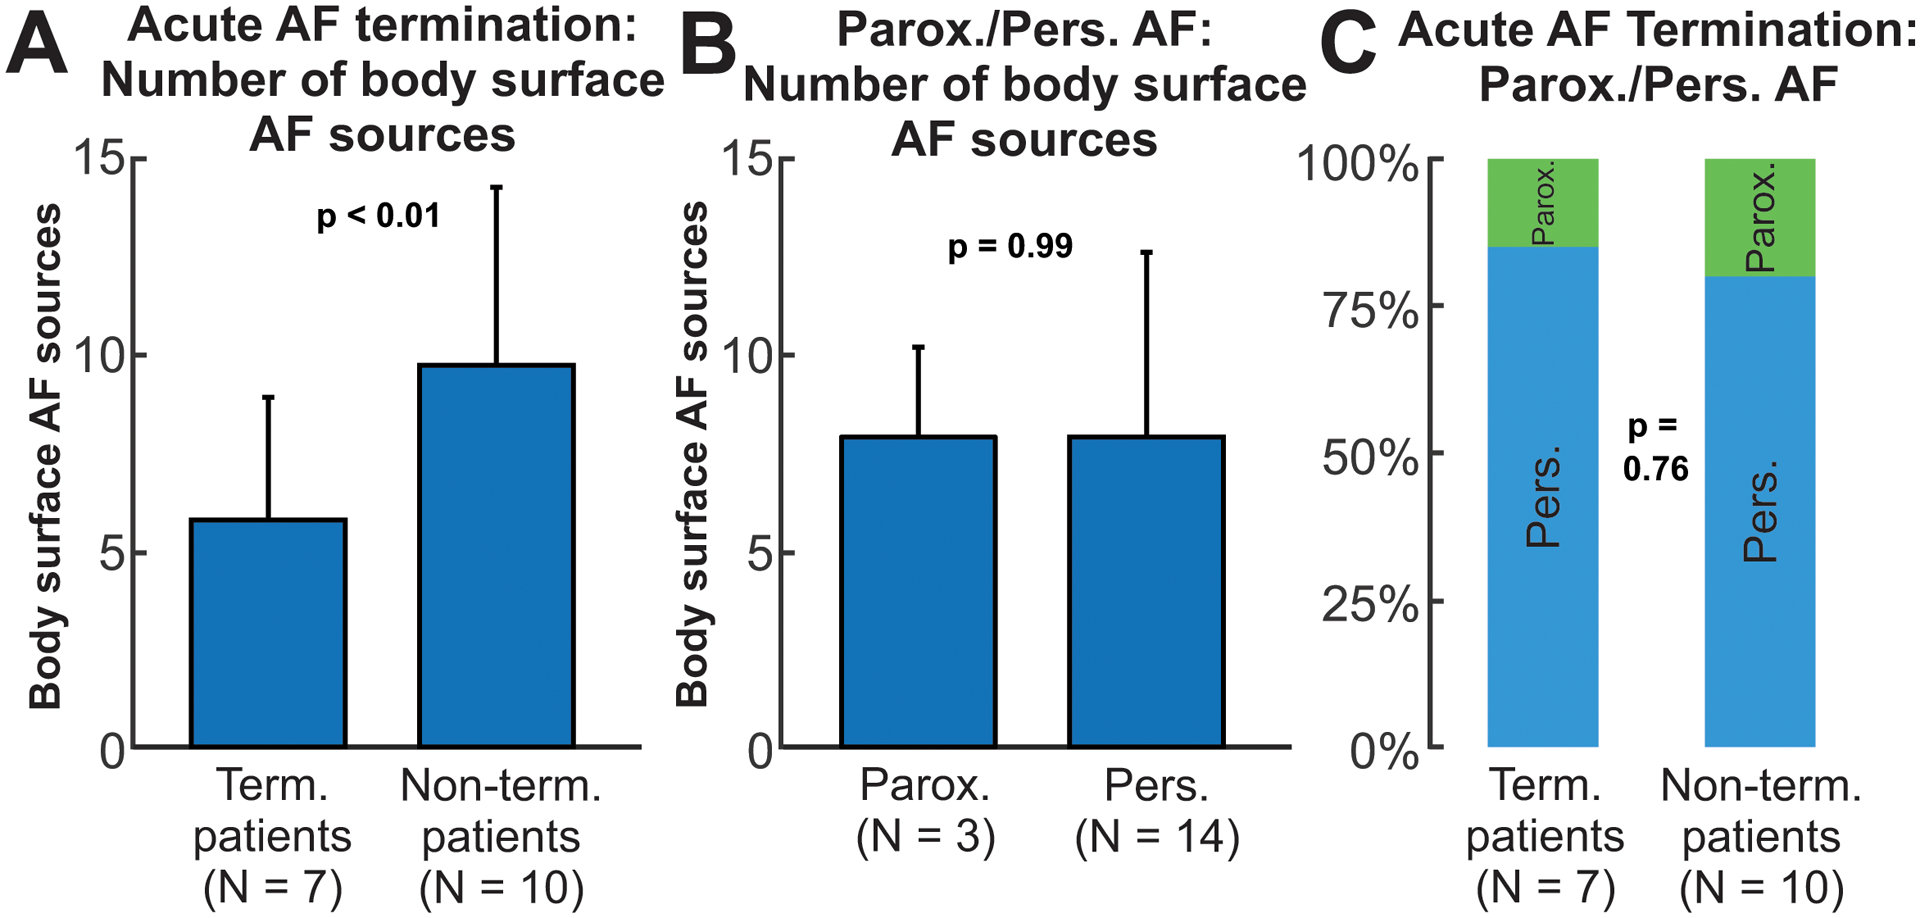
body surface reentry measures in patients under driver-guided ablation. A. Number of body surface AF sources for termination and non-termination patients. B. Number of body surface sources for paroxysmal and persistent patients. C. Proportion of paroxysmal and persistent AF patients in termination and non-termination groups.
To evaluate reentrant activity presence based on the classical AF classification (paroxysmal and persistent), we performed a similar analysis dividing the cohorts using this criterion (Figure 6.B). No significant differences were seen between paroxysmal and persistent patients in terms of reentrant activity in non-invasive maps. Body surface reentrant measures predicted AF termination better than the classical classification of paroxysmal/persistent AF (Fig 6.C; 85.7% vs. 80.0%; p=0.76). Moreover, none of the demographic or clinical parameters were statistically significant for acute termination (paroxysmal/persistent AF p=0.76, sex p=0.32, age p=0.91, history of AF p=0.90, see Supplemental Table S2) except that the number of previous ablations was higher in the termination group (p=0.02).
Driver-guided ablation by Electrocardiographic Imaging and intracardiac mapping
Finally, we analyzed the possible ability of body surface mapping to extend atrial mapping beyond what was possible by baskets, and thus potentially improve the success of AF ablation. We studied the number of AF reentrant sites detected on the body surface maps outside of sites mapped by baskets in the driver-guided ablation cohort (Figure 7). Panel A shows a schematic figure in one patient in whom the driver-guided ablation did not terminate AF, where the basket-mapped regions are green (all 4 basket positions and episodes are shown) and non-mapped regions are brown. The non-invasive map (Panel B) showed higher reentrant activity in locations that were not mapped intracardiac (left superior pulmonary vein and superior vena cava).
Figure 7.
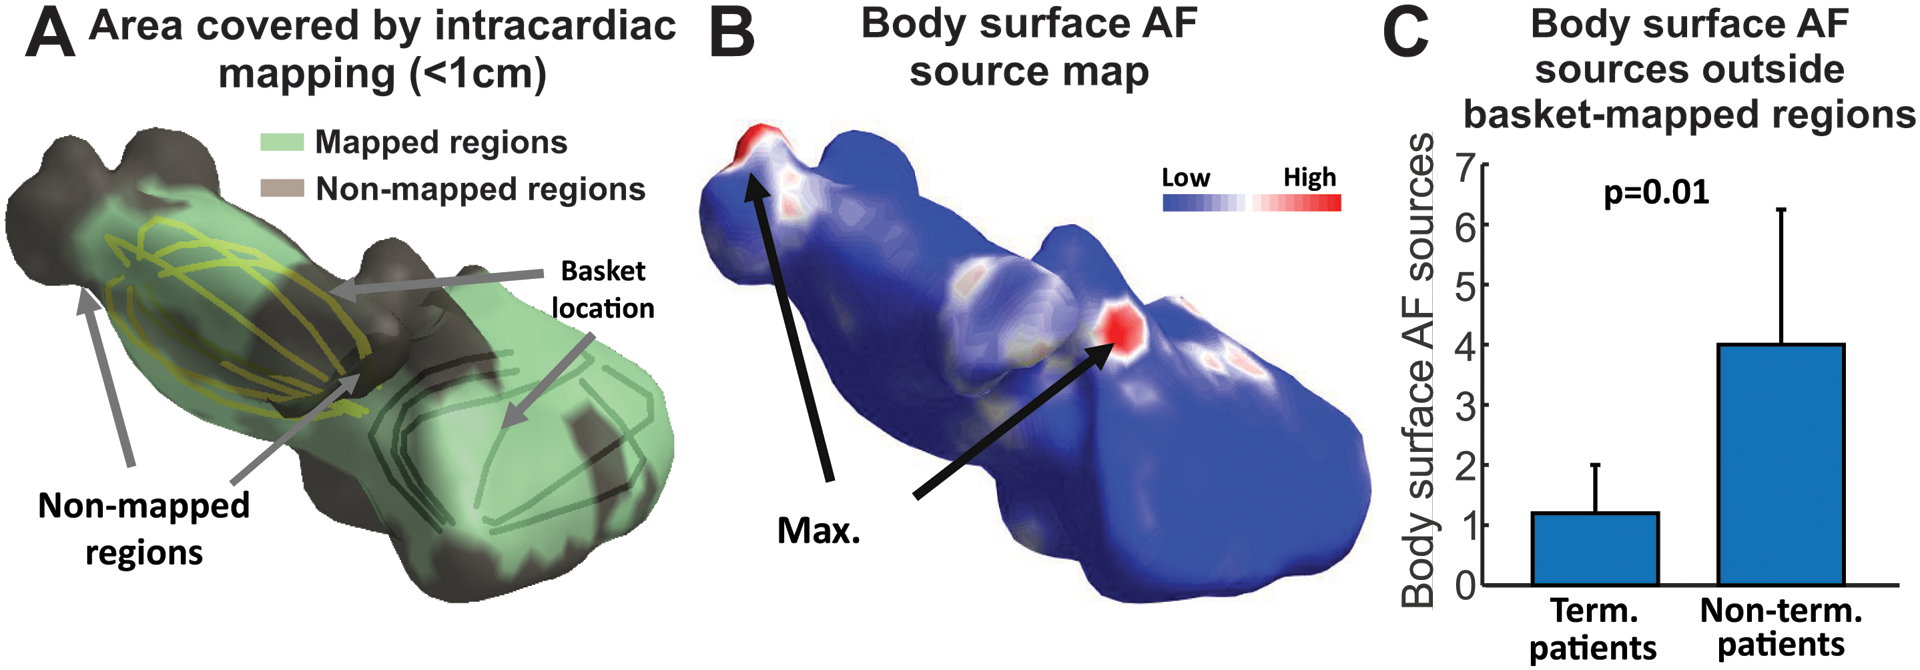
Rotors localized outside intracardiac mapped regions. A. Area covered by the basket catheter in a patient in whom driver-guided ablation did not terminate AF. B. Body surface AF source map for the patient in A, showing potential driver outside region mapped by baskets. C. Number of body surface sources outside the intracardially-mapped regions (brown in panel A) in patients in which driver-guided ablation did or did not terminated AF.
In the entire driver-guided-ablation cohort (N=17), there were fewer non-invasively identified driver sites outside basket-mapped regions (Panel C) in patients in whom ablation terminated AF (1.2 ± 0.8) compared to patients with no acute termination (4.0 ± 2.3, p=0.01).
Discussion
The present study performed simultaneous body surface and intracardiac recordings in a large population of patients with different AF types. We calibrated non-invasive mapping to basket intracardiac recordings of AF, and correlated reentrant activity based on simultaneous recordings. The correlation between ‘overall’ reentrant measurements between intracardiac and body surface mapping techniques showed good correspondence between number of potential driver sites, with a positive though modest correlation on individual comparisons in terms of exact anatomical position.
Identification of AF drivers
Most methods to map AF electrical activity and substrates require the introduction of catheters inside the heart that enable localization of sites maintaining the arrhythmia. While baskets do not contact the entire atrial surface, Honarbaksh et al reported that current baskets map 70–80% of the atrial surface22 which agrees with our coverage of 77.4 ± 15.6% per basket position. Moreover, current practice further increases mapped area by moving the basket to multiple positions.. Recent results of the REAFFIRM trial showed no benefit of driver ablation over PVI by intention to treat analysis yet, due to multiple off-protocol ablations, on-treatment analysis of PVI+driver ablation provided success of 77.8% which trended higher than PVI alone (65.5%; p=0.09)9. This benefit was eliminated in patients in whom complex fractionated electrograms and lines were also ablated9.
Ablation was guided by a clinical FDA- approved system (RhythmView™). To enable others to reproduce our work, all analyses in our study were performed using open-software algorithms (phase analysis; http://narayanlab.stanford.edu). For illustration, we show comparisons both systems (Figure S4). Phase analysis is more sensitive than the commercial system, which uses activation mapping for gray-scale movies and phase densities plotted in red, at the expense of a lower specificity. Nevertheless, 93% of the AF sources shown by RhythmView™ were also identified by our open source phase mapping.
Noninvasive mapping provides high resolution simultaneous recording of biatrial AF activation sequences. Haissaguerre et al.3 used this technique in 103 persistent AF patients to guide the ablation procedure, showing acute termination rate of 75% for persistent and 15% for long-standing AF patients, and showing also the relation between the number of targeted regions, the degree of AF progression and the probability of AF termination. These results have been confirmed by a multicenter trial demonstrating that non-invasive identification and ablation of drivers resulted in high rates of persistent AF termination and favorable AF-free survival at 1 year23. Despite these promising results, few prior studies systematically evaluated correspondence of noninvasive maps with intracardiac recordings: only AF cycle length3 and regional reentrant activity during sequential mapping has been studied24.
Body surface cardiac mapping
Electrocardiographic Imaging has been used as an independent technique to non-invasively map electrical activity of the whole epicardium simultaneously. However, several methodologic questions have emerged. Duchateau et al. showed that the correlation of classical electrophysiological measurements, such as activation time mapping, appear to diverge between body surface and catheter-based recordings25. The methodologic limitations (i.e. bipolar vs. unipolar recordings) together with the biophysical limitations of the inverse resolution, prevent that signals reconstructed by non-invasive mapping had temporal and/or spatial precision to enable accurate calculation of local activations and to reproduce isochronal maps19,21,26. However, measurements based on secondary post-processing methods such as frequency or phase can still be used in body surface cardiac mapping when local activation times are not achievable. These parameters are intrinsically more stable than activation times, since they do not depend on a single fiducial point. Both frequency and phase mapping summarize a series of temporal and spatial voltage distributions in a single measure (DF, singularity point) and therefore they should be intrinsically more robust against the biophysical limitations of the inverse problem18. On the other hand, phase analysis can be applied to intracardiac and non-invasive signals, which is important for this comparison of both mapping techniques. While FIRM includes activation (gray-scale movies) as well as phase (red marked regions), body surface signals are best analyzed by phase. We thus use phase for intracardiac and body surface analysis, while accepting that this is not free of controversy due to the risk of detecting false reentries27. Other methodologies for intracardiac mapping not based on phase analysis have also been proved useful for AF driver identification28, although their extrapolation to non-invasive signals is still under debate.
Prior studies have evaluated the electrical complexity of AF, demonstrating that most paroxysmal AF drivers are located close to the PV antrum while persistent AF patients have a more evenly-spaced distribution of drivers outside the PV antra to the body of the atria4,8. In agreement with these results, Lim et al. noninvasively mapped persistent AF and found a higher number of re-entrant drivers and dispersion outside the PVs with increasing AF duration29. However, these results have been restricted to patients presenting with persistent AF1. Here, we found that the number of reentrant activity regions was inversely related to the severity of AF across clinical labels of paroxysmal, persistent and longstanding persistent AF, and with the probability of acute termination of AF during the procedure.
Clinical implications of body surface mapping in AF
The main application of non-invasive mapping thus far has been to guide and plan AF ablation, specifically to identify regions that harbor drivers outside the PVs. This approach has been tested3,23. To date, such noninvasive methods have been applied only to patients referred for ablation, which actually represent a small fraction of AF patients (<2%)30. Characterization of fibrosis in the atrial substrate has been also used to non-invasively predict ablation success31.
The current study reveals that body surface mapping may be suitable to map and distinguish AF mechanisms relevant to ablation, but may be applied in general AF management. Here we present noninvasive results that non-invasive mapping may help to distinguish patients in whom ablation can terminate AF better than clinical AF labels of paroxysmal and persistent AF. Therefore, this noninvasive technology may help distinguish which patients are more suitable for ablation. Moreover, this body surface approach may help personalize broader strategies including drugs for individual AF patients, depending on their substrates. More evidence in general AF populations with inclusion of other common AF therapeutic options (rate/rhythm control, cardioversion, etc.) are needed to advance in the therapy individualization based on noninvasive recordings.
Limitations
Data were acquired at 2 different institutions, under different clinical therapies (PVI and driver-guided ablation) and with demographic differences. However, the correlation between body surface mapping and intracardiac mapping were consistent and seen across different types of AF patients: paroxysmal, persistent, long-standing and valvular AF. However, long-term clinical results of ablation in these patients are not yet available. Although AF termination is not intimately linked to the long-term success of ablation procedures, this is a practical ablation endpoint for persistent AF, and may provide an indication of AF mapping while long-term outcomes which can be influenced by long-term lesion recovery, drug adherence and AF progression. We did not include long-term outcomes as AF patients were recruited for different ablation protocols and their outcomes could not be consistently linked with the mapping approach. Performing DCCV and then reinducing AF may introduce additional variability into AF, since the precise relationship between the physiology of spontaneous and induced AF is undefined. We have reported that AF drivers can be present for prolonged periods of time, although they certainly fluctuate32.
Finally, we performed the body surface protocol with a reduced number of surface electrode set (57), which we have shown to be sufficient to reproduce the surface electrical activity during AF33–34 and is also more consistent with simultaneous intracardiac mapping from the ablation protocol.
Conclusions
Non-invasive characterization of AF complexity is feasible and accurately identifies reentrant activity identified on simultaneous panoramic contact mapping, including sites where ablation terminated AF. While individual comparison of body surface and intracardiac reentrant drivers showed reasonably good correspondence, overall reentrant activity was well correlated which allows non-invasive metrics to accurately phenotype AF complexity. These body surface complexity measures were also correlated with acute ablation outcomes. This opens the possibility of using body surface technology to non-invasively characterize AF and therefore personalize therapies better than existing clinical labels.
Supplementary Material
What is Known:
Phenotyping atrial fibrillation (AF) related with the response to therapy can improve the efficacy of current therapies.
What the Study Adds:
Complexity, defined as the number of stable AF reentrant sites, can be an effective marker of AF phenotype and can be measured by non-invasive mapping of electrical patterns of disorganization and regions of reentrant activity.
AF complexity tracked non-invasively correlates well with organized and disorganized regions detected by panoramic intracardiac mapping,
Patients with lower AF complexity by non-invasive reentry measures correlates with better acute outcome of ablation.
Sources of Funding:
Supported in part by: Instituto de Salud Carlos III FEDER (Fondo Europeo de Desarrollo Regional; IJCI- 2014-22178, DTS16/00160; PI14/00857, PI16/01123; PI17/01059; PI17/01106), Generalitat Valenciana Grants (APOSTD/2017 and APOSTD/2018) and projects (GVA/2018/103); National Institutes of Health (SMN: R01 HL85537; K24 HL103800); EIT-Health 19600 AFFINE.
Nonstandard Abbreviations and Acronyms
- AF
Atrial Fibrillation
- DF
Dominant Frequency
- ECGI
Electrocardiographic Imaging
- EGM
Electrogram
- HDF
Highest Dominant Frequency
- icEGM
Inverse-computed Electrogram
- LA
Left Atrium
- PS
Phase Singularity
- PVI
Pulmonary Vein Isolation
- RA
Right Atrium
Footnotes
Disclosures: M. Rodrigo, A.M. Climent, I. Hernández-Romero, A. Liberos, M.S. Guillem, , R. Fernández-Avilés, F. Atieza have equity from Corify Care SL. S.M. Narayan receives compensation for Services from Up to Date, Abbott Laboratories, American College of Cardiology Foundation. He receives speaking & consulting fees from Medtronic, Inc., St. Jude Medical. Intellectual Property Rights from University of California Regents and Stanford University, and grant support from National Institutes of Health (HL83359, HL103800). F. Atienza served on the advisory board of Medtronic and Microport.
References:
- 1.Calkins H, Hindricks G, Cappato R, Kim YH, Saad EB, Aguinaga L, Akar JG, Badhwar V, Brugada J, Camm J, et al. 2017 HRS/EHRA/ECAS/APHRS/SOLAECE expert consensus statement on catheter and surgical ablation of atrial fibrillation: Executive summary. J Arrhythm. 2017;33:369–409 [DOI] [PMC free article] [PubMed] [Google Scholar]
- 2.Narayan SM, Krummen DE, Clopton P, Shivkumar K, Miller JM. Direct or coincidental elimination of stable rotors or focal sources may explain successful atrial fibrillation ablation: on-treatment analysis of the CONFIRM trial (Conventional ablation for AF with or without focal impulse and rotor modulation). J Am Coll Cardiol. 2013;62:138–147. [DOI] [PMC free article] [PubMed] [Google Scholar]
- 3.Haissaguerre M, Hocini M, Denis A, Shah AJ, Komatsu Y, Yamashita S, Daly M, Amraoui S, Zellerhoff S, Picat MQ, et al. Driver domains in persistent atrial fibrillation. Circulation. 2014;130:530–8. [DOI] [PubMed] [Google Scholar]
- 4.Atienza F, Almendral J, Ormaetxe JM, Moya A, Martínez-Alday JD, Hernández-Madrid A, Castellanos E, Arribas F, Arias MÁ, Tercedor L, et al. Comparison of radiofrequency catheter ablation of drivers and circumferential pulmonary vein isolation in atrial fibrillation: a noninferiority randomized multicenter RADAR-AF trial. J Am Coll Cardiol. 2014;64:2455–67. [DOI] [PubMed] [Google Scholar]
- 5.Seitz J, Bars C, Théodore G, Beurtheret S, Lellouche N, Bremondy M, Ferracci A, Faure J, Penaranda G, Yamazaki M, et al. AF Ablation Guided by Spatiotemporal Electrogram Dispersion Without Pulmonary Vein Isolation: A Wholly Patient-Tailored Approach. J Am Coll Cardiol. 2017;69:303–321. [DOI] [PMC free article] [PubMed] [Google Scholar]
- 6.Guillem MS, Climent AM, Millet J, Arenal Á, Fernández-Avilés F, Jalife J, Atienza F, Berenfeld O. Noninvasive localization of maximal frequency sites of atrial fibrillation by body surface potential mapping. Circ Arrhythm Electrophysiol. 2013;6:294–301. [DOI] [PMC free article] [PubMed] [Google Scholar]
- 7.Ramirez FD, Birnie DH, Nair GM, Szczotka A, Redpath CJ, Sadek MM, Nery PB. Efficacy and safety of driver-guided catheter ablation for atrial fibrillation: A systematic review and meta-analysis. J Cardiovasc Electrophysiol. 2017;28:1371–1378; [DOI] [PubMed] [Google Scholar]
- 8.Baykaner T, Rogers AJ, Meckler GL, Zaman J, Navara R, Rodrigo M, Alhusseini M, Kowalewski CAB, Viswanathan MN, Narayan SM, et al. Clinical Implications of Ablation of Drivers for Atrial Fibrillation: A Systematic Review and Meta-Analysis. Circ Arrhythm Electrophysiol. 2018;11:e00611. [DOI] [PMC free article] [PubMed] [Google Scholar]
- 9.Brachmann J, Hummel JD, Wilber DJ, Sarver AE, Rapkin J, Shpun S, Szili-Torok T. Prospective randomized comparison of rotor ablation vs. conventional ablation for treatment of persistent atrial fibrillation. The REAFFIRM Trial. Heart Rhythm. 2019;6:16:963–4. [Google Scholar]
- 10.Vijayakumar R, Vasireddi SK, Cuculich PS, Faddis MN, Rudy Y. Methodology Considerations in Phase Mapping of Human Cardiac Arrhythmias. Circ Arrhythm Electrophysiol. 2016;9:e004409. [DOI] [PMC free article] [PubMed] [Google Scholar]
- 11.Alhusseini M, Vidmar D, Meckler GL, Kowalewski CA, Shenasa F, Wang PJ, Narayan SM, Rappel WJ. Two Independent Mapping Techniques Identify Rotational Activity Patterns at Sites of Local Termination During Persistent Atrial Fibrillation. J Cardiovasc Electrophysiol. 2017;28:615–622. [DOI] [PMC free article] [PubMed] [Google Scholar]
- 12.Miller JM, Kalra V, Das MK, Jain R, Garlie JB, Brewster JA, Dandamudi G. Clinical Benefit of Ablating Localized Sources for Human Atrial Fibrillation: The Indiana University FIRM Registry. J Am Coll Cardiol. 2017;69:1247–1256. [DOI] [PubMed] [Google Scholar]
- 13.Zaman JAB, Baykaner T, Clopton P, Swarup V, Kowal RC, Daubert JP, Day JD, Hummel J, Schricker AA, Krummen DE, et al. Recurrent Post-Ablation Paroxysmal Atrial Fibrillation Shares Substrates With Persistent Atrial Fibrillation: An 11-Center Study. JACC Clin Electrophysiol. 2017;3:393–402 [DOI] [PMC free article] [PubMed] [Google Scholar]
- 14.Yushkevich PA, Zhang H, Gee JC. Continuous medial representation for anatomical structures. IEEE Trans Med Imaging. 2006;25:1547–64. [DOI] [PubMed] [Google Scholar]
- 15.Remondino F 3-D reconstruction of static human body shape from image sequence. Computer Vision and Image Understanding. 2004;93:65–68. [Google Scholar]
- 16.Eggert DW, Lorusso A, Fish RB. Estimating 3-D rigid body transformations: a comparison of four major algorithms. Machine Vision and Applications. 1997;9:272–290. [Google Scholar]
- 17.Rodrigo M, Guillem MS, Climent AM, Pedrón-Torrecilla J, Liberos A, Millet J, Fernández-Avilés F, Atienza F, Berenfeld O. Body surface localization of left and right atrial high-frequency rotors in atrial fibrillation patients: a clinical-computational study. Heart Rhythm. 2014;11:1584–91. [DOI] [PMC free article] [PubMed] [Google Scholar]
- 18.Rodrigo M, Climent AM, Liberos A, Fernández-Avilés F, Berenfeld O, Atienza F, Guillem MS. Highest dominant frequency and rotor positions are robust markers of driver location during noninvasive mapping of atrial fibrillation: A computational study. Heart Rhythm. 2017;14:1224–1233. [DOI] [PMC free article] [PubMed] [Google Scholar]
- 19.Rodrigo M, Climent AM, Liberos A, Fernández-Avilés F, Berenfeld O, Atienza F, Guillem MS. Technical Considerations on Phase Mapping for Identification of Atrial Reentrant Activity in Direct- and Inverse-Computed Electrograms. Circ Arrhythm Electrophysiol. 2017;10:e005008. [DOI] [PubMed] [Google Scholar]
- 20.Castells F, Mora C, Rieta JJ, Moratal-Pérez D, Millet J. Estimation of atrial fibrillatory wave from single-lead atrial fibrillation electrocardiograms using principal component analysis concepts. Med Biol Eng Comput. 2005;43:557–560. [DOI] [PubMed] [Google Scholar]
- 21.Rodrigo M, Climent AM, Liberos A, Hernandez-Romero I, Arenal A, Bermejo J, Fernandez-Aviles F, Atienza F, Guillem MS. Solving Inaccuracies in Anatomical Models for Electrocardiographic Inverse Problem Resolution by Maximizing Reconstruction Quality. IEEE Trans Med Imaging. 2018;37:733–740. [DOI] [PubMed] [Google Scholar]
- 22.Honarbakhsh S, Schilling RJ, Providência R, Dhillon G, Sawhney V, Martin CA, Keating E, Finlay M, Ahsan S, Chow A, et al. Panoramic atrial mapping with basket catheters: A quantitative analysis to optimize practice, patient selection, and catheter choice. J Cardiovasc Electrophysiol. 201;28:1423–1432 [DOI] [PubMed] [Google Scholar]
- 23.Knecht S, Sohal M, Deisenhofer I, Albenque JP, Arentz T, Neumann T, Cauchemez B, Duytschaever M, Ramoul K, Verbeet T, et al. Multicentre evaluation of non-invasive biatrial mapping for persistent atrial fibrillation ablation: the AFACART study. Europace. 2017;19:1302–1309. [DOI] [PubMed] [Google Scholar]
- 24.Metzner A, Wissner E, Tsyganov A, Kalinin V, Schlüter M, Lemes C, Mathew S, Maurer T, Heeger CH, Reissmann B, et al. Noninvasive phase mapping of persistent atrial fibrillation in humans: Comparison with invasive catheter mapping. Ann Noninvasive Electrocardiol. 2018;23:e12527. [DOI] [PMC free article] [PubMed] [Google Scholar]
- 25.Duchateau J, Sacher F, Pambrun T, Derval N, Chamorro-Servent J, Denis A, Ploux S, Hocini M, Jaïs P, Bernus O, et al. Performance and limitations of noninvasive cardiac activation mapping. Heart Rhythm. 2019;16:435–442. [DOI] [PubMed] [Google Scholar]
- 26.Rudy Y Letter to the Editor-ECG imaging and activation mapping. Heart Rhythm. 2019; 16:e50–e. [DOI] [PubMed] [Google Scholar]
- 27.Podziemski P, Zeemering S, Kuklik P, van Hunnik A, Maesen B, Maessen J, Crijns HJ, Verheule S, Schotten U. Rotors Detected by Phase Analysis of Filtered, Epicardial Atrial Fibrillation Electrograms Colocalize With Regions of Conduction Block. Circ Arrhythm Electrophysiol. 2018;11:e005858. [DOI] [PMC free article] [PubMed] [Google Scholar]
- 28.Willems S, Verma A, Betts TR, Murray S, Neuzil P, Ince H, Steven D, Sultan A, Heck PM, Hall MC, et al. Targeting Nonpulmonary Vein Sources in Persistent Atrial Fibrillation Identified by Noncontact Charge Density Mapping. Circ Arrhythm Electrophysiol. 2019;12:e007233.51. [DOI] [PubMed] [Google Scholar]
- 29.Lim HS, Hocini M, Dubois R, Denis A, Derval N, Zellerhoff S, Yamashita S, Berte B, Mahida S, Komatsu Y, et al. Complexity and Distribution of Drivers in Relation to Duration of Persistent Atrial Fibrillation. J Am Coll Cardiol. 2017;69:1257–1269. [DOI] [PubMed] [Google Scholar]
- 30.Camm AJ, Breithardt G, Crijns H, Dorian P, Kowey P, Le Heuzey JY, Merioua I, Pedrazzini L, Prystowsky EN, Schwartz PJ, et al. Real-life observations of clinical outcomes with rhythm- and rate-control therapies for atrial fibrillation RECORDAF (Registry on Cardiac Rhythm Disorders Assessing the Control of Atrial Fibrillation). J Am Coll Cardiol. 2011;58:493–501. [DOI] [PubMed] [Google Scholar]
- 31.Kowalewski CAB, Shenasa F, Rodrigo M, Clopton P, Meckler G, Alhusseini MI, Swerdlow MA, Joshi V, Hossainy S, Zaman JAB, et al. Interaction of Localized Drivers and Disorganized Activation in Persistent Atrial Fibrillation: Reconciling Putative Mechanisms Using Multiple Mapping Techniques. Circ Arrhythm Electrophysiol. 2018;11:e005846. [DOI] [PMC free article] [PubMed] [Google Scholar]
- 32.Chelu MG, King JB, Kholmovski EG, Ma J, Gal P, Marashly Q, AlJuaid MA, Kaur G, Silver MA, Johnson KA, et al. Atrial Fibrosis by Late Gadolinium Enhancement Magnetic Resonance Imaging and Catheter Ablation of Atrial Fibrillation: 5-Year Follow-Up Data. J Am Heart Assoc. 2018;7:e006313. [DOI] [PMC free article] [PubMed] [Google Scholar]
- 33.Guillem MS, Bollmann A, Climent AM, Husser D, Millet-Roig J, Castells F. How many leads are necessary for a reliable reconstruction of surface potentials during atrial fibrillation? IEEE Trans Inf Technol Biomed. 2009;13:330–40. [DOI] [PubMed] [Google Scholar]
- 34.Rodrigo M, Climent AM, Liberos A, Fernández-Aviles F, Atienza F, Guillem MS, Berenfeld O. Minimal configuration of body surface potential mapping for discrimination of left versus right dominant frequencies during atrial fibrillation. Pacing Clin Electrophysiol. 2017;40:940–946 [DOI] [PMC free article] [PubMed] [Google Scholar]
Associated Data
This section collects any data citations, data availability statements, or supplementary materials included in this article.


