Abstract
Complex organisms are able to rapidly induce select genes in response to diverse environmental cues. This regulation occurs in the context of large genomes condensed by histone proteins into chromatin. The macrophage response to pathogen sensing rapidly engages conserved signaling pathways and transcription factors for coordination of inflammatory gene induction1–3. Enriched integration of histone H3.3, the ancestral histone H3 variant, is a general feature of dynamically regulated chromatin and transcription4–7. However, little is known of how chromatin is regulated at rapidly induced genes and what features of H3.3 might enable rapid and high-level transcription. The amino-terminus of H3.3 contains a unique serine residue that is absent in “canonical” H3.1 and H3.2. We find that this residue, H3.3S31, is phosphorylated (H3.3S31ph) in a stimulation-dependent manner along rapidly induced genes in mouse macrophages. This selective mark of stimulation-responsive genes directly engages histone methyltransferase SETD2, a component of the active transcription machinery, and “ejects” ZMYND11, an elongation corepressor8,9. We propose that features of H3.3 at stimulation-induced genes, including H3.3S31ph, afford preferential access to the transcription apparatus. Our results indicate dedicated mechanisms enabling rapid transcription involving histone variant H3.3, its phosphorylation, and both recruitment and ejection of chromatin regulators.
A poorly understood feature of stimulation-induced genes is their ability to effectively engage the general transcription machinery for rapid expression. Selective, induced transcription of heat shock10 or inflammatory genes occurs rapidly and robustly, despite these genes’ de novo expression among thousands of constitutively expressed genes. We considered that stimulation-induced transcription may be controlled by dedicated chromatin regulatory mechanisms in cooperation with signal-activated transcription factors. Among stimulation-responsive features of chromatin, histone phosphorylation can be an efficient and potent means of transmitting signals via kinase cascades to stimulation-responsive genes with the potential to augment their transcription11–16.
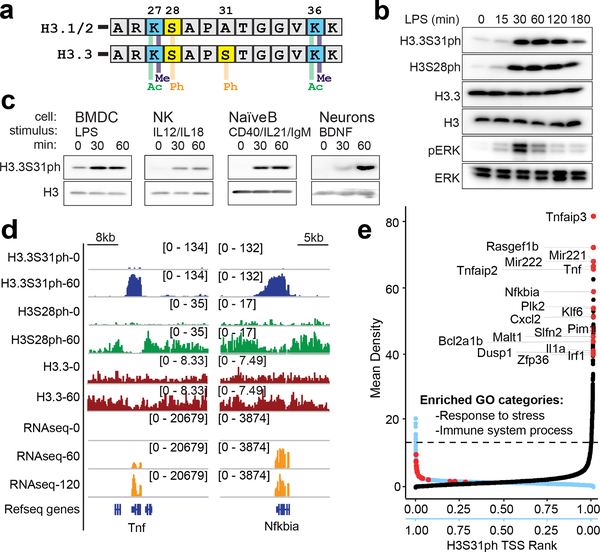
H3.3 is the conserved, ancestral H3 variant and the only H3 present in some simple eukaryotes, including S. cerevisiae. In complex organisms, H3.3 is uniquely expressed outside the cell cycle and plays a variety of roles in transcription, genomic stability and mitosis, while so-called “canonical” H3.1/2 histones are expressed in a “replication-dependent” manner timed to accommodate the doubling genome17,18. The amino-terminal H3.3 ‘tail’ differs from that of H3.1/2 by a single amino acid, a serine at position 31 in H3.3, in place of an alanine in H3.1/2 (Fig. 1a and Extended Data Fig. 1a). Despite the well-characterized enrichment of H3.3 in dynamic chromatin, the potential regulatory function and biophysical mechanisms of H3.3S31 and H3.3-specific phosphorylation are poorly understood4–7,19. Recent studies have highlighted a causal role for H3.3 in metastasis20 and the importance of H3.3S31 and its phosphorylation in Xenopus laevis gastrulation21 and embryonic stem cell differentiation22. Here, we report on coordinated mechanisms by which H3.3S31ph amplifies rapid, high-level, stimulation-induced transcription.
Figure 1: Histone H3 variant, H3.3, is phosphorylated at stimulation-induced genes during the macrophage response to pathogen sensing.
(A) Histone H3 sequence comparison between “canonical” H3.1/2 and variant H3.3 amino-terminal tails (residues 25–37), with key histone modifications labeled. (B) Western blot time course analysis of phospho-proteins, H3.3S31ph, H3S28ph, pERK in BMDM response to LPS; total H3, H3.3, and Erk as loading controls. (C) Western blot analysis of H3.3S31ph in bone marrow derived dendritic cells (BMDC), natural killer cells (NK), naïve B cells and neurons both in resting conditions and after treatment with relevant stimuli. (D) RNAseq tracks and H3.3, H3.3S31ph, and H3S28ph ChIPseq tracks in resting and stimulated BMDM at the Tnf and Nfkbia loci. (E) Dual rank order plot of H3.3S31ph ChIP signal density at all genes (TSS-TES) in resting macrophages (ranked in reverse order, right to left, blue X-axis) and stimulated (60’) macrophages (ranked left to right, black X-axis). Dotted line represents the top 1% threshold in stimulated macrophages. Red dots represent top stimulation-induced genes (FDR<0.05, fold change >2 between 0’ and 60’) among the top 0.2% of genes by H3.3S31ph ChIP density and are labeled in the 60’ data. Figure 1B-C are representative of 3 or more experiments.
H3.3 phosphorylation at induced genes
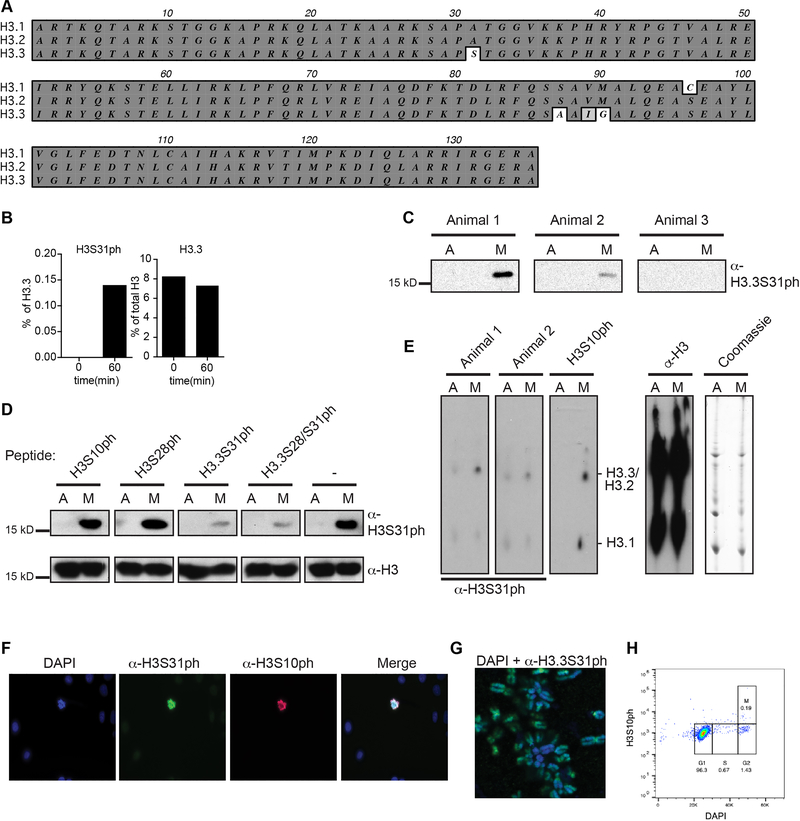
To identify candidate chromatin regulatory mechanisms with a dedicated role during cellular stimulation we purified histones from resting and bacterial lipopolysaccharide (LPS) stimulated primary mouse bone marrow derived macrophages (BMDM) and quantified histone post translational modifications (PTMs) by mass spectrometry (MS). H3.3S31ph was undetectable in resting macrophages and increased upon stimulation, while the total level of H3.3 protein remained unchanged (Extended Data Fig. 1b). Comprehensive analysis revealed minimal changes, upon stimulation, of other histone PTMs (Supplementary Table 1). For further study of H3.3S31ph, we developed a highly specific antibody (Extended Data Fig. 1–2). We confirmed, by western blot, the stimulation-induced nature and rapid kinetics of H3.3S31ph, paralleling ERK phosphorylation (Fig. 1b). Importantly, given extensive phosphorylation of histones in mitosis, including H3.3S3123, the post-mitotic nature of BMDM enabled us to distinguish stimulation-associated histone phosphorylation from mitotic events (Extended Data Fig. 1d–h). Given the conserved nature of H3.3S31, we hypothesized that its phosphorylation features in diverse cellular stimulation responses. Indeed, we observed stimulation dependent H3.3S31ph in four additional cell types, each responding to unique physiologic stimulation conditions: bone marrow derived dendritic cells (BMDC) with LPS; natural killer (NK) cells with IL-12 and IL-18; naïve B cells with anti-CD40, anti-IgM, and IL-21; and primary cortical neurons stimulated with brain-derived neurotrophic factor (BDNF) (Fig 1c).
To establish the genomic location of H3.3S31ph, we performed chromatin immunoprecipitation and sequencing (ChIPseq) in resting and stimulated (60’ LPS) BMDM. We compared H3.3S31ph localization to H3S28ph, which we previously showed to have stimulation dependent deposition at enhancers, promoters, and across large intergenic domains containing stimulation induced genes16. Like H3S28ph, H3.3S31ph is stimulation dependent, but in contrast, it strictly delineates the gene bodies (transcription start site, TSS, to transcription end site, TES) of many LPS-induced genes (Fig. 1d).
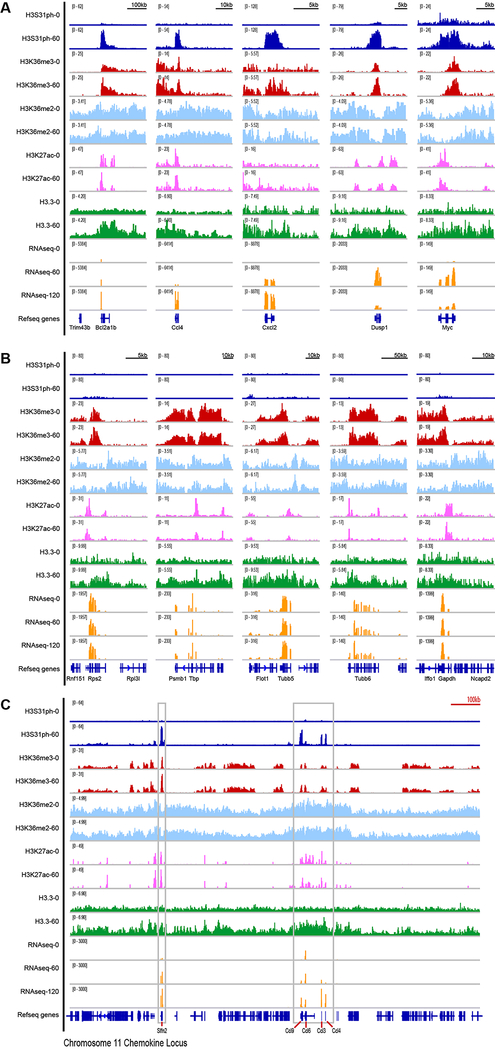
H3.3S31ph ChIPseq revealed that its deposition is specific for stimulation-induced genes, not a general feature of constitutively expressed genes (Extended Data Fig. 3). To evaluate the identity of H3.3S31ph-enriched genes in an unbiased manner and explore the relationship between genic H3.3S31ph ChIP signal and stimulation-induced genes, we performed two independent genome-wide analyses; one based on ChIP peak calls and another based on ChIP density rank order for all annotated genes. These orthogonal approaches yielded highly overlapping gene sets and gene ontology analysis reflected their stimulation induced nature: “response to stress”, “immune system process”, “cellular response to chemical stimulus” (Fig. 1e, Extended Data Fig. 4a–d, Supplementary Tables 2 and 3). Thus, selective deposition of H3.3S31ph at genes with de novo, signal-induced transcription indicates a dedicated role in stimulation-responsive transcription.
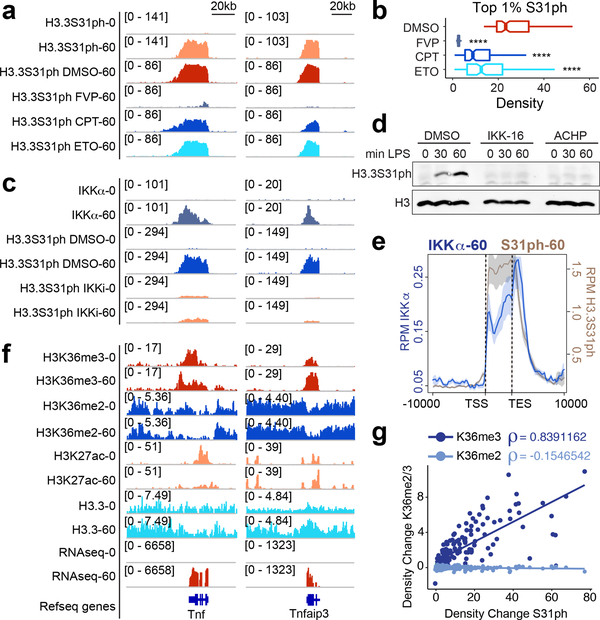
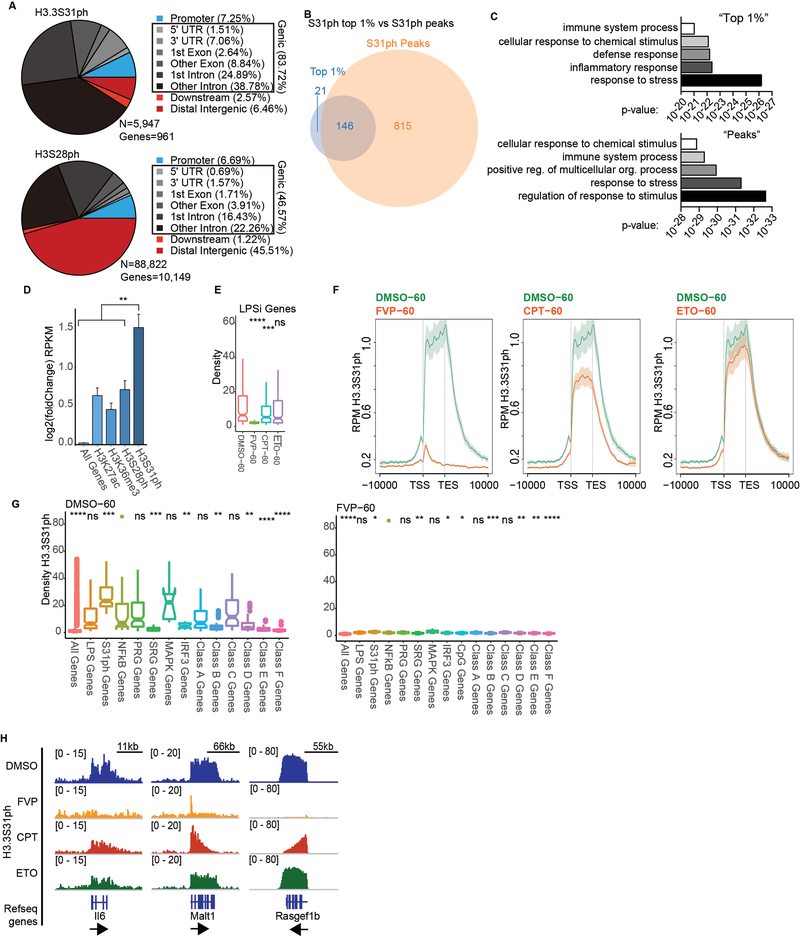
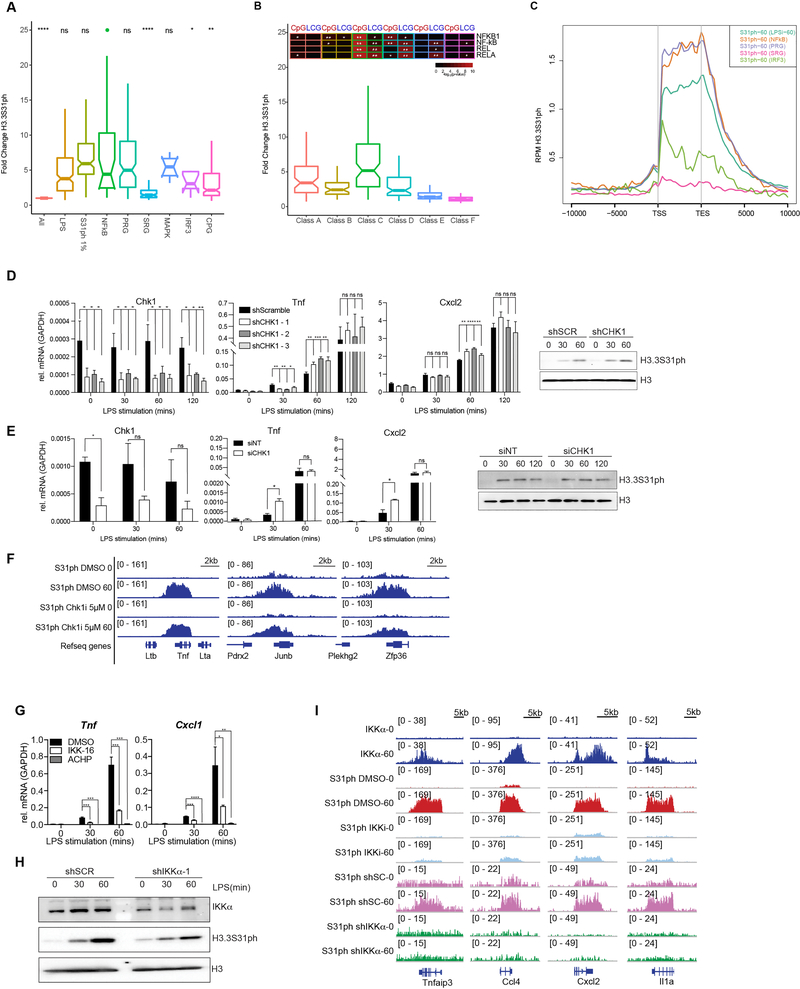
Our genome-wide analysis is consistent with a previous study that described stimulation induced H3.3S31ph at the Tnf locus, mediated by IKKα interacting with Pol II24. In addition to IKKα, other candidate kinases included Chk122,25 and Aurora B26,27. To identify the kinase in BMDM and to define its activity relative to the transcription cycle, we pursued a series of pharmacologic and knockdown experiments. We found that use of flavopiridol (P-TEFb inhibitor) to block Pol II elongation, abolished H3.3S31ph, except for modest levels at the TSS (Fig. 2a–b, Extended Data Fig. 4e–g). Inhibition of TOP1 with camptothecin stalls Pol II within gene bodies due to accumulation of torsional stress28, reduces H3.3S31ph across gene bodies, and reveals a 5’ block of H3.3S31ph at long genes like Malt1 and Rasgef1b. TOP2 inhibition with etoposide also reduced H3.3S31ph at select genes (i.e., Il6), perhaps those requiring double-strand break mediated enhancer-promoter looping28 (Fig. 2a–b; Extended Data Fig. 4e–f, h). Our observations of enriched NF-κB targets among H3.3S31ph genes (Extended Data Fig. 5a–c) and minimal effects with Chk1 perturbation (Extended Data Fig. 5d–f), suggested that the kinase may be IKKα. We find that IKKα localizes to H3.3S31ph genes in a stimulation-dependent manner (Fig. 2c). Further, pan-IKK inhibitors and shRNA specific for IKKα result in loss of H3.3S31ph at inflammatory genes (Fig. 2d, Extended Data Fig. 5g–i). Notably, IKKα-dependent H3.3S31ph occurred across a range of stimulation-induced genes (Fig. 2e, Extended Data Fig. 5), including those not annotated as NF-κB target genes, consistent with the potential for IKKα to interact with other transcription factors29. Thus, IKKα associates with elongating Pol II and performs co-transcriptional H3.3S31ph. Further characterization of this intriguing role of IKKα in transcription is needed.
Figure 2: H3.3S31 is co-transcriptionally phosphorylated by IKKα, deposited in the gene-body of response genes, and corresponds with H3K36me3.
ChIPseq tracks of H3.3S31ph at Tnf and Tnfaip3 (A), and read densities of top 1% H3.3S31ph target genes (B) in resting and LPS-stimulated BMDM after pre-treatment with DMSO, flavopiridol (FVP), camptothecin (CPT) and etoposide (ETO). ****, p<0.0001; Student’s t-test. (C) ChIPseq tracks of IKKα and H3.3S31ph at Tnf and Tnfaip3 after pre-treatments with DMSO and the IKK inhibitor IKK-16 (1.5 μM). (D) Western blot analysis of H3.3S31ph in resting and LPS-stimulated BMDM after pre-treatment with DMSO and the IKK inhibitors IKK-16 (1.5 μM) and ACHP (10 μM). (E) ChIPseq average profiles for H3.3S31ph and IKKα of RNAseq defined LPS-induced genes after 60 min of LPS stimulation. (F) ChIPseq tracks of H3K36me3, H3K36me2, H3K27ac, and H3.3, and RNAseq in resting and LPS-stimulated BMDM at Tnf and Tnfaip3. Additional genes and controls are shown in fig. S3. (G) Correlation plot showing absolute change (average read density 60’ - 0’ after LPS-stimulation) of H3K36me3 and H3K36me2 association with H3.3S31ph absolute change (average read density 60 – 0). Spearman’s rank correlation coefficient shown.
H3.3 phosphorylation stimulates SETD2
In considering possible mechanisms by which H3.3S31ph may regulate transcription, we focused on links to co-transcriptional H3K36me3. H3K36me3 is mediated by a single histone methyltransferase (HMT), SETD2, while other H3K36 methyltransferases can only mono- and di-methylate H3K3630. SETD2 and tri-methylation of H3K36 play an important role in transcription fidelity, genic DNA methylation, and mRNA splicing30–32. We found similar gene body localization of H3.3S31ph and H3K36me3 at stimulation-induced genes (Fig. 2a,c,f). Intriguingly, while H3.3S31ph is strictly stimulation-dependent at inducible genes, H3K36me3 is present at modest levels in resting macrophages and increases commensurate with H3.3S31ph upon stimulation (Fig. 2f–g, Extended Data Fig. 6), likely representing a unique transcriptionally poised state.
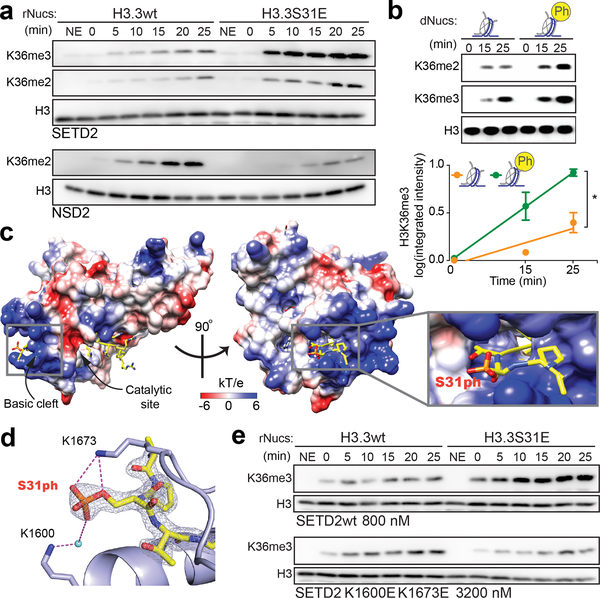
Given this link between H3.3S31ph and H3K36me3 as well as their physical proximity on the H3.3 tail (Fig. 1a), we hypothesized that H3.3S31ph may endow stimulation-induced genes with the capacity for augmented transcription, in part through the stimulation of H3K36me3. To test this hypothesis, we assessed enzymatic activity of the SET domain of SETD2 in vitro on nucleosome substrates assembled from recombinant histones (rNucs), either with normal H3.3 tail sequence, or bearing the phospho-mimicking glutamic acid mutation at residue 31 (S31E). SETD2 HMT activity on H3.3K36 was measured by western blot during a reaction time course. For comparison, we performed these assays with K36 HMT NSD2. Antibodies specific for K36me2 and K36me3 were used (Extended Data Fig. 2). Both enzymes accumulated their products throughout the tested time course, though SETD2 activity was stimulated by the phospho-mimicking H3.3S31E mutant, while NSD2 activity was reduced (Fig. 3a). Further, using native nucleosome substrates, semi-synthetic “designer” nucleosomes (dNucs)35, we observed H3.3S31ph-augmented SETD2 activity by quantitative fluorescence western blotting (Fig. 3b, Extended Data Fig. 7a).
Figure 3. The H3K36me3 methyltransferase SETD2 is stimulated by H3.3S31ph.
(A) Western blot analysis for H3K36me2, H3K36me3, and H3 in histone methyltransferase (HMT) assays with SETD2 SET-domain and full-length NSD2 enzymes on unmodified H3.3 (H3.3wt) and H3.3S31E recombinant nucleosomes (rNucs). (NSD2 did not show any signal for H3K36me3) (NE, No Enzyme). (B) Representative western blot (above) and quantitative measurements of 3 independent experiments (integrated fluorescence intensity) (below) of SETD2 SET-domain HMT assays on unmodified and H3.3S31ph designer nucleosomes (dNucs). *, p<0.05; Student’s t-test. Error bars in (B) represent the range of three independent experiments. (C) Crystal structure of SETD2-H3.3S31phK36M complex. SETD2 is presented as electrostatic potential surface. Electrostatic potential is expressed as a spectrum ranging from −6 kT/e (red) to +6 kT/e (blue). H3.3 peptide is shown as yellow sticks with S31 phosphate group labeled. (D) Interaction of the H3.3S31ph phosphate group with K1673 and K1600 of SETD2. The salt bridge bonding and water mediated hydrogen bonding are shown as magenta dashed lines. The peptide is shown as yellow sticks covered by the simulated annealing 2Fo–Fc omit map contoured at the 2.0 σ level. The water molecule is shown as a cyan sphere. (E) Western blot analysis for H3K36me3 in HMT assays with SETD2 SET-domain wild type (wt), and K1600E,K1673E double mutant on H3.3wt and H3.3S31E rNucs. As the overall activity of the mutant enzymes is reduced, enzyme concentration was titrated to best visualize the ratio of H3.3wt to H3.3S31E activity.
Structural studies of the SETD2 SET domain have revealed a basic patch along the path of the H3 amino-terminal tail as it extends from the catalytic site33,34. We speculated that the SETD2 basic patch could provide a specific enhanced interaction with H3.3S31ph nucleosomes and link the augmented enzymatic activity we observed to structural properties. Therefore, we solved the crystal structure of the human SETD2 catalytic domain bound to the H3.3 peptide H3.3S31phK36M (K36M stabilizes the H3.3 peptide in the catalytic site) at 1.78Å (Fig. 3c, Supplementary Table 4). In the resulting structure, the H3.3 peptide is embedded in the substrate-binding channel of SETD2. The N-terminal fragment of H3.3 extends from the active site to the exit of the SETD2 substrate channel, which is notably enriched with basic residues. The electron density of the H3.3S31 phosphate group is clearly visible. The phosphate group of H3.3S31ph forms electrostatic and water-mediated hydrogen bonding interactions with K1600 and K1673 of SETD2 (Fig. 3d). The two basic residues provide positive charge to the substrate channel for H3.3S31ph recognition, and thus promote the engagement of H3.3K36 at the active site for methylation. Given the significance of K1600 and K1673 in interactions between H3.3S31ph and SETD2, we evaluated sequence conservation of these lysine residues across phylogeny and among H3K36 methyltransferases. Remarkably, we find that the basic residues K1600 and K1673 are conserved in metazoan SETD2 (across vertebrates and replaced by similar Arg in C. elegans and D. melanogaster and His in S. cerevisiae) (Extended Data Fig. 7b). In contrast, other H3K36 HMTs (NSD family) feature acidic or polar amino acids at these positions (Extended Data Fig. 7c), which may explain NSD2’s reduced activity on H3.3S31E substrates.
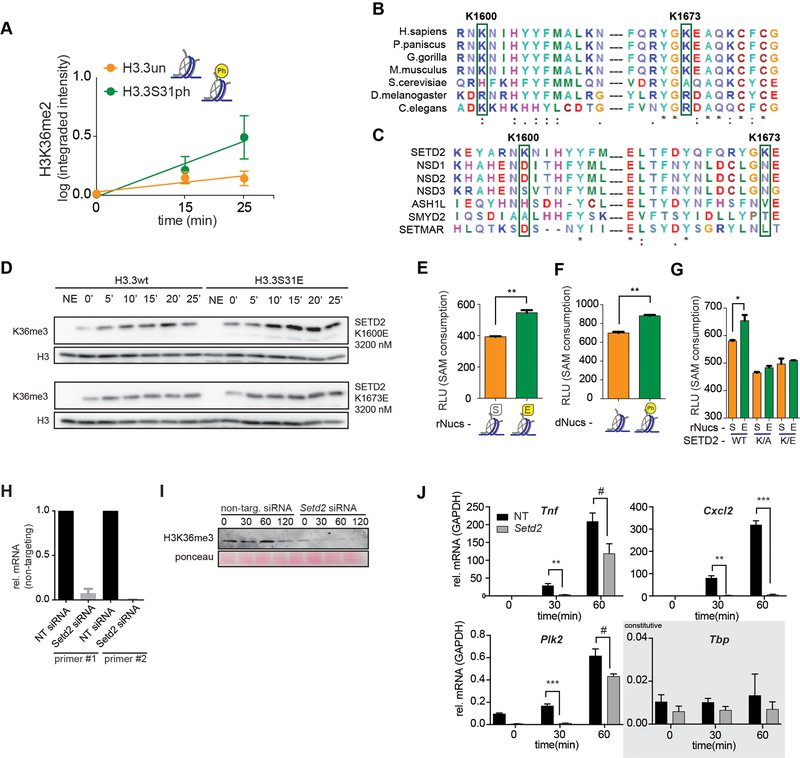
To directly assess the function of the conserved SETD2 lysines that engage H3.3S31ph, we generated SETD2 SET-domain mutants, (K1600E, K1673E, and dual K1600E/K1673E). These were then assessed for activity on unmodified as well as H3.3S31E-containing rNucs and H3.3S31ph dNucs. Again, we observed potent stimulatory activity of H3.3S31E rNucs over unmodified nucleosomes (Fig. 3e), however, H3.3S31E-augmented SETD2 activity was lost in single mutants, K1600E and K1673E (Extended Data Fig. 7d), and reversed in the dual K1600E/K1673E mutant (Fig. 3e). As an antibody-independent, quantitative measure of SETD2 HMTase activity we measured SAH accumulation (correlated with SAM consumption and HMT activity). We find increases in SAH accumulation by SETD2 with H3.3S31E rNuc and H3.3S31ph dNucs compared to unmodified nucleosomes, and this relative increase is lost with SETD2 K1600E/K1673E and the more conservative SETD2 K1600A/K1673A mutations (Extended Data Fig. 7e–g).
Together, our cellular, epigenomic, and structure-function studies suggest H3.3S31ph-augmented SETD2 activity as a feature of enhanced stimulation-induced transcription. Thus, stimulation-induced genes may be endowed with preferential access to (and dependency on) SETD2 for rapid, high-level expression. Consistent with this idea, we find that expression of LPS-induced genes featuring H3.3S31ph is highly dependent on SETD2 (Extended Data Fig. 7h–j). While it is clear that H3.3S31ph stimulates SETD2 in vitro, because H3.3S31ph correlates with a number of simultaneous changes at inflammatory genes in cells, we can only predict that it does so in vivo.
H3.3S31ph ejects ZMYND11 and stimulates transcription
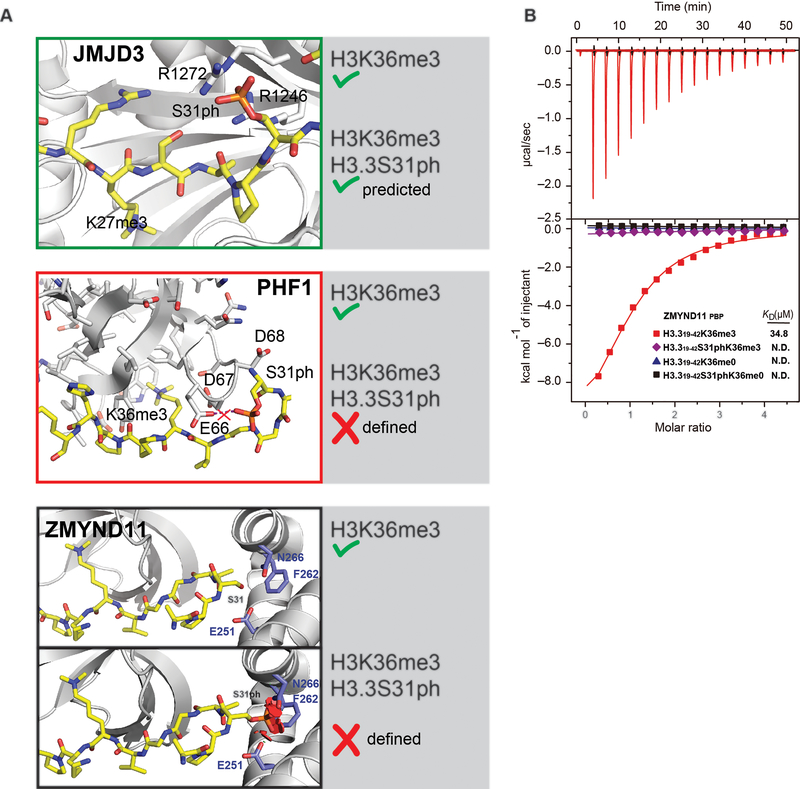
Introduction of a bulky, negative phosphate at S31 in the midst of a regulatory hotspot of the H3.3 tail (Fig. 1a) could have general implications for the binding of factors that operate on this region of the H3 tail, including at H3K27 and H3K36. To explore the paradigm of H3.3S31ph as a “switch” or combinatorial “motif” we performed modeling analyses of three H3 readers that could be impacted by H3.3S31ph (Extended Data Fig. 8a). Some factors may have preferential binding to H3.3S31ph, including H3K27me3 demethylase KDM6B (JMJD3)36–38, while others may be “ejected” from H3.3S31ph, including PHF1, member of the Polycomb group protein family and component of the H3K27me3 methyltransferase complex39,40. While stimulated macrophages feature H3.3S31ph in transcribed gene bodies, it is interesting to consider that in the context of development and cell division21,22, broader chromosomal mitotic phosphorylation of H3.3S3126,27,41 could act to de-repress H3K27me3 chromatin at sites of H3.3 deposition to influence developmental programs.
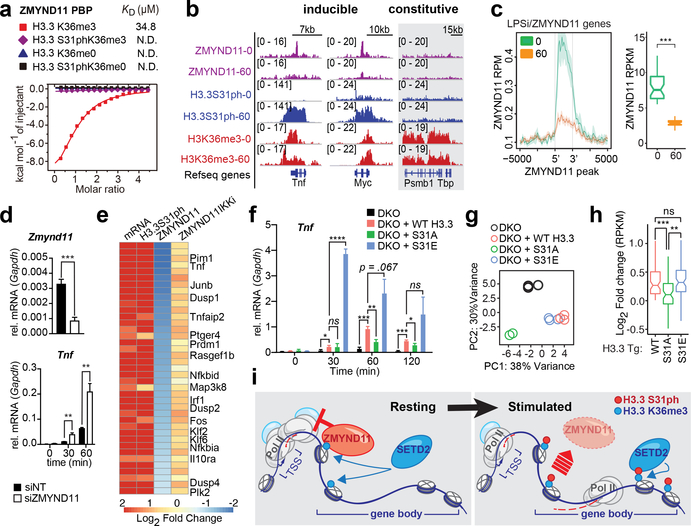
H3.3S31ph could also serve as an “ejection switch” for transcriptional corepressor and tumor suppressor, ZMYND11, which is a K36me3 reader in the context of H3.3 via interactions with the unmodified S31, and localizes to gene bodies8,9. Structural and biochemical studies of ZMYND118,9 and our own modeling (Extended Data Fig. 8a) and isothermal titration calorimetry (ITC) studies (Fig. 4a) reveal potent ejection of ZMYND11 from dually modified H3.3S31phK36me3.
Figure 4: H3.3S31ph ejects transcription repressor ZMYND11 and stimulates transcription.
(A) Isothermal titration calorimetry (ITC) curves of H3.3K36me3, H3.3S31phK36me3, unmodified H3.3 and H3.3S31ph peptides titrated into ZMYND11 PHD-BROMO-PWWP (PBP) domain. (B) ChIPseq tracks of ZMYND11, H3.3S31ph, and H3K36me3 in LPS stimulated BMDM (0 and 60’) for Tnf, Myc, and Tbp. (C) Average gene profiles of ZMYND11 for LPS-induced-ZMYND11-target genes in resting and stimulated BMDM (left) and comparison of ZMYND11 ChIPseq densities before and after LPS stimulation (right). (D) RT-qPCR for Zmynd11 and Tnf after LPS stimulation of BMDM transfected (48 hours before) with siRNA non-target control (NT) and against Zmynd11. (E) Heatmap of LPS-induced-ZMYND11-target genes displaying fold changes between resting and stimulated BMDM for mRNA and ChIPseq densities of H3.3S31ph, ZMYND11 and ZMYND11 after pre-treatment with IKK inhibitors. (F) RT-qPCR for Tnf of H3.3 double knockout (DKO) RAW264.7 cells “rescued” with H3.3 WT, S31A, or S31E transgenes prior to LPS stimulation. (G) Principal component analysis based on expression (RPKM) of all LPS-induced genes. (H) RPKM log2 fold-change of WT, S31A, and S31E compared to DKO for all LPS-induced genes that were “rescued” by WT H3.3 transgene (log2 fold change > 0). (I) Proposed mechanism: During resting conditions the transcriptional repressor ZMYND11 is bound to pre-existing H3.3K36me3 due to constitutive activity of the H3K36me3-specific methyltransferase SETD2. Stimulation-induced H3.3S31ph introduces a steric clash which ejects ZMYND11 and allows for SETD2 to bind, which in turn increases its methyltransferase activity and enables rapid and robust transcription. (G), (H) have three biological replicates per condition. *, p<0.05; **, p<0.005; ***, p<0.0005; ****, p<0.0001; Student’s t-test.
We considered the possibility that ZMYND11 may act to restrain inflammatory gene transcription and that stimulation induced H3.3S31ph could eject ZMYND11 and derepress targeted genes. Importantly, inflammatory genes tend to have pre-existing H3.3K36me3, the ZMYND11 substrate, in the resting state even though they are not effectively transcribed until stimulation. Through comparison of ZMYND11 ChIPseq in resting and stimulated BMDM, we found that ZMYND11 is pre-bound within many stimulation-induced genes, and is ejected coincident with H3.3S31ph (Fig. 4b–c, Extended Data Fig. 9a–d). Consistent with a function of ZMYND11 in restraint of inflammatory gene transcription, siRNA knockdown of ZMYND11 resulted in augmented expression of Tnf, JunB, and Nfkbia (Fig. 4d, Extended Data Fig. 9e). Further, ZMYND11 ejection is dependent on IKK signaling; ZMYND11 is retained at inflammatory genes in cells treated with an IKK inhibitor before LPS stimulation (Fig. 4e, Extended Data Fig. 9f). Both induced genes bound by ZMYND11 and IKKα target genes are highly enriched for H3.3S31ph (Extended Data Fig. 9c). Thus, many stimulation-induced genes share distinguishing chromatin features: (1) active chromatin states and pre-existing H3.3K36me3, (2) pre-bound ZMYND11 corepressor, (3) stimulation induced H3.3S31ph, and (4) ejection of ZMYND11. Beyond ZMYND11 regulation, our initial studies of KDM6B and PHF1 (Extended Data Fig. 8) suggest additional potential regulatory function of H3.3S31ph in macrophages and other cell types featuring H3.3S31ph (Fig. 1d) and highlight examples of (a) reader ejection and (b) combinatorial recognition in the context of dual H3.3S31phK36me3.
Functional perturbations of histones are made difficult by their essential role in diverse cellular functions and multiple gene copies. However, because there are only two genes for the histone H3.3 variant containing the S31 residue (H3f3a and H3f3b) we could target these genes by CRISPR. H3.3 is required for embryogenesis42–45 and spermatogenesis46. Further, H3.3 is enriched at inflammatory genes (Extended Data Figure 3)6,47, though its function in this context is unknown. To study the function of H3.3 in inflammatory gene induction we generated H3f3a/H3f3b double knockout (DKO) RAW264.7 macrophage cell lines through CRISPR targeting of both H3f3a and H3f3b. We also selected a hypomorphic (HYPO) RAW264.7 clone, with a null H3f3a allele and hypomorphic H3f3b allele (Extended Data Fig. 10). RNAseq of resting and stimulated cells from these lines revealed substantial decreases in expression of LPS-induced genes in both DKO and HYPO macrophage cell lines (Extended Data Fig. 10).
To directly define the function of H3.3S31ph in cells, we “rescued” H3.3 DKO macrophage lines with wild type, H3.3S31A (loss of function) and H3.3S31E (gain of function, phosphomimic) transgenes before stimulation with LPS and analysis of stimulation-induced transcripts. Time course RT-qPCR measurement of Tnf and Ccl4 expression revealed (1) reduced induction in DKO cells, (2) rescue of gene expression with wild type H3.3 transgene, (3) reduced induction with H3.3S31A, and (4) potent gain-of-function, elevated expression in cells transduced with H3.3S31E, phosphomimic (Fig. 4f, Extended Data Fig. 10h). To more broadly assess the effects of H3.3S31 mutants we performed RNAseq on DKO and H3.3 transgene transduced macrophage lines stimulated with LPS. Principal component analysis revealed that H3.3 DKO and H3.3S31A cluster independently, while wild type and H3.3S31E cluster together, with high PC1, consistent with a common “rescued” phenotype (Fig. 4g). Overall, LPS-induced gene expression in H3.3 DKO macrophages was increased by wild type H3.3 transduction, reduced by H3.3S31A (similar to H3.3 DKO), and increased by H3.3S31E (Fig. 4h). We suggest that this range of cellular phenotypes in macrophage-like cell lines reflects the function of H3.3 and H3.3S31ph, including the coordinated stimulation of SETD2 activity (Fig. 3) and ejection of corepressor ZMYND11 (Fig. 4).
Dedicated mechanisms enabling rapid stimulation-induced transcription are relevant to diverse cell responses and disease states, and may represent more selective therapeutic targets than the general transcription machinery. Our studies link selectively deposited H3.3S31ph at stimulation-induced genes to augmented SETD2 activity, co-transcriptional H3K36me3, and ejection of corepressor, ZMYND11, enabling rapid and high-level transcription of these genes (Fig. 4i). Together with our previous characterization of H3S28 phosphorylation in early stimulation-induced chromatin activation16, these studies reveal mechanisms for a dedicated role of histone phosphorylation in de novo transcription. We propose that selectively employed chromatin features, including histone phosphorylation, provide a signature that specifies preferential access to the transcription apparatus, endowing cells with the capacity for rapid and diverse environmental responsiveness.
Materials and Methods
Data Availability
Source data for immunoblots are provided in Supplementary Fig. 1. All ChIP and RNA sequencing data described in this manuscript are deposited in the NCBI Gene Expression Omnibus (GEO): GSE125159. There are no restrictions on data availability.
ChIP-seq data processing and analysis
H3S31ph, H3K36me3, H3K36me2, H3K27ac, H3S28ph, H3.3, IKKα and ZMYND11 ChIP-seq analyses were performed in bone marrow derived macrophages (BMDM) with an average range of 20–25 × 106 reads per independent ChIP-seq experiment. ChIP-seq reads were mapped to the mm10 genome using Bowtie2 v.2.3.4.11 with the following parameters: -p 8 –k 1 –N 1. The aligned reads underwent three stages of filtering using SAMtools v.1.52. First, the unmapped, non-primary, qc failed, and multi-mapped reads were discarded. PCR duplicates were then marked by Picard Tools v.2.14.0 (http://broadinstitute.github.io/picard/) using ‘VALIDATION_STRINGENCY=SILENT and REMOVE_DUPLICATES=false” options and removed by SAMtools (-F 1796). Then, chromosome M and scaffolds were removed to create the final filtered bam file. The final bam files were used to generate average profiles for RNA-seq define LPS-stimulated genes at time 60 for H3S31ph signal using ngs.plot v.2.613 at genebody using the following parameters: -FL 200 –MW 2. For visualization in IGV v.2.3.944, the final bam files were converted to a tiled data file (.tdf) using igvtools v.2.3.98 including duplicates. Final bam files were converted to bigWig files of read coverages normalized to 1x depth of coverage as reads per genomic content (RPGC) using deeptools v2.5.45 bamCoverage. To obtain a tab-delimited file of average scores comprised of all bigWig files for each experiment, deeptools multiBigwigSummary performed the analysis for regions defined by a General Transfer Format (GTF) vM3 Annotation BED file. The BED file was constructed using the BEDOPS v.2.4.296 gtf2bed conversion utility and, depending on strand direction, extending the feature at both the start and end position by 2kb (H3S31ph, H3K36me3, H3K36me2, H3.3) or 4kb (H3S28ph, H3K27ac) to account for promoters (+/−2kb) or histone marks found outside of gene body (+/− 4kb). The resulting tab-delimited file of read densities was used for downstream analysis in R v.3.4.0. Top H3S31ph genes were defined by a 2-fold or greater increase in H3S31ph enrichment at time 60 after LPS stimulation with FDR < 0.05. Top genes for all other epigenetic marks, such as H3K27ac, H3K36me3, H3S28ph, were defined in the same manner. The top 1% H3S31ph genes and the genes enriched with S31ph peaks at time 60 were used as target lists for gene ontology analysis by the tools enrichGO of clusterProfiler package [10.18129/B9.bioc.clusterProfiler]. The genomic distribution of S31ph and S28ph peaks were analyzed using annotatePeak of ChIPseeker [10.1093/bioinformatics/btv145]. Gene set analysis using gene lists from Tong et al. and Bhatt et al. are used throughout7,8.
RNA-seq data processing and DESeq2 analysis
Paired-end RNA-seq reads were obtained from biological triplicates at times 0, 60, and 120 after LPS stimulation in BMDM. Single-end RNA-seq reads were also obtained from technical duplicates at times 0, 60, and 120 after LPS stimulation for KO comparisons for WT BMDM, cell line hypomorph 3.205, and cell line knockout 264. Single-end RNA-seq reads were also obtained from biological triplicates at 60’ post LPS stimulation for DKO and each “rescue” condition (WT H3.3, S31A mutant, S31E mutant). Both paired-end and single-end RNA-seq were processed the same. The fastq files underwent adapter trimming and quality control analysis using wrapper Trim Galore v.0.5.0. The resulting trimmed fastq files were aligned to the GENCODE vM3 transcriptome in mm10 using STAR aligner v.2.4.29 with default settings. The utility featureCounts10 from Subread v.1.4.6 was used to calculate raw counts reads per gene to be used as input for differential expression analysis by DESeq211.
Antibodies
a-H3.3S31ph (developed by Pineda Antikörper-Service), a-H3S28ph (clone E191, ab32388 Abcam), H3.3 (09–838, EMD), a- p44/42 MAPK, Erk1/2 (4695 Cell Signaling), a-phospho-p44/42 MAPK (Erk1/2) (4370, Cell Signaling), a-H3 (ab1791 Abcam), a-H3K27ac (39133, Active Motif), a-H3K36me3 (61021, Active Motif), a-H3K36me2 (2901, Cell Signaling), a-IKKα (ChIP: clone B-8, sc-7606X, Santa Cruz; WB: 2682, Cell Signaling).
a-H3.3S31ph Antibody Development
For the generation of an H3.3S31ph-specific polyclonal antibody, a peptide spanning amino acids 26 to 37 from H3.3 containing phosphorylated serine 31 (RKSAPS(ph)TGGYKK, note the exchange of V35Y due to enhanced immunicity) was used for immunization of three rabbits by the Pineda-Antikörper-Service company (Berlin, Germany). Last bleed from animal 1 was affinity purified and used in this study. Antibody specificity was tested in immunoblots and 2D-Triton Acid Urea (2D-TAU) gels with acid-extracted histones as described previously12. Peptide competition experiments were done as described previously13 using peptides that were N-terminally biotinylated and synthesized with higher than 80% purity by GenScript USA Inc. All peptides contained the general H3.3 sequence (aa 20–39; BIO-LATKAARKSAPSTGGVKKPH) with respective phosphorylations on serines 10, 28 and/or 31. For Immunofluorescence microscopy HeLa Kyoto cells were grown on coverslips, washed, fixed, permeabilized and stained as descibed previously14. Chromosome spreads were generated as described15. Wide-field fluorescence imaging was performed on a PersonalDV microscope system (Applied Precision) equipped with a 60x/1.42 PlanApo oil objective (Olympus), CoolSNAP ES2 interline CCD camera (Photometrics); Xenon illumination and appropriate filtersets. Iterative 3D deconvolution of image z-stacks was performed with the SoftWoRx 3.7 imaging software package (Applied Precision).
Chromatin Immunoprecipitation
As previously described in Josefowicz et al., 201616.
Primary Cell Culture and treatments
BMDM, derived from 6–12 week old male C57BL/6J mice, were cultured and stimulated as previously described in Josefowicz et al., 201616. Primary cultured cortical neurons: E16.5 cortical neurons dissected and then dissociated in OptiMEM + Glutamax (Gibco 35050–061). They were then cultured in Neurobasal medium (21103–049) with B27, GlutaMAX, and PenStrep for 12 DIV, with addition of AraC (0.5uM) at 3 DIV. Neurons were stimulated with BDNF (50ng/mL, PeproTech 450–02) for 0, 30, and 60 minutes at 12 DIV. Stimulated neurons were then lysed in RIPA buffer (10% sucrose, 1% SDS, 5mM HEPES pH 7.9, 10mM sodium butyrate), supplemented by protease inhibitor (Roche 04693124001), phosphatase inhibitor (Roche 04906837001), 1mM DTT, 1mM PMSF. HeLa Kyoto cells were grown as described13. Cells were pre-treated with panIKK inhibitors IKK-16 (1.5 μM, S2882, Selleckchem) and ACHP (10 μM 4547, Tocris) 2 hours before LPS stimulation. Primary NK cells and naïve B cells were isolated from total splenocytes using magnetic bead-based isolation.
Cell Culture, siRNA transfection
For siRNA transfection RAW cells were reverse transfected with Lipofectamine RNAiMAX (Life Technologies) and ON-TARGETplus SMARTpool siRNAs against mouse SETD2 and ZMYND11. After 48–72h, cells were either harvested for gene expression or western blot analysis.
Generation of H3.3 mutant RAW264.7 cell lines
CRISPR targeting of H3f3b and H3f3a was performed in RAW cells using methods described previously17. Targeting was done consecutively first targeting H3f3b, then using H3f3b mutants to target H3f3a. The gRNAs (Primers caccTAGAAATACCTGTAACGATG forward aaacCATCGTTACAGGTATTTCTA reverse for H3f3a and caccGAAAGCCCCCCGCAAACAGC forward aaacGCTGTTTGCGGGGGGCTTTC reverse for H3f3b) were cloned into PX458 (Addgene) and sorted for GFP 24h after transfection, cells were first sorted as bulk and after recovery sorted into single cell clones. Positive clones were tested by PCR, sequencing and Western Blot. H3.3 DKO and HYPO were sequence validated by MGH CRISPR Core Facility (for sequence information see supplemental sequence files).
Cell Culture, lentiviral transduction
Lentivirus was generated via transfection of HEK 293T cells with 3rd generation lentiviral vector (containing a H3.3 transgene and fluorescent protein tag), packaging vectors (psPAX2 and pMD2G), and the Calcium Phosphate Transfection Kit (Invitrogen). H3.3 DKO RAW264.7 cells were then transduced with lentivirus and 4 μg/mL Polybrene Infection/Transfection Reagent (Millipore) via centrifugation at 1,000xg for 90 minutes. After culturing for 3–4 days, pure populations of transduced cells were isolated via FACS sorting based on fluorescent protein expression and then stimulated with 100ng/mL LPS. For shRNA transduction, we used lentiviral vector pLVX-shRNA2 with IKKa sequences: sh#1: GCCAGATACTTTCTTTACTGA; sh#2: GGAATAAATACAGGTTCTCAG
RNA extraction, quantitative real-time PCR and RNA sequencing
RNA was isolated using RNAeasy Kit (Qiagen). For RT-PCR extracted RNA was treated with DNAse and cDNA was synthesized using High-Capacity cDNA Reverse Transcription Kit (Applied Biosystems). qPCR was performed using SYBR green dye (Applied Biosystems) and normalized to GAPDH. For RNA sequencing libraries were prepared using according to the Illumina TruSeq protocol and were sequenced on Illumina HiSeq 2500 / NextSeq 500.
Antibody-based methods
(flow cytometry and western blotting) As previously described in Josefowicz et al., 201616.
Mass Spectrometry Analysis of Histone Post-Translational Modifications
As previously described in Josefowicz et al., 201616.
Bacterial recombinant protein
Human SETD21347–1711 (original plasmid was a generous gift of Danny Reinberg) and point mutants were cloned into pETduet–smt318. The SETD2 wt and mutant fragments were expressed with an N-terminal His-tag in Rosetta (DE3, pLysS) cells with LB Media for 18 h at 17°C by induction with 0.5 mM Isopropyl β-D-1-thiogalactopyranoside (IPTG). E. coli cells were resuspended in50 mM Tris pH 8.0, 500 mM NaCl, 1 mM PMSF, 2 mM BME, 10% glycerol, 10 mM imidazole supplemented with ROCHE COMPLETE protease inhibitors. After lysis with tip sonicator and centrifugation the cleared lysate was incubated for 1h with Ni-NTA resin slurry (Clonetech). After washing beads with the same buffer, the protein was eluted. The samples were incubated with Ubiquitin-like protease (Ulp) overnight at 4°C and subsequently incubated again with Ni-NTA resin to remove protease and cleaved tag. Supernatant was further purified by size-exclusion chromatography (Superdex 75, GE Healthcare).
HMT assay
Standard HMT assays were performed in a total volume of 20 μL containing HMT buffer (50 mM Tris-HCl, pH 8.5, 50mM NaCl, 5 mM MgCl2, and 1 mM DTT) with 100 uM S-Adenosylmethionine (NEB) and 1.2ug of nucleosomes. The enzymes used were 30nM NSD2 full-length (Reaction Biology Corp), 800 nM SETD2-SET wt, and 3200 nM of SETD2K1600E, SETD2K1673E, SETD2K1600EK1673E. The reaction mixtures were incubated for 0,5,10,15,20 and 25 min at 30°C and stopped by adding 20ul of Laemmli Buffer. The results were analyzed by Western Blot. Bioluminescence based HMT assays were also done with MTase-Glo (Promega) and recombinant nucleosomes (rNucs, see Nucleosome reconstitution methods section above) or designer nucleosomes (H3.3S31ph dNucs, Epicypher, SKU: 16–0389).
Nucleosome reconstitution
All histones were expressed and purified as previously described19. Nucleosome Assembly Octamers were reconstituted as described19. The 601 nucleosome positioning sequence was used for nucleosome reconstitution20. The DNA was amplified by PCR using HPLC purified primers containing a biotin tag on the 5’ end to produce 189 bp linear DNA and purified using QIAEXII kit (Qiagen). Nucleosomes were assembled using the standard step-wise dialysis method21. Bacterial recombinant protein: Human SETD21347–1711 (original plasmid was a generous gift from Danny Reinberg) and point mutants were cloned into pETduet–smt318. The SETD2 wt and mutant fragments were expressed with an N-terminal His-tag in Rosetta (DE3, pLysS) cells with LB Media for 18 h at 17°C by induction with 0.5 mM Isopropyl β-D-1-thiogalactopyranoside (IPTG). E. coli cells were resuspended in50mM Tris pH 8.0, 500 mM NaCl, 1 mM PMSF, 2 mM BME, 10% glycerol, 10 mM imidazole supplemented with ROCHE COMPLETE protease inhibitors. After lysis with tip sonicator and centrifugation the cleared lysate was incubated for 1h with Ni-NTA resin slurry (Clonetech). After washing beads with the same buffer, the protein was eluted. The samples were incubated with Ubiquitin-like protease (Ulp) overnight at 4°C and subsequently incubated again with Ni-NTA resin to remove protease and cleaved tag. Supernatant was further purified by size-exclusion chromatography (Superdex 75, GE Healthcare).
Crystallography study of SETD2-H3.3S31phK36M complex
Human SETD2 catalytic domain (residues 1434–1711) was expressed in E. coli and purified as previously described22. Crystallization was performed via vapor diffusion method under 277K by mixing equal volumes (0.5ul) of SETD2-H3.329–42S31phK36M-SAM (1:5:10 molar ratio, 8mg/ml) and reservoir solution containing 0.2M potassium thiocyanate, 0.1M Bis-Tris propane, pH 8.5, and 20% PEG 3350. The crystals were briefly soaked in a cryo- protectant drop composed of the reservoir solution supplemented with 20% glycerol and then flash frozen in liquid nitrogen for data collection. Diffraction data were collected at Shanghai Synchrotron Radiation Facility beamline BL17U under cryo conditions and processed with the HKL2000 software packages. The structures were solved by molecular replacement using the MolRep program23, with the SETD2-H3.3K36M complex structure (PDB code: 5JJY) as the search model. All structures were refined using PHENIX24 with iterative manual model building with COOT25. Detailed structural refinement statistics are in Supplementary Table 4. Structural figures were created using the PYMOL (http://www.pymol.org/) or Chimera (http://www.cgl.ucsf.edu/chimera) programs.
Histone peptide microarray fabrication, antibody hybridization, and analysis
Structural modeling (Extended Data Fig. 8)
Structural modeling and discussion of PHF1, KDM6B (JMJD3), and ZMYND11 structures were performed using PYMOL (above) and based on references29–37.
Statement of replicates
Mention of repeated or replicated experiments refers to independently performed experiments (separate mice/pools of mouse bone marrow cells), independent formulation of siRNA, LPS, or other reagents. In the case of RT-qPCR analysis, error bars indicate variance of technical replicates (separately plated and treated cells from the same bulk BMDM preps), representative of replicated experiments. All experiments were repeated 2 or more times. Enzymatic reactions involving methyltransferases in Fig 4 were repeated 3 or more times on separate occasions, with independently assembled nucleosomes, enzymes, and reagents.
Ethics oversight for animal work
The Weill Cornell Medicine Committee on Animal Research has approved our experimental procedures. Our IACUC protocol is # 2017–0031 with current approval as of 9/19/2019.
Extended Data
Extended Data Figure 1: Determination of anti-H3.3S31ph antibody specificity.
(A) Alignment showing H3.1, H3.2 and H3.3 and the differing amino acids in core and tail. (B) Quantitative mass spectrometry analysis of phosphorylated H3.3 at Ser 31 (H3.3S31ph), left, and total H3.3 protein, right, in resting (0’) and bacterial lipopolysaccharide (LPS)-stimulated (60’) mouse bone marrow derived macrophages (BMDM). (C) Immunoblot with acid-extracted histones from asynchronous growing “A” or nocodazole-arrested mitotic “M” HeLa cells using bleeds from three rabbits immunized with H3.3S31ph peptides. Bleeds from animals 1 and 2 show a signal of the molecular weight of histone H3 only with mitotic samples. (D) Peptide competition experiment to determine antibody-specificity. Asynchronous “A” or mitotic “M” histones were separated by SDS-PAGE gels and blotted onto PVDF membranes. H3.3S31ph antibody from animal 1 was pre-incubated with diverse peptides or without any peptide, as indicated, before adding it to the PVDF membrane. Staining with anti-H3 antibody shows equal loading. (E) Immunoblot with acid-extracted histones from asynchronous “A” or mitotic “M” histones separated by 2D triton-acid urea (TAU) gels (left) that allow a separation of histone variants due to charge and amino acid differences. The bleed from animal 1 shows a signal of the size of H3.3. Coomassie blue staining of the gel and staining of the membrane with anti-H3 served as loading control (right). (F) Deconvolved immunofluorescence microscopy images of asynchronously growing HeLa cells co-stained with DAPI (DNA, blue), anti-H3.3S31ph (animal 1, green) and anti-H3S10ph (marker of mitotic cells, red). Merged picture is shown on the right. Note that only mitotic cells, as apparent from stronger DAPI-staining and apparent H3S10ph signal, are H3.3S31ph positive. (G) Deconvolved image of chromosome spread from mitotic HeLa cells co-stained with DAPI (blue) and anti-H3.3S31ph (animal 1, green). Notice the stronger staining of H3.3S31ph at peri-centromeric regions, as has been shown previously. (H) Cell cycle analysis of BMDM by FACS using DAPI and H3S10ph, with mitotic index gate shown, indicating post-mitotic nature of BMDM.
Extended Data Figure 2: Histone peptide array-based specificity profiles for antibodies against H3.3S31ph, H3K36me2, and H3K36me3.
Scatter plots showing signal intensities obtained from each of the indicated antibodies on two separate peptide-arrays. Shown in certain graphs is the relative abundance of the indicated unmodified or modified histone species compared to any species of H3.3S31ph detected by quantitative mass spectrometry in bacterial lipopolysaccharide (LPS)-stimulated (60’) mouse bone marrow derived macrophages (BMDM). Both antibodies recognizing H3K36me and the H3.3S31ph antibody highlighted in green were used here.
Extended Data Figure 3: H3.3S31ph is deposited in the gene-body of response genes but not constitutively expressed genes.
Additional examples of H3 PTMs including H3.3S31ph (as in Fig. 2) at (A) LPS-induced genes Bcl2a1b, Ccl4, Cxcl2, Dusp1, Myc; (B) constitutively expressed (“housekeeping”) genes Gapdh, Rps2, Tbp, Tubb5, Tubb6; (C) across the gene dense chromosome 11 chemokine locus (>1Mb) containing LPS-induced genes Slfn2, Ccl9, Ccl6, Ccl3, Ccl4.
Extended Data Figure 4: H3.3S31ph requires transcription elongation.
(A) Comparative pie charts showing percentage of ChIPseq reads for H3.3S31ph (top) and H3S28ph (bottom) in the indicated genomic regions. We called H3.3S31ph peaks and find that they associated with only 961 genes with 83.72% of peaks falling within gene bodies. By comparison, the majority of H3S28ph peaks fall in promoters and intergenic regions. Given the selective gene body localization of H3.3S31ph, we ranked all annotated genes in the genome by H3.3S31ph ChIP signal density (TSS-TES) in resting and stimulated macrophages. This analysis shows that many more genes acquire high-density H3.3S31ph upon stimulation compared with resting cells (Fig. 1e), which is consistent with our MS and other global analysis of H3.3S31ph levels. Additionally, several of the top ranked genes (note, by density, not fold change) are prominent LPS-induced genes, including Tnfaip3 (A20), Tnf, Il1a, and Plk2 (Fig. 1e), all among the top ranked peaks (Supplementary Table 2). (B) We defined a threshold for the top 1% of genes (genome wide) by H3.3S31ph TSS-TES density in stimulated macrophages (167 genes) and find considerable overlap with genes annotated to H3.3S31ph peaks (961 genes). (C) Comparison of gene ontology (GO) analysis for “top 1%” genes and “peak” genes reveals extensive similarities of these two independent analyses with 3 of the top 5 GO categories shared and reflecting the stimulation-induced nature of genes featuring H3.3S31ph: “response to stress”, “immune system process”, “cellular response to chemical stimulus” (Supplementary Table 3). (D) We compared the H3.3S31ph chromatin state to other “active” chromatin states including H3K27ac, H3K36me3, and H3S28ph as they relate to stimulation-induced gene expression. Our analysis reveals that genes with H3.3S31ph are highly enriched for stimulation-induced genes by RNAseq, especially primary response genes, NF-κB targets, and MAPK-dependent genes (Fig. 1I, Extended Data Fig. 4–6) (from Tong et al. Cell 2016; Bhatt et al. Cell 2012). (E) H3.3S31ph ChIPseq read densities of (left) LPS-induced genes and (right) top 1% H3.3S31ph target genes in LPS-stimulated BMDM (60’) after pre-treatment with FVP, CPT and ETO compared to DMSO treatment. For comparison with Fig. 2b. (F) ChIPseq average profiles of H3.3S31ph in LPS-stimulated BMDM after pre-treatment with either DMSO, FVP, CPT, or ETO. (G) Box plots showing H3.3S31ph ChIPseq read densities in LPS-stimulated BMDM (60’) after pre-treatment with DMSO (left) and FVP (right). Comparisons are made between NF-κB target genes and LPS-induced genes, top 1% of H3.3S31ph targets, primary (PRG) and secondary (SRG) response genes, MAPK and IRF3 dependent genes and different sub-groups of PRG (Classes A-D) and of SRG (Classes E-F) (from Bhatt et al. Cell 2012). (H) ChIP-Seq tracks of H3.3S31ph in LPS-stimulated macrophages (60’) after pretreatment with FVP, CPT, and ETO. To complement Fig. 2a.
Extended Data Figure 5: IKKα activity drives H3.3S31ph and is enriched at NF-κB target genes.
(A) H3.3S31ph ChIPseq read density fold change (0 to 60) for different gene sets (from Bhatt et al. Cell 2012). (B) H3.3S31ph ChIPseq read density fold change (0 to 60) for genes sets defined by transcription kinetics (A, fastest/transient; F, slowest). Enrichment statistics for NF-κB associated motifs for CpG rich (CpG) and CpG low (LCG) genes from each category are shown above. (C) Average gene H3.3S31ph ChIPseq profiles of LPS-stimulated BMDM (60’) in the indicated gene categories (from Bhatt et al. Cell 2012). (D) RT-qPCR tracks for Chk1, Tnf, Cxcl2, and Western blot for H3.3S31ph in LPS stimulated mouse BMDM following transduction with shRNA scrambled control (shScramble) and three shRNAs targeting Chk1. (E) ChIPseq tracks of H3.3S31ph in LPS stimulated mouse BMDM following pre-treatment with DMSO and 5mM Chk1 inhibitor. (F) RT-qPCR tracks for Chk1, Tnf, Cxcl2, and Western blot for H3.3S31ph (top right) in LPS stimulated mouse BMDM following transfection with siRNA non-target control (siNT) and against Chk1 (siCHK1). (G) Western blot analysis of H3.3S31ph in resting and LPS-stimulated BMDM transduced with shRNA scrambled control (shSCR) and shRNA targeting IKKα (H) RT-qPCR for Tnf and Cxcl1 in resting and LPS-stimulated macrophages after pre-treatment with DMSO and the IKK inhibitors IKK-16 (1.5 μM) and ACHP (10 μM). (I) ChIPseq tracks of IKKα and H3.3S31ph in resting and LPS-stimulated BMDM for Tnfaip3, Ccl4, Cxcl2 and Il1a. H3.3S31ph ChIPs were obtained after BMDM pre-treatments with DMSO and the IKK inhibitor IKK-16 (1.5 μM) and after transduction with shRNA scrambled control (shSC) and shRNA against IKKα. *, p<0.05; **, p<0.005; ***, p<0.0005; ****, p<0.0001, Student’s t-test.
Extended Data Figure 6: H3.3S31ph and other H3 PTMs at response genes and after stimulation.
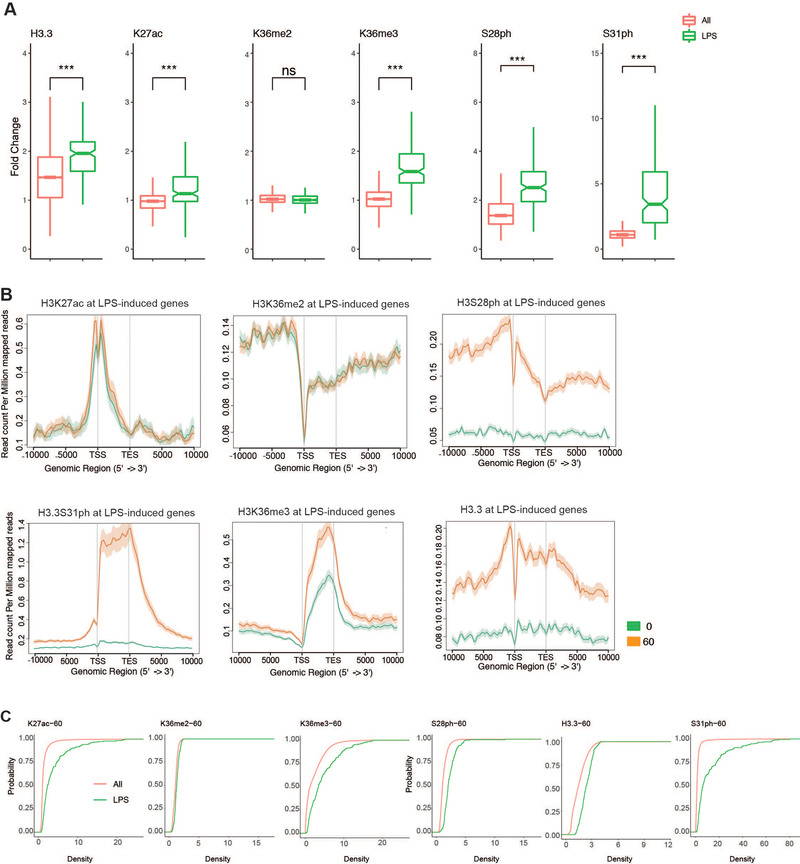
(A) Additional examples (H3K27ac and H3S28ph) of ChIP-seq density fold change comparing the set of all genes (All) to RNAseq defined LPS-stimulated genes to RNAseq defined LPS-stimulated genes (LPS) as shown in Figure 3B for (H3.3, K36me2, K36me3, S31ph) (B) Average gene profiles (in addition to H3.3S31ph and H3K36me3 in Figure 3, shown here are H3K27ac H3K36me2, H3S28ph and H3.3) comparing RNAseq defined LPS-induced genes before and after stimulation. (C) Cumulative distribution function (CDF) plots for H3K27ac H3K36me2, H3K36me3, H3S28ph, H3.3 and H3.3S31ph reveal selective role of H3.3S31ph compared with ubiquitous role of H3K36me3. ***<0.0001 by Student’s t-test.
Extended Data Figure 7. The H3K36me3 methyltransferase SETD2 is stimulated by H3.3S31ph.
(A) ChIP-seq density fold change comparing the set of all genes (All) to RNAseq defined LPS-stimulated genes (LPS) for H3.3S31ph (p=1.22e-96), H3.3 (p=1.63e-25), H3K36me2, and H3K36me3 (p=1.22e-85) by non-parametric Wilcoxon signed-rank test. All genes nall=16648; LPS genes nLPS=206. (B) Average gene profiles of H3.3S31ph (above) and H3K36me3 (below) comparing RNAseq defined LPS-induced genes before and after stimulation. (C) Quantitative measurements of 3 independent experiments (integrated fluorescence intensity) of SETD2 SET-domain HMT assays on unmodified and H3.3S31ph semi-synthetic designer nucleosomes (dNucs). Error bars in (C) represent the range of three independent experiments.) (D) Top, sequence alignment of SETD2 in different species, highlighting the conserved (except in S. cerevisiae) residues K1600 and K1673. (E) Bottom, sequence alignment of different H3K36 methyltransferases highlighting the specificity of residues K1600 and K1673 for SETD2. (F) Western blot analysis for H3K36me3 in HMT assays with SETD2 SET-domain K1600E, and K1673E mutants on H3.3wt and H3.3S31E rNucs. With reduced mutant enzyme activity, enzyme concentration was increased to best visualize the ratio of H3.3wt to H3.3S31E activity. (G-I) HMT activity assays (SAH accumulation) performed with wt (G/H) and K1600EK1673E double mutant (I) SETD2 SET-domain on H3.3wt and H3.3S31E recombinant nucleosomes (rNucs).. (G) SETD2 SET-domain HMT assays using designer nucleosomes (dNucs) containing unmodified H3.3 or H3.3 phosphorylated at S31. (J) Validation of siRNA knockdown for Setd2 using two RT-PCR primers, and (K) Western blot for H3K36me3 as a surrogate of Setd2 activity. *, p<0.05; **, p<0.01; ***, p<0.001; #, p=0.07, 0.06, for Tnf, Plk2, respectively, Student’s t-test. (L) RT-qPCR for the LPS-induced genes Tnf, Cxcl2, Plk2, and Tbp (constitutively expressed control) at 0, 30, 60’ after LPS stimulation of BMDM transfected (48h before) with siRNAs against SETD2 or non-targeting controls (NT).
Extended Data Figure 8: Broad potential for H3.3S31ph to regulate histone reader activity.
(A) Modeling based predictions (KDM6B, from Jones et al. Biochemistry 2018) and modeled visualizations of established interaction features (PHF1, from Andrews et al. ACS Chemical Biology 2016; ZMYND11, from Wen et al. Nature 2014) of reader interactions dually modified H3.3S31phK36me3. Structure of ZMYND11 PWWP domain bound to H3.3K36me3 peptide and modeling of ZMYND11 PWWP domain with the H3.3S31ph peptide, adapted from Wen et al. Nature 2014. S31ph diameter is beyond PWWP pocket capacity and the steric clashes between H3.3S31ph and PWWP are shown as red plates. H3.3 peptide (yellow sticks), ZMYND11-PWWP (light grey), and residues of PWWP having steric clashes with H3.3S31 are shown as blue sticks (E251, F262 and N266). Another example of accommodation of H3.3S31ph may be jumonji family demethylase 3 (JMJD3, KDM6B), an H3K27me3 demethylase. Repressive H3K27me3 is abundant on H3.3 (Jung et al. Mol. Cell. Proteomics 2010) and has been shown to play a role in inflammatory gene expression (De Santa et al. EMBO J. 2009; Kruidenier et al. Nature 2012), albeit at later kinetics than studied here. Modeling H3.3S31ph with an existing structure for JMJD3 (Jones et al. Biochemistry 2018) reveals favorable interactions within an arginine rich pocket of JMJD3 (R1246 and R1272) surrounding the location of H3.3S31ph (much like SETD2). In contrast to these predictions of augmented recruitment, we considered that the location of H3.3S31ph might act to eject “readers” of proximal H3K36me3, extending the concept of the histone “methyl/phos switch” (Fischle et al. Nature 2003) into the gene body and co-transcriptional regulation of chromatin. In this context, it has been shown that H3.3S31ph reduces the binding affinity of PHD finger protein 1 (PHF1) Tudor domain for H3K36me3 by 7-fold (Andrews et al. ACS Chemical Biology 2016). Modeling H3.3S31phK36me3 with PHF1 Tudor reveals surrounding PHF1 acidic residues (E66, D67, D68) and 2.5 angstrom proximity (E66). Given its important role in polycomb repressive complex 2 (PRC2) activity (Sarma et al Mol. Cell. Biol. 2008; Cao et al Mol. Cell. Biol. 2008), PHF1 “ejection” from H3K36me3 by H3.3S31ph could have implications for transitions between H3K36me3 and H3K27me3 chromatin. (B) Complete ITC data representation including μcal/sec and time (matching Fig. 4b).
Extended Data Figure 9: ZMYND11 regulation of LPS-induced genes.
(A) Slope-graph and (B) rank-plot depicting differences in ZMYND11 ChIP densities between resting and 60’ LPS-stimulated BMDM. (C) Cumulative distribution of read density of different sets of genes in S31ph ChIP data. S31 top 1% genes overall have more density so it is shifted to right compared to all genes. Genes extracted from top peaks of IKK, Zmynd11, and S31ph ChIP tends to have more enriched read density distribution over when we look at entire genes. Gene numbers are as follows: 44 IKK genes,176 Top1% genes, 851 S31ph peak genes. (D) ChIPseq read density tracks of ZMYND11, H3.3S31ph, and H3K36me3 in LPS stimulated BMDM (0 and 60’) for Btg2, JunB, Marcks, Zfp36, (LPS-induced genes) and Tubb6 (constitutively expressed gene). (E) RT-qPCR for Zmynd11, JunB, and Nfkbia after LPS stimulation of BMDM transfected (48 hours before) with siRNA non-target control (NT) and siRNA against Zmynd11. And western blot analysis of ZMYND11 transduced with shRNA scrambled control, and shRNA targeting ZMYND11. (F) Boxplots depicting differences in ZMYND11 ChIP densities between resting and 60’ LPS-stimulated BMDM **, p<0.005; ***, p<0.0005; ****, p<0.0001, Student’s t-test.
Extended Data Figure 10: Characterization of H3.3 mutant RAW264.7 cell lines.
(A) Western Blot for H3.3 comparing wild-type (WT), vector control (VC), hypomorph (HYPO), and double-knockout (DKO) RAW264.7 cell lines, membrane was stained with direct blue (DB) for equal loading. (B, C) RNAseq scatter (“volcano”)-plot analysis, log2 fold-change and -log10(FDR), of DKO compared to WT (B), and HYPO compared to WT (C) RAW264.7 at 120’. (D) Ratio of RNAseq fold change (log2) for HYPO or DKO compared with WT at 60’ and 120’ LPS stimulation for all LPS-induced genes (top) and for the intersection of top H3.3S31ph genes and LPS-induced genes (bottom). ***<0.0001 by lower-tailed one-sample t-test (distribution below zero). (E) Heat map of fold change (log2) for top H3.3S31ph genes among LPS-induced genes (left, 60’; right, 120’) with control constitutively expressed genes below. RNAseq was performed with two biological replicates per condition. (G) Time course plots of mean RNAseq expression (RPKM) from two experiments at time points 0’, 60’, and 120’ after LPS-stimulation for experiments performed in wild-type (WT), hypomorph (HYPO), and double-knockout (DKO) RAW247.6 cell lines at LPS-induced genes Myc, Ccl9, Slfn2, Tnfaip3, Ccl4, Plk2, and constitutively expressed genes Tubb5 and Tbp. (F) Time course plots of mean RNAseq expression (RPKM) from two experiments at time points 0’, 60’, and 120’ after LPS-stimulation for experiments performed in wild-type (WT), hypomorph (HYPO), and double-knockout (DKO) RAW264.7cell lines at LPS-induced genes and at top H3.3S31ph genes among LPS-induced genes. (H) RT-qPCR for the viral expression of H3.3 transgene, either WT, S31A, or S31E in RAW macrophages. (I) RT-qPCR for CCL4 expression in a time course of stimulated DKO RAW264.7 cells rescued with WT H3.3, S31A, or S31E.
Supplementary Material
Acknowledgements
This work was supported by the following funding sources: R00GM113019 (S.Z.J), R01AI148416 (S.Z.J.), AAI Intersect Award (S.Z.J.), R01GM040922 (C.D.A), R01GM115882 (K-J.A.), R01AI118891 (B.A.G.), R01CA196539 (B.A.G.), CIPSM (S.B.H), TRR81/Project A15 (S.B.H), R35GM124736 (S.B.R.), NIH training grant 5T32AI134632 (A.W.D), Lymphoma Research Foundation fellowship (A.M.P.), National Natural Science Foundation of China (91753203 and 31725014) and the National Key R&D Program of China (2016YFA0500700) (H.L.). We thank the staff members at beamline BL17U of the Shanghai Synchrotron Radiation Facility and the China National Center for Protein Sciences Beijing for providing facility support; John Zinder for contributing the SETD2-pETduet-smt3 construct; Congcong Lu, Simone Sidoli (lab of B.A.G.) for H3.3 peptide analysis; members of Weill Cornell Applied Bioinformatics Core, Doron Betel, Paul Zumbo, Friederike Dundar, and Luce Skrabanek for suggestions and assistance with bioinformatics; Alexey Soshnev for help with figures; Joseph Sun, Nick Adams, and Endi Santosa for assistance with isolation of primary NK cells and Juan Cubillos-Ruiz and Chang-Suk Chae for BMDCs. We thank Rachel Niec, Barry Sleckman, Jessica Tyler, John Blenis, Shahin Rafii, John Lis, Steven Smale, Genevieve Almouzni for helpful discussions and input and Michael Keogh (Epicypher) for developing the H3.3S31ph dNuc reagent.
Footnotes
The authors declare no competing interests.
References
- 1.Medzhitov R & Horng T Transcriptional control of the inflammatory response. Nat. Rev. Immunol 9, 692–703 (2009). [DOI] [PubMed] [Google Scholar]
- 2.Smale ST, Tarakhovsky A & Natoli G Chromatin Contributions to the Regulation of Innate Immunity. Annu. Rev. Immunol 32, 489–511 (2014). [DOI] [PubMed] [Google Scholar]
- 3.Akira S, Uematsu S & Takeuchi O Pathogen Recognition and Innate Immunity. Cell 124, 783–801 (2006). [DOI] [PubMed] [Google Scholar]
- 4.Filipescu D, Szenker E & Almouzni G Developmental roles of histone H3 variants and their chaperones. Trends Genet. 29, 630–640 (2013). [DOI] [PubMed] [Google Scholar]
- 5.Henikoff S & Smith MM Histone variants and epigenetics. Cold Spring Harb. Perspect. Biol (2015). doi: 10.1101/cshperspect.a019364 [DOI] [PMC free article] [PubMed] [Google Scholar]
- 6.Kamada R et al. Interferon stimulation creates chromatin marks and establishes transcriptional memory. Proc. Natl. Acad. Sci. U. S. A 115, E9162–E9171 (2018). [DOI] [PMC free article] [PubMed] [Google Scholar]
- 7.Shi L, Wen H & Shi X The Histone Variant H3.3 in Transcriptional Regulation and Human Disease. J. Mol. Biol 429, 1934–1945 (2017). [DOI] [PMC free article] [PubMed] [Google Scholar]
- 8.Wen H et al. ZMYND11 links histone H3.3K36me3 to transcription elongation and tumour suppression. Nature 508, 263–268 (2014). [DOI] [PMC free article] [PubMed] [Google Scholar]
- 9.Guo R et al. BS69/ZMYND11 Reads and Connects Histone H3.3 Lysine 36 Trimethylation-Decorated Chromatin to Regulated Pre-mRNA Processing. Mol. Cell 56, 298–310 (2014). [DOI] [PMC free article] [PubMed] [Google Scholar]
- 10.Duarte FM et al. Transcription factors GAF and HSF act at distinct regulatory steps to modulate stress-induced gene activation. Genes Dev. 30, 1731–46 (2016). [DOI] [PMC free article] [PubMed] [Google Scholar]
- 11.Healy S, Khan P, He S & Davie JR Histone H3 phosphorylation, immediate-early gene expression, and the nucleosomal response: a historical perspective 1. doi: 10.1139/O11-092 [DOI] [PubMed] [Google Scholar]
- 12.Rossetto D, Avvakumov N & Côté J Histone phosphorylation: A chromatin modification involved in diverse nuclear events. Epigenetics 7, 1098–1108 (2012). [DOI] [PMC free article] [PubMed] [Google Scholar]
- 13.Sawicka A et al. H3S28 phosphorylation is a hallmark of the transcriptional response to cellular stress. Genome Res. 24, 1808–1820 (2014). [DOI] [PMC free article] [PubMed] [Google Scholar]
- 14.Zippo A et al. Histone Crosstalk between H3S10ph and H4K16ac Generates a Histone Code that Mediates Transcription Elongation. Cell 138, 1122–1136 (2009). [DOI] [PubMed] [Google Scholar]
- 15.Lau PNI & Cheung P Histone code pathway involving H3 S28 phosphorylation and K27 acetylation activates transcription and antagonizes polycomb silencing. Proc. Natl. Acad. Sci (2011). doi: 10.1073/pnas.1012798108 [DOI] [PMC free article] [PubMed] [Google Scholar]
- 16.Josefowicz SZ et al. Chromatin Kinases Act on Transcription Factors and Histone Tails in Regulation of Inducible Transcription. Mol. Cell 64, 347–361 (2016). [DOI] [PMC free article] [PubMed] [Google Scholar]
- 17.Waterborg JH Evolution of histone H3: emergence of variants and conservation of post-translational modification sites 1 This article is part of Special Issue entitled Asilomar Chromatin and has undergone the Journal’s usual peer review process. Biochem. Cell Biol 90, 79–95 (2012). [DOI] [PubMed] [Google Scholar]
- 18.Duronio RJ & Marzluff WF Coordinating cell cycle-regulated histone gene expression through assembly and function of the Histone Locus Body. RNA Biology (2017). doi: 10.1080/15476286.2016.1265198 [DOI] [PMC free article] [PubMed] [Google Scholar]
- 19.Zink LM & Hake SB Histone variants: Nuclear function and disease. Current Opinion in Genetics and Development 37, 82–89 (2016). [DOI] [PubMed] [Google Scholar]
- 20.Gomes AP et al. Dynamic Incorporation of Histone H3 Variants into Chromatin Is Essential for Acquisition of Aggressive Traits and Metastatic Colonization. Cancer Cell 36, 402–417.e13 (2019). [DOI] [PMC free article] [PubMed] [Google Scholar]
- 21.Sitbon D, Boyarchuk E & Almouzni G Regardless of the deposition pathway, aminoacid 31 in histone variant H3 is essential at gastrulation in Xenopus. bioRxiv 612515 (2019). doi: 10.1101/612515 [DOI] [PMC free article] [PubMed] [Google Scholar]
- 22.Martire S et al. Phosphorylation of histone H3.3 at serine 31 promotes p300 activity and enhancer acetylation. Nature Genetics 51, 941–946 (2019). [DOI] [PMC free article] [PubMed] [Google Scholar]
- 23.Hake SB et al. Serine 31 phosphorylation of histone variant H3.3 is specific to regions bordering centromeres in metaphase chromosomes. Proc. Natl. Acad. Sci 102, 6344–6349 (2005). [DOI] [PMC free article] [PubMed] [Google Scholar]
- 24.Thorne JL, Ouboussad L & Lefevre PF Heterochromatin protein 1 gamma and IκB kinase alpha interdependence during tumour necrosis factor gene transcription elongation in activated macrophages. Nucleic Acids Res. 40, 7676–7689 (2012). [DOI] [PMC free article] [PubMed] [Google Scholar]
- 25.Chang FTM et al. CHK1-driven histone H3.3 serine 31 phosphorylation is important for chromatin maintenance and cell survival in human ALT cancer cells. Nucleic Acids Res. 43, 2603–2614 (2015). [DOI] [PMC free article] [PubMed] [Google Scholar]
- 26.Li M, Dong Q & Zhu B Aurora Kinase B Phosphorylates Histone H3.3 at Serine 31 during Mitosis in Mammalian Cells. J. Mol. Biol 429, 2042–2045 (2017). [DOI] [PubMed] [Google Scholar]
- 27.Hinchcliffe EH et al. Chromosome missegregation during anaphase triggers p53 cell cycle arrest through histone H3.3 Ser31 phosphorylation. Nat. Cell Biol 18, 668–675 (2016). [DOI] [PubMed] [Google Scholar]
- 28.Madabhushi R et al. Activity-Induced DNA Breaks Govern the Expression of Neuronal Early-Response Genes. Cell 161, 1592–1605 (2015). [DOI] [PMC free article] [PubMed] [Google Scholar]
- 29.Huang W-C & Hung M-C Beyond NF-κB activation: nuclear functions of IκB kinase α. J. Biomed. Sci 20, 3 (2013). [DOI] [PMC free article] [PubMed] [Google Scholar]
- 30.Wagner EJ & Carpenter PB Understanding the language of Lys36 methylation at histone H3. Nature Reviews Molecular Cell Biology 13, 115–126 (2012). [DOI] [PMC free article] [PubMed] [Google Scholar]
- 31.Baubec T et al. Genomic profiling of DNA methyltransferases reveals a role for DNMT3B in genic methylation. Nature 520, 243–247 (2015). [DOI] [PubMed] [Google Scholar]
- 32.Neri F et al. Intragenic DNA methylation prevents spurious transcription initiation. Nature 543, 72–77 (2017). [DOI] [PubMed] [Google Scholar]
- 33.Zheng W et al. Sinefungin derivatives as inhibitors and structure probes of protein lysine methyltransferase SETD2. J. Am. Chem. Soc 134, 18004–18014 (2012). [DOI] [PMC free article] [PubMed] [Google Scholar]
- 34.Yang S et al. Molecular basis for oncohistone H3 recognition by SETD2 methyltransferase. Genes Dev. 30, 1611–1616 (2016). [DOI] [PMC free article] [PubMed] [Google Scholar]
- 35.Fierz B & Muir TW Chromatin as an expansive canvas for chemical biology. Nature Chemical Biology 8, 417–427 (2012). [DOI] [PMC free article] [PubMed] [Google Scholar]
- 36.Kruidenier L et al. A selective jumonji H3K27 demethylase inhibitor modulates the proinflammatory macrophage response. Nature 488, 404–408 (2012). [DOI] [PMC free article] [PubMed] [Google Scholar]
- 37.De Santa F et al. Jmjd3 contributes to the control of gene expression in LPS-activated macrophages. EMBO J. 28, 3341–3352 (2009). [DOI] [PMC free article] [PubMed] [Google Scholar]
- 38.Jones SE, Olsen L & Gajhede M Structural Basis of Histone Demethylase KDM6B Histone 3 Lysine 27 Specificity. Biochemistry 57, 585–592 (2018). [DOI] [PubMed] [Google Scholar]
- 39.Andrews FH, Gatchalian J, Krajewski K, Strahl BD & Kutateladze TG Regulation of Methyllysine Readers through Phosphorylation. ACS Chemical Biology 11, 547–553 (2016). [DOI] [PMC free article] [PubMed] [Google Scholar]
- 40.Sarma K, Margueron R, Ivanov A, Pirrotta V & Reinberg D Ezh2 requires PHF1 to efficiently catalyze H3 lysine 27 trimethylation in vivo. Mol. Cell. Biol 28, 2718–31 (2008). [DOI] [PMC free article] [PubMed] [Google Scholar]
- 41.Hake SB et al. Serine 31 phosphorylation of histone variant H3.3 is specific to regions bordering centromeres in metaphase chromosomes. Proc. Natl. Acad. Sci 102, 6344–6349 (2005). [DOI] [PMC free article] [PubMed] [Google Scholar]
- 42.Bush KM et al. Endogenous mammalian histone H3.3 exhibits chromatin-related functions during development. Epigenetics Chromatin 6, 7 (2013). [DOI] [PMC free article] [PubMed] [Google Scholar]
- 43.Jang C-W, Shibata Y, Starmer J, Yee D & Magnuson T Histone H3.3 maintains genome integrity during mammalian development. Genes Dev. 29, 1377–1392 (2015). [DOI] [PMC free article] [PubMed] [Google Scholar]
- 44.Wen D et al. Histone variant H3.3 is an essential maternal factor for oocyte reprogramming. Proc. Natl. Acad. Sci. U. S. A 111, 7325–7330 (2014). [DOI] [PMC free article] [PubMed] [Google Scholar]
- 45.Kong Q et al. Histone variant H3.3–mediated chromatin remodeling is essential for paternal genome activation in mouse preimplantation embryos. J. Biol. Chem 293, 3829–3838 (2018). [DOI] [PMC free article] [PubMed] [Google Scholar]
- 46.Yuen BTK, Bush KM, Barrilleaux BL, Cotterman R & Knoepfler PS Histone H3.3 regulates dynamic chromatin states during spermatogenesis. Development 141, 3483–3494 (2014). [DOI] [PMC free article] [PubMed] [Google Scholar]
- 47.Bachu M et al. A versatile mouse model of epitope-tagged histone H3.3 to study epigenome dynamics. J. Biol. Chem jbc.RA118.005550 (2018). doi: 10.1074/jbc.RA118.005550 [DOI] [PMC free article] [PubMed] [Google Scholar]
Associated Data
This section collects any data citations, data availability statements, or supplementary materials included in this article.
Supplementary Materials
Data Availability Statement
Source data for immunoblots are provided in Supplementary Fig. 1. All ChIP and RNA sequencing data described in this manuscript are deposited in the NCBI Gene Expression Omnibus (GEO): GSE125159. There are no restrictions on data availability.


