Abstract
Monocyte-derived and tissue-resident macrophages are ontogenetically distinct components of the innate immune system. Assessment of their respective functions in pathology is complicated by changes to the macrophage phenotype during inflammation. Here, we find that Cxcr4-CreER enables permanent genetic labeling of hematopoietic stem cells (HSCs) and distinguishes HSC-derived monocytes from microglia and other tissue-resident macrophages. By combining Cxcr4-CreER-mediated lineage tracing with Cxcr4 inhibition or conditional Cxcr4 ablation in photothrombotic stroke, we find that Cxcr4 promotes initial monocyte infiltration and subsequent territorial restriction of monocyte-derived macrophages to infarct tissue. After transient focal ischemia, Cxcr4-deficiency reduces monocyte infiltration and blunts the expression of pattern recognition and defense response genes in monocyte-derived macrophages. This is associated with an altered microglial response and deteriorated outcomes. Thus, Cxcr4 is essential for an innate immune-system-mediated defense response after cerebral ischemia. We further propose Cxcr4-CreER as a universal tool to study functions of HSC-derived cells.
Introduction
Monocytes and microglia are distinct myeloid components of the innate immune system1–4. Both cell types are actively involved in neuropathological processes, but their respective contributions to neuronal damage and repair remain poorly resolved5.
Microglia are the resident macrophages of the brain parenchyma where they survey and modulate neuronal networks8. They become activated in diverse brain disorders, and this results in microgliosis characterized by changes in microglial morphology, proliferation and induction of inflammation-related genes6–7. Microglia contribute to a disease-modifying innate immune response that involves infiltration of monocytes into the brain under certain conditions9. The extent of the monocyte infiltration and its molecular determinants are still unknown for many brain disorders because monocyte-derived macrophages (MDM) are phenotypically similar to reactive microglia5,10.
To better understand how monocyte infiltration influences brain pathologies, feasible technologies are needed that reliably identify infiltrated monocytes. Given that monocytes originate from HSCs, whereas microglia are descendants of yolk sac erythro-myeloid progenitors (EMP) and are maintained independently from HSCs, genetic tracing of the HSC lineage through a promoter-driven recombinase, such as Flt3-Cre, can be employed to track monocytes3,4,11–13. This approach has been successfully used in brain malignancy models14. However, since Flt3 promoter activity can potentially be affected in inflammatory settings, inducible lineage tracing that permits cell labeling under healthy conditions is required to unambiguously distinguish HSC-derived and microglial cells. We implemented this approach using inducible CreER(T2) expressed from the gene locus of CXC-motif-chemokine receptor 4 (Cxcr4).
Cxcr4 retains HSCs in the BM by transducing the signal of Cxcl12, an ancestral chemokine expressed in BM stromal cells and many other organs, including the brain. The Cxcl12-Cxcr4 axis is critical for homeostasis of the adaptive and innate immune system and regulates monocyte margination at sites of injury15–19. Cxcr4 is connected to diverse neuro-inflammatory settings by either promoting or impairing leukocyte entry into the brain20–24. This is thought to involve regulated Cxcl12 expression in endothelial cells and decoy-receptor-mediated control of Cxcl12 availability in the perivascular space20,25. Yet, it is unknown whether Cxcr4 influences the innate immune response in the injured brain. Using multiple genetic approaches to assess Cxcr4 expression and function in hematopoietic and brain myeloid cells, we show that Cxcr4 is absent in microglia, but regulates infiltration, regional distribution and the transcriptional response of infiltrated monocytes after stroke. Our findings establish a critical function of Cxcr4 in the HSC-dependent immune response to brain injury.
Results
Cxcr4 distinguishes HSC-derived cells from microglia
Using CD11b and F4/80 signatures to differentiate between HSC-derived monocytes and EMP-derived resident macrophages3,4,12 in Cxcr4-GFP reporter mice, we observed that Cxcr4-GFP is differentially expressed in these cell types: F4/80−/low CD11b+ monocytes and other tissue myeloid cells were GFP+ in spleen, kidney and liver, whereas microglia and other macrophages originating from EMPs (CD11blow F4/80high macrophages in the splenic red pulp, kidney, liver and epidermis) lacked GFP. This corresponded to a broad GFP signal in lineage- (Lin-) Sca1+ Kit+ (LSK) HSCs and circulating leukocytes (Fig. 1a, Extended Data Fig. 1). During embryogenesis, HSCs and their progeny expressed GFP, but EMPs, EMP-derived pre-macrophages (pMacs), and fetal macrophages in the yolk sac were GFP− (Fig. 1b). Single-cell RNA-sequencing (RNA-seq) of EMPs, pMacs and macrophages present in embryonic day 10.25 (E10.25) wild-type mice26 confirmed that none of these cells expressed Cxcr4 or Cxcl12 (Fig. 1c,d). Bulk RNA-seq at postnatal day 21 (P21) did not detect Cxcr4 or Cxcl12 in tissue-resident macrophages of diverse organs (Fig. 1e). Immunohistology of fetal brains revealed that microglia lacked Cxcr4 and Cxcr4-GFP throughout development, while neuronal precursors known to express Cxcr427 were Cxcr4+. Finally, the density and regional distribution of microglia in the brain of E13.5 Cxcl12−/− and E16.5 Cxcr4−/− mice were unchanged compared to wild-type littermates (Extended Data Fig. 2a–d). This suggests that while fetal HSCs require Cxcr4 to colonize the BM17,28, EMP-derived microglia do not express Cxcr4 and develop normally if Cxcl12-Cxcr4 signaling is absent.
Figure 1.
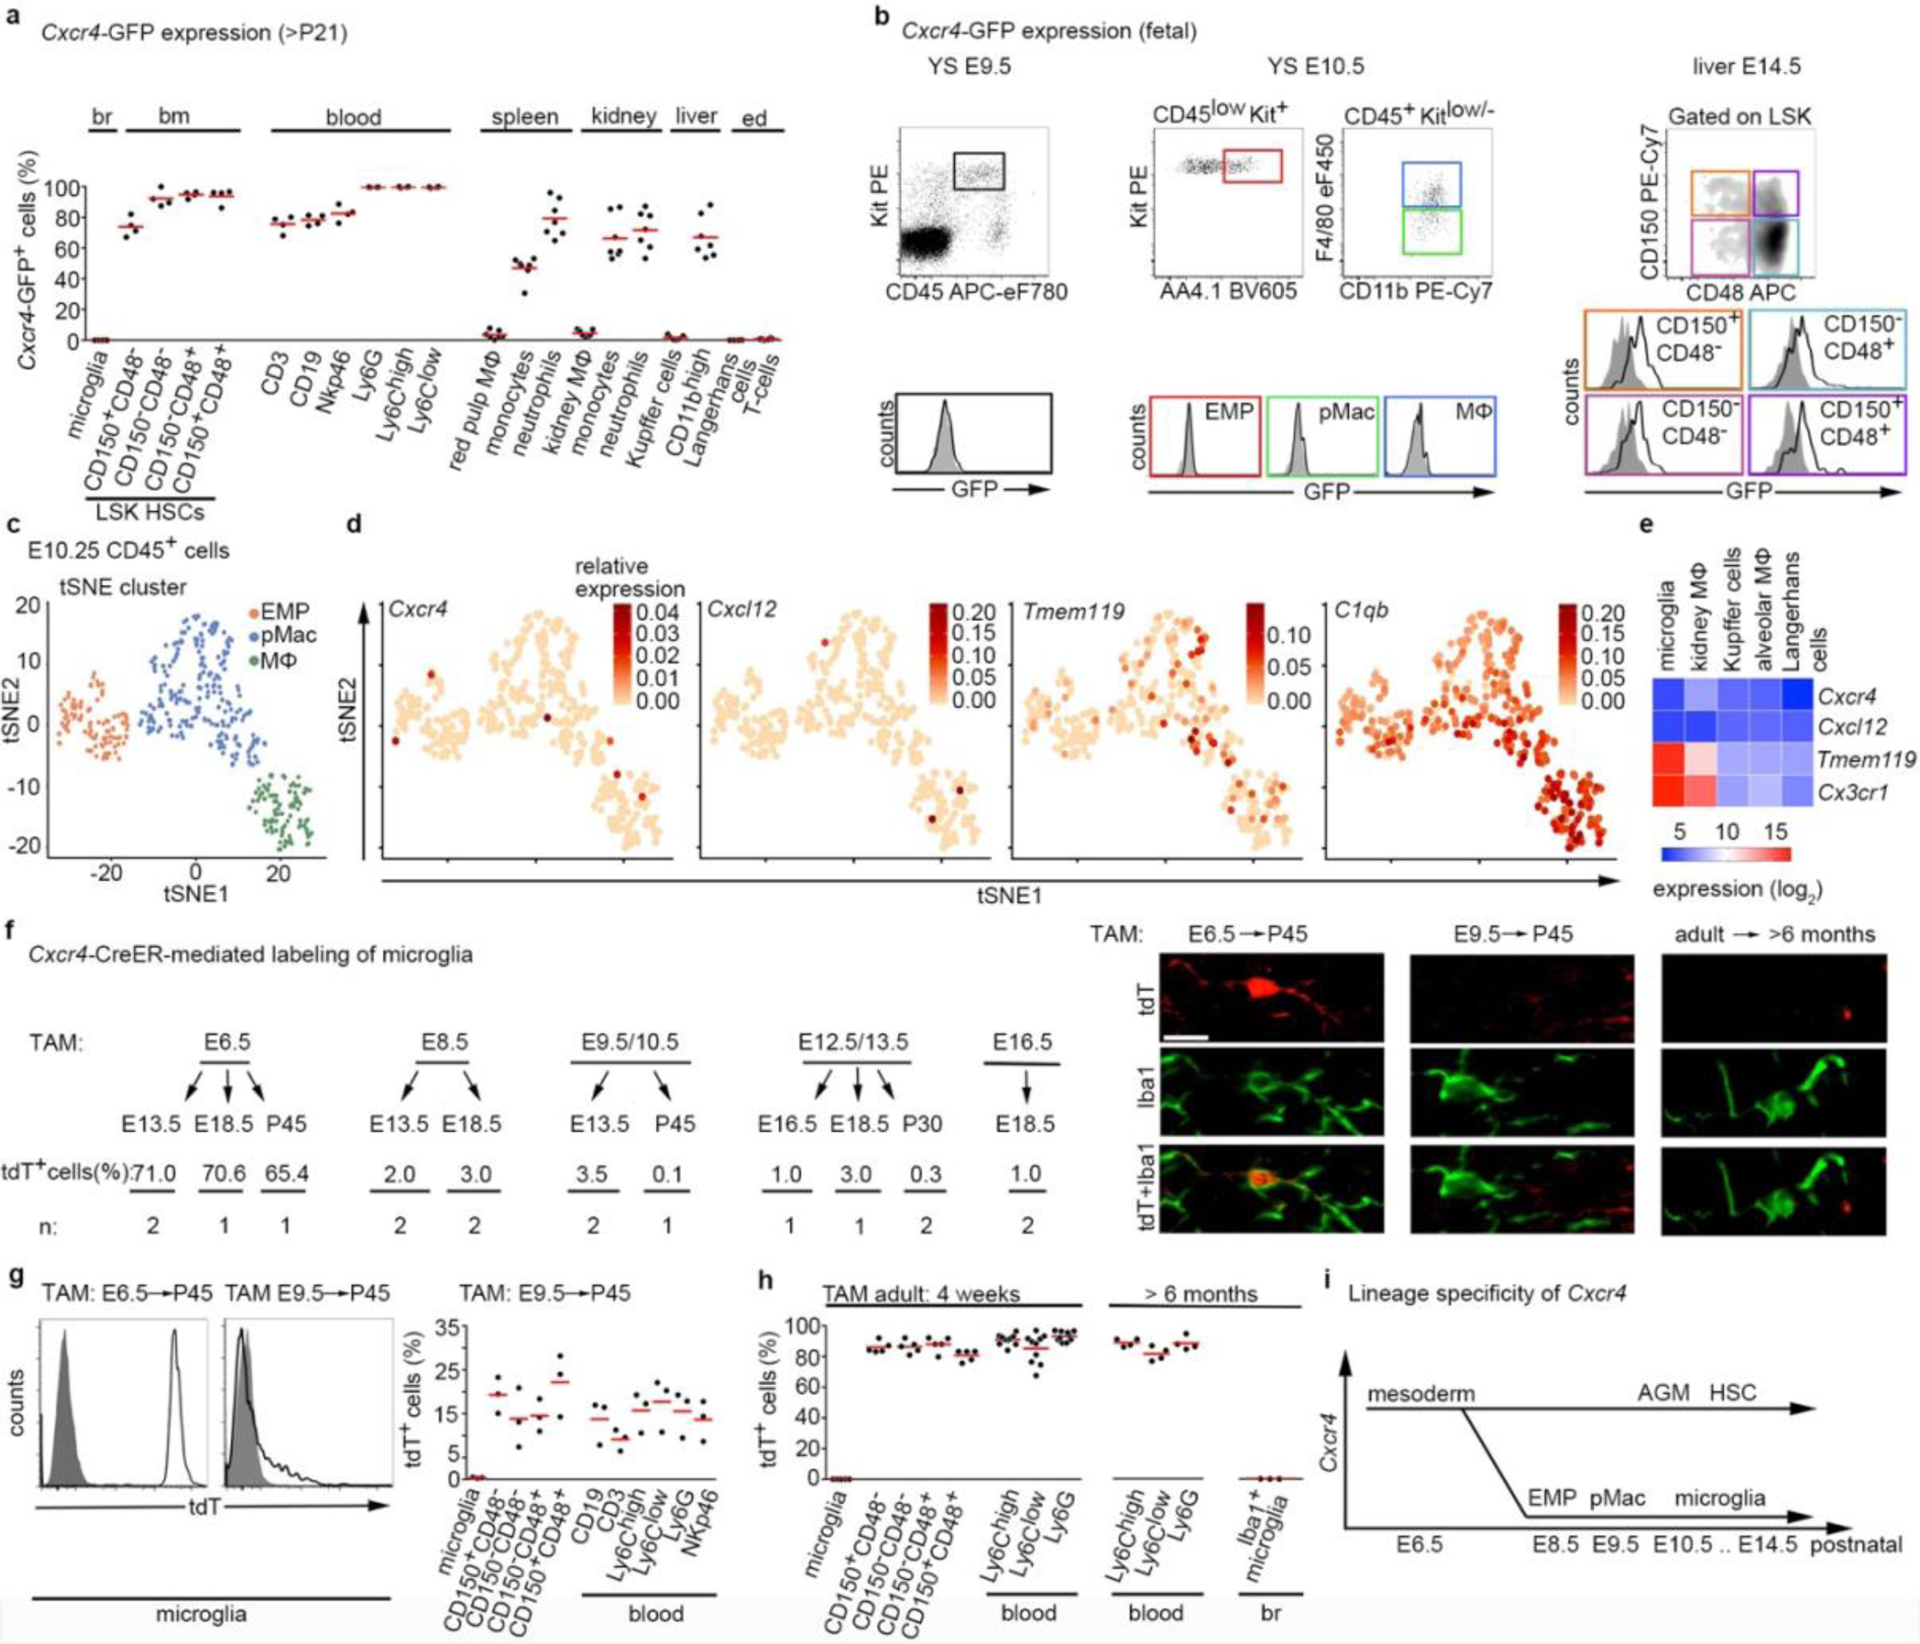
Developmental expression of Cxcr4 in hematopoietic cells. a, Flow cytometry analysis of GFP in Cxcr4-GFP mice. The graph depicts the GFP+ percentage for microglia (CD11b+CD45low), LSK HSCs, blood leukocytes (CD3+ T-cells, CD19+ B-cells, NKp46+ natural killer cells, Ly6G+ neutrophils and CD115+ Ly6Clow/Ly6C+ monocytes), CD11b+ F4/80high tissue macrophages (MΦ), including Kupffer cells and Langerhans cells and CD11b+ F4/80−/low tissue myeloid cells from Cxcr4-GFP mice (>P21). b, Flow cytometry analysis of GFP expression in hematopoietic cells from fetal Cxcr4-GFP (solid line) and wild-type (filled) mice. Cells analyzed were Kit+ EMPs, F4/80− pMacs and F4/80+ macrophages in E9.5 and E10.5 yolk sac (YS), as well as LSK HSCs in E14.5 liver. c, t-Distributed stochastic neighbor embedding (tSNE) plot of single-cell RNA-seq data showing distribution of CD45low/+ cells from E10.25 embryos into three clusters. Cluster distribution based on DBScan is overlaid onto the graph and corresponds to EMPs, pMacs, and macrophages. d, tSNE plot as in (c), overlaid with the relative expression values for Cxcr4, Cxcl12, Tmem119 and C1qb. e, Heatmap representation of selected genes from bulk RNA-seq of macrophages from indicated P21 tissues. f, Left: contribution of Cxcr4 lineage-derived cells to microglia in Cxcr4CreER/wt;R26CAG-LSL-tdT mice pulsed with TAM at the indicated stages of embryonic development. The tdT signal was assessed by confocal microscopy in ≥100 microglia per mouse. Data represent mean values of the tdT+ percentage (n: number of analyzed mice). Right: confocal micrographs demonstrate double immunofluorescence for Iba1 and tdT. Scale bar, 10μm (applies to all images). g, Left: solid line histograms showing the tdT signal in CD11b+CD45low microglia from E6.5-pulsed and E9.5-pulsed P45 Cxcr4CreER/wt; R26CAG-LSL-tdT mice. Filled histograms show TAM- Cxcr4CreER/wt; R26CAG-LSL-tdT controls. Right: scatter dot plot show the percentage of tdT+ cells for microglia (CD11b+CD45low), LSK HSCs, and leukocyte subpopulations obtained from P45 Cxcr4CreER/wt;R26CAG-LSL-tdT mice receiving TAM at E9.5. h, Percentage of tdT+ cells for microglia, HSCs and leukocytes from Cxcr4CreER/wt; R26CAG-LSL-tdT mice receiving TAM at adult age. Flow cytometry analyses took place 4 weeks and >6 months after TAM as indicated. Iba1+ microglia in the >6 months cohort was assessed by confocal microscopy. i, Schematic summarizing developmental expression of Cxcr4 in the hematopoietic lineages giving rise to tissue-resident macrophages and HSCs. AGM, aorta-gonad-mesonephros. In all graphs, circles and lines represent individual mice and mean values, respectively. Statistics: a, n=6 (brain, BM, blood and epidermis) or 7 (spleen, kidney and liver) mice; b, data are representative for n=5 mice each; c,d, data represent 408 single cells from n = 2 independent experiments with four and six embryos per experiment. e, mean from n = 2 animals and n = 2 technical replicates, except lung, where n = 1 animal and n = 2 technical replicates; g, data for both graphs are representative for n = 3 mice each. h, for analyses at 4 weeks n = 5 (microglia and BM) or 10 (blood) mice; for >6 months: n = 4 (blood) or 3 (microglia) mice. Panel c adapted from 26, with permission from AAAS.
The lineage-specificity of Cxcr4 prompted us to generate a Cxcr4CreER(T2)-IRES-eGFP (Cxcr4CreER) knock-in allele (Extended Data Fig. 3a) and to breed Cxcr4CreER/Wt; R26CAG-LSL-tdT mice for lineage tracing. Tamoxifen (TAM) pulsing at E6.5 generated tdTomato (tdT) fluorescence in the majority of fetal and postnatal microglia (Fig. 1f,g), which is consistent with Cxcr4 being actively expressed in mesoderm giving rise to extra- and intra-embryonic hemogenic endothelia29. TAM-pulsing between E8.5 and E13.5, when EMPs and pMacs are present in the yolk sac (E8.5–E10.5) and when microglia precursors colonize the brain (E9.5–E13.5)13,26, produced ≤3.5% labeling of fetal microglia and almost no labeling of mature microglia (Fig. 1f,g). In contrast, postnatal HSCs and myeloid blood cells showed ~15% labeling after TAM-pulsing at E9.5 (Fig. 1g), which indicates that Cxcr4 is expressed at E9.5 in progenitors that produce definite HSCs, but not in microglia progenitors.
Next, we examined adult Cxcr4CreER/Wt; R26CAG-LSL-tdT mice 4 weeks after TAM application. tdT was present in >86% of CD150+ CD48− HSCs and in a similar percentage of myeloid blood cells. Microglia and CD11blow F4/80high tissue-resident macrophages in liver, epidermis and spleen were largely tdT− (Fig. 1h, Extended Data Fig. 3b). In the forebrain, tdT reflected the known Cxcr4 expression pattern25 (Extended Data Fig. 3c). After >6 months TAM washout, >88% of circulating Ly6Chigh monocytes still exhibited tdT expression (Fig. 1h), which indicates that Cxcr4CreER had recombined a large percentage of progenitors that are capable of long-term myeloid cell production. Microglia (Fig. 1h), perivascular Iba1+ cells and leptomeningeal Iba1+ cells remained tdT− under these conditions (not shown). Stringency of the inducible CreER(T2) element was confirmed by sparse tdT signal in HSCs, circulating myeloid cells and forebrain of TAM-naïve Cxcr4CreER/wt; R26CAG-LSL-tdT mice (Extended Data Fig. 3c,d). Signal from the Cxcr4-IRES-eGFP construct that was included in Cxcr4CreER for visualization of cells expressing Cxcr4 were not detectable in native or formalin-fixed brain, which is probably because the second cistron is weakly translated. when counterstained, Cxcr4-IRES-GFP recapitulated Cxcr4 expression25 (Extended Data Fig. 3c). Thus, Cxcr4 expression is restricted to the HSC lineage as opposed to the EMP lineage of myeloid cells or tissue-resident macrophages (Fig. 1i).
Cxcr4-GFP and Cxcr4-CreER identify MDMs in experimental stroke
Next, we used the Cxcr4 signature to track monocyte fate and function in the inflamed brain using experimental stroke as model. We induced stroke either by photothrombosis (PT) or by transient middle cerebral artery occlusion (tMCAO). Our initial analyses were performed at post-operative day 3 in the infarct and its surrounding (that is, the motor cortex after PT and the caudate-putamen and parietal cortex after tMCAO). In situ hybridization (ISH) for Cxcr4 in wild-type mice and the Cxcr4-GFP reporter concordantly revealed the emergence of numerous Cxcr4+ cells in both models (Fig. 2a,b). Immunofluorescence for GFP, Iba1 and Tmem119 showed that most Cxcr4-GFP+ cells were Iba1+ Tmem119− phagocytes (Fig. 2c–f). Flow cytometry of CD45, CD11b and Ly6C revealed that CD45lowCD11b+Ly6C− cells (microglia) remained GFP− while CD45highCD11b+Ly6Chigh cells (monocytes) represented the main population within Cxcr4-GFP+ cells at day 3 after stroke induction (Fig. 2g,h).
Figure 2.
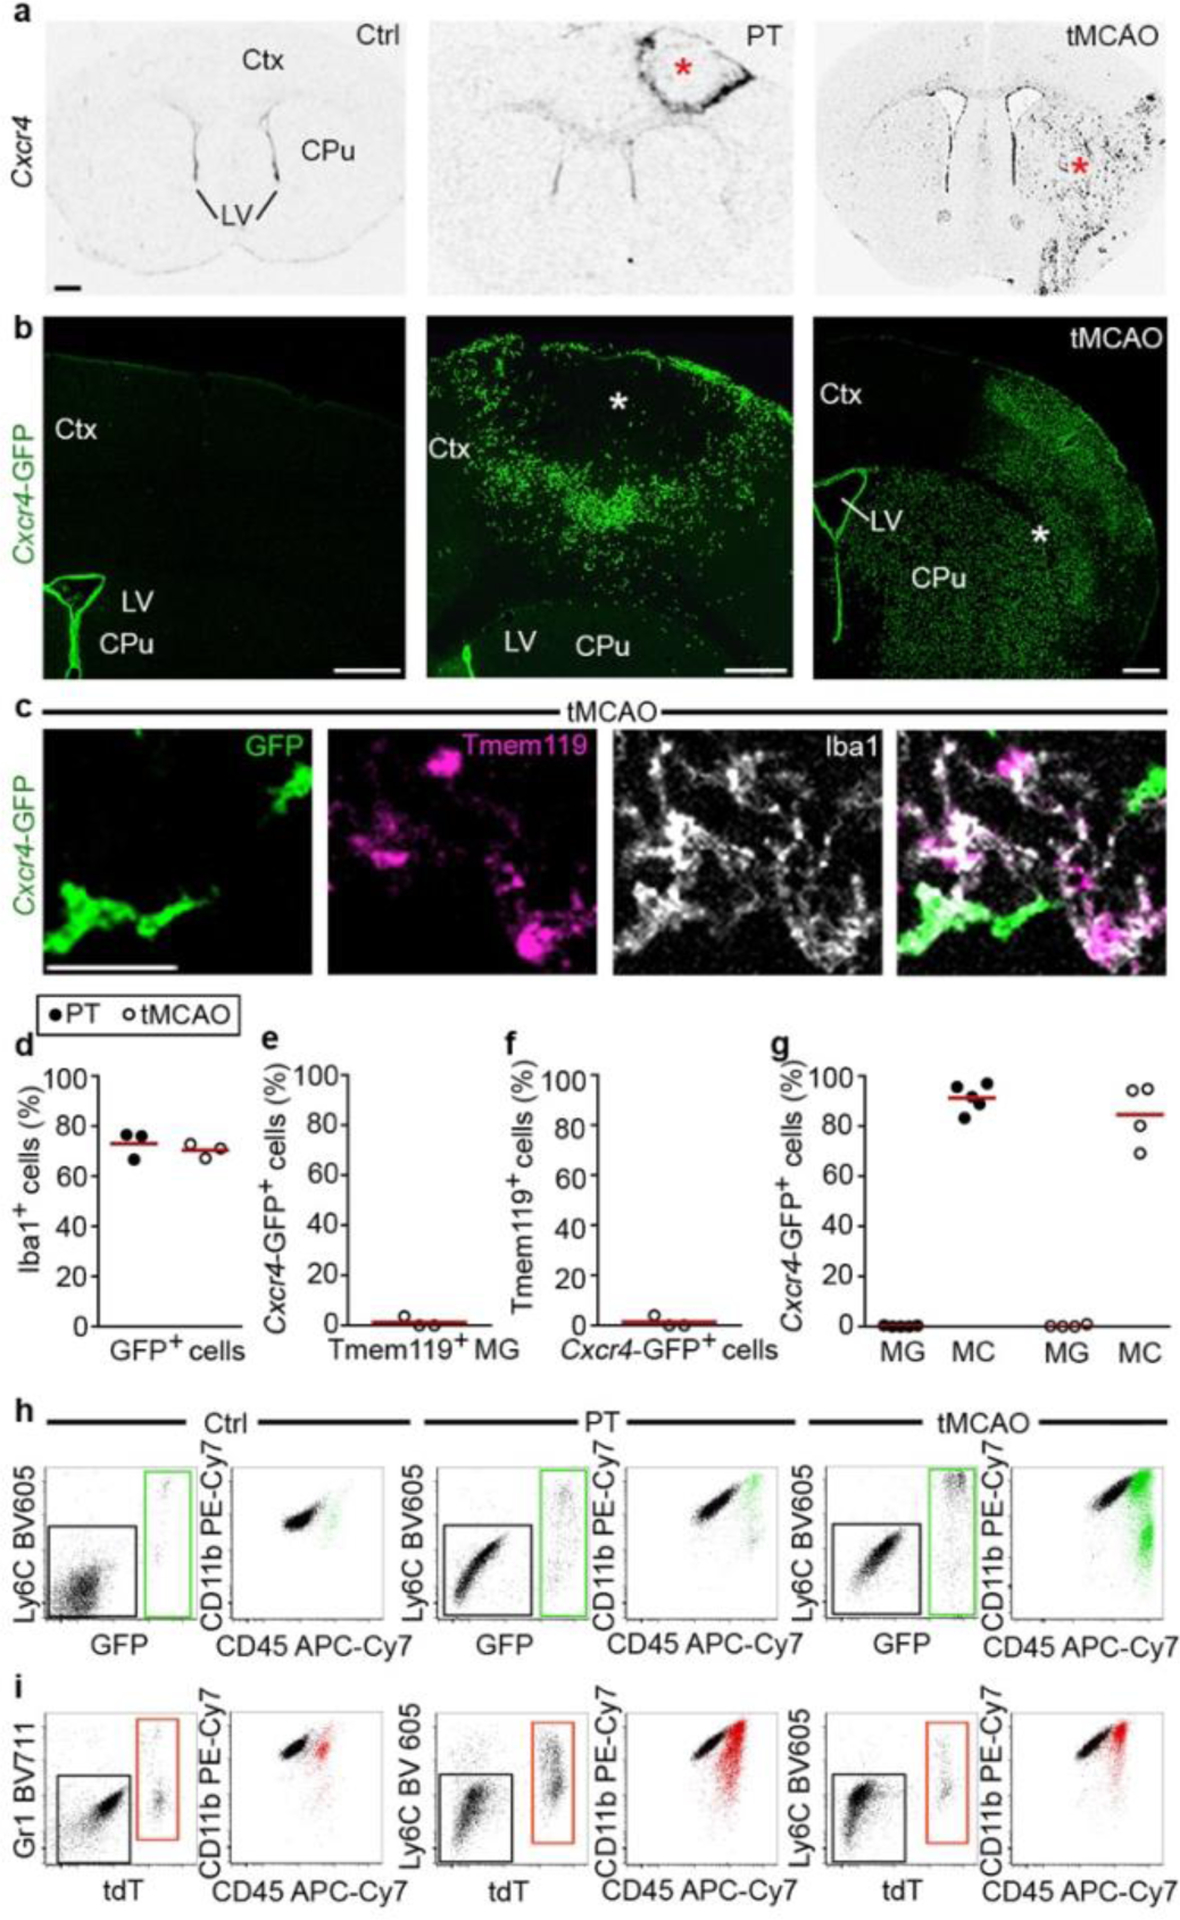
Cxcr4 is differentially expressed in MDMs and reactive microglia at day 3 after stroke induction. a, ISH for Cxcr4 in coronal brain sections of wild-type mice, with the cerebral cortex (Ctx), caudate putamen (CPu) and lateral ventricle (LV) highlighted. Images depict the control condition (Ctrl), PT and tMCAO. b, Immunofluorescence for GFP in Cxcr4-GFP mice. Asterisks in (a) and (b) identify the infarct territory. Scale bar, 500μm (applies to all images in (a) and (b)). c, Confocal images showing triple immunofluorescence for GFP, Tmem119 and Iba1 in the infarct of a Cxcr4-GFP mouse undergoing tMCAO. Scale bar, 45μm. d–f, Overlap of Cxcr4-GFP with Iba1 and Tmem119 in the infarct territory as determined by confocal microscopy. Graphs show the Iba1+ percentage for Cxcr4-GFP+ cells (d), the GFP+ percentage for Iba1+Tmem119+ microglia (e) and the Tmem119+ percentage for GFP+ Iba1+ cells (f). Keys in (d) applies to (e) – (g). g–i, Immunophenotyping of GFP+ cells (green) from Cxcr4-GFP mice (g,h) and tdT+ cells (red) from Cxcr4CreER/wt;R26CAG-LSL-tdT mice (i) using CD11b, CD45 and Ly6C/Gr1 as markers. Phenotyping was performed with CD3-CD19-Ly6Glow cells from the telencephalon under control conditions and from the affected brain area after PT or tMCAO. Data in g show Cxcr4-GFP+ percentages for microglia (MG: CD11b+CD45low) and monocytes (MC: CD11b+CD45highLy6Chigh). For all graphs, circles and lines represent individual mice and mean values, respectively. Statistics: a–c, Data are representative for n≥3 mice each; d–f, data represent n=3 mice; g, data represent n=5 (PT) or 4 (tMCAO) mice. h,i, data are representative of n=6 (i, Ctrl), 5 (i, PT), 4 (i, tMCAO), 4 (h, Ctrl), 8 (h, PT), or 6 (h, tMCAO) mice.
Since there is no inducible fate-mapping strategy to identify MDMs, we tested the utility of the Cxcr4CreER/wt; R26CAG-LSL-tdT model in stroke (Fig. 2i). By administering TAM in healthy conditions and keeping a TAM-washout period of 4 weeks before stroke induction, we avoided possible mutual influence between pathology and TAM labeling. Flow cytometry performed after PT revealed that an average of 86% of the infiltrated Ly6Chigh monocytes were tdT+, while ~99% of the phenotypical microglia were tdT− under these conditions. Immunofluorescence for tdT, Iba1 and Tmem119 identified ~17% of the Iba1+ phagocytes in striatal infarcts as MDMs, whereas Tmem119+ cells lacked tdT (Extended Data Fig. 3e,f). Cxcr4-IRES-GFP, which identifies cells expressing Cxcr4, showed that 96% of GFP+ Iba1+ cells in the infarct were tdT+ MDM. Conversely, Cxcr4-IRES-GFP was absent in tdT− Iba1+ microglia (Extended Data Fig. 3g–i). The presence of tdT+ Iba1+ MDMs lacking Cxcr4-IRES-GFP (Extended Data Fig. 3g) indicates that infiltrated monocytes can lose Cxcr4 expression. These findings establish that Cxcr4 is expressed in infiltrating monocytes, but not in reactive microglia at day 3 after stroke induction. Moreover, Cxcr4CreER/wt; R26CAG-LSL-tdT can be used to label HSCs under healthy conditions, thereby enabling reliable identification of HSC-derived myeloid cells over long periods after inducing brain injury.
Molecular and spatial patterning of MDMs and microglia after experimental stroke
Next, we used RNA-seq to analyze the transcriptional profiles of Cxcr4-GFP+ MDMs and Cxcr4-GFP− microglia present in the injured cortex at day3 after PT (Fig. 3a,b Extended Data Fig. 4a–f, Supplementary Table 1). Inspection of selected genes and gene set enrichment analysis (GSEA) comparing our datasets to markers in public databases revealed monocyte and microglia signatures for Cxcr4-GFP+ MDMs and Cxcr4-GFP− microglia, respectively, and showed that both cell populations were distinct from neutrophils (Extended Data Fig. 4b,c).
Figure 3.
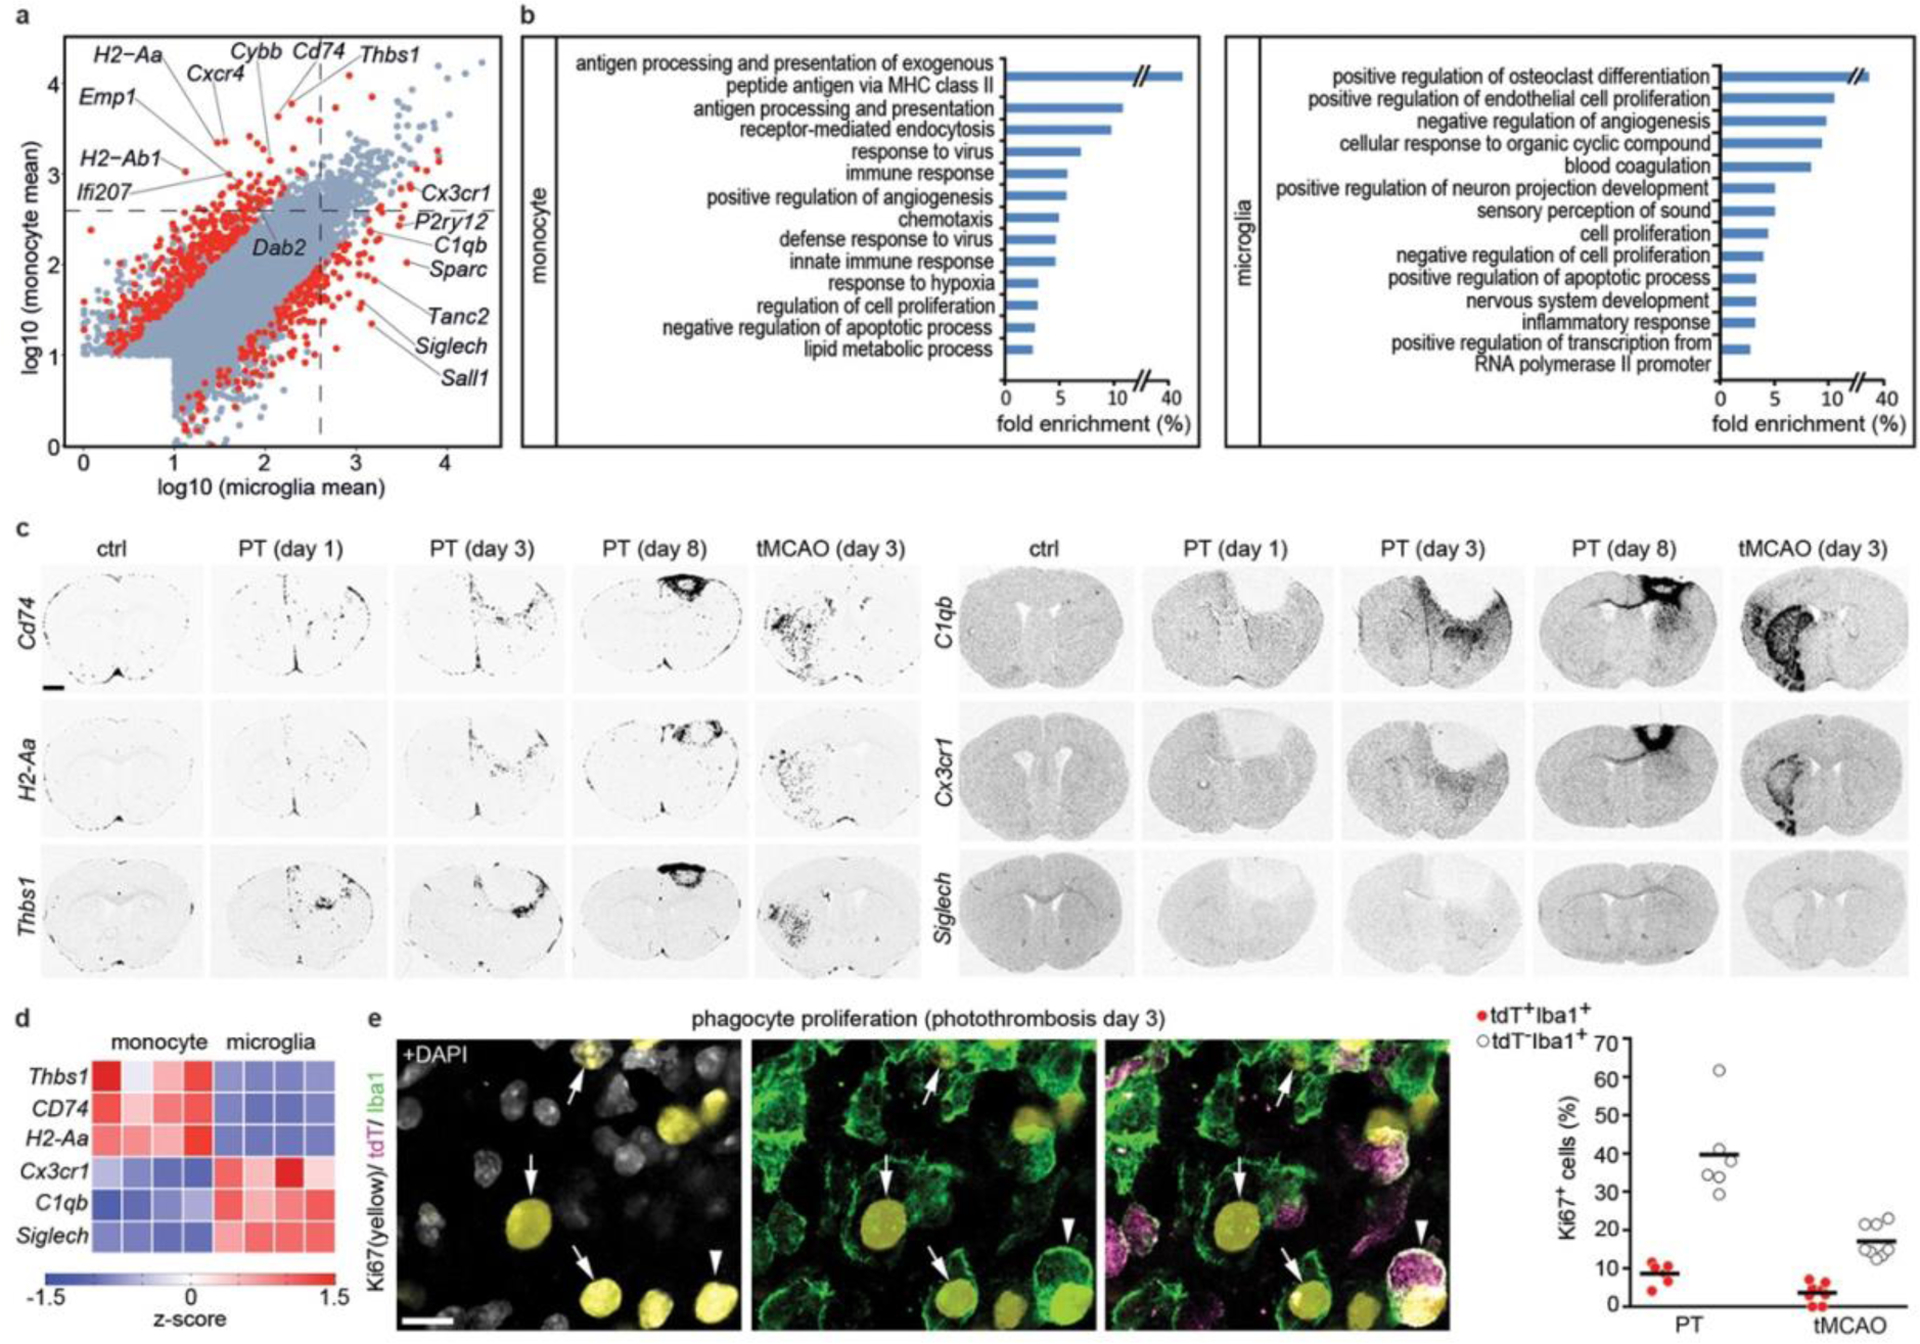
Gene expression profiles of monocytes in stroke. a, Scatter plot depicting expression levels of individual genes in Cxcr4-GFP− microglia (CD11b+CD45low) and Cxcr4-GFP+Ly6Chigh monocytes (CD11b+ CD45high) as determined by RNA-seq. Data represent log10 (mean of normalized RNA counts; n=4 mice) for monocytes/microglia sorted from suspensions of the ipsilateral cortex at day 3 after PT. Genes with fold change |FC|>4 and FDR-adjusted p-value<0.3 are marked in red. Statistical test: one-way ANOVA. Dashed lines separate genes with at least 400 counts in the one or other condition. b, Gene Ontology (GO) term enrichment analysis of DEGs. Bars depict fold enrichment for terms with p-value <0.05. Statistical test: EASE Score (one-tailed) calculated using DAVID Bioinformatics. c, X-ray autoradiograms of in situ hybridized coronal brain sections under control conditions (ctrl) and after stroke. Images are representative for n=2 (ctrl) and n=3 mice per time point after PT or tMCAO. d, Heat-map representation of the indicated genes. Values are displayed as z-scores of normalized counts (n=4 mice). e, Confocal images depicting triple immunofluorescence for Ki67, tdT and Iba1 in the PT-induced lesion of a Cxcr4CreER/wt; R26CAG-LSL-tdT mouse at day 3. Arrows point to Ki67+ tdT− Iba1+ cells (microglia), arrow-head identifies a Ki67+ tdT+ Iba1+ monocyte. Graphs show the Ki67+ percentages for tdT− Iba1+ cells (microglia) and for tdT+ Iba1+ cells (monocytes) present in the lesion at day 3 after PT and tMCAO. Circles and lines represent individual mice and mean values, respectively (n=6 (PT) or 8 (tMCAO) mice). Scale bars: 1000 μm (c) or 20 μm (e).
We then visualized patterns of MDM-specific transcripts (Cd74, H2-Aa, Thbs1, H2-Ab1, Emp1, Ifi207, Dab2, and Cybb(also known as Nox2)), microglia-specific Siglech, and Cx3cr1 and C1qb, which are expressed in MDMs and microglia (Fig. 3a,c,d; Extended Data Fig. 4g,h). All MDM-specific transcripts were primarily expressed in peri-infarct and infarct tissue, thus recapitulating the Cxcr4-GFP pattern. Very few cells expressed these MDM-specific genes in the healthy brain. Siglech, Cx3cr1, and C1qb were present throughout control and post-stroke brains in a fashion characteristic of microglia. Thus, MDM exhibit a characteristic spatial organization and gene expression signature that distinguishes them from microglia after stroke.
Gene Ontology (GO) term enrichment analysis of differentially expressed genes (DEGs) (Fig. 3b; Extended Data Fig. 4f; Supplementary Table 1) showed that genes mediating antigen processing and presentation via major histocompatibility complex class II (for example H2-Aa, H2-Ab1, and CD74) and a series of genes annotated to innate immune response processes were characteristic of MDMs. The latter included super-oxide-generating Cybb, Src kinase Fgr, pattern recognition molecules (Tlr8, Ifi202, Clec7a, Clec4d, and Oas2), and complement system components (C3, Cfb, Cfp). MDM-enriched genes associated with the GO terms “defense response to virus” and “innate immune response” were interferon regulatory or interferon-stimulated genes (for example Irf7, Ifi200b, Ifi202, Ifitm2, Ifitm3, Oas2, Oasl2, Rsad2, Trim25 and Tlr8), which suggests that MDMs were in a type-I-interferon-activated state. Differences between MDMs and microglia were also apparent for cell surface receptors. Specifically, MDMs expressed Ccr1, Ccr2, Cxcr4, Plxna1, Plxnc1, Plxnd1, Adgre5, Gpr35, Gpr65 and Gpr132, whereas microglia were enriched in Plxna4, the purinergic receptors P2ry12 and P2ry13, diverse heptahelical receptors (Gpr34, Gpr56, Gpr84 and Adrb2), and pattern recognition receptors Tlr3 and Tmem173. The GO term “cell proliferation” with Mki67 as an associated microglia-enriched gene prompted us to stain for tdT, Iba1 and Ki67 in Cxcr4creER/wt; R26CAG-LSL-tdT mice at post-operative day 3, This showed that the Ki67+ percentage was approximately five times smaller for MDMs than for microglia (Fig. 3e).
We then employed RNA-seq to identify DEGs for tdT+ MDMs and tdT− microglia (fold change of 1.5; false discovery rate (FDR) P<0.05) sorted from brains of Cxcr4creER/wt; R26CAG-LSL-tdT mice at day 3 after PT and tMCAO. By comparing these DEGs to those identified in Cxcr4-GFP mice, core-MDM (126 genes) and core-microglia (62 genes) signatures present in all three conditions were identified (Extended Data Fig. 4i; Supplementary Tables 1–4). These findings suggest that MDMs and microglia are present in different cellular states and are involved in distinct adaptive responses after stroke.
Reperfusion facilitates monocyte infiltration in the infarct territory
We next analyzed the spatiotemporal pattern of Cxcr4-GFP+Iba1+MDMs after PT and tMCAO (Fig. 2; Extended Data Fig. 5a,b). At post-operative day 1, few infiltrates were present after PT, whereas infiltration was region-dependent after tMCAO (for example, sparse in the infarcted caudate putamen but substantial in peri-infarct regions). At days 2 and 3, numerous MDM were present in both models. After PT, the majority of MDM were localized in areas harboring viable astrocytes, which indicates that they had mainly infiltrated the viable peri-infarct area. This was different after tMCAO, where monocytes infiltrated the peri-infarct area and the infarct center (Extended Data Fig. 5a–e). Immunofluorescence analysis for both GFP and PECAM showed that only a few GFP+ cells were associated with PECAM+ endothelia (Extended Data Fig. 5f), which suggests that Cxcr4-GFP+ monocytes had left the perivascular space and entered the parenchyma. GFP− Iba1+ microglia survived tMCAO but vanished almost completely in photothrombotic infarcts (day 1) before repopulating the infarct during the subsequent days (Extended Data Fig. 5g). Thus, reperfused infarcts retain microglia and recruit substantial numbers of monocytes from post-operative day 1 onward. In contrast, photothrombotic infarcts are pan-necrotic, cause massive monocyte infiltration in the structurally intact peri-infarct area at days 2 and 3, and are repopulated by MDMs and microglia.
MDM do not persist in intact brain tissue
In both stroke models, Cxcr4-GFP+Iba1+ cells were no longer detected at day 8 in the peri-infarct area while infarcts still contained numerous Cxcr4-GFP+Iba1+ MDMs (Extended Data Fig. 5a,b). The lack of Cxcr4-GFP+Iba1+ cells in the peri-infarct area might indicate either absence of MDMs or inactivation of Cxcr4-GFP expression in Iba1+ cells. We distinguished between these possibilities by tracing HSC-derived cells with the Cxcr4CreER/Wt; R26CAG-LSL-tdT model. We focused on PT because it triggered strong monocyte infiltration in the peri-infarct region. GFAP was immunostained along with Iba1 and tdT to distinguish the infarct from intact tissue. For quantification, we identified three regions of interest (ROIs 1–3) (Fig. 4a,b) and analyzed all Iba1+ cells in a given ROI for tdT. The density of MDMs increased between days 3 and 8 in GFAP− infarct tissue (Fig. 4c, ROI 1). Concomitantly, the density of MDMs decreased in the GFAP+ boundary zone (Fig. 4c, ROI 2). The intact ROI 3 harbored numerous MDMs at day 3, but almost none at days 8 and 28 (Fig. 4c). At days 8 and 28, we noted a particularly high density of Iba1+ cells along the boundary of GFAP− ROI 1 and GFAP+ ROI 2 (Fig. 4a,d). The Iba1+ population in the boundary zone mostly consisted of tdT− microglia, whereas MDMs were generally not localized outside the infarct. Thus, MDMs do not persist in intact brain tissue after photothrombotic stroke. Instead, they remain in infarct tissue and are enclosed by microglia and astrocytes during the repair process.
Figure 4.
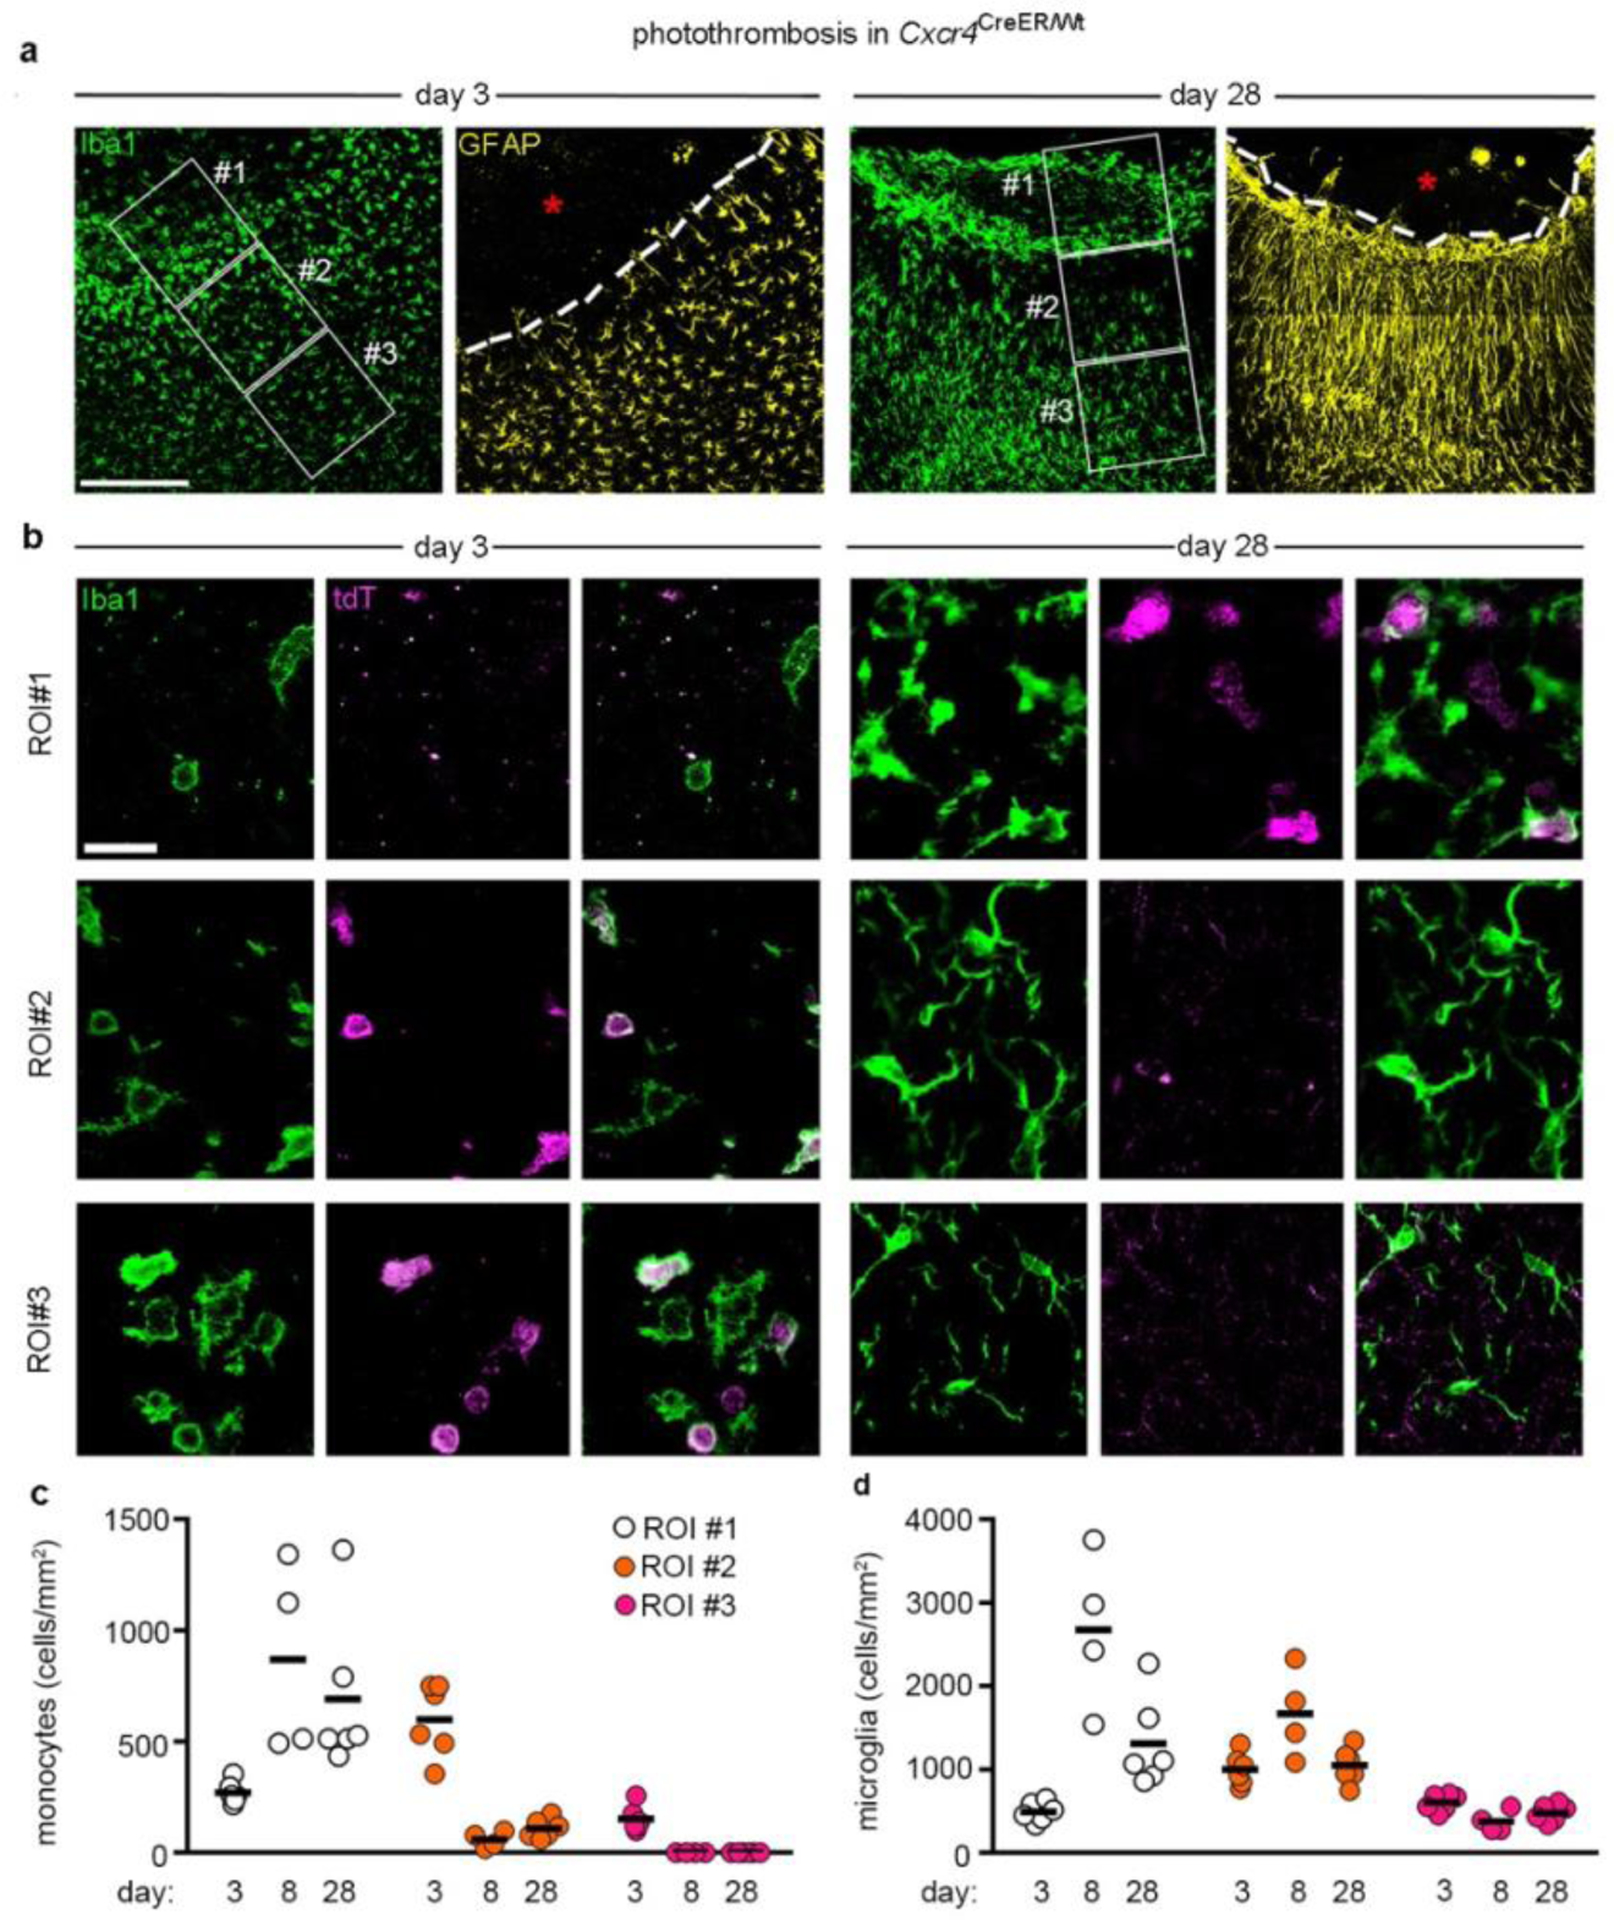
Monocytes do not persist in the peri-infarct area. a, Iba1 and GFAP immunofluorescence in the infarct boundary zone of Cxcr4CreER/wt; R26CAG-LSL-tdT mice at days 3 and 28 after PT. Iba1 and GFAP are depicted separately for the same section. The segmented line segregates the infarct from the boundary zone. Framed areas represent ROIs 1–3. Asterisks mark the infarct center. b, Confocal images demonstrate tdT+ Iba1+ monocytes and tdT− Iba1+ microglia in ROIs 1–3 at post-operative days 3 and 28. Images in (a) and (b) are representative for n=6 mice for both days 3 and 28. c,d, Graphs depicting the density of tdT+ Iba1+ monocytes (c) and tdT− Iba1+ microglia (d) in ROIs 1–3 at post-operative days 3, 8 and 28. Circles and lines represent individual mice and mean values, respectively. n=6 (day 3), 4 (day 8) or 6 (day 28) mice. Scale bars: 225 μm (a) or 25 μm (b).
Generation of Cxcr4-deficient traceable monocytes
While Cxcr4 has been implicated in inflammatory brain disorders21,23,24, its role in neuroinflammation cannot be studied in Cxcr4−/− mice because of embryonic lethality28. We therefore generated inducible conditional Cxcr4 knockout (Cxcr4 cKO) mice by combining Cxcr4LoxP and Cxcr4CreER (Cxcr4CreER/LoxP). Cxcr4CreER/Wt mice served as controls. R26CAG-LSL-tdT was included in both conditions. TAM application to Cxcr4CreER/LoxP; R26CAG-LSL-tdT mice induces Cxcr4 deletion and tdT signal in cells with an active Cxcr4 promoter. Consequently, HSCs undergoing genetic recombination generate traceable, Cxcr4-deficient monocytes, as confirmed 4 weeks after TAM treatment by quantitative PCR with reverse reanscription of sorted tdT+ monocytes and by Transwell migration assays. Numbers of circulating leukocytes and monocytes were unaltered, while granulocytes were slightly increased in Cxcr4 cKO mice (Extended Data Fig. 6a–d). The latter observation corresponds to Cxcr4-mediated retention of neutrophils in BM and peripheral tissues16,17. tdT+ proportions were reduced by 28% for neutrophils and 35% for Ly6Chigh monocytes in Cxcr4 cKOs, and a similar reduction in tdT labeling was present in HSCs of these mice (Extended Data Fig. 6e,f). The reduced tdT+ percentages of leukocytes and HSCs in Cxcr4 cKO mice most likely reflect loss of Cxcr4-deficient HSCs due to absent Cxcr4-mediated retention in BM and compensation by tdT− HSCs not undergoing recombination19,30.
Cxcr4-deficiency leads to reduced numbers and ectopia of MDM
Since Cxcl12-Cxcr4 signaling can promote or impair leukocyte entry into the brain20,21, we next assessed how Cxcr4 deficiency influences monocyte infiltration after PT. First, we analyzed MDMs with an active Cxcr4 locus by focusing on Cxcr4-IRES-GFP+Iba1+MDMs. At day 3, the density of these cells was reduced by 82.9% in the infarct in Cxcr4 cKO mice (Fig. 5a,b). Assessment of total Ly6Chigh monocytes in the ipsilateral cortex by flow cytometry confirmed that there was reduced monocyte infiltration in Cxcr4 cKO mice (Fig. 5c). Finally, the proportion of tdT+ MDMs among Iba1+ macrophages was significantly diminished in ROI 1 and ROI 2 in Cxcr4 cKO mice (Fig. 5d). Thus, Cxcr4 deficiency reduces monocyte infiltration in the infarct during the subacute phase of thrombotic stroke.
Figure 5.
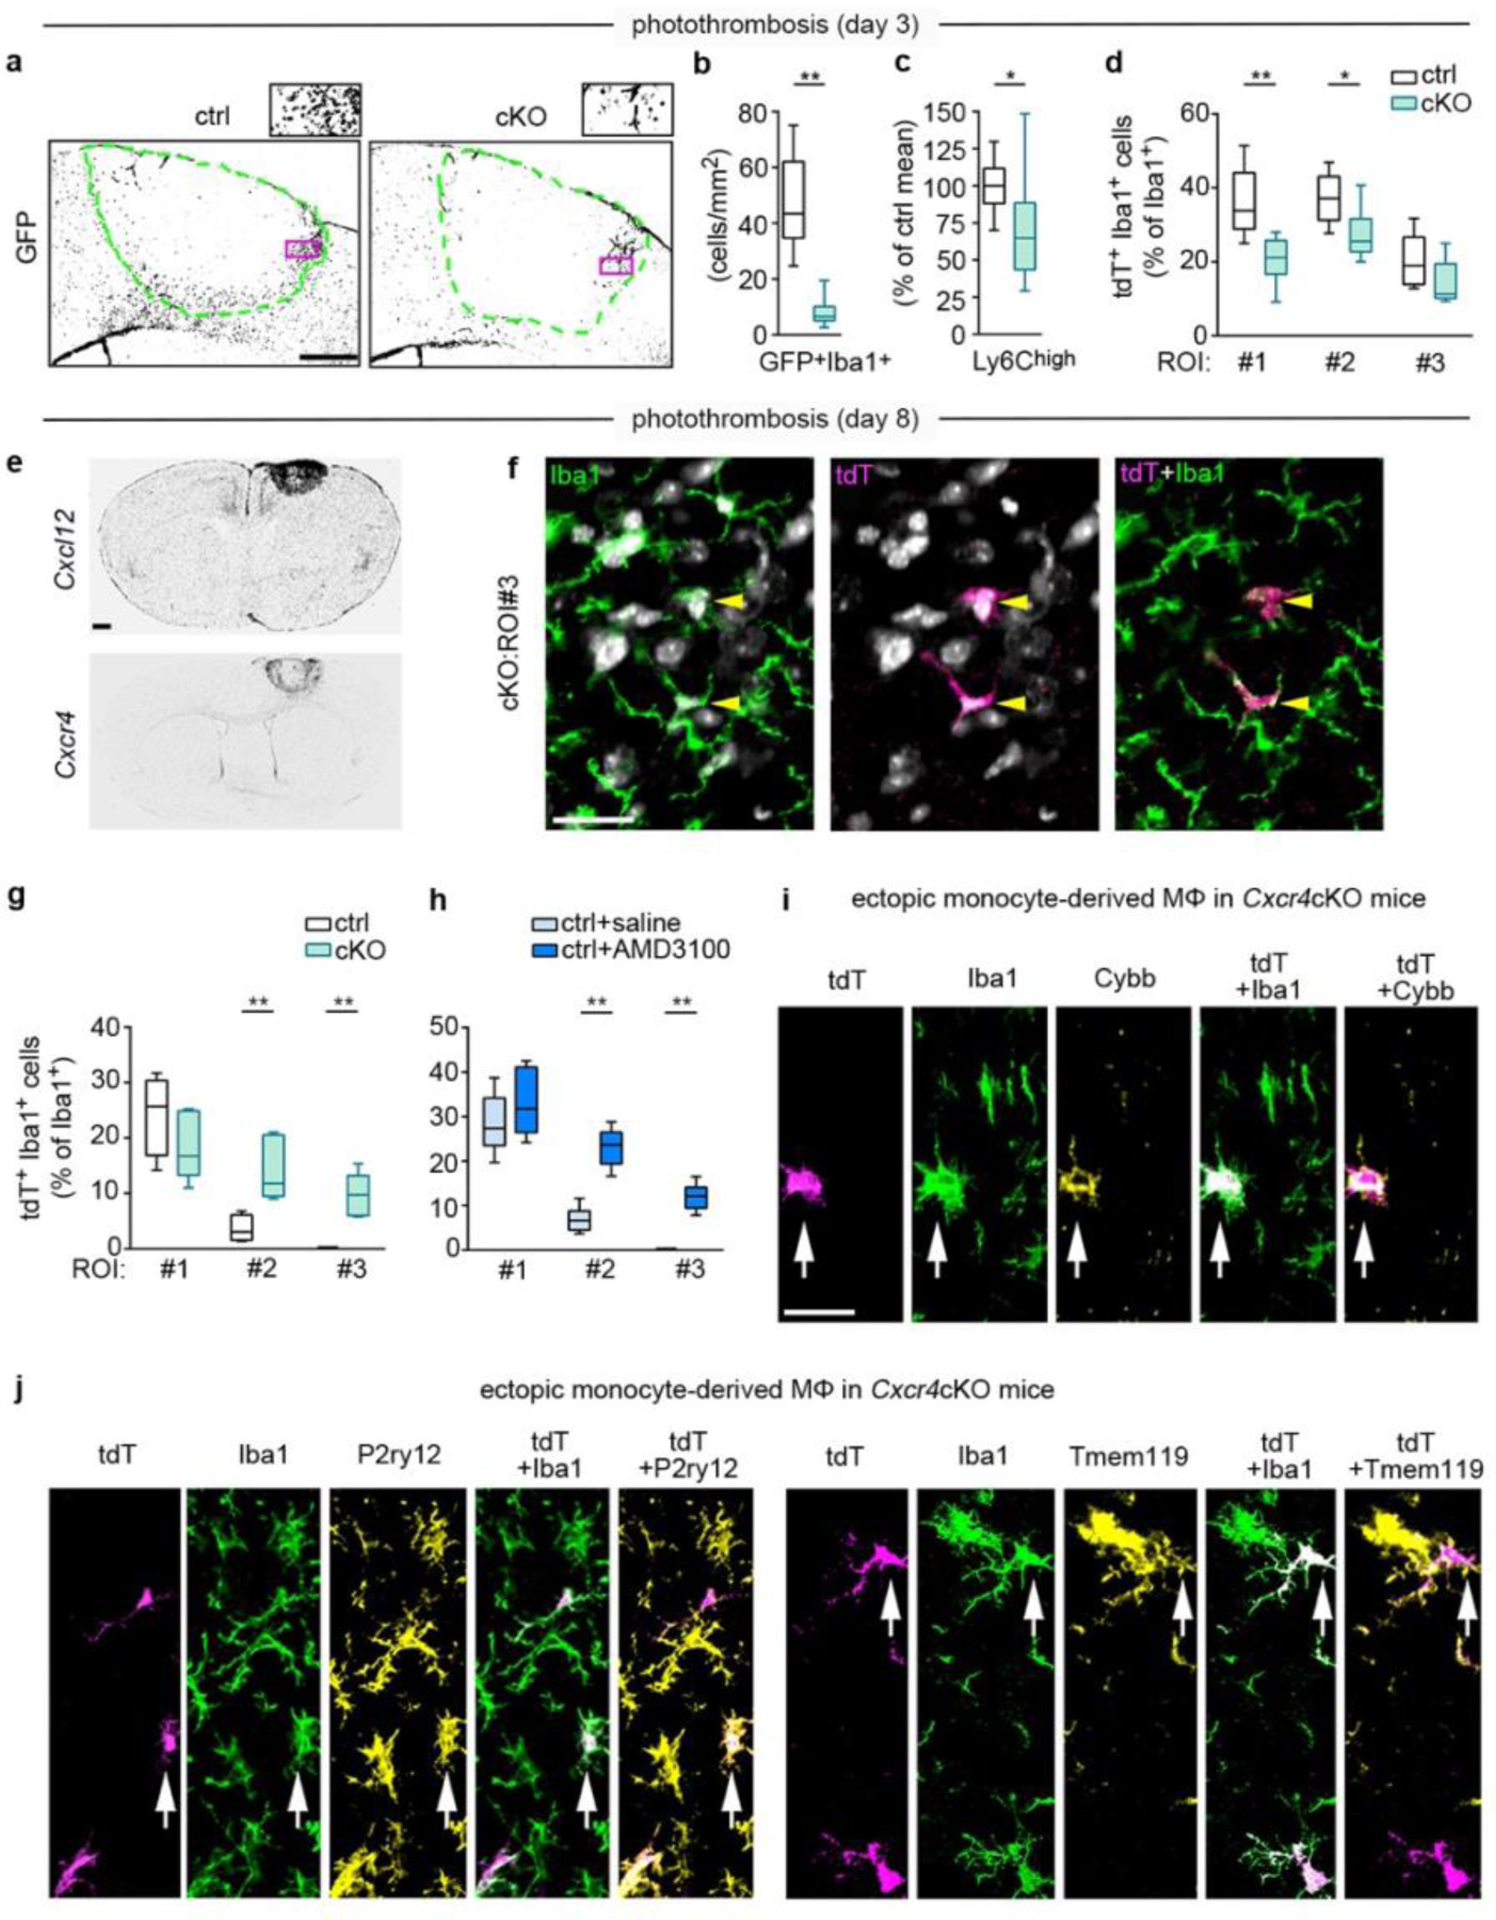
Reduced monocyte infiltration and ectopic positioning of MDMs in Cxcr4 cKO mice undergoing PT. Data represent post-operative days 3 (a–d) and 8 (e–j). a, Counterstained Cxcr4-IRES-GFP in Cxcr4 control and Cxcr4-cKO mice. Segmented lines mark the infarct boundary. Insets represent the framed areas. Images are representative for n=6 mice each. b, Quantification of the number of GFP+ Iba1+ monocytes per area of infarct by confocal microscopy (for key see d). c, Flow cytometry analysis of the number of Ly6Chigh monocytes in the ipsilateral cortex (for key see d). d, tdT+ percentage of Iba1+ cells as determined by confocal microscopy in three ROIs; ROIs are illustrated in Fig. 4a. e, Cxcl12 and Cxcr4 transcripts as detected by ISH. Images are representative for n=2 mice each. f, Confocal images of Iba1 and tdT immunofluorescence demonstrate ectopic MDMs (arrowheads) in ROI 3 of cKO mice. DAPI appears white. Image is representative for n=6 mice. g,h, tdT+ percentage of Iba1+ cells as determined by confocal microscopy. Data in h represent control mice receiving intra-infarct injection of saline or Cxcr4 antagonist AMD3100 6 h before analysis. i,j, Confocal images of tdT, Iba1, and Cybb, tdT, Iba1 and P2ry12, and tdT, Iba1 and Tmem119 immunofluorescence in the structurally intact peri-infarct area of cKO mice. Arrows identify a Cybb+ (i), a P2ry12+ (j), and a Tmem119+ (j) in MDM. Images are representative for n=6 mice each. For graphs in c,d,g and h, data were normalized to control mean. The center line represent the median, the box limits the 25th to 75th percentiles, and the whiskers the minimum to maximum values. Statistics: b, **p=0.002 (n=6 mice each); c, *p=0.027 (n=8 (Ctrl) or 9 (cKO) mice); d, **p=0.007 (ROI 1), *p=0.041 (ROI 2) (n=6 mice each); g, **p=0.0095 (ROI 2), **p=0.0095 (ROI 3) (ctrl, n=4 (Ctrl) or 6 (cKO) mice); h, **p=0.002 (ROI 2), **p=0.002 (ROI 2) (n=6 mice each); Two-sided Mann-Whitney U test. Scale bars: 250 μm (a), 500 μm (e), 20 μm (f), or 25 μm (i,j).
Having observed that Cxcl12 and Cxcr4 were highly expressed in the lesion at day 8 after PT (Fig. 5e), we hypothesized that selective placement of MDMs in late-phase photothrombotic infarcts requires Cxcl12-Cxcr4 signaling. In agreement with this, ROI 2 and ROI 3 of Cxcr4 cKO mice contained abnormally high numbers of tdT+Iba1+MDMs (Fig. 5f,g). A similar observation was made in Cxcr4 control mice receiving a stereotactically controlled intra-infarct injection of the Cxcr4 antagonist AMD3100 6 h before analysis (Fig. 5h; Extended Data Fig. 7a,b). At day 28, when a solid astrocytic scar surrounds the infarct, MDMs were no longer detected in intact peri-infarct tissue of Cxcr4cKO mice. These findings indicate that Cxcl12-Cxcr4 signaling is transiently required to attract MDMs toward thrombotic infarcts.
We then performed in situ analyses of MDMs that are ectopically placed in the peri-infarct region at day 8 after PT (Fig. 5i,j). Depending on the examined individual, 20–50% of the ectopic MDMs of Cxcr4 cKO mice were immunoreactive for the microglial markers Tmem119 and P2ry12 (Fig. 5j). Conversely, Cybb, which is enriched in MDMs at day 3 after PT (Fig. 3a), was still prominently expressed in ectopic MDMs at day 8 (Fig. 5i). Thus, MDMs that are ectopically placed in peri-infarct tissue of Cxcr4 cKO mice may assume phenotypical characteristics of microglia while retaining MDM properties.
Cxcr4-deficiency affects the microglia response after photothrombotic stroke
Next, we examined tdT−Iba1+ microglia in Cxcr4 cKO mice undergoing PT. At day 3, the microglia density in the infarct (ROI 1) was significantly lower in Cxcr4 cKO mice than in Cxcr4 controls (Fig. 6a). Concomitantly, a smaller percentage of tdT−Iba1+ cells expressed the proliferation marker Ki67 in this area (Fig. 6b). At day 8, microglia density in ROI 1 of Cxcr4 cKO mice reached that of Cxcr4 controls (Fig. 6c), which indicates that microglia had compensated the initial delay in populating the infarct.
Figure 6.
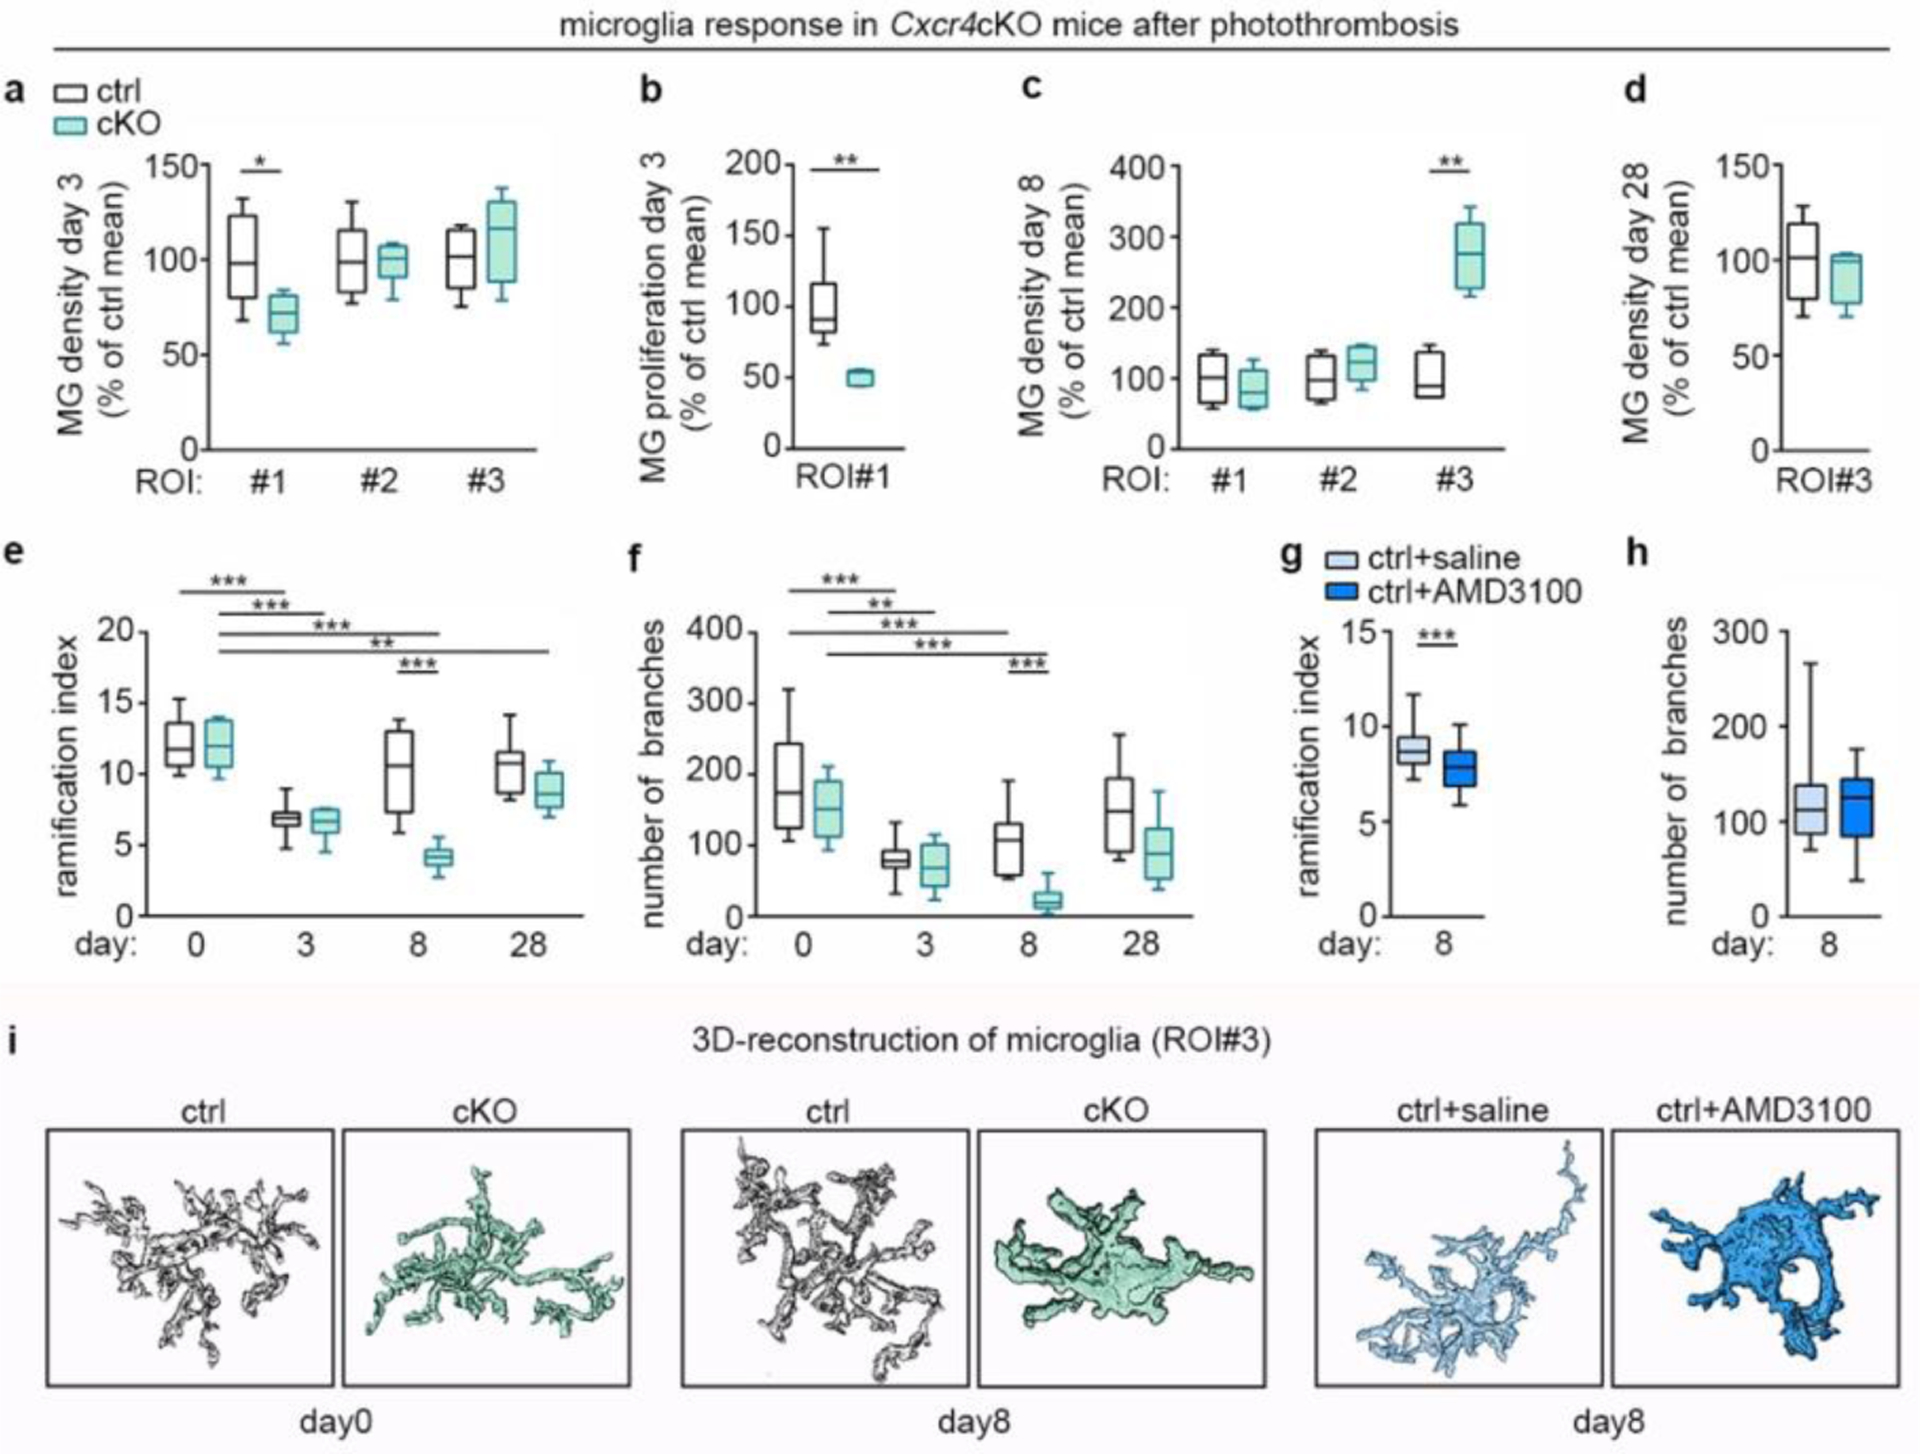
Cxcr4-deficiency affects the microglia response after PT. tdT− Iba1+ microglia were examined in the indicated ROI in Cxcr4 control and Cxcr4 cKO mice at days 3, 8 and 28 after PT using confocal microscopy. In (e), (f) and (i) day 0 represents the non-stroke condition. ROIs are illustrated in Fig. 4a. a–d, Microglia density and Ki67+ percentage of microglia in the infarct. e–h, Ramification index and number of branches of 3D-reconstructed microglia in the peri-infarct region (ROI 3). Data in g and h represent control mice receiving intra-infarct application of saline or Cxcr4 antagonist AMD3100 6 h before analysis. i, Images of 3D-reconstructed microglia at day 0 and in ROI 3 at day 8. For the graphs in a–d, data were normalized to control mean. For a–h, the center line represent the median; box limits the 25th to 75th percentiles, and whiskers the minimum to maximum values. Statistics for a–d, g and h: a, *p=0.033 (n=6 mice each); b, **p=0.004 (n=6 (Ctrl) or 5 (cKO) mice); c, **p=0.0095 (n=4 (Ctrl) or 6 (cKO) mice); d, p=0.63 (n=6 (Ctrl) or 4 (cKO) mice); g,h, ***p=0.0006 (g), p=0.95 (h) (n=32 (sham) or 26 (AMD3100) cells from 6 mice each). Two-sided Mann-Whitney U test. Statistics for e and f, p<0.0001 (e) and p=0.01 (f) for genotype-time interaction, two-way ANOVA (n=9 (day 0 Ctrl, day 3 cKO, day 8 Ctrl, day 28 Ctrl), 5 (day 0 cKO), 11 (day 3 Ctrl), 48 (day 8 cKO) or 6 (day 28 cKO) cells from n=4 mice each). ***p<0.001, **p=0.006 (e), **p=0.006 (f), Sidak’s post-test, p-values are also provided in the Nature Reporting Summary.
Notably, the peri-infarct area (ROI 3) of Cxcr4 cKO mice showed a transient increase in microglia numbers at day 8 (Fig. 6c,d), which suggests that ectopic MDMs affected the activation state of neighboring microglia. We therefore investigated the activation phenotype of tdT−Iba1+ microglia in ROI 3 by quantitative morphometric analysis (Fig. 6e–i). At day 3, the ramification index and number of branches were decreased in Cxcr4 control and Cxcr4cKO mice compared to the non-stroke condition. At day 8, microglia returned back to the ramified state in Cxcr4 controls, whereas microglia in the immediate vicinity of ectopic MDMs remained in the activated state in Cxcr4 cKO mice (Fig. 6e,f) and in Cxcr4 controls receiving intra-infarct application of AMD3100 (Fig. 6g,h). Finally, at day 28, microglia in Cxcr4 cKO mice almost returned to their steady-state morphology (Fig. 6e,f). This suggests that an early abundance of MDMs promotes microglial activation and re-population of the dead zone. Cxcr4-mediated retention of MDMs within the infarct prevents prolonged MDM-microglia interactions in intact tissue, thereby permitting microglia to return to the homeostatic condition.
Cxcr4-deficiency affects expression of immune response genes in MDM
We next addressed how Cxcr4 deficiency affects transcriptomes of brain macrophages at day 3 after PT and tMCAO by performing RNA-seq on MDMs and microglia (Supplementary Tables 2 and 3). Principal component analysis (PCA) revealed that the overall transcriptional profile of tdT+ MDMs was strongly changed in Cxcr4 cKO mice in both stroke models (Fig. 7a). In the tMCAO samples, we also analyzed tdT− MDMs, which did not undergo genetic recombination. This enabled us to distinguish between cell-autonomous and non-cell-autonomous effects of Cxcr4-deficiency. tdT−MDMs from Cxcr4 cKO mice clustered between tdT+ Cxcr4 cKO MDMs and MDMs from Cxcr4 controls (tdT+ and tdT−), which suggests that some MDM genes were indirectly affected by Cxcr4 deficiency (Fig. 7a).
Figure 7.
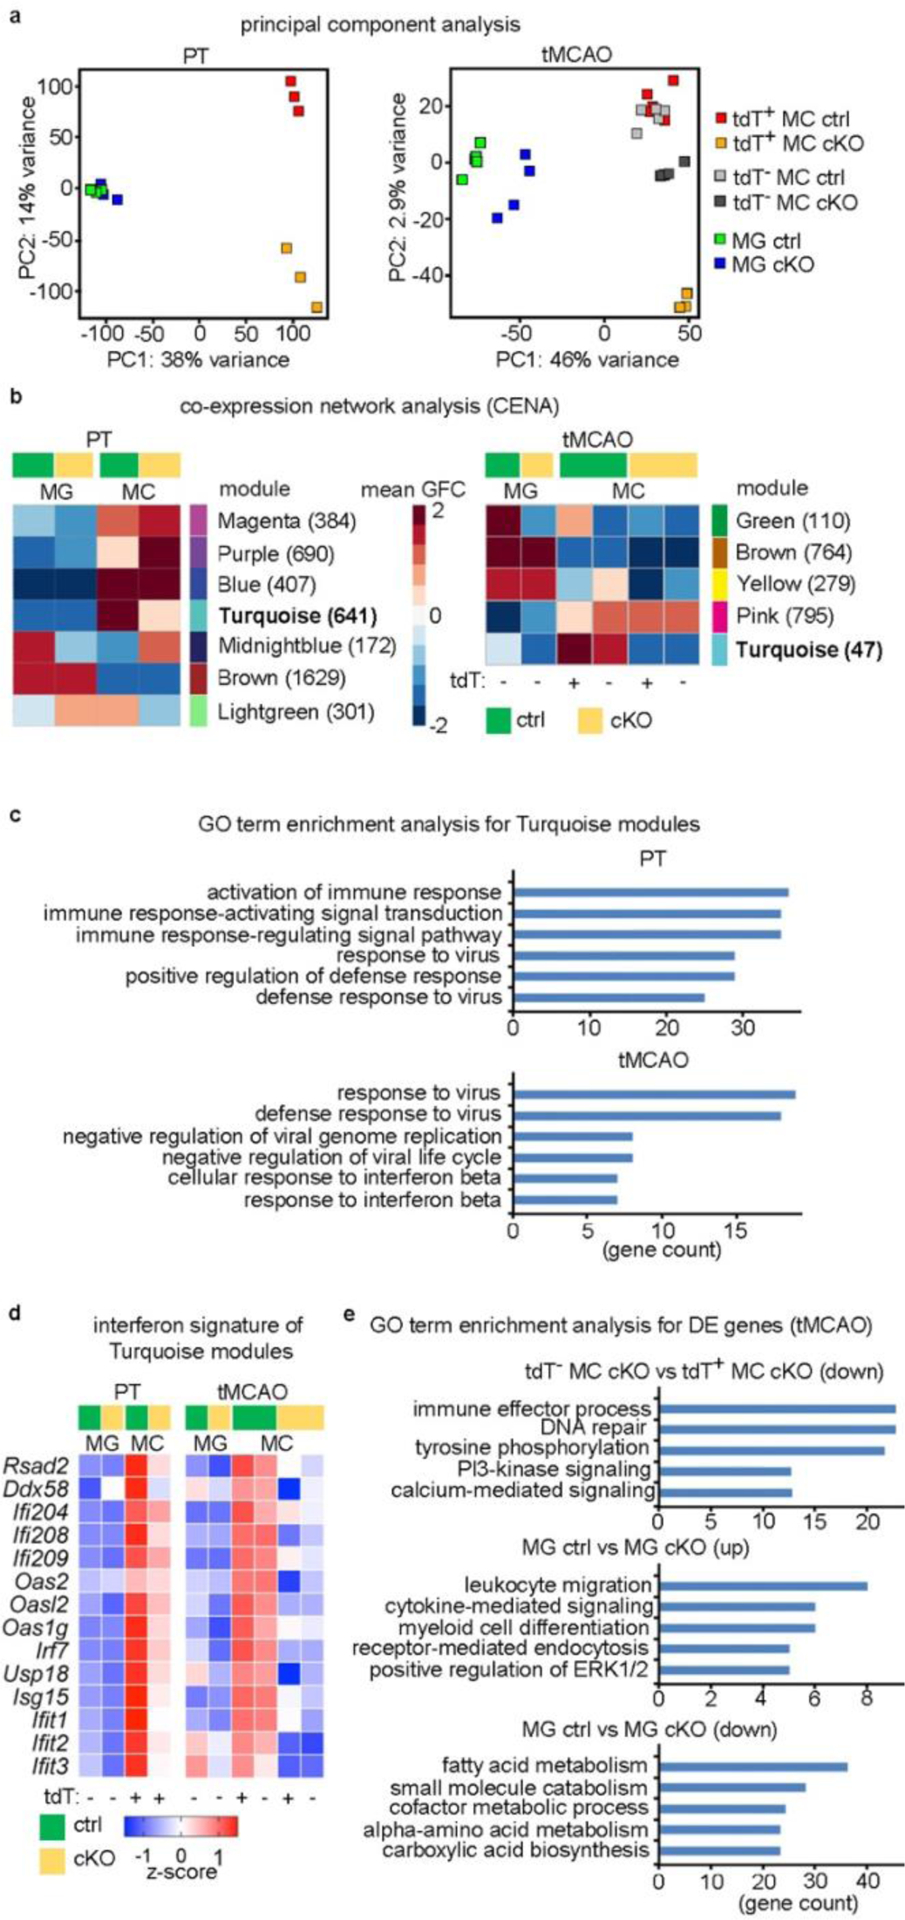
Functional changes of infiltrated monocytes due to Cxcr4-deficiency. a–e, RNA-seq analysis for tdT+ monocytes (CD11b+CD45highLy6Chigh) and tdT− microglia (CD11b+ CD45low) sorted from brains of Cxcr4 cKO and Cxcr4 control mice at day 3 after PT (n=3 mice each) and tMCAO (n=5 (Ctrl) or 4 (cKO) mice). tdT− MC were sorted and analyzed along with tdT+ monocyte and microglia for all tMCAO samples. a, PCA based on top 5000 most variable genes. b, Genes were clustered into expression modules based on their expression behavior in the experimental groups using CENA. Heatmaps display mean group-fold change (GFC) of gene expression. The number of assigned genes is shown in parenthesis. c, GO terms for Turquoise modules. d, Heatmap representation of selected genes present in both Turquoise modules shown for tMCAO. e, GO term enrichment analysis for DEGs (fold change 1.5; FDR p-value<0.05). Statistical test: GO terms in c, and e were selected from the top 10 after sorting by adjusted p-value (p-adjust<0.05, one-tail hypergeometric test with Benjamini-Hochberg correction).
For both stroke models, we then attempted to identify immune pathways that were specifically affected in Cxcr4 cKO MDMs. We used co-expression network analysis (CENA) to cluster genes into distinct modules based on how they were expressed in the different cell types and genotypes (Fig. 7b; Supplementary Table 5). This identified a module for MDM-enriched genes that were downregulated in both stroke models in Cxcr4 cKO samples (turquoise module). GO term enrichment analysis linked both Turquoise modules to defense reactions (Fig. 7c). They included genes that are involved in nucleic acid sensing and induction of the type I interferon response (for example Rsad2(also known as Viperin), Ddx58, the Pyhin gene family members Ifi204, Ifi208 and Ifi209, and members of Oas and Oasl families), key regulators of the type I interferon response (Irf7 and Usp18) and several interferon-stimulated genes (Isg15, Ift1, Ift2 and Ift3)31–33 (Fig. 7d). The effect of Cxcr4 deficiency on interferon signature genes after tMCAO was present in tdT+ and tdT− MDMs, which suggests that these responses are modulated non-cell autonomously.
CENA did not identify a module for MDM-enriched genes that are differentially expressed in tdT+ and tdT− MDM from Cxcr4 cKO mice, probably because it excludes genes that do not fit unambiguously into a certain cluster. By directly comparing tdT+ and tdT− MDMs from Cxcr4 cKO mice, we detected 507 DEGs (1.5-fold change, FDR<0.05), 501 of which were down-regulated in tdT+ MDMs. The associated GO terms were related to cell signaling and regulation of immune effector processes (Fig. 7e; Supplementary Table 2). The latter included Tlr4, the double-stranded DNA sensor and inflammasome component Aim2 and the RNA sensor Ddx58 (also known as RIG-I).
PCA and CENA (Green module) indicated differences in the microglial response between Cxcr4 cKO and Cxcr4 control mice undergoing tMCAO (Fig. 7a,b). GO term enrichment analysis for microglia DEGs (1.5-fold change, FDR<0.05) suggested that microglia from Cxcr4cKO mice overexpressed genes that are involved in or upregulated during microglial activation (for example Trem2, Tyrobp, and Gpr84, Aif1(also known as Iba1), C1qb and Cx3cr1) as well as genes that are important for leukocyte migration and chemotaxis (for example, Ccl3, Ccl4 and Ltc4s). Genes involved in homeostatic cellular metabolism were downregulated in microglia from Cxcr4 cKO mice (Fig. 7e; Supplementary Table 2). These transcriptome analyses show that Cxcr4 deficiency reduces the expression of genes involved in pattern recognition and the type I interferon response in MDMs and influences the activation state of microglia after stroke.
Cxcr4-deficiency leads to deteriorated outcome after tMCAO
Finally, we assessed outcome and monocyte infiltration in Cxcr4 cKO mice undergoing tMCAO. Compared to Cxcr4 controls, Cxcr4 cKO mice exhibited higher neurological deficits at days 2 and 3 (Fig. 8a). The deteriorated outcome corresponded to an increased infarct volume at day 3 (Fig. 8b). There were no differences in infarct volume between Cxcr4 cKO and Cxcr4 control mice at day 2 (Fig. 8b), which suggests that the increased lesion at day 3 results from secondary damage. When determining infarct size, we noticed that subthalamic and hypothalamic areas involved in body homeostasis were affected in a larger percentage of Cxcr4 cKO than Cxcr4 control mice (43% versus 21%, Extended Data Fig. 8a), which might explain the general state of deterioration of the Cxcr4 cKOs animals. In concordance with results from the PT model, Cxcr4 cKO mice presented with reduced monocyte infiltration at days 1, 2 and 3 (Fig. 8c–f). At day 1, this was apparent in distinct peri-infarct areas, such as the olfactory tubercle (Fig. 8c; Extended Data Fig. 8b). At day 2, when tdT+ infiltrates populate the entire infarct, Cxcr4 cKO mice exhibited a 76% reduced density of tdT+Iba1+MDMs per area of infarct (Fig. 8d). Reduced numbers of tdT+ MDMs in Cxcr4 cKO mice may, at least in part, be due to the lower recombination efficiency or tdT labeling in monocytes of Cxcr4 cKO mice (Extended Data Fig. 6e). We therefore assessed total CD45highCD11b+Ly6Chigh monocyte infiltration in the ipsilateral forebrain at day 3 using flow cytometry, which showed a 69% reduction in Cxcr4 cKO mice (Fig. 8e). Thus, Cxcr4-deficient mice undergoing tMCAO exhibit reduced monocyte infiltration from day 1 onward. This is associated with a larger neurological deficit and an increase in lesion volume at day 3.
Figure 8.
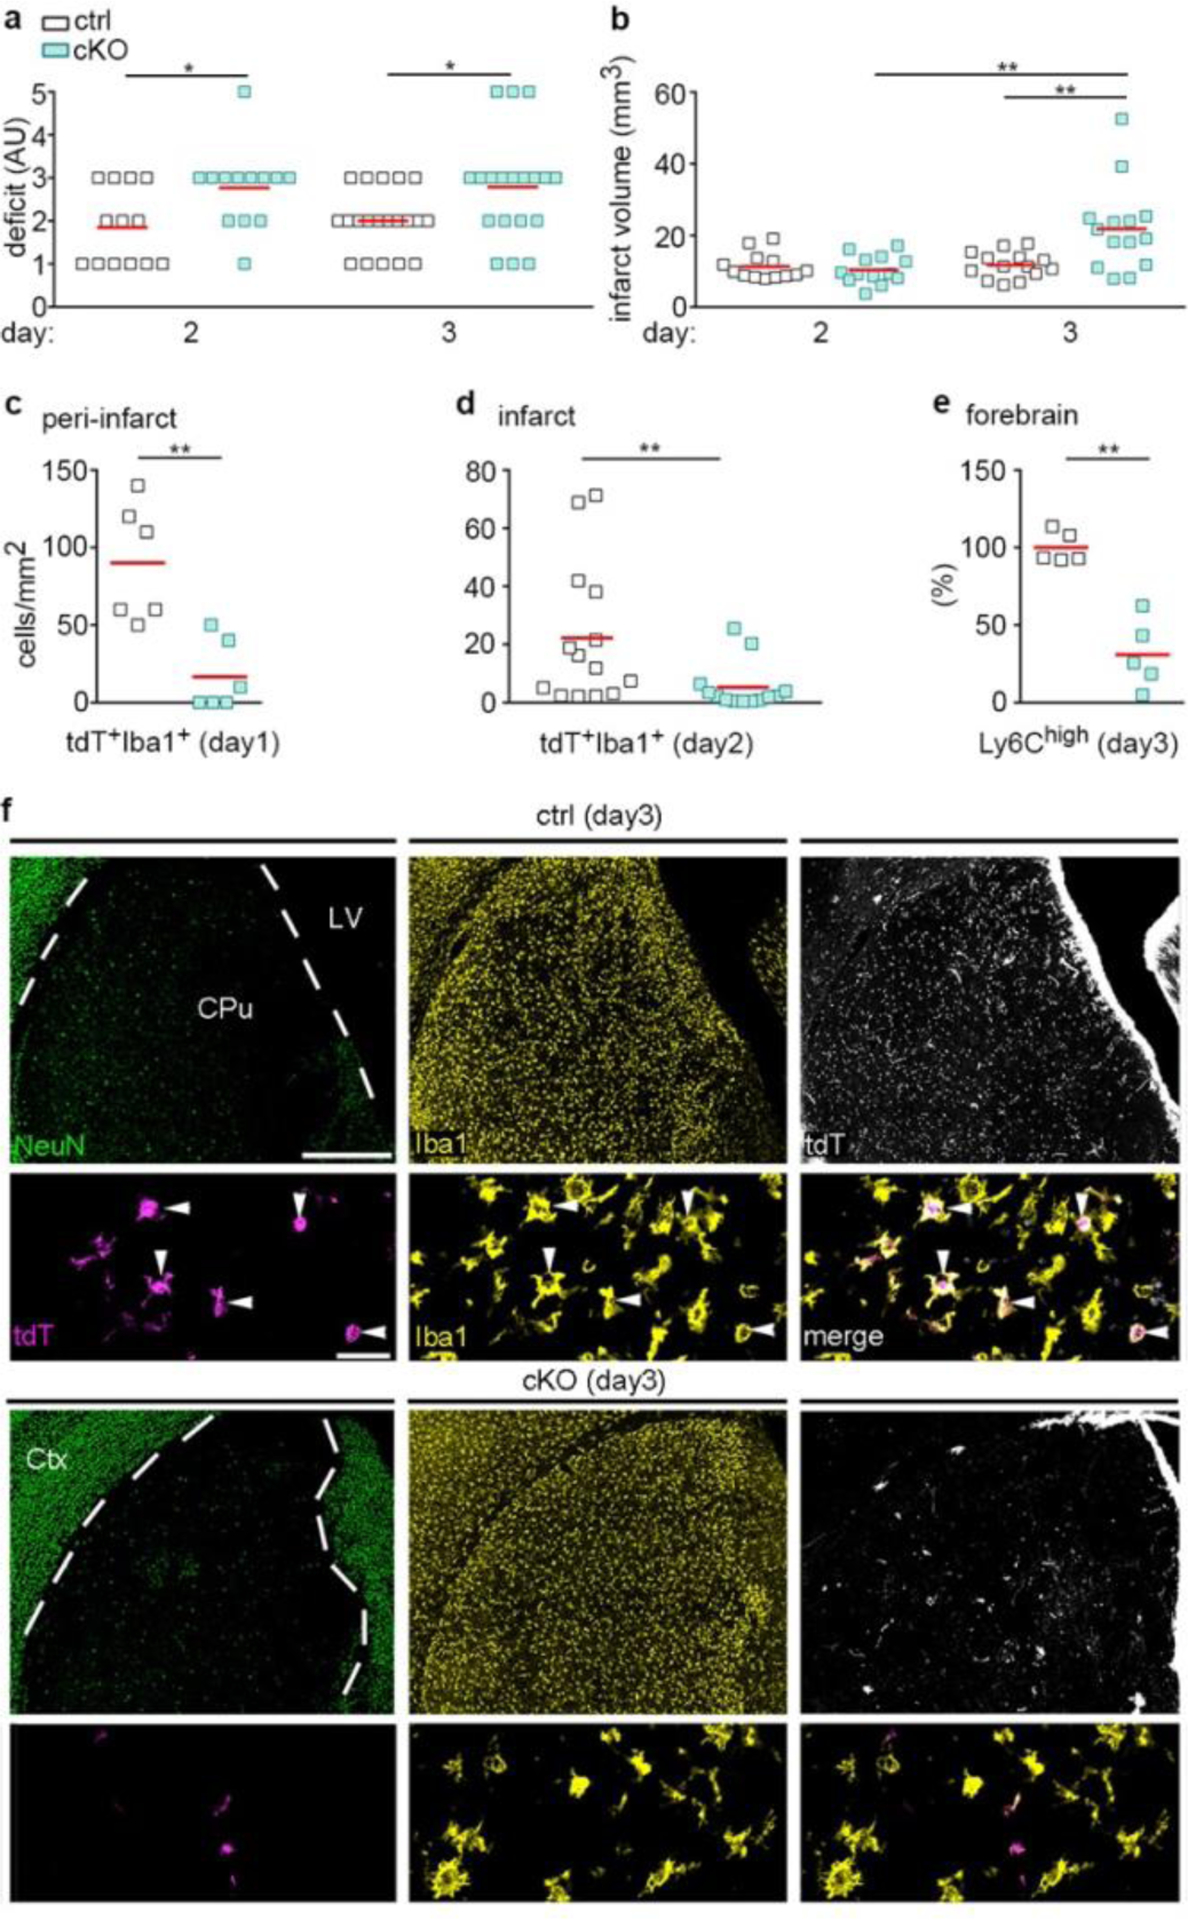
Cxcr4-deficiency leads to deteriorated outcomes after tMCAO. tMCAO was induced in Cxcr4 control and Cxcr4 cKO mice. a, Neurological deficit in arbitrary units (AU). b, Infarct volume. c,d, Density of tdT+Iba1+ monocytes in the peri-infarct region in the olfactory tubercle at day 1 (c) and in the infarct at day 2 (d). e, Flow cytometry analysis of the number of Ly6Chigh monocytes in the forebrain at day 3 expressed as percent of control mean. f, NeuN, Iba1 and tdT immunofluorescence of control mice (Ctrl, upper two panels) and Cxcr4 cKO (cKO, lower two panels) demonstrate reduced infiltration of tdT+Iba1+ monocytes (arrowheads) in the NeuN− infarct of Cxcr4 cKO mice at day 3. The upper rows demonstrate the infarct of Ctrl and cKO mice at low magnification, the lower rows are high magnification views. The segmented line delineates the boundary of the infarcted caudate putamen. Images are representative for n=11 mice (ctrl) or 10 (cKO) mice. Scale bars, 500 μm (upper rows) or 30 μm (lower rows). For graphs in a–e, squares and red lines represent individual mice and mean values, respectively. Statistics (two-sided Mann-Whitney U-test): a, day 2: *p=0.034 (n=13 mice each), day 3: *p=0.021 (n=20 (Ctrl) or 19 (cKO) mice); b, **p=0.009 (ctrl versus cKO), **p=0.001 (cKO day 2 versus cKO day 3); c, **p=0.004 (n=6 mice each); d, **p=0.005 (n=14 (Ctrl) or 13 (cKO) mice); e, **p=0.008 (n=5 mice each).
Discussion
In this study, we generated and characterized a Cxcr4CreER allele. By using Cxcr4-CreER for fate mapping, we found that Cxcr4 is active after gastrulation (at E6.5) in cells giving rise to HSCs and microglia. This changed with onset of hematopoiesis in the aorta-gonad-mesonephros, as from E9.5 onward, Cxcr4-CreER traced cells originating from definite hematopoiesis, but no longer microglia. The absence of Cxcr4 expression in fetal microglia is in accordance with normal microglia development in Cxcl12-deficient and Cxcr4-deficient mice (this report) and Cxcr4-deficient zebrafish24.
The Cxcr4CreER; R26CAG-LSL-tdT model offers the advantages that recombination can be induced in long-term self-renewing myeloid progenitors under healthy conditions. Since HSC-derived myeloid cells remain traceable for at least 6 months after TAM administration, this temporally controlled approach is universally applicable and preferable to cell labeling with constitutive Cre, the expression of which is potentially influenced by pathology. Furthermore, the Cxcr4CreER; R26CAG-LSL-tdT model is more reliable than transcriptional reporters because the CAG promoter in R26CAG-LSL-tdT is ubiquitously active and lacks regulatory elements. With Cxcr4 absent in diverse populations of tissue-resident macrophages, such as Kupffer cells and Langerhans cells, Cxcr4-CreER will be useful to discriminate HSC-derived from EMP-derived macrophages also outside the brain.
Using the Cxcr4 signature to study monocyte infiltration in experimental stroke, we found that monocyte infiltration occurs both in the peri-infarct area and in the infarct center after tMCAO. This is different after permanent PT, where the initial infiltration occurs mainly in the peri-infarct region. Microglia that reside in the infarct survive the ischemic episode of tMCAO, but perish after PT. Microglia then repopulate the PT-induced infarct along with MDMs. Cxcr4 cKO mice undergoing PT exhibit reduced monocyte infiltration, which is associated with reduced microglial proliferation, and suggests that MDMs might promote repopulation of the infarct by microglia. In support of this, RNA-seq indicated that distinct microglia-activating mediators such as Cybb-derived reactive oxygen species and interleukin-1β34 are mainly provided by MDMs after PT. We further describe that MDMs perish in the peri-infarct area and become confined to thrombotic infarcts during the repair phase when Cxcl12 is upregulated in the infarct. In conjunction with the finding that Cxcr4-deficiency permits MDMs to enter the peri-infarct area during the repair phase, this suggests that Cxcl12-Cxcr4 signaling attracts MDMs to late-phase thrombotic infarcts. In support of this, intra-infarct application of a Cxcr4 antagonist at day 8 increased the MDM number in peri-infarct tissue. In the late phase (day 28), Cxcr4 is no longer needed to confine MDMs to thrombotic infarcts, probably because they are then enclosed by an astroglial scar. MDMs that gain access to the peri-infarct area after Cxcr4 inhibition or Cxcr4 are ablation are surrounded by microglia exhibiting an abnormally high morphological activation state. This suggests that MDMs perpetuate microglial activation in the peri-infarct area until they are cleared by an as yet unknown mechanism.
Cxcr4cKO mice exhibit a deteriorated outcome after tMCAO. As only few neurons were targeted by Cxcr4-CreER in the forebrain and the infarct volume was changed in Cxcr4 cKOs on day 3 but not on day 2, it seems unlikely that Cxcr4 deficiency had a direct influence on the initial ischemia-induced neurodegeneration. Rather, the poor outcome of Cxcr4 cKO may be related to secondary damage. It was suggested that both, MDMs and microglia can be beneficial or detrimental after stroke, depending on their activation state35–39. We assume that Cxcr4 influences stroke pathology by recruiting monocytes that cooperate with microglia to limit secondary damage and neuronal dysfunction40. In support of this, Cxcr4-deficiency affects the microglia transcriptome at day 3 after tMCAO, as exemplified by increased expression of pro-inflammatory genes such as C1qb, Ccl3, Ccl4 and Ltc4s and decreased expression of genes involved in metabolism. Since Cxcr4-CreER is inactive in microglia, these effects are indirect, probably due to reduced MDM-microglia interactions. We further show that MDMs in the Cxcr4 cKO brain exhibit decreased expression of multiple genes that orchestrates the type-I-interferon-activated state. Genes involved in recognition of danger-associated molecular patterns and mounting cytokine and interferon responses (for example nucleotide-sensing molecules of the OAS and Pyhin families, Aim2, Ddx58 and Tlr4) as well as Irf7, a key differentiation factor regulating the inflammatory state of brain macrophages31–33,41, were either directly or indirectly affected by Cxcr4 deficiency. Given that type-I-interferon-mediated modulation of the inflammatory response improves outcome after tMCAO42, this links Cxcr4 to a protective immunological defense reaction.
In summary, our anatomical and transcriptome analyses help dissect the contribution of MDMs to the innate immune response after stroke. MDMs are equipped with a characteristic gene set, which allows them to communicate via MDM-specific antigen presenting molecules, paracrine mediators, and receptors. The latter include Cxcr4, which regulates the regional distribution of MDMs and the expression of defense response genes in MDMs. Cxcr4 ablation reduces monocyte infiltration after tMCAO, which is associated with a deteriorated outcome and altered molecular responses of MDMs and microglia.
Methods
Mouse strains and genotyping.
Cxcr4−/−, Cxcr4-GFP, Cxcr4LoxP, and Cxcl12−/− mice have been previously described18, , 28, 43–45. A Cxcr4CreER(T2)-IRES-eGFP knockin allele (Cxcr4CreER) was generated (Genoway) and genotyped as shown in Extended Data Fig. 3. For targeting vector construction, fragments of 2.9 kb, 3.8 kb and 3.3 kb containing the distal promoter sequence, the sequence upstream of exon 1, and the sequence downstream of exon 1, respectively, were amplified by PCR using C57BL/6J embryonic stem (ES) genomic DNA as template and subcloned into the pCR4-TOPO vector (Invitrogen). A CreER(T2)-IRES-EGFP cassette and a FRT-flanked neomycin cassette were inserted in 5′ of the 3.3 kb fragment. The linearized construct was electroporated into C57BL/6J mouse embryonic stem (ES) cells. After selection, targeted clones were identified by PCR and further confirmed by Southern blot. The positive ES cell clones were injected into C57BL/6J blastocysts and gave rise to male chimaeras. Heterozygous Cxcr4CreER mice devoid of the neomycin cassette were obtained by breeding with C57BL/6J mice expressing Flp-recombinase. The following primers were used for genotyping of Cxcr4-CreER mice: Cxcr4-upper 5′-agtgaaacctctgaggcgtttggt-3′, Cxcr4-lower 5′-tctgaacccgtcccactcaactta-3′, Cxcr4-CreER 5′-tagagcctgttttgcacgttcacc-3′ (Extended Data Fig. 3). With CreER inserted into exon1, Cxcr4CreER does not produce functional Cxcr4. Cxcr4CreER/CreER mice are fully deficient in Cxcr4 as verified by immunohistochemistry. Cxcr4CreER males were bred to females of the R26CAG-LSL-tdT Cre-reporter strain Ai1446 and to Cxcr4LoxP; R26CAG-LSL-tdT females, thus generating Cxcr4CreER/wt;R26CAG-LSL-tdT control and Cxcr4CreER/LoxP;R26CAG-LSL-tdT inducible Cxcr4cKO mice used in experiments. Embryos and mice of either sex were used. Cxcr4-GFP mice were kept on CD1 and all other mice on C57BL/6 background under specific-pathogen-free conditions receiving food and water ad libitum. Animal procedures were performed in adherence to our project licenses issued by the Institutional Review Board (IACUC 15-04-006) from MSKCC or by the federal state Thueringen (TLV administrative authorization number 02-77/14 and 02-75/16).
Administration of TAM.
TAM was prepared 1:10 (w/v) in ethanol (Carl Roth #5054) and adjusted to 10 mg/ml in corn oil (Caelo #7284). For CreER induction of adult animals, 0.1 ml TAM was administered i.p. on 5 consecutive days. For pulse-labeling of embryos, pregnant females received 0.1 ml TAM (i.p.) at the embryonic stages specified in the Results (the embryonic stage was estimated considering the day of vaginal plug formation as E0.5). TAM-treated mice subjected to experimental stroke were at least 3 months old when receiving TAM. Mice underwent at least 28 d TAM washout before stroke induction.
Surgery.
Stroke experiments were performed with mice>3 months of age. Surgery was carried out using 1.8% isoflurane (CP-Pharma #1214), 70% O2, and 200 mg/kg metamizole (Serumwerk Bernburg #11182642) for anesthesia. Photothrombotic infarcts 47 were induced with a KL 1500LCD cold light source set to 3200 K and mechanical aperture D (Schott). Mice were immobilized in a stereotaxic frame and received 0.1 ml of 10 mg/ml Rose Bengal (Sigma-Aldrich) in 0.9% NaCl (WDT 02/18#68) i.v. 5 min before placing a fiber optic bundle (1.3 mm aperture) for 15 min onto the exposed skull. Coordinates corresponded to the right forelimb sensorimotor cortex (0.5 mm anterior to bregma and 1.8 mm lateral to midline). Stereotactically controlled intrainfarct injection of 2.4 μl AMD3100 (12 μg) or saline was performed at day 8 after PT 6 hours before analysis using the following coordinates: 0.5 mm anterior to bregma, 1,3 mm lateral to midline, 1,5 mm ventral. tMCAO was induced using the intraluminal filament technique 48. A 7–0 medium MCAO suture Re L56 nylon monofilament (Doccol Corp) was inserted into the internal carotid artery and left in situ for 45 min. Operation time per animal did not exceed 15 min. Animals were briefly reanesthetized with isoflurane before the occluding filament was withdrawn. Mice received metamizole for analgesia during the first 3 d after surgery. Animal outcome was scored as described49 using a modified score (0: no deficit; 1: contralateral forelimb flexion impaired; 2: flexion impaired and decreased resistance to lateral push; 3: circling; 4, spinning; 5: no response to handling or abort criterion reached). Abort criterion was defined as >20% weight loss compared to pre-stroke or apathetic/moribund appearance.
Preparation of cell suspensions and flow cytometry.
Animals were killed by exposure to 5% isoflurane. Embryos were washed in 4°C phosphate-buffered saline (PBS, Invitrogen) and dissected under a Leica M80 microscope. Blood was collected from adult mice by cardiac puncture or via the tail vein. BM was collected by flushing one leg with 5 ml RPMI (Invitrogen). For flow cytometry, organs were incubated in PBS containing 1 mg/ml collagenase D (Roche), 100 U/ml DNase I (Sigma), 2.4 mg/ml dispase (Invitrogen), and 3% FCS (Invitrogen) at 37°C for 30 min prior to mechanical disruption. For embryonic tissues, dispase was omitted and time at 37°C reduced to 15–20 min before a 100 μm filter was used for mechanical disruption. Cell suspensions were centrifuged at 320g for 7 min, resuspended in FACS buffer (0.5% BSA, 2 mmol/l EDTA in PBS) containing purified anti-CD16/32 (1:100) and 5% each of normal mouse, rat, and rabbit serum. Incubation was performed for 15 min at 4°C. Brain cell suspensions were prepared with the neural tissue dissociation kit (P) and gentleMACS dissociator (Miltenyi) from mice undergoing transcardial perfusion. Suspensions were passed through a 100 μm cell strainer. Cells were then collected in FACS buffer, centrifuged at 320g for 7 min, resuspended in 30% Percoll/HBSS and centrifuged at 1000g for 15 min, washed in HBSS and resuspended in FACS buffer containing 5% BSA. Samples were immunostained with antibody mixes for 30 min at 4°C and passed through a 40 μm strainer immediately before sorting and analyzing with a BD FACSAria Fusion or LSRFortessa and BD FACSDiva (v8.0.2) and FlowJo (v10.1, LLC) software. CD3+, CD19+, and Ly6Ghigh cells were excluded before using CD11b, CD45, and Ly6C to define microglia and monocytes in brain samples. Flow cytometry antibodies are detailed in Supplementary Table 6. Single live cells were gated on the basis of dead cell exclusion (DAPI or Hoechst), side (SSC-A) and forward scatter (FSC-A) gating, and doublet exclusion using forward scatter width (FSC-W) against FSC-A. MΦ and monocyte populations were identified after gating on CD45 based on expression of F4/80, CD11b, Ly6C, and GFP or tdT, depending on the mouse model.
Immunohistology.
Adult mice were killed by 5% isoflurane and then transcardially perfused with PBS followed by 4% formaldehyde/PBS (pH 7.4). Embryos were decapitated and immersed in the same fixative. Cryosections (40 μm) were cut after cryoprotecting the tissues in 10% and 30% sucrose/PBS. Sections were stored and processed in a 10 mmol/l Tris, 10 mmol/l phosphate, 155 mmol/l NaCl working buffer (WB) adjusted to pH 7.4. Successive 30 min incubations with 50% methanol containing 0.3% H2O2 and 5% BSA containing 0.3% Triton-X100 were carried out in WB before applying primary antibodies for 24–72 h and secondary antibodies for 2 h in in WB containing 1% BSA and 0.3% Triton-X100. All images were captured with the LSM 510Meta using ZEN software (v5.0.0.276; Carl Zeiss Jena). Images were processed using ImageJ (v1.47) and Adobe Photoshop 6.0. Antibodies are listed in Supplementary Table 6. Signal amplification using biotinylated secondary antibodies and fluorescent streptavidin was used to detect Cxcr4-IRES-GFP, Tmem119, Iba1, Cybb, F4/80, and CXCR4.
Image analysis.
Confocal images used to assess overlap of Cxcr4, GFP, tdT or tdT/Ki67 with F4/80+, Iba1+ or Tmem119+ cell populations were acquired at 1 airy unit in sequential scan mode using a 40x, 1.3 NA oil objective. Developmental expression of Cxcr4 and Cxcr4-GFP in microglia was assessed for ≥50 Iba1+ cells per mouse. Microglia were randomly selected in the cerebral cortex, ventral telencephalon, and diencephalon. Layering of Iba1+ microglia in the cortex of E16.5 Cxcr4-deficient mice and control littermates were evaluated in 2×2 tile-scan images captured at 1 airy unit with a 20x, 0.5 NA objective (810,000 μm2) using DAPI to allocate cortical layers. For a given image, the number of microglia per layer was expressed as percentage of all counted microglia. Contribution of Cxcr4-CreER-labeled cells to microglia during development was determined in Cxcr4CreER/wt; R26CAG-LSL-tdT mice by assessing counterstained tdT in at least 100 microglia per mouse with at least 25 tdT+ cells evaluated each in the cerebral cortex, ventral telencephalon, diencephalon, and spinal cord. F4/80 was used as microglia marker in embryos and Iba1 in perinatal and postnatal mice. Overlap of counterstained Cxcr4-GFP or tdT with Tmem119 or Iba1 in day 3 infarcts was determined by evaluating at least 50 stained cells per condition and mouse. The Ki67+ percentage of monocytes and microglia in day 3 infarcts was determined by assessing Ki67 signal in all tdT+ Iba1+ and all tdT− Iba1+ cells per view-field (≥50 cells per mouse). Engraftment of monocytes in the brain of mice undergoing photothrombotic stroke was assessed in 3 ROIs in sections stained for GFAP, Iba1, and tdT. ROIs#1-#3 were placed as illustrated in Fig. 4a. All Iba1+ cells in a given 50,625 μm2 ROI were assessed for tdT signal. The number of monocytes (Cxcr4-IRES-GFP+ Iba1+ or tdT+ Iba1+) per area of infarct was determined for Cxcr4cKO and Cxcr4-control mice by counting all positive cells in the infarct. The infarct area was determined by co-staining for NeuN in the same section. Cell counts were divided by the infarct area. Infiltration of tdT+ Iba1+ monocytes at day 1 after tMCAO was evaluated in a 40x view-field placed in the NeuN+ olfactory tubercle by a researcher unaware of the experimental group. ImageJ software was used for cell counting and area measurements 50. For quantification of infarct volume, brains were serially cut and stained for NeuN in 240 μm intervals. Stained sections were imaged using LSM510 with a 10x objective and the tile scan option. The infarct area was measured by a researcher unaware of the experimental group using ImageJ. Infarct volume was calculated from the sum of the infarct areas x section interval. Microglia morphometric analysis was performed with MotiQ51, a custom-made plugin for ImageJ. MotiQ thresholder (v0.1.2) was used to create figures from immunofluorescences for the MotiQ analyser (v0.1.3). The 3D microglial ramification index is defined as: cell surface area/(4π*((3*cell volume)/(4π))2/3.
In situ hybridization.
cDNAs used for in vitro transcription were generated by reverse transcription PCR and cloned into the pGEM-T Easy vector (#A137A, Promega). cDNA for Ifi207 corresponds to nucleotides 864 to 2140 of NM_001204910.1, the other cDNAs correspond to probes in the Allen Mouse Brain Atlas 52. Probes are listed in Supplementary Table 6. Probes for Cxcr4, C1qb and Cxcl12 as well as hybridization, washing, and detection procedures were described 25.
Transwell migration assay.
BM was isolated from femur and tibia as described 53. Erythrocytes were lysed by resuspension of the BM cell pellet in ACK buffer (Gibco). Cells were again pelleted, resuspended in 0.2% BSA/PBS and pipetted through a 70 μm cell sieve. CD11b+ cells were enriched from the single cell suspension using CD11b beads (Miltenyi Biotec). Transwell assays were done in Corning inserts (#3421). Per insert, 200,000 cells were applied in 0.2% BSA/DMEM. The bottom well was supplied with BSA/DMEM plus 40 nM Cxcl12 or with BSA/DMEM plus vehicle. Three wells were analyzed per animal and condition. Cells were allowed to migrate for 90 min at 37°C. Cells in the bottom well were stained using Calcein AM (Sigma), washed in PBS, pelleted, transferred to a 96 well plate (Greiner #655090), photographed at 5x mag (6 images per well) and counted automatically with ImageJ. The migration index for Cxcl12 represents the number of cells migrating in the presence of Cxcl12 as percentage of the number of cells migrating in the presence of vehicle. Findings were confirmed by measuring signals at 495 nm in a FlexStation3 microplate reader.
Quantitative PCR.
Total RNA was prepared with the RNeasy micro kit (Qiagen) from tdT+ monocytes sorted from blood into RLT buffer based forward and side scatter behavior. cDNA synthesis and PCR were carried out using Superscript IV and Sybr Select Master Mix (ThermoFisher). Cxcr4 and Actb transcripts were amplified on a LightCycler Instrument (Roche). Relative Cxcr4 expression (Cxcr4/Actb ratio) was calculated using the delta delta CT method with amplification efficiencies of 2.0 (Cxcr4) and 1.7 (Actb) determined experimentally for both genes with serially diluted cDNA. The following primers were used: Cxcr4_forward 5′-ccatggaaccgatcagtgtgagta-3′, Cxcr4_reverse 5′-ttgtccgtcatgctccttagcttc-3′, Actb_forward 5′-aagagctatgagctgcctga-3′, Actb_reverse 5′-acggatgtcaacgtcacac-3′.
RNA-seq analysis of monocytes and microglia from Cxcr4-GFP mice.
Four samples each of infiltrated Cxcr4-GFP+ monocytes (CD3− CD19− Ly6Glow CD11b+ CD45high Ly6Chigh) and Cxcr4-GFP− microglia (CD3− CD19− Ly6Glow CD11b+ CD45low) were obtained by FACS at day 3 after PT and lysed in TRIZOL (Invitrogen). Total RNA was extracted using a RNeasy micro kit (Qiagen). Quantity and quality (RINe) of the RNA were assessed via the HS RNA analysis screen tape assay on a 4200 TapeStation system (Agilent Technologies). Total RNA was converted into double stranded cDNA libraries as a template for high-throughput sequencing using the Ovation SoLo RNA-Seq kit (NuGEN Technologies). Briefly, DNA was digested and first strand DNA was synthesized using random hexamers. After second strand synthesis, ends were repaired followed by adaptor ligation and PCR preamplification. NuGEN proprietary AnyDeplete probes were added to selectively block fragments originating from ribosomal RNA from amplification in the subsequent PCR reaction. Size-selection and purification of cDNA fragments of approximately 200–500 bp in length was performed using AMPure XP beads (Beckman-Coulter). Size-distribution of cDNA libraries was measured using the HS D1000 DNA assay on a 4200 TapeStation system (Agilent Technologies). cDNA libraries were quantified using the KAPA Library Quantification Kit (Kapa Biosystems). After cluster generation on a cBot (Illumina) at 6pM concentration, a 75 bp single read, rapid run (v2 chemistry) was performed on a HiSeq1500 system (Illumina). Sequencing data was demultiplexed using CASAVA version 1.8.
RNA-seq analysis of monocytes and microglia from Cxcr4cKO and Cxcr4-control mice.
Infiltrated monocytes and microglia were obtained by FACS from brain of Cxcr4cKO and Cxcr4-control mice at day 3 after stroke induction using marker settings as described above. Numbers of analysed mice are given in the Figures. Total RNA was isolated and quality controlled as above. Total RNA was converted into double stranded cDNA libraries as a template for high-throughput sequencing according to the SMART-Seq2 protocol 54. In brief, mRNA was captured by polyT nucleotides and converted into cDNA with 5’ and 3’ overhangs by use of the switching mechanism at the 5’ end of RNA template (SMART) approach using SuperScript II RT (Invitrogen) and a template switching oligonucleotide. After PCR amplification, cDNA was quality controlled via the HS D5000 analysis screen tape assay on a 4200 TapeStation system (Agilent Technologies). 100 pg cDNA each were further converted to sequencing libraries by Tagmentation using the Tn5 from the Nextera XT DNA Library Preparation Kit (Illumina) and subsequent PCR amplification using the Nextera XT Index Kit (Illumina). Size-selection, purification, and size measurement of cDNA fragments were performed as described above. The cDNA library was quantified using the Qubit dsDNA HS assay kit (ThermoFischer). The libraries were clustered at 1.4pM on a NextSeq500 system (Illumina) and sequenced SR 75bp using High Output v2 chemistry. Sequencing data was demultiplexed using bcl2fastq2 v2.20.
RNA-Seq pre-processing and statistical analysis of samples from Cxcr4-GFP mice.
After base calling and de-multiplexing using CASAVA version 1.82, the 75 bp single-end reads were aligned to the Mus musculus reference genome mm10 from UCSC by STAR version 2.5.1 using default parameters. After mapping the reads to the genome, data were imported into Partek Genomics Suite V6.6 (PGS) to quantify the number of reads mapped to each gene annotated in the RefSeq mm10 annotation downloaded in November 2016. The raw read counts were used as input to DESeq2 for calculation of normalized signal for each transcript using default parameters. After DESeq2 normalization, the normalized read counts were imported back into PGS and floored by setting all read counts to at least a read count of 1 after batch-correction. Subsequent to flooring, all transcripts with a maximum over all group means lower than 10 were excluded. The data set then comprised 9,183 present genes. A one-way ANOVA model was performed to calculate the 500 most variable and the DE genes between groups. DE genes were defined by a |fold change|> 4 and a p-value (FDR)<0.3. Principal component analysis on all genes and hierarchical clustering on the 500 most variable DE genes was performed with default settings in PGS based on the p-values of the expression values of all samples across all conditions.
Descriptive bioinformatics of transcriptomic data sets.
Gene ontology (GO) term enrichment analysis was performed using DAVID 6.8 with default settings55 on DE genes exhibiting ≥100 counts in one condition for the Cxcr4-GFP dataset. Redundant GO terms were eliminated using REVIGO56. Only GO terms were considered exhibiting at least 5 assigned DE genes.
Gene Set Enrichment analysis: A monocyte/microglia marker set [1] was extracted from the literature by selecting genes consistently listed in10, 14, 57. A 2nd monocyte/microglia marker set [2] was obtained from58. An independent marker set [3] comprising monocyte (Mo_6C+II+_Bl), microglia (MF_Microglia_CNS), and neutrophil (GN_Bl) markers was retrieved from tree datasets (GSE15907) from ImmGen59 using self-organizing maps (SOM). SOM-clustering was performed by PGS using default parameters and 20,000 training iterations to cluster genes showing a similar gene expression pattern. Data was RMA normalized with log2 and quantile normalization. The marker sets were used for GSEA v3.060–61. Normalized enrichment scores (NES) were plotted against enrichment p-values.
Co-expression network analysis (CENA): To describe differences and similarities in transcript expression among the different sample groups, all raw read counts were imported into R (v.3.5.0 2018-04-23) and normalized via the Bioconductor (v.3.7) DESeq2 package (v.1.20.0) using default parameters. Subsequently, all transcripts with a maximum group mean lower than 10 were removed. Undesired or hidden causes of variation, such as batch and preparation date, were removed using the sva package 62. The normalized rlog transformed expression data were adjusted with three surrogate variables identified by sva using the function removeBatchEffect from the limma package 63. To determine gene clusters, CoCena2 (Construction of Co-expression network analysis - automated) was calculated based on Pearson’s correlation on the 5000 most variable genes. Pearson correlation was performed using the R package Hmisc (v4.1-1). To increase data quality, only significant (p<0.05) correlation values were kept. For the PT dataset a Pearson’s correlation coefficients cut-off of 0.945 (present genes; 4684 nodes and 151117 edges) and for the tMCAO dataset a Pearson’s correlation coefficients cut-off of 0.864 (present genes; 2608 nodes and 163715 edges) was chosen, resulting in networks following the power-law distribution (scale-free topology). Unbiased clustering was performed using the “louvain modularity” algorithm in igraph (v1.2.1). Clustering was repeated 100 times. Genes assigned to more than 10 different clusters got no cluster assignment. The mean GFC (group fold change) expression for each cluster and condition is visualized in the Cluster/Condition heatmap. Clusters smaller than 40 genes are not shown.
Statistical analysis and reproducibility.
Data are shown as mean with individual values per mouse (represented as circles or squares), or as box and whiskers plot (center line, median; box limits, 25th to 75th percentiles; whiskers, min to max). Statistical significance of differences between groups was analyzed by GraphPad Prism (v6.01) ANOVA, Mann-Whitney U test, or t test (data distribution was assumed to be normal but this was not formally tested). DAVID Bioinformatics EASE score (a modified one-tail Fisher exact test), DESeq2 Wald test with likelihood ratio test and one-tail hypergeometric test with Benjamini-Hochberg correction were used for transcriptome analyses. Unless stated otherwise, all n values represent mice, the n values are given in the Figure legends. Experiments were repeated to ensure reproducibility of the observations. No statistical methods were used to pre-determine sample sizes but our sample sizes are similar to those reported in previous publications26,35,36. The available Cxcr4-GFP, Cxcr4cKO and Cxcr4-control animals were allocated to stroke experiments based on genotype and irrespective of sex. There were no other selection criteria for the allocated animals. Other experiments did not require randomization. Data collection and analysis were not performed blind to the conditions of the experiments except for infarct volume measurements and histological analysis of monocyte infiltration at day 1 after tMCAO in Cxcr4-contol and Cxcr4cKO mice. No animals or data points were excluded from the analyses except for 3 infarct volume outliers identified by the GraphPad Prism ROUT method using standard settings.
Data availability.
Gene expression data are deposited in the GEO database (GSE120701). The data that support the findings of this study are available from the corresponding author upon reasonable request.
Availability of materials.
Cxcr4-CreER mice are available from the corresponding author upon request.
Extended Data
Extended Data Fig. 1:
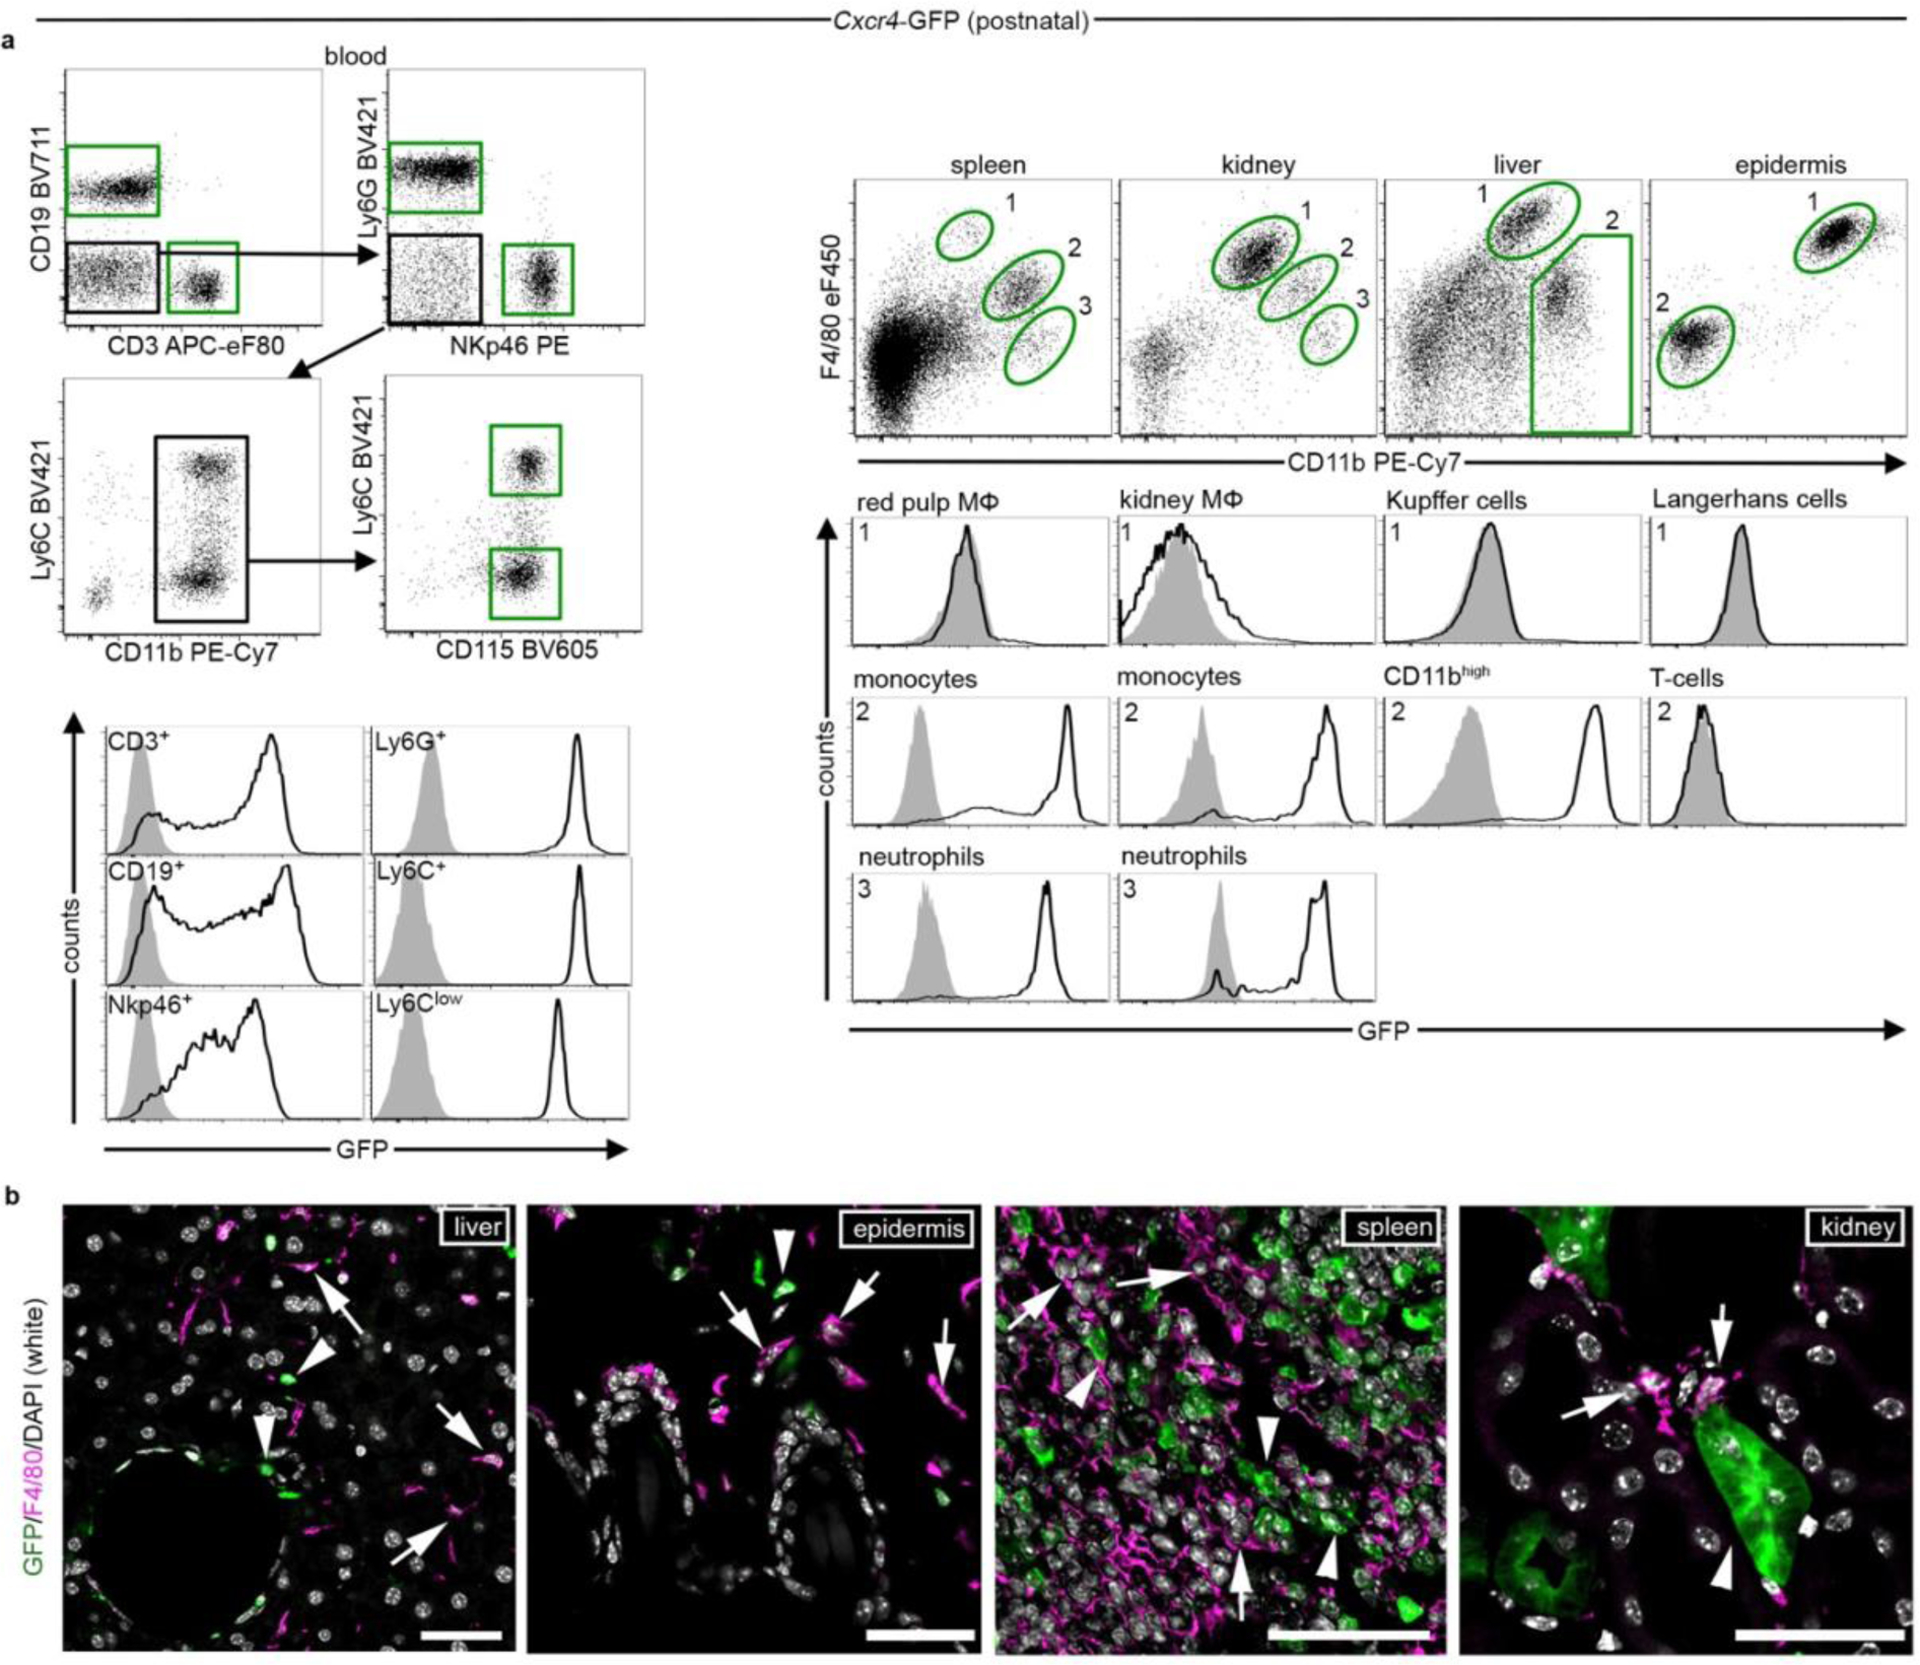
Analysis of Cxcr4-GFP expression. a, Flow cytometry analysis of GFP signal in postnatal (>P21) Cxcr4-GFP mice (solid line histograms) and wild-type controls (filled histograms). Cells analyzed were blood leukocytes including B-cells (CD19+), T-cells (CD3+), natural killer cells (NKp46+), neutrophils (Ly6G+), Ly6Clow and Ly6Chi monocytes (CD115+ Ly6Clow/Ly6Chi), CD11b+ F4/80high tissue MΦ (gate 1), and CD11bhigh tissue myeloid cells (gates 2 and 3). Data are representative for n=4 (blood), n=7 (spleen, kidney, and liver), and n=6 (epidermis) mice. b, Confocal micrographs of immunofluorescences for GFP (green) and F4/80 (magenta) in the indicated tissues of postnatal Cxcr4-GFP mice (≥P28). Arrowheads point to Cxcr4-GFP+ F4/80− and arrows to Cxcr4-GFP− F4/80+ cells. Representative for n=3 mice each. Scale bars: 45μm (b)
Extended Data Fig. 2:
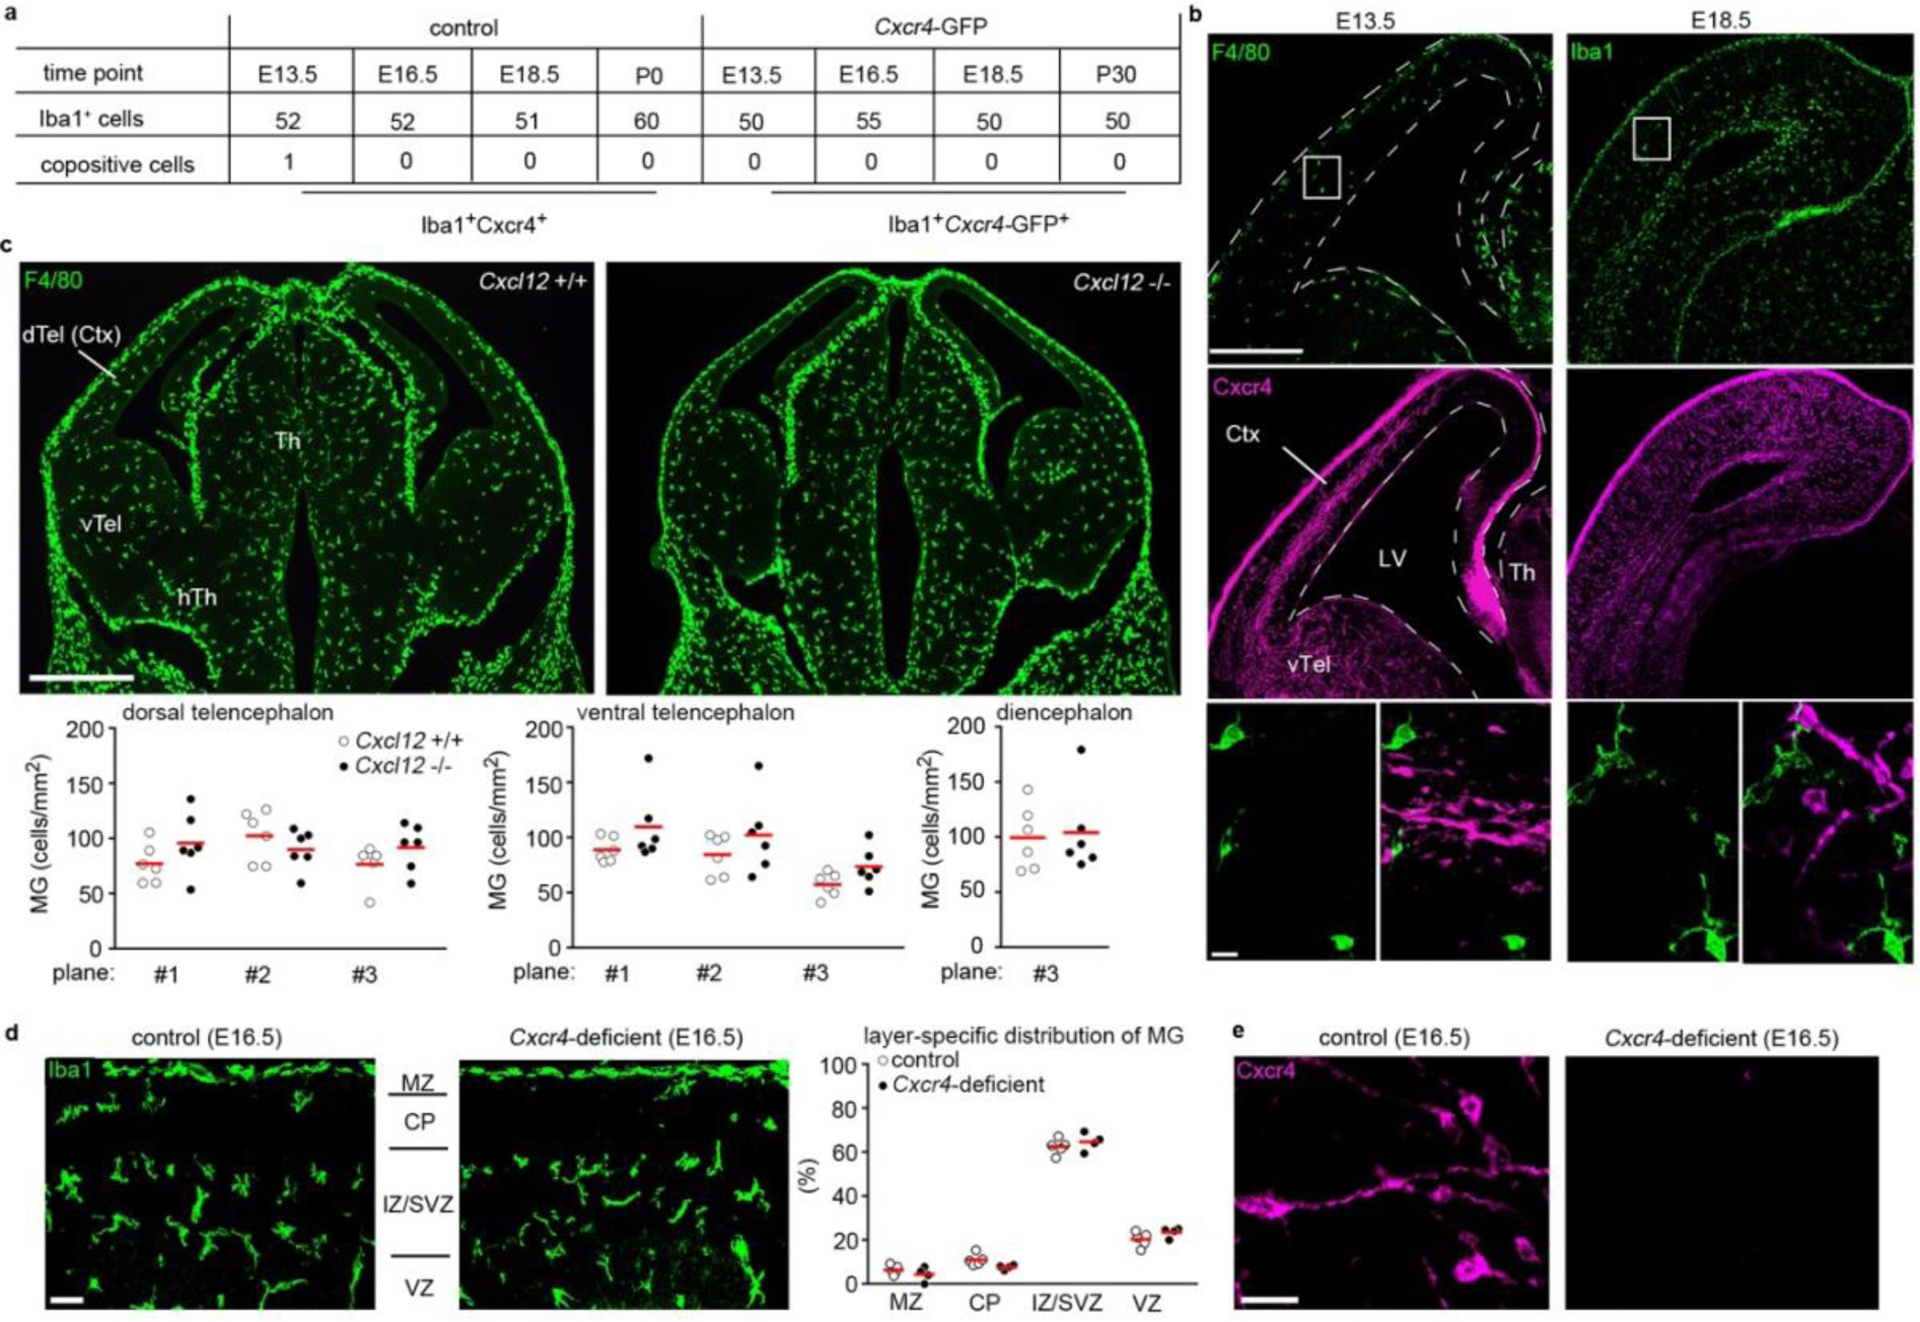
Cxcl12 is dispensable for microglia to colonize the embryonic brain. a, Confocal analysis of Cxcr4 and Cxcr4-GFP expression in Iba1+ microglia at the indicated embryonic and postnatal stages (n=1 mouse each). The table shows the number of analyzed Iba1+ cells and the number of co-positives. b, Confocal micrographs demonstrate F4/80/Cxcr4 and Iba1/Cxcr4 dual immunofluorescences at E13.5 and E18.5, respectively (images are representative for n=1 mouse each). c, F4/80 immunofluorescence in coronal head sections of a wild-type mouse and a Cxcl12−/− littermate at E13.5. Graphs depict the number of F4/80+ cells per mm2 determined in 3 matched sectional planes in the dorsal and ventral telencephalon and in one sectional plane in the diencephalon of E13.5 wild-type mice and Cxcl12−/− littermates (images are representative for n=6 mice each). d, Layering of Iba1+ microglia in cortices of a Cxcr4-deficient mouse and a wild-type littermate at E16.5. The microglia-dense layer to the top represents the subdural meninx (images are representative for n=4 mice each). The graph shows the frequency of Iba1+ microglia in the indicated cortical layers as percentage of all counted microglia (n=4 mice each). e, Cxcr4 immunostaining in cortices of a Cxcr4-deficient mouse and a control littermate at E16.5 (n=4 mice each). Abbreviations: CP, cortical plate; Ctx, cerebral cortex; dTel, dorsal telencephalon; hTh, hypothalamus; IZ, intermediate zone; LV, lateral ventricle; MZ, marginal zone; SVZ, subventricular zone; Th, thalamus; vTel, ventral telencephalon; VZ, ventricular zone. Graphs and statistics: Circles and red lines show individual mice and mean values, respectively. No significant differences as by two-way ANOVA for sectional plane/genotype interaction for dorsal telencephalon (c, p=0.06) and ventral telencephalon (c, p=0.96) and for layer/genotype interaction for cerebral cortex (d, p=0.08) and by two-sided t test for diencephalon (c, p=0.8). Scale bars: 250 μm and 20 μm (b), 500 μm (c), 40 μm (d), and 10 μm (e).
Extended Data Fig. 3:
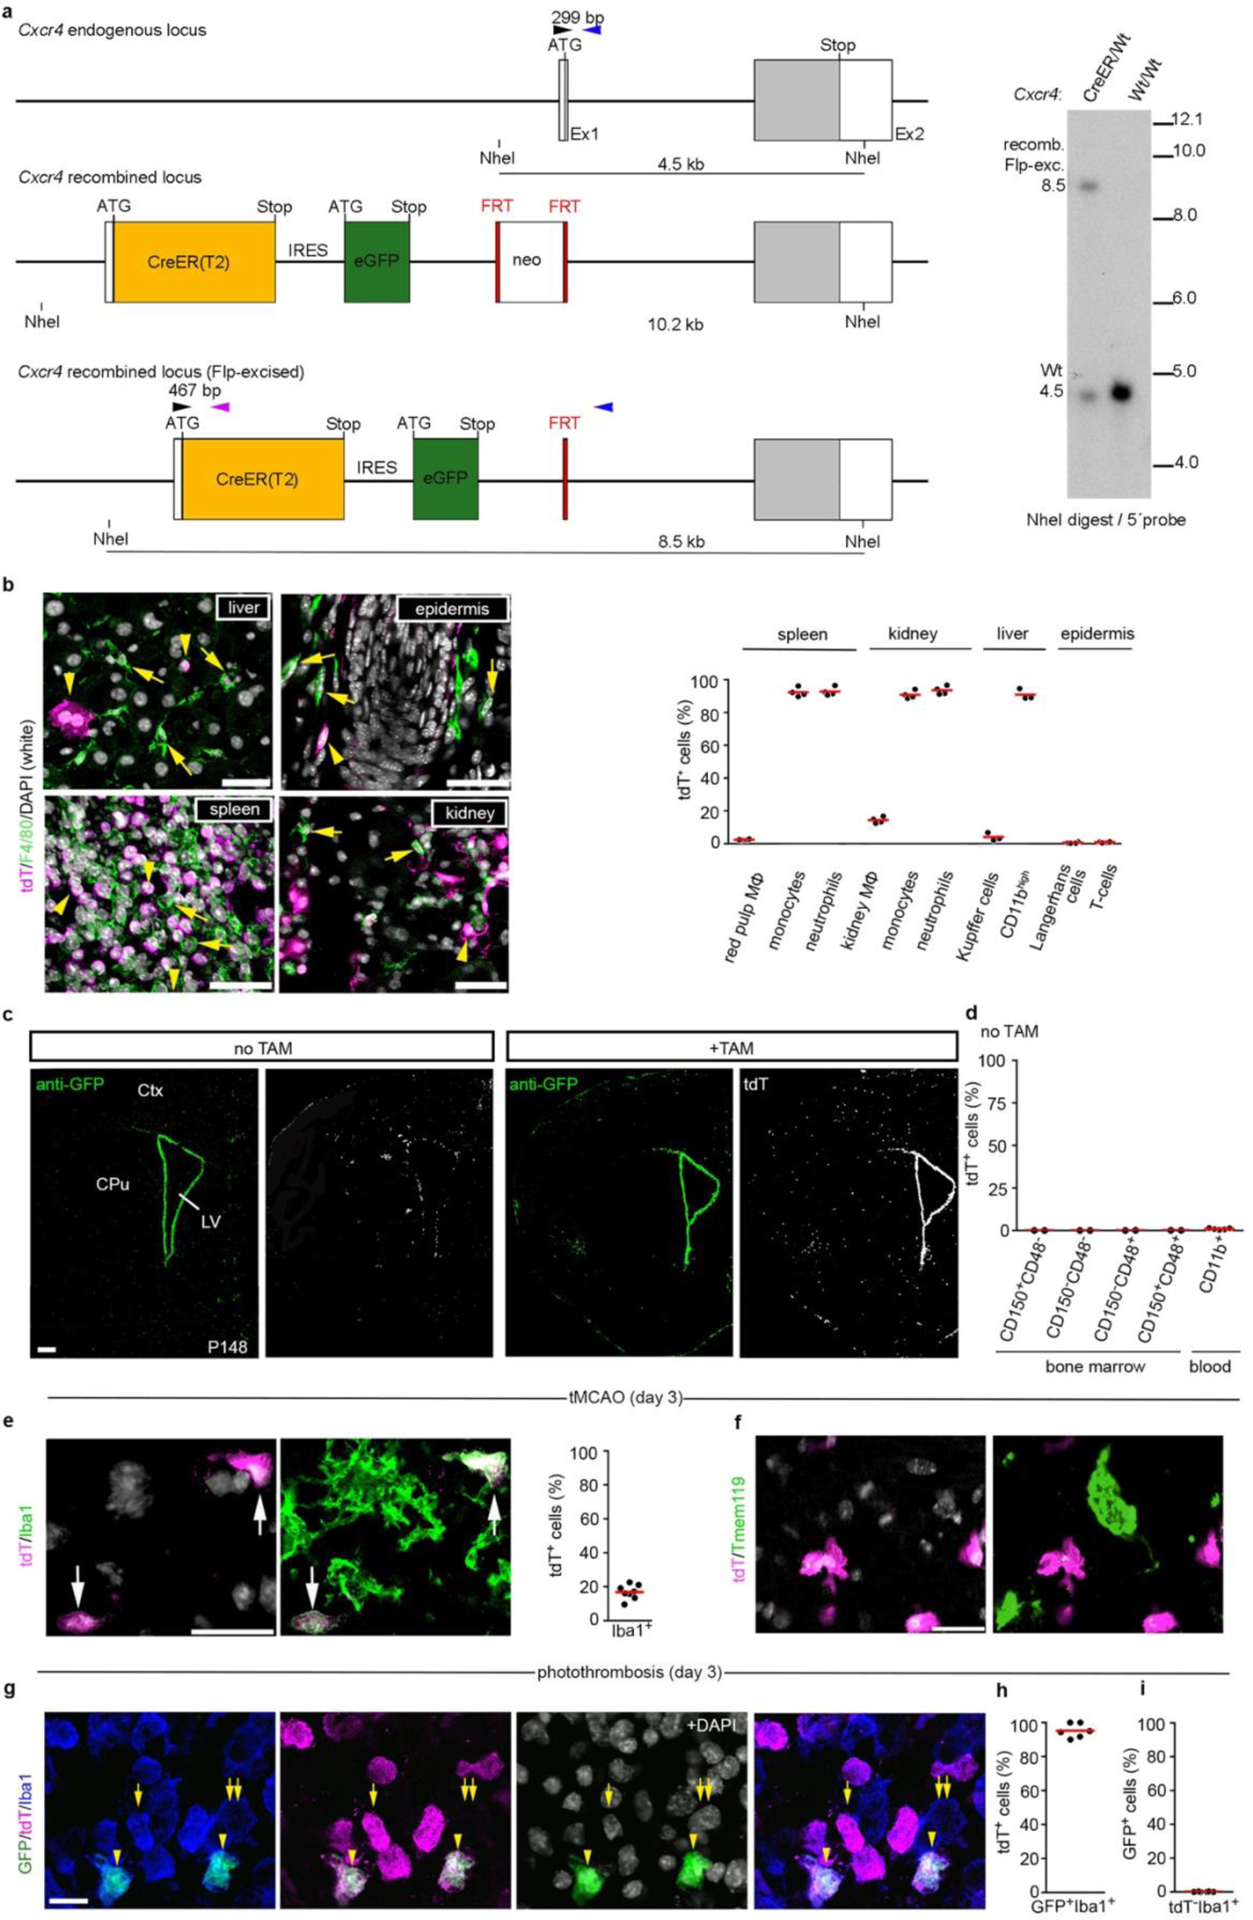
Characterization of Cxcr4CreER/wt; R26CAG-LSL-tdT mice. a, Schematic of the Cxcr4-CreER(T2)-IRES-eGFP allele generated by homologous recombination. Upper panel: Cxcr4 exons 1 and 2 (Ex1, Ex2) with the coding sequence in grey. Middle panel: In-frame fusion of the ATG in exon 1 with sequences for CreER(T2), internal ribosomal entry site (IRES), and eGFP. The insertions disrupt the Cxcr4 coding sequence. A neomycin positive selection cassette (neo) flanked by FRT sequences was placed downstream of eGFP. Lower panel: The recombined allele after excision of neo. Primers used for genotyping (arrowheads): Cxcr4-upper (black), Cxcr4-lower (blue), Cxcr4-CreER-lower (purple); primer sequences are detailed in the Methods. Right panel: Southern blot of NheI-digested genomic DNA hybridized with a 5′ Cxcr4 probe identifies the 8.5 kb Flp-excised Cxcr4-CreER fragment and the 4.5 kb Cxcr4 wild-type fragment (blot is representative for n=7 mice). b, Analysis of tdT signal in tissue MΦ and blood cells in adult mice 4 weeks after TAM. Immunofluorescences show tdT (magenta) and F4/80 (green) in the indicated tissues with DAPI in white. Arrowheads identify tdT+ F4/80− cells and arrows tdT− F4/80+ cells. Images are representative for n=3 mice. The graph shows flow cytometry analyses of the tdT+ percentage for the indicated cell types (spleen, kidney, and epidermis: n=4 mice; liver: n=3 mice). c, Immunostained Cxcr4-IRES-GFP and tdT in TAM-naïve (−TAM) and TAM-treated (+TAM) P148 mice receiving TAM from P113–P11 (images are representative for n=3 mice each). d, The graph shows the tdT+ percentage for LSK HSCs (n=2 mice) and CD11b+ blood cells (n=5 mice) in adult TAM-naïve (−TAM) condition. e–g, Stroke was induced by tMCAO or PT in adult mice ≥28 d after TAM treatment. Micrographs show dual immunofluorescences for tdT/Iba1 (e, representative for n=8 mice) and tdT/Tmem119 (f, representative for n=8 mice) in the striatal infarct 3 days after tMCAO and a triple immunofluorescence for Cxcr4-IRES-GFP/tdT/Iba1 in the cortical infarct 3 days after PT (g, representative for n=6 mice). DAPI appears white. Graphs depict the tdT+ percentage for Iba1+ cells (e, n=8 mice) and for GFP+ Iba1+ cells (h, n=6 mice) as well as the GFP+ percentage for tdT− Iba1+ cells (i, n=6 mice). Graphs: Circles and red lines represent individual mice and mean values, respectively. Scale bars: 40 μm (b), 500μm (c), 40 μm (d), 20 μm (e,f), and 15 μm (g).
Extended Data Fig. 4:
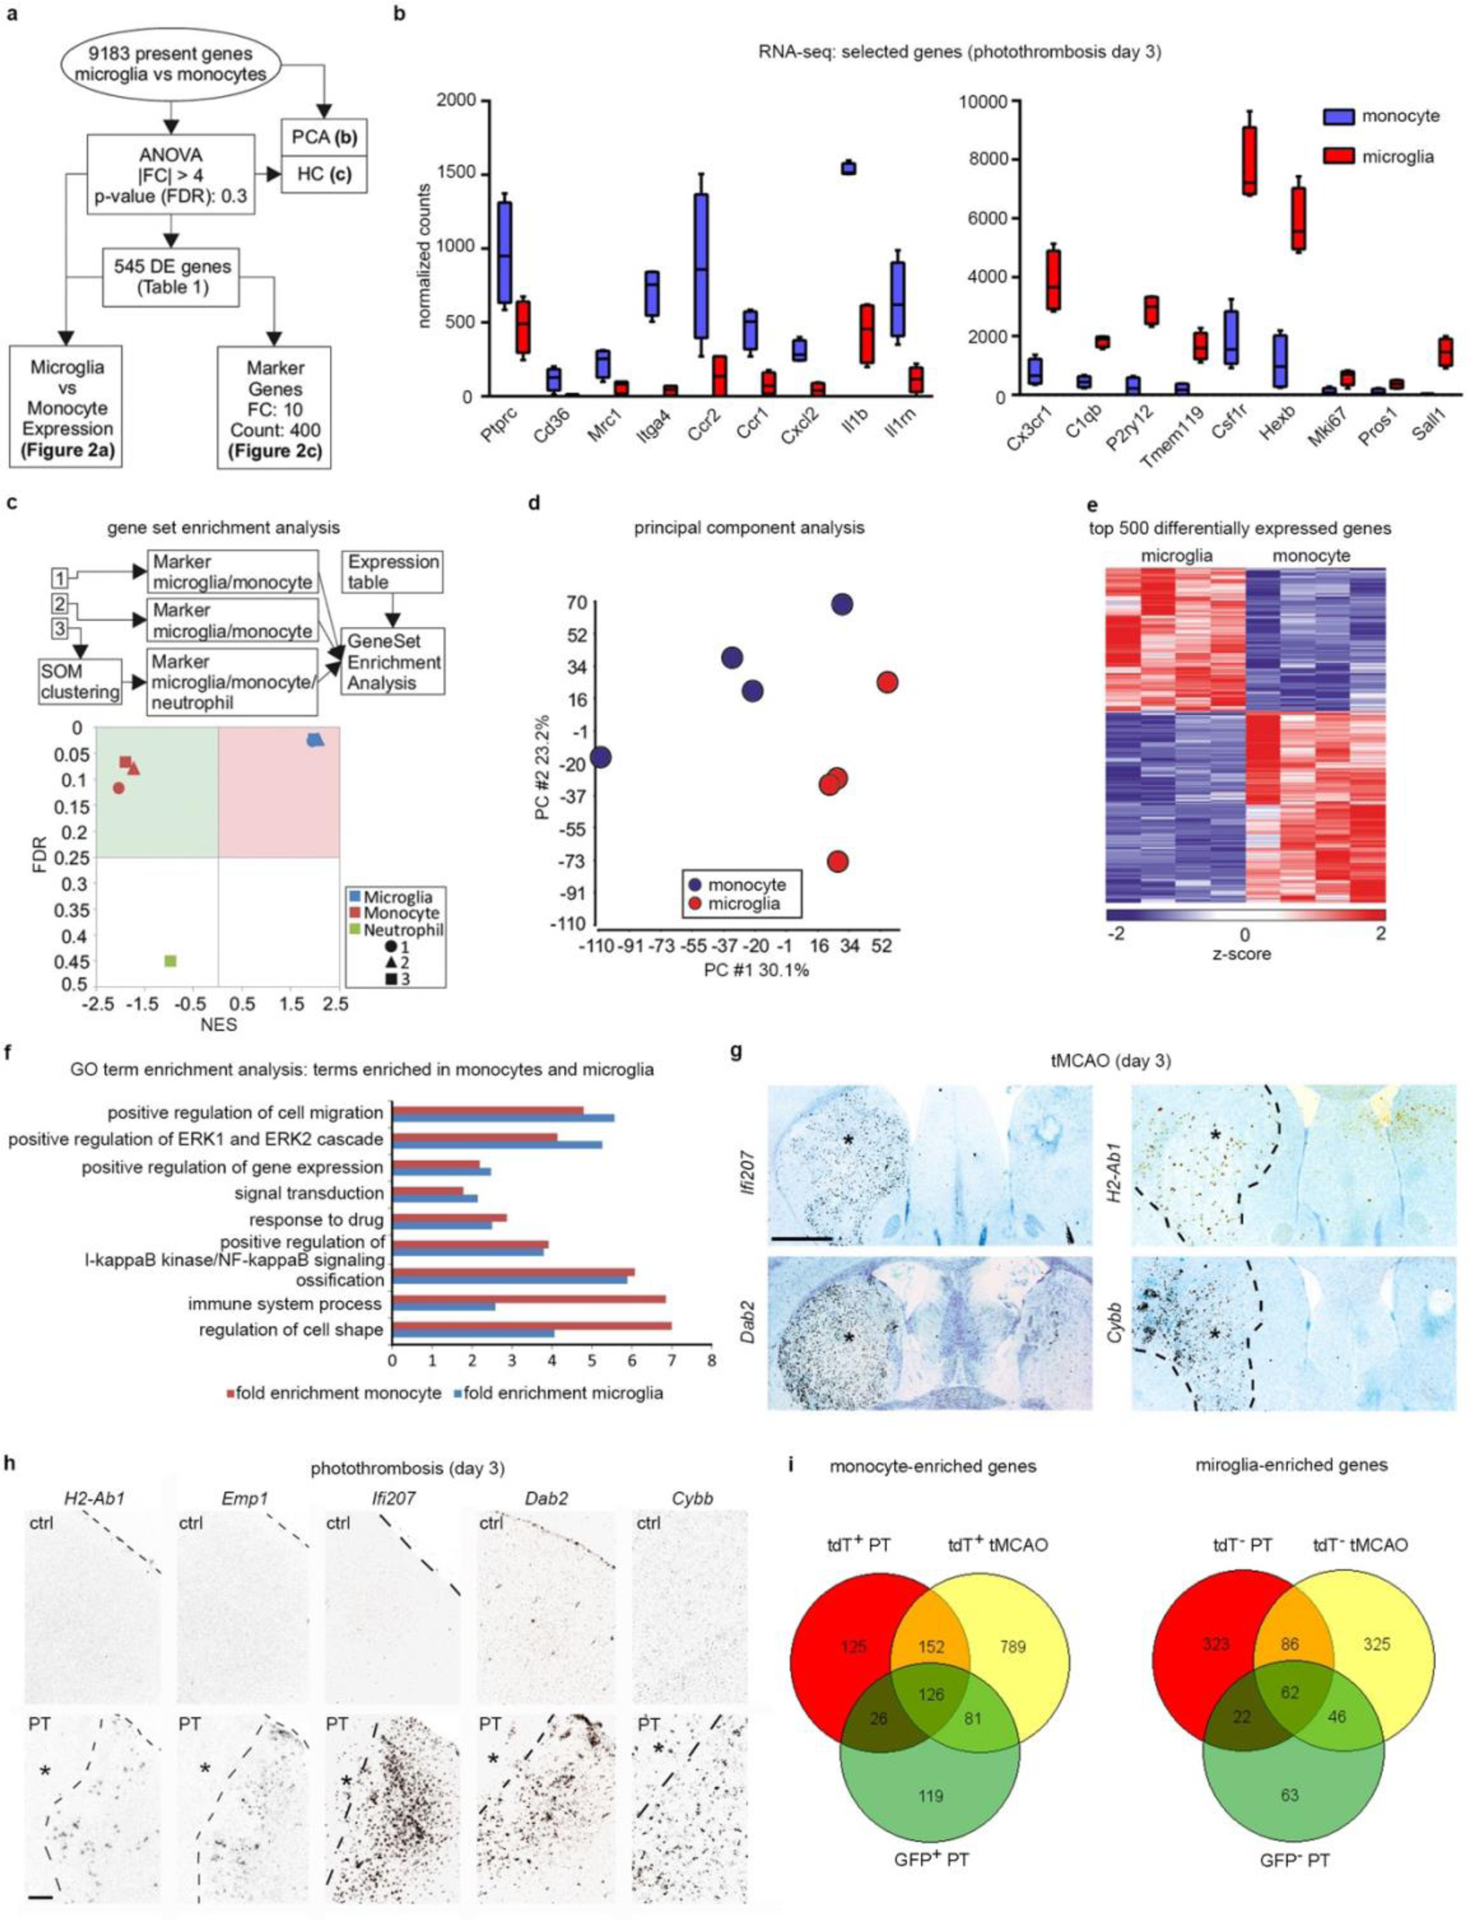
RNA-seq analysis of the gene expression of monocytes and microglia in photothrombotic infarcts. a–f,i, RNA-seq was performed with Cxcr4-GFP+ Ly6Chigh monocytes (Ly6G− CD11b+ CD45high) and Cxcr4-GFP− microglia (Ly6G− CD11b+ CD45low) sorted from the injured cortex at day 3 after PT (n=4 mice). a, Scheme describing the workflow. Differentially expressed (DE) genes were defined by |fold change (FC)|>4 and false discovery rate (FDR)<0.3. Statistical test: one-way ANOVA. b, Normalized RNA-seq counts for the indicated genes (center line, median; box limits, 25th to 75th percentiles; whiskers, min to max) (n=4 mice each). c, Gene Set Enrichment Analysis (GSEA) with all present genes using markers of monocytes, microglia, and neutrophils as gene sets. The plot shows normalized enrichment scores (NES) versus enrichment p-values (FDR). Sources of the marker sets [1] – [3] are detailed in the Methods. Statistical test for nominal p-value of the enrichment score: empirical phenotype-based permutation test. d, Principal component analysis (PCA) with all present genes. e, Hierarchical clustering (HC) showing z-transformed normalized expression values of the top 500 most variable DE genes colored from blue to red. f, GeneOntology (GO) term enrichment analysis of DE genes. Bars depict fold enrichment for terms with p-value <0.05. Statistical test: EASE Scores (one-tail) calculated with DAVID Bioinformatics. g,h, The indicated transcripts were detected by in situ hybridization (black signal). Images depict the ipsilateral CPu after tMCAO (g) and the border zone of the cortical infarct after PT (h). Infarcts are indicated by asterisks. The contralateral side and the cortex of naïve mice (ctrl) serve as references in (g) and (h), respectively. Sections from mice undergoing tMCAO were counterstained with cresyl violet. Images are representative for n=2 (ctrl) and n=3 (stroke). i, Venn diagrams for DE monocyte and microglia genes. The GFP+ monocyte and GFP− microglia gene sets correspond to the data shown in (a). DE genes (|FC|>1.5 and FDR<0.05) for tdT+ monocytes and tdT− microglia were obtained by RNA-seq with cells isolated from Cxcr4CreER/wt; R26CAG-LSL-tdT mice at day 3 after PT (n=3) and tMCAO (n=5). Statistical test: Wald test with likelihood ratio test. See Supplementary Table 4 for lists of the DE genes and intersecting sets. Scale bars: 1000 μ(g), 200 μm (h).
Extended Data Fig. 5:
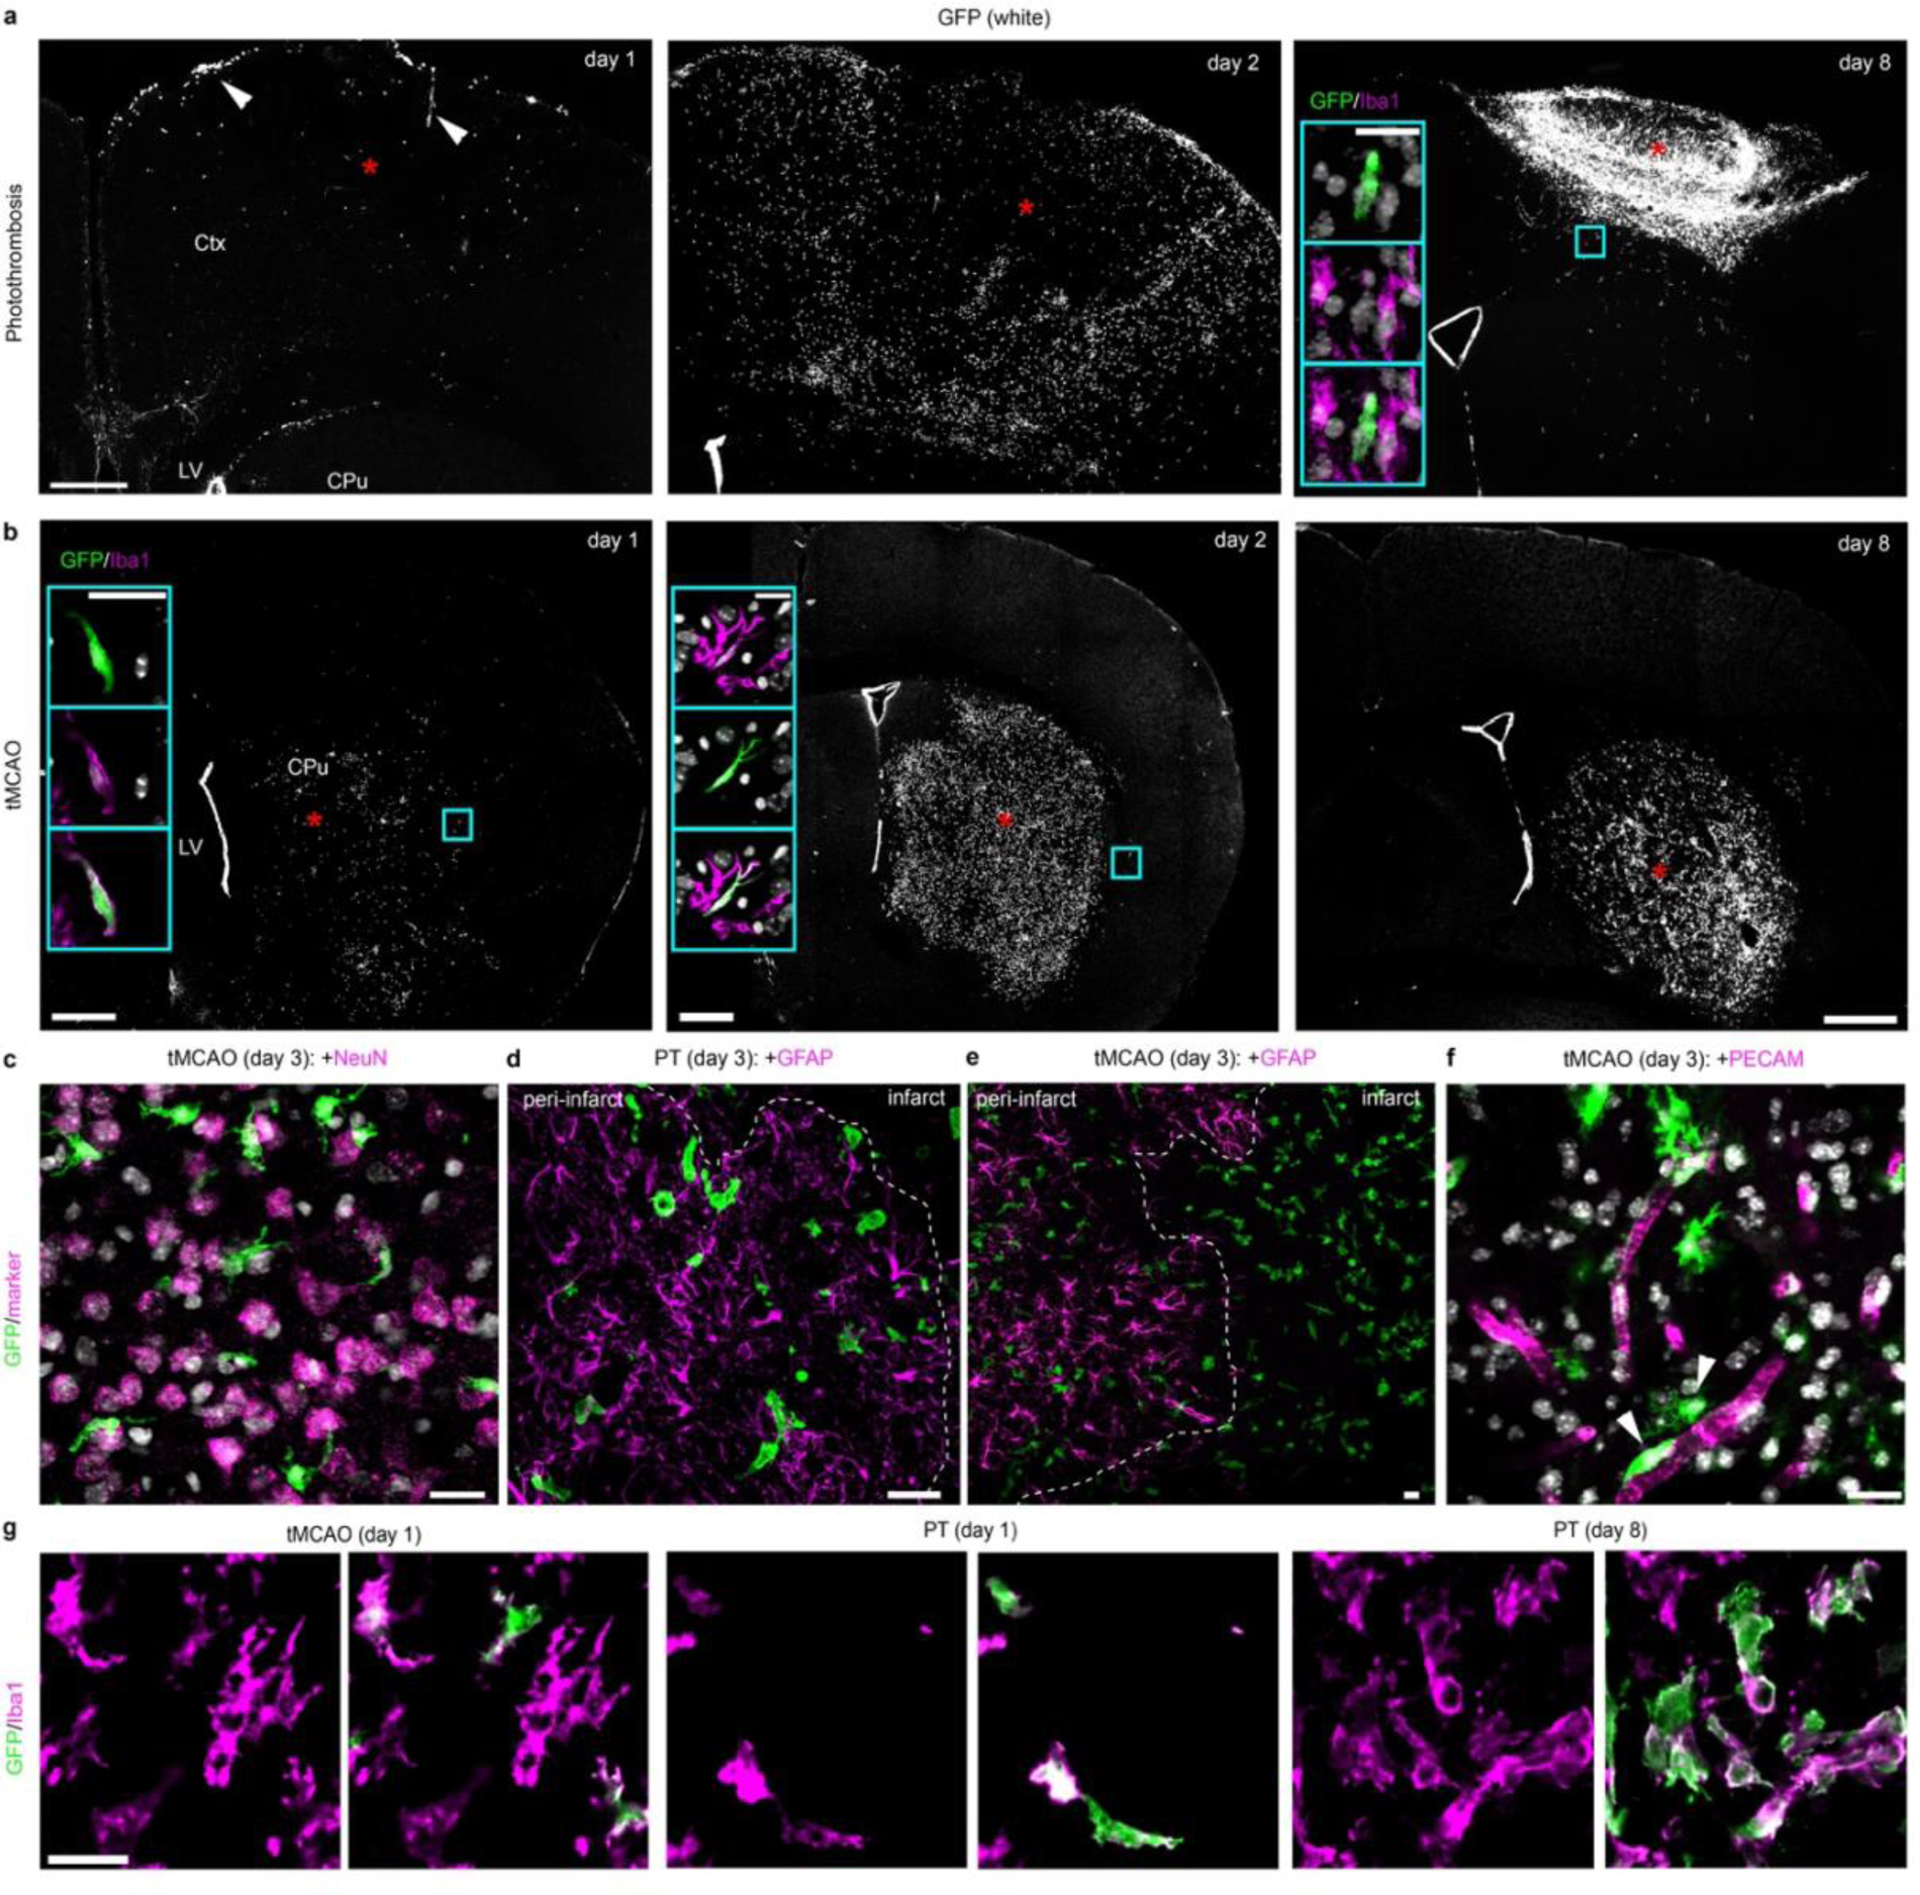
Reperfusion facilitates monocyte infiltration in the infarct territory. a,b, Low magnification images show Cxcr4-GFP at the indicated time points after PT (a) and tMCAO (b) in coronal sections immunostained for GFP and Iba1 (asterisks identify the infarct). Insets represent the framed areas and demonstrate that GFP+ cells in the peri-infarct area are frequently Iba1+ at days 1 and 2 but are Iba1− at day 8. Images are representative for n=3 mice (day 1 and day 8) and n=2 mice (day 2) per condition. c–f, High-power confocal images of double-immunofluorescences for GFP/NeuN (c), GFP/GFAP (d,e), and GFP/PECAM (f) at day 3 after stroke induction with GFP in green and NeuN, GFAP, and PECAM in magenta. Cxcr4-GFP+ phagocytes are demonstrated next to NeuN+ neurons (c) and GFAP+ astrocytes (d,e). Few Cxcr4-GFP+ infiltrates are associated with PECAM+ endothelial cells (f, arrowheads). Images are representative for n=3 mice per condition. g, Dual immunofluorescences for GFP/Iba1 in the infarct area at day 1 and day 8 after PT and at day 1 after tMCAO. Images are representative for n=3 mice per condition. Abbreviations: CPu, caudate-putamen; Ctx, cerebral cortex; LV, lateral ventricle. Scale bars: 500 μm (a,b) and 20 μm (c–g).
Extended Data Fig. 6:
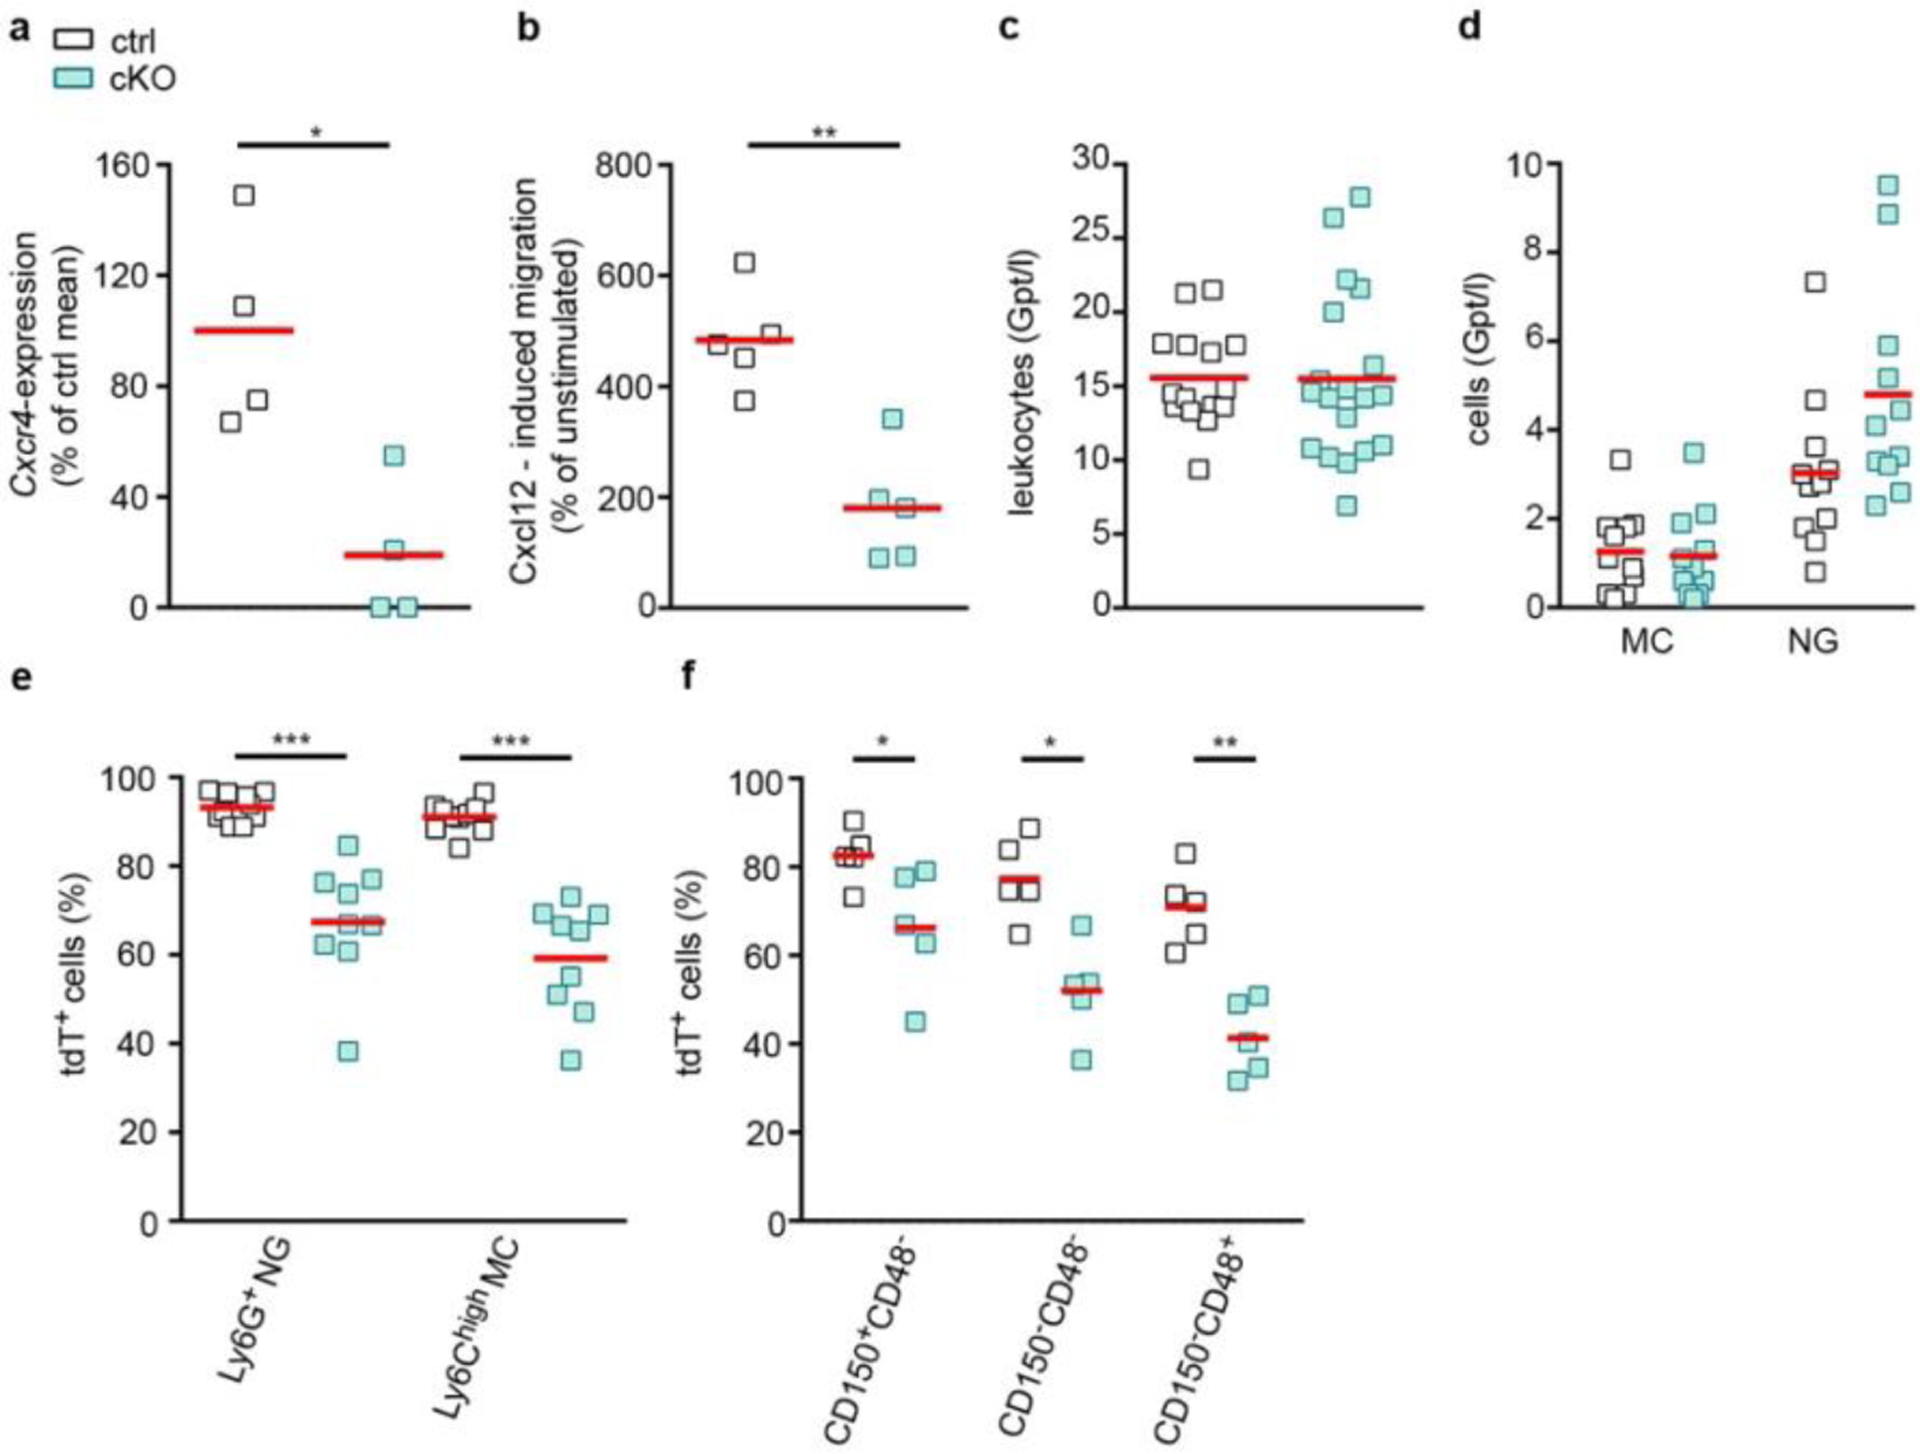
Effect of Cxcr4cKO on blood leukocytes. Cxcr4CreER/wt; R26CAG-LSL-tdT (ctrl) and Cxcr4CreER/LoxP; R26CAG-LSL-tdT mice (cKO) received TAM at adult age and were analyzed ≥4 weeks after TAM. a, Relative Cxcr4 expression determined by real-time PCR with cDNA from sorted tdT+ blood monocytes. Single values were normalized to the mean of CreER/Wt. b, Migration index for Cxcl12-induced transwell migration of CD11b+ BM cells. c,d, Numbers of total leukocytes, monocytes (MC), and neutrophilic granulocytes (NG) in gigaparticles (Gpt) per liter blood as determined by leukograms. e,f, Flow cytometry analysis of tdT+ percentages for neutrophilic granulocytes, monocytes, and LSK HSCs. Red lines indicate mean values and squares individual mice. Abbreviations: MC, monocytes; NG, neutrophilic granulocytes. Statistics: a, *p=0.03 (n=4 mice each); b, **p=0.008 (n=5 mice each); c, p=0.79 (ctrl, n=15 mice; cKO, n=19 mice); d, p=0.86 (MC), p=0.07 (NG) (n=11 mice); e, ***p<0.0001 (ctrl, n=10 mice, cKO, n=9 mice); f, *p=0.03 (CD150+ CD48−), *p=0.02 (CD150− CD48−), **p=0.008 (CD150− CD48+) (n=5 mice each). a–f, Two-sided Mann-Whitney U test.
Extended Data Fig. 7:
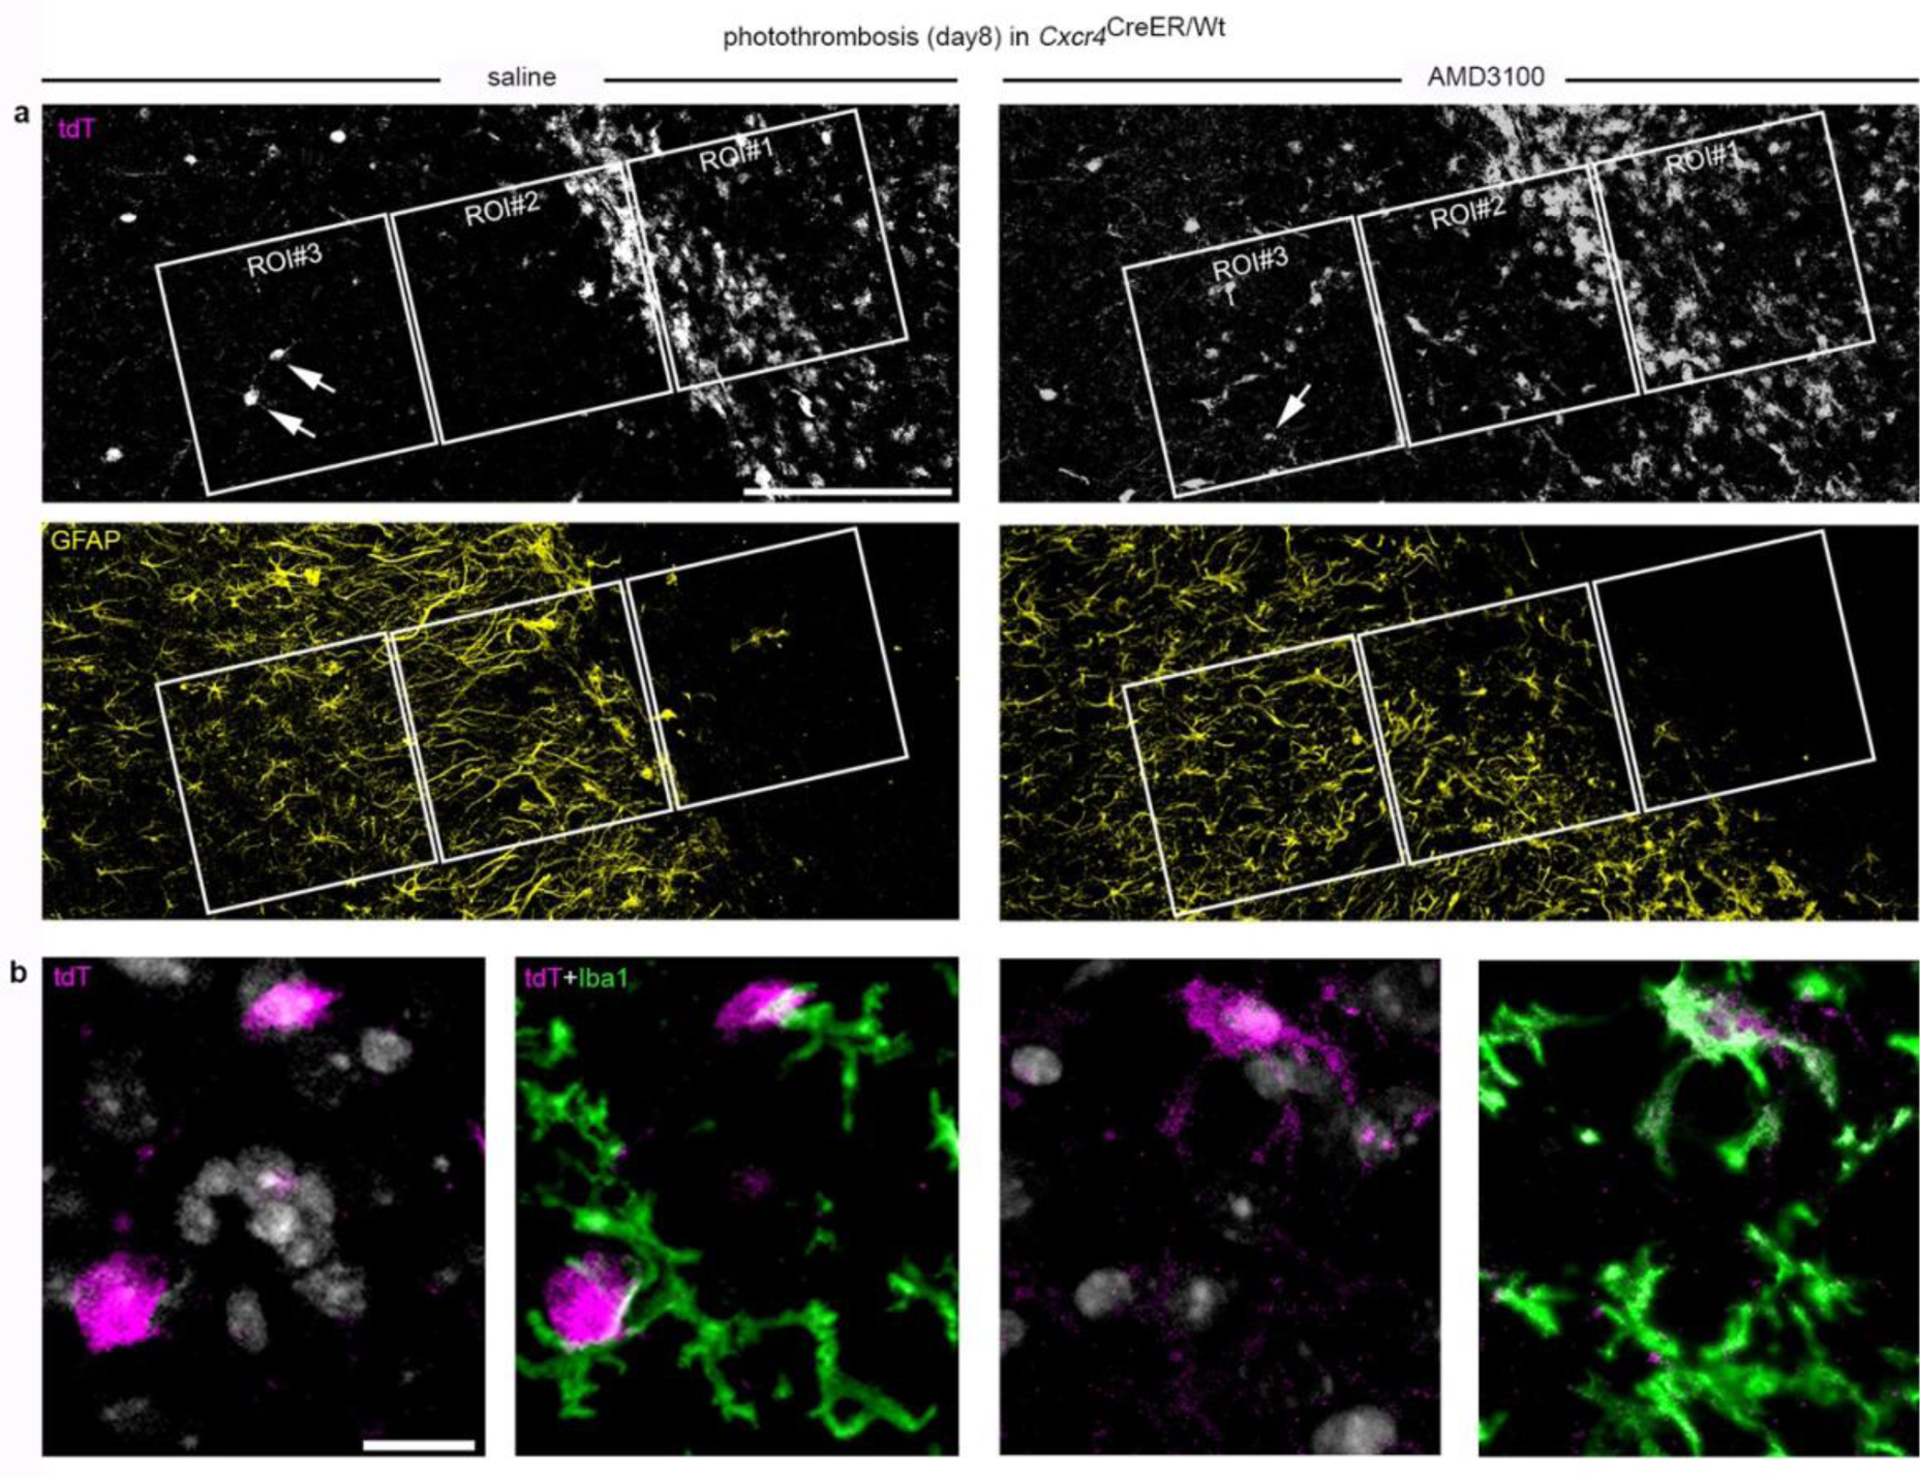
Intrainfarct application of AMD3100 induces ectopic positioning of MDM after PT. Cxcr4CreER/wt; R26CAG-LSL-tdT mice received saline or AMD3100 into the infarct at day 8 after PT via stereotactically-controlled injection. Images were captured 6 hours after substance application. a, Counterstained tdT and GFAP. Regions of interest (ROIs) used to quantify the presence of MDM are illustrated (ROI#1: infarct, ROI#2: peri-infarct, ROI#3: intact region). b, Iba1 staining (green) is shown for cells labeled with arrows in a. DAPI appears white. The depicted tdT+ cells in the saline-treated animal are Iba1− presumptive neurons. The tdT+ Iba1+ cell in the AMD3100-treated animal represents an ectopic MDM in ROI#3. a,b, Images are representative for n=6 each. Scale bars: 200 μm (a), 20 μm (b).
Extended Data Fig. 8:
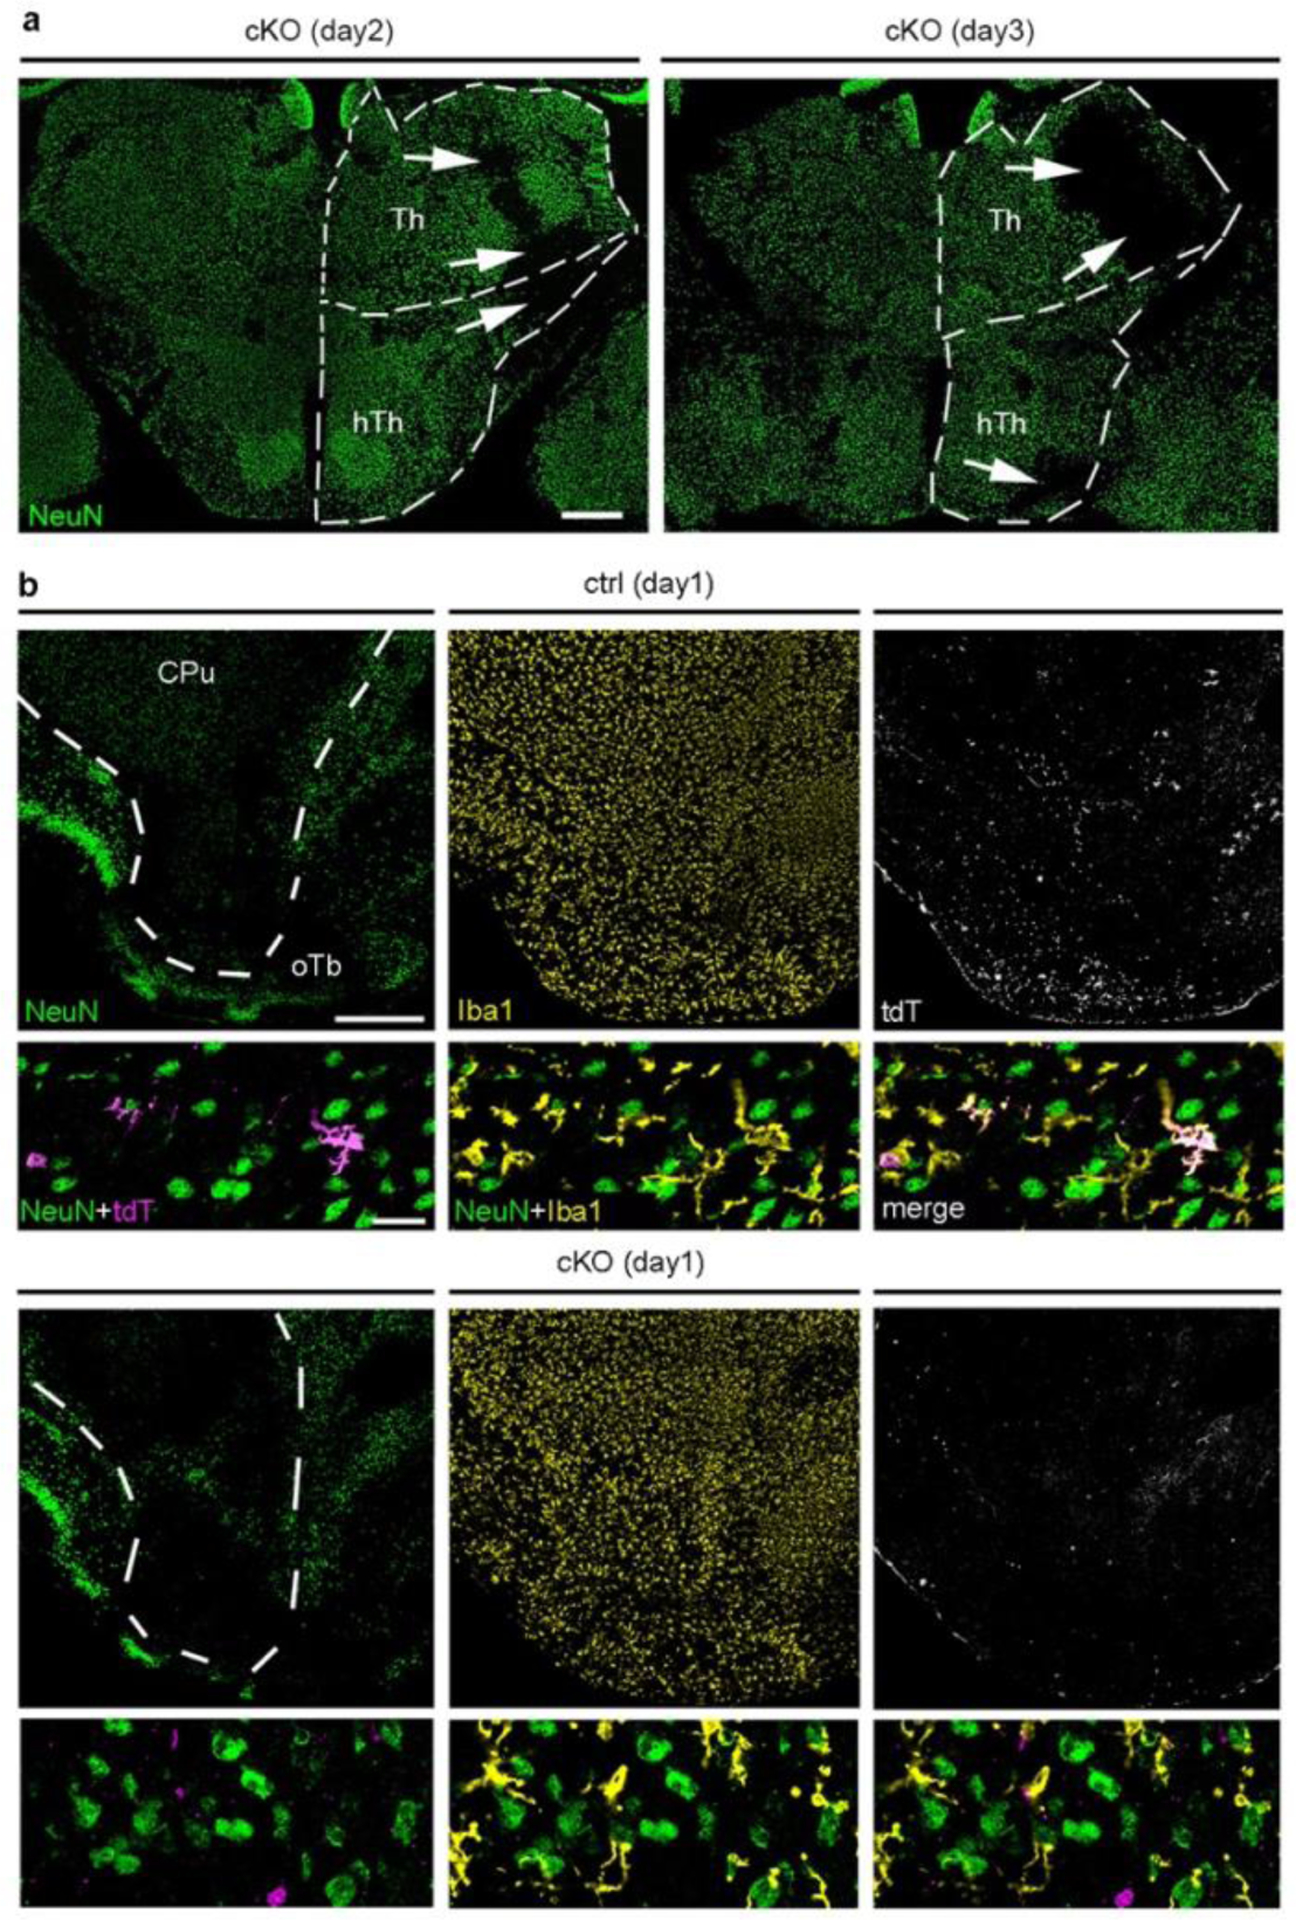
Diencephalic infarcts and reduced monocyte infiltration in Cxcr4cKO mice undergoing tMCAO. a, Images demonstrate degenerated areas in the diencephalon of two Cxcr4cKO mice undergoing tMCAO. Segmented lines identify the thalamus and hypothalamus. Arrows point to degenerated/NeuN− regions. Images are representative for n=13 mice (day 2) and n=15 mice (day 3). b, Confocal images of Neu/Iba1/tdT immunofluorescences in a Cxcr4-control (ctrl) and a Cxcr4cKO (cKO) at day 1 after tMCAO. Segmented lines identify the infarct area. High magnification images were photographed in the NeuN+ peri-infarct area in the olfactory tubercle. Images are representative for n=6 mice each. Abbreviations: CPu, caudate putamen; hTh, hypothalamus; oTb, olfactory tubercle; Th, thalamus. Scale bars: 500 μm (a); 500 μm and 30 μm (b).
Supplementary Material
Acknowledgements
We thank C. Anders, H. Bechmann, S. Bechmann, J. Karius, and H. Stadler for excellent technical assistance as well as H. Garner and K. Kierdorf for flow cytometry with HSCs. We also thank R. Miller (Northwestern University, Chicago, Illinois, USA) for providing Cxcr4-GFP mice and J. Hansen (German Center for Neurodegenerative Diseases, Bonn, Germany) for providing us with the newest version of MotiQ. This work was supported by German Research Foundation (DFG) grants STU295/3-3 and STU295/8-1 (to R.S). Work in FG laboratory (FG, EM) was supported by Grants from the US National Institutes of Health/National Institute of Allergy and Infectious Diseases (NIH/NIAID, 1R01AI130345-01), National Heart, Lung, and Blood Institute (NIH/NHLBI, 5R01AI124349-03), National Cancer Institute (NIH/NCI, P30CA08748), and Ludwig Institute for Cancer Research at MSKCC. EM and JLS were funded by the DFG under Germany’s Excellence Strategy EXC2151-390873048 and SCHU 950/8-1 (to JLS). EM is supported by the Fritz Thyssen foundation and the Daimler and Benz Foundation.
Footnotes
Competing Interests Statement
All authors declare no competing interests.
Reporting Summary
Further information on research design is available in Life Sciences Reporting Summary linked to this article.
Code availability.
Code for CENA is available on https://github.com/UlasThomas/CoCena2.
References
- 1.Alliot F, Godin I & Pessac B Microglia derive from progenitors, originating from the yolk sac, and which proliferate in the brain. Brain Res Dev Brain Res 117, 145–152 (1999). [DOI] [PubMed] [Google Scholar]
- 2.Ginhoux F, et al. Fate mapping analysis reveals that adult microglia derive from primitive macrophages. Science 330, 841–845 (2010). [DOI] [PMC free article] [PubMed] [Google Scholar]
- 3.Gomez Perdiguero E, et al. Tissue-resident macrophages originate from yolk-sac-derived erythro-myeloid progenitors. Nature 518, 547–551 (2015). [DOI] [PMC free article] [PubMed] [Google Scholar]
- 4.Schulz C, et al. A lineage of myeloid cells independent of Myb and hematopoietic stem cells. Science 336, 86–90 (2012). [DOI] [PubMed] [Google Scholar]
- 5.Greter M, Lelios I & Croxford AL Microglia Versus Myeloid Cell Nomenclature during Brain Inflammation. Front Immunol 6, 249 (2015). [DOI] [PMC free article] [PubMed] [Google Scholar]
- 6.Davalos D, et al. ATP mediates rapid microglial response to local brain injury in vivo. Nat Neurosci 8, 752–758 (2005). [DOI] [PubMed] [Google Scholar]
- 7.Kettenmann H, Hanisch UK, Noda M & Verkhratsky A Physiology of microglia. Physiol Rev 91, 461–553 (2011). [DOI] [PubMed] [Google Scholar]
- 8.Parkhurst CN, et al. Microglia promote learning-dependent synapse formation through brain-derived neurotrophic factor. Cell 155, 1596–1609 (2013). [DOI] [PMC free article] [PubMed] [Google Scholar]
- 9.Prinz M & Priller J The role of peripheral immune cells in the CNS in steady state and disease. Nat Neurosci 20, 136–144 (2017). [DOI] [PubMed] [Google Scholar]
- 10.Yamasaki R, et al. Differential roles of microglia and monocytes in the inflamed central nervous system. J Exp Med 211, 1533–1549 (2014). [DOI] [PMC free article] [PubMed] [Google Scholar]
- 11.Ajami B, Bennett JL, Krieger C, Tetzlaff W & Rossi FM Local self-renewal can sustain CNS microglia maintenance and function throughout adult life. Nat Neurosci 10, 1538–1543 (2007). [DOI] [PubMed] [Google Scholar]
- 12.Hashimoto D, et al. Tissue-resident macrophages self-maintain locally throughout adult life with minimal contribution from circulating monocytes. Immunity 38, 792–804 (2013). [DOI] [PMC free article] [PubMed] [Google Scholar]
- 13.Kierdorf K, et al. Microglia emerge from erythromyeloid precursors via Pu.1- and Irf8-dependent pathways. Nat Neurosci 16, 273–280 (2013). [DOI] [PubMed] [Google Scholar]
- 14.Bowman RL, et al. Macrophage Ontogeny Underlies Differences in Tumor-Specific Education in Brain Malignancies. Cell Rep 17, 2445–2459 (2016). [DOI] [PMC free article] [PubMed] [Google Scholar]
- 15.Chong SZ, et al. CXCR4 identifies transitional bone marrow premonocytes that replenish the mature monocyte pool for peripheral responses. J Exp Med 213, 2293–2314 (2016). [DOI] [PMC free article] [PubMed] [Google Scholar]
- 16.Eash KJ, Greenbaum AM, Gopalan PK & Link DC CXCR2 and CXCR4 antagonistically regulate neutrophil trafficking from murine bone marrow. J Clin Invest 120, 2423–2431 (2010). [DOI] [PMC free article] [PubMed] [Google Scholar]
- 17.Nagasawa T CXC chemokine ligand 12 (CXCL12) and its receptor CXCR4. J Mol Med (Berl) 92, 433–439 (2014). [DOI] [PubMed] [Google Scholar]
- 18.Nie Y, et al. The role of CXCR4 in maintaining peripheral B cell compartments and humoral immunity. J Exp Med 200, 1145–1156 (2004). [DOI] [PMC free article] [PubMed] [Google Scholar]
- 19.Sugiyama T, Kohara H, Noda M & Nagasawa T Maintenance of the hematopoietic stem cell pool by CXCL12-CXCR4 chemokine signaling in bone marrow stromal cell niches. Immunity 25, 977–988 (2006). [DOI] [PubMed] [Google Scholar]
- 20.Cruz-Orengo L, et al. CXCR7 influences leukocyte entry into the CNS parenchyma by controlling abluminal CXCL12 abundance during autoimmunity. J Exp Med 208, 327–339 (2011). [DOI] [PMC free article] [PubMed] [Google Scholar]
- 21.McCandless EE, Wang Q, Woerner BM, Harper JM & Klein RS CXCL12 limits inflammation by localizing mononuclear infiltrates to the perivascular space during experimental autoimmune encephalomyelitis. J Immunol 177, 8053–8064 (2006). [DOI] [PubMed] [Google Scholar]
- 22.Banisadr G, et al. Integrin/Chemokine receptor interactions in the pathogenesis of experimental autoimmune encephalomyelitis. J Neuroimmune Pharmacol 9, 438–445 (2014). [DOI] [PMC free article] [PubMed] [Google Scholar]
- 23.Ruscher K, et al. Inhibition of CXCL12 signaling attenuates the postischemic immune response and improves functional recovery after stroke. J Cereb Blood Flow Metab 33, 1225–1234 (2013). [DOI] [PMC free article] [PubMed] [Google Scholar]
- 24.Chia K, Mazzolini J, Mione M & Sieger D Tumor initiating cells induce Cxcr4-mediated infiltration of pro-tumoral macrophages into the brain. Elife 7 (2018). [DOI] [PMC free article] [PubMed] [Google Scholar]
- 25.Stumm RK, et al. A dual role for the SDF-1/CXCR4 chemokine receptor system in adult brain: isoform-selective regulation of SDF-1 expression modulates CXCR4-dependent neuronal plasticity and cerebral leukocyte recruitment after focal ischemia. J Neurosci 22, 5865–5878 (2002). [DOI] [PMC free article] [PubMed] [Google Scholar]
- 26.Mass E, et al. Specification of tissue-resident macrophages during organogenesis. Science 353 (2016). [DOI] [PMC free article] [PubMed] [Google Scholar]
- 27.Stumm RK, et al. CXCR4 regulates interneuron migration in the developing neocortex. J Neurosci 23, 5123–5130 (2003). [DOI] [PMC free article] [PubMed] [Google Scholar]
- 28.Zou YR, Kottmann AH, Kuroda M, Taniuchi I & Littman DR Function of the chemokine receptor CXCR4 in haematopoiesis and in cerebellar development. Nature 393, 595–599 (1998). [DOI] [PubMed] [Google Scholar]
- 29.McGrath KE, Koniski AD, Maltby KM, McGann JK & Palis J Embryonic expression and function of the chemokine SDF-1 and its receptor, CXCR4. Dev Biol 213, 442–456 (1999). [DOI] [PubMed] [Google Scholar]
- 30.Nie Y, Han YC & Zou YR CXCR4 is required for the quiescence of primitive hematopoietic cells. J Exp Med 205, 777–783 (2008). [DOI] [PMC free article] [PubMed] [Google Scholar]
- 31.Roers A, Hiller B & Hornung V Recognition of Endogenous Nucleic Acids by the Innate Immune System. Immunity 44, 739–754 (2016). [DOI] [PubMed] [Google Scholar]
- 32.Cridland JA, et al. The mammalian PYHIN gene family: phylogeny, evolution and expression. BMC Evol Biol 12, 140 (2012). [DOI] [PMC free article] [PubMed] [Google Scholar]
- 33.Hornung V, Hartmann R, Ablasser A & Hopfner KP OAS proteins and cGAS: unifying concepts in sensing and responding to cytosolic nucleic acids. Nat Rev Immunol 14, 521–528 (2014). [DOI] [PMC free article] [PubMed] [Google Scholar]
- 34.Bruttger J, et al. Genetic Cell Ablation Reveals Clusters of Local Self-Renewing Microglia in the Mammalian Central Nervous System. Immunity 43, 92–106 (2015). [DOI] [PubMed] [Google Scholar]
- 35.Kronenberg G, et al. Distinguishing features of microglia- and monocyte-derived macrophages after stroke. Acta Neuropathol 135, 55i–568 (2018). [DOI] [PubMed] [Google Scholar]
- 36.Chu HX, et al. Evidence That Ly6C(hi) Monocytes are Protective in Acute Ischemic Stroke by Promoting M2 Macrophage Polarization. Stroke 46, 1929–1937 (2015). [DOI] [PubMed] [Google Scholar]
- 37.Wattananit S, et al. Monocyte-Derived Macrophages Contribute to Spontaneous Long-Term Functional Recovery after Stroke in Mice. J Neurosci 36, 4182–4195 (2016). [DOI] [PMC free article] [PubMed] [Google Scholar]
- 38.Jayaraj RL, Azimullah S, Beiram R, Jalal FY & Rosenberg GA Neuroinflammation: friend and foe for ischemic stroke. J Neuroinflammation 16, 142 (2019). [DOI] [PMC free article] [PubMed] [Google Scholar]
- 39.Ge R, et al. Choroid plexus-cerebrospinal fluid route for monocyte-derived macrophages after stroke. J Neuroinflammation 14, 153 (2017). [DOI] [PMC free article] [PubMed] [Google Scholar]
- 40.Jin WN, et al. Depletion of microglia exacerbates postischemic inflammation and brain injury. J Cereb Blood Flow Metab 37, 2224–2236 (2017). [DOI] [PMC free article] [PubMed] [Google Scholar]
- 41.Cohen M, et al. Chronic exposure to TGFbeta1 regulates myeloid cell inflammatory response in an IRF7-dependent manner. EMBO J 33, 2906–2921 (2014). [DOI] [PMC free article] [PubMed] [Google Scholar]
- 42.Kuo PC, et al. Interferon-beta Modulates Inflammatory Response in Cerebral Ischemia. J Am Heart Assoc 5 (2016). [DOI] [PMC free article] [PubMed] [Google Scholar]
- 43.Tran PB, Banisadr G, Ren D, Chenn A & Miller RJ Chemokine receptor expression by neural progenitor cells in neurogenic regions of mouse brain. J Comp Neurol 500, 1007–1033 (2007). [DOI] [PMC free article] [PubMed] [Google Scholar]
- 44.Gong S, et al. A gene expression atlas of the central nervous system based on bacterial artificial chromosomes. Nature 425, 917–925 (2003). [DOI] [PubMed] [Google Scholar]
- 45.Nagasawa T, et al. Defects of B-cell lymphopoiesis and bone-marrow myelopoiesis in mice lacking the CXC chemokine PBSF/SDF-1. Nature 382, 635–638 (1996). [DOI] [PubMed] [Google Scholar]
- 46.Madisen L, et al. A robust and high-throughput Cre reporting and characterization system for the whole mouse brain. Nat Neurosci 13, 133–140 (2010). [DOI] [PMC free article] [PubMed] [Google Scholar]
- 47.Watson BD, Dietrich WD, Busto R, Wachtel MS & Ginsberg MD Induction of reproducible brain infarction by photochemically initiated thrombosis. Ann Neurol 17, 497–504 (1985). [DOI] [PubMed] [Google Scholar]
- 48.Huang Z, et al. Effects of cerebral ischemia in mice deficient in neuronal nitric oxide synthase. Science 265, 1883–1885 (1994). [DOI] [PubMed] [Google Scholar]
- 49.Bederson JB, et al. Rat middle cerebral artery occlusion: evaluation of the model and development of a neurologic examination. Stroke 17, 472–476 (1986). [DOI] [PubMed] [Google Scholar]
- 50.Schindelin J, et al. Fiji: an open-source platform for biological-image analysis. Nat Methods 9, 676–682 (2012). [DOI] [PMC free article] [PubMed] [Google Scholar]
- 51.Plescher M, et al. Plaque-dependent morphological and electrophysiological heterogeneity of microglia in an Alzheimer’s disease mouse model. Glia 66, 1464–1480 (2018). [DOI] [PubMed] [Google Scholar]
- 52.Lein ES, et al. Genome-wide atlas of gene expression in the adult mouse brain. Nature 445, 168–176 (2007). [DOI] [PubMed] [Google Scholar]
- 53.Amend SR, Valkenburg KC & Pienta KJ Murine Hind Limb Long Bone Dissection and Bone Marrow Isolation. J Vis Exp (2016). [DOI] [PMC free article] [PubMed] [Google Scholar]
- 54.Picelli S, et al. Full-length RNA-seq from single cells using Smart-seq2. Nat Protoc 9, 171–181 (2014). [DOI] [PubMed] [Google Scholar]
- 55.Huang da W, Sherman BT & Lempicki RA Systematic and integrative analysis of large gene lists using DAVID bioinformatics resources. Nat Protoc 4, 44–57 (2009). [DOI] [PubMed] [Google Scholar]
- 56.Supek F, Bosnjak M, Skunca N & Smuc T REVIGO summarizes and visualizes long lists of gene ontology terms. PLoS One 6, e21800 (2011). [DOI] [PMC free article] [PubMed] [Google Scholar]
- 57.Bennett ML, et al. New tools for studying microglia in the mouse and human CNS. Proc Natl Acad Sci U S A 113, E1738–1746 (2016). [DOI] [PMC free article] [PubMed] [Google Scholar]
- 58.Lavin Y, et al. Tissue-resident macrophage enhancer landscapes are shaped by the local microenvironment. Cell 159, 1312–1326 (2014). [DOI] [PMC free article] [PubMed] [Google Scholar]
- 59.Heng TS, Painter MW & Immunological Genome Project C The Immunological Genome Project: networks of gene expression in immune cells. Nat Immunol 9, 1091–1094 (2008). [DOI] [PubMed] [Google Scholar]
- 60.Subramanian A, et al. Gene set enrichment analysis: a knowledge-based approach for interpreting genome-wide expression profiles. Proc Natl Acad Sci U S A 102, 15545–15550 (2005). [DOI] [PMC free article] [PubMed] [Google Scholar]
- 61.Mootha VK, et al. PGC-1alpha-responsive genes involved in oxidative phosphorylation are coordinately downregulated in human diabetes. Nat Genet 34, 267–273 (2003). [DOI] [PubMed] [Google Scholar]
- 62.Leek JT, Johnson WE, Parker HS, Jaffe AE & Storey JD The sva package for removing batch effects and other unwanted variation in high-throughput experiments. Bioinformatics 28, 882–883 (2012). [DOI] [PMC free article] [PubMed] [Google Scholar]
- 63.Ritchie ME, et al. limma powers differential expression analyses for RNA-sequencing and microarray studies. Nucleic Acids Res 43, e47 (2015). [DOI] [PMC free article] [PubMed] [Google Scholar]
Associated Data
This section collects any data citations, data availability statements, or supplementary materials included in this article.
Supplementary Materials
Data Availability Statement
Gene expression data are deposited in the GEO database (GSE120701). The data that support the findings of this study are available from the corresponding author upon reasonable request.


