

ABSTRACT
Background
Little data are available on the subject of gut microbiota composition in endurance athletes as well as connections between diet and specific bacteria abundance. However, most studies suggest that athletes’ microbiota undergoes major alterations, which may contribute to increased physical performance. Therefore, we decided to investigate differences in gut microbiota between healthy controls and endurance athletes.
Materials and methods
Stools samples were collected from 14 marathon runners, 11 cross-country skiers and 46 sedentary healthy controls. The athletes’ diet evaluation was performed with 24-h diet recall, using the Aliant programme. The 16S gene sequencing was performed using the Ion 16S Metagenomics Kit on Ion Torrent PGM sequencer. Taxonomic classification and diversity indices computation was performed with Mothur.
Results
20 and 5 taxa differentiated healthy controls from marathon runners and cross-country skiers, respectively. Both groups presented a lowered abundance of major gut microbiota genus, Bacteroidetes and higher abundance of Prevotella. The athletes’ microbiome was also more diverse in cross-country skiers than the one of sedentary controls (Simpson index p-value at 0.025). Thirty-one strong correlations (Spearman’s coefficient > 0.6) were uncovered between bacteria abundance and diet, including inverse correlation of Prevotella with sucrose intake, Phascolarctobacterium with polyunsaturated fatty acids as well as positive correlation of Christensenellaceae with folic acid intake and Agathobacter with fiber amount in diet.
Conclusions
The excessive training associates with both differences in composition and promotion of higher bacterial diversity. Taxons enriched in athletes are known to participate in fiber fermentation.
KEYWORDS: Athlete, microbiome, diet, 16S rRNA sequencing, Ion Torrent
Introduction
The human gut microbiota is one of the most complex sites of human body, comprising of approximately 500 species of Bacteria, Archea, Viruses, Fungi, and Eukaryota resulting in a biomass of more than 1.5 kg.1-3 Microbial species present in the gut are key contributors to host’s metabolism, mostly through production of various metabolites which bind to body membranes or specific receptors. Gut bacterial cells are also in direct contact with human cells, mainly using immune system, which is particularly active in large intestine.4
Three enterotypes can be distinguished within adult human gut microbiota, depending on abundance of three genera: Bacteroides, Prevotella, and Ruminococcus. Subtle functional differences between those enterotypes were also noted, including enrichment for synthesis of various vitamins and amino acids.5 It has been proven consistently that the mature human gut microbiota remains generally stable during extended periods of time,6-8 with many factors such as diet and environment9 affecting its long-term composition. More volatile alterations are prone to occur due to various diseases (including inflammatory bowel diseases10 and bacterial infections11) and administered medication – antibiotics are an obvious example here,12 but other drugs such as proton pump inhibitor may alter the microbial structure as well.13
Recently, more attention has also been brought to positive impact of physical exercise on microbiota composition and diversity (reviewed in14), however, in professional athletes those benefits seem may be indiscernible from dietary regime extremes.15 Even less knowledge is available on the subject of gut microbial composition on performance in endurance sports. Carbohydrate metabolism, performed by gut bacteria, seems to be of crucial importance here, as the elite athletes can derive up to 60% of their energy intake from poly- and monosaccharides.16,17 Gastrointestinal bacteria may also play an important role in modifying the activity of antioxidant enzymes18 and preventing dehydration.19
In order to verify association of professional endurance training with altered gut microbiota composition, we decided to investigate differences in gut microbiota between healthy controls (n = 46) and endurance athletes, including marathon runners (n = 14, MR) and cross-country skiers (n = 11, CCS). The analysis was conducted on taxonomical as well as functional level.
Results
NGS sequencing results
On average, there were 103,000 reads generated per sample, which passed the quality filtering thresholds. In every sample, more than 99.99% reads were classified into taxa. There were 470 taxa discovered, out of which 158 were present in more than 0.01% of total number of classified reads. Five most abundant genera were Bacteroides, Prevotella, Alistipes, Sutterella and Subdoligranulum (Figure 1).
Figure 1.

Taxonomic tree of genera present in marathon runners, cross-country skiers and control samples. The rings contain rough heatmap of bacteria abundance. The visualization was prepared with GraPhlAn.20
Enterotyping revealed 3 distinct enterotypes: enterotype 1 with prevalence of bacteria from Ruminococcaceae family and Barnesiella genus, enterotype 2 with prevalence of Prevotella and enterotype 3 with prevalence of Bacteroides. The enterotype was dependent on experimental group (Fisher’s exact test p-value 0.00052), with enterotype 3 significantly overrepresented in controls and underrepresented in MR and CCS, as well as enterotype 2 underrepresented in controls and overrepresented in MR (Table 1).
Table 1.
Enterotypes by group. Enterotypes split by experimental group. Percentage of each enterotype in each group is given between parentheses. Significant p-values in post-hoc test are designated with star notation: <0.001: ****, <0.01: **, <0.05: *.
| Enterotype | 1 | 2 | 3 |
|---|---|---|---|
| CONTROL | 12(26) | 7(15)*** | 27(59)*** |
| MR | 4(29) | 8(57)* | 2(14)* |
| CSS | 4(36) | 6(55) | 1(9)* |
Enterotypes’ drivers: 1- Ruminococcaceae family and Barnesiella genus, 2 – Prevotella, 3-Bacteroides
MR – marathon runners, CCS – cross-country skiers
Twenty taxa differentiated MR group from controls, including the most abundant Bacteroides and Prevotella (Table 2 and Table S1). On the other hand, 5 taxa differentiated CCS from controls, including, again, the most abundant taxon in gut microbiota – Bacteroides and Prevotella (Table 2 and Table S2). 16 and 4 of those taxa, respectively, were present in more than 1000 reads. In addition, 3 taxa differentiated CCS from MR, including two highly abundant taxa from Lachnospiraceae family. The microbial diversity and richness indices expressed as Simpson and Chao1 indices were significantly different (in comparison with healthy controls) for CCS group with p-values at 0.025 and 0.00048, respectively, while for MR group p-values for the respective indices were at 0.19 and 0.00059 (Figure 2).
Table 2.
Significantly different taxa abundances between control and studied sportsmen groups. Mann-Whitney U-test results were corrected for multiple hypotheses testing. The medians are given in the same order as the title of the comparison. Size indicates number of reads assigned to a given taxon.
| comparison | pValue | median1 | median2 | qValue | Size | Taxonomy |
|---|---|---|---|---|---|---|
| CONTROL VS MR | 7.71E-05 | 2.05E-03 | 7.15E-04 | 7.22E-03 | 17836 | Bacteria;Firmicutes;Clostridia;Clostridiales;Lachnospiraceae;Lachnoclostridium; |
| 8.48E-05 | 2.40E-04 | 2.80E-03 | 7.22E-03 | 15511 | Bacteria;Proteobacteria;Gammaproteobacteria;Pasteurellales;Pasteurellaceae;Haemophilus; | |
| 2.15E-04 | 2.41E-04 | 1.45E-03 | 1.06E-02 | 9395 | Bacteria;Proteobacteria;Gammaproteobacteria;Pasteurellales;Pasteurellaceae; | |
| 5.21E-04 | 2.69E-03 | 1.70E-02 | 1.72E-02 | 89062 | Bacteria;Firmicutes;Clostridia;Clostridiales;Lachnospiraceae;Lachnospiraceae_NK4A136_group; | |
| 4.42E-04 | 1.61E-04 | 8.84E-04 | 1.72E-02 | 4462 | Bacteria;Proteobacteria;Gammaproteobacteria;Gammaproteobacteria_unclassified;Gammaproteobacteria_unclassified; | |
| 7.42E-04 | 3.64E-01 | 1.54E-01 | 1.84E-02 | 2124372 | Bacteria;Bacteroidetes;Bacteroidia;Bacteroidales;Bacteroidaceae;Bacteroides; | |
| 7.43E-04 | 1.63E-05 | 2.24E-01 | 1.84E-02 | 758041 | Bacteria;Bacteroidetes;Bacteroidia;Bacteroidales;Prevotellaceae;Prevotella_9; | |
| 1.22E-03 | 4.41E-03 | 1.55E-03 | 2.41E-02 | 39516 | Bacteria;Firmicutes;Clostridia;Clostridiales;Lachnospiraceae;Blautia; | |
| 1.54E-03 | 0.00E+00 | 1.16E-03 | 2.53E-02 | 21163 | Bacteria;Firmicutes;Erysipelotrichia;Erysipelotrichales;Erysipelotrichaceae;Holdemanella; | |
| 1.50E-03 | 2.95E-04 | 1.30E-03 | 2.53E-02 | 12806 | Bacteria;Firmicutes;Negativicutes;Selenomonadales;Veillonellaceae;Veillonella; | |
| 1.91E-03 | 5.55E-05 | 2.76E-04 | 2.92E-02 | 4985 | Bacteria;Firmicutes;Clostridia;Clostridiales;Clostridiaceae_1;Clostridium_sensu_stricto_1; | |
| 2.19E-03 | 0.00E+00 | 8.05E-03 | 3.10E-02 | 38641 | Bacteria;Tenericutes;Mollicutes;Mollicutes_RF39;Mollicutes_RF39_fa;Mollicutes_RF39_ge; | |
| 3.70E-03 | 4.57E-03 | 2.49E-03 | 4.62E-02 | 33799 | Bacteria;Firmicutes;Clostridia;Clostridiales;Ruminococcaceae;Faecalibacterium; | |
| 3.74E-03 | 0.00E+00 | 6.91E-05 | 4.62E-02 | 25023 | Bacteria;Bacteroidetes;Bacteroidia;Bacteroidales;Muribaculaceae;Muribaculaceae_ge; | |
| 4.20E-03 | 0.00E+00 | 6.36E-05 | 4.62E-02 | 1254 | Bacteria;Actinobacteria;Coriobacteriia;Coriobacteriales;Eggerthellaceae;uncultured; | |
| 4.75E-03 | 1.16E-02 | 2.59E-02 | 4.95E-02 | 142179 | Bacteria;Firmicutes;Clostridia;Clostridiales;Ruminococcaceae;Ruminococcaceae_UCG-002; | |
| CONTROL VS CCS | 1.90E-06 | 0.00E+00 | 3.04E-03 | 3.80E-04 | 8875 | Bacteria;Firmicutes;Erysipelotrichia;Erysipelotrichales;Erysipelotrichaceae;Catenibacterium; |
| 1.89E-05 | 0.00E+00 | 2.03E-04 | 1.89E-03 | 1254 | Bacteria;Actinobacteria;Coriobacteriia;Coriobacteriales;Eggerthellaceae;uncultured; | |
| 3.27E-04 | 1.63E-05 | 1.16E-01 | 2.18E-02 | 758041 | Bacteria;Bacteroidetes;Bacteroidia;Bacteroidales;Prevotellaceae;Prevotella_9; | |
| 4.41E-04 | 3.64E-01 | 1.50E-01 | 2.21E-02 | 2124372 | Bacteria;Bacteroidetes;Bacteroidia;Bacteroidales;Bacteroidaceae;Bacteroides; | |
| 7.60E-04 | 0.00E+00 | 1.67E-04 | 3.04E-02 | 688 | Bacteria;Actinobacteria;Coriobacteriia;Coriobacteriales;Eggerthellaceae;Senegalimassilia; | |
| CCS vs MR | 3.00E-04 | 4.37E-03 | 2.55E-03 | 2.19E-02 | 33004 | Bacteria;Firmicutes;Clostridia;Clostridiales;Lachnospiraceae;Lachnospiraceae_ge; |
| 3.00E-04 | 2.18E-03 | 7.49E-04 | 2.19E-02 | 14049 | Bacteria;Firmicutes;Clostridia;Clostridiales;Lachnospiraceae;Lachnospiraceae_ND3007_group; | |
| 1.34E-04 | 2.82E-05 | 0.00E+00 | 2.19E-02 | 336 | Bacteria;Actinobacteria;Coriobacteriia;Coriobacteriales;Coriobacteriaceae; |
MR – marathon runners, CCS – cross-country skiers
Figure 2.
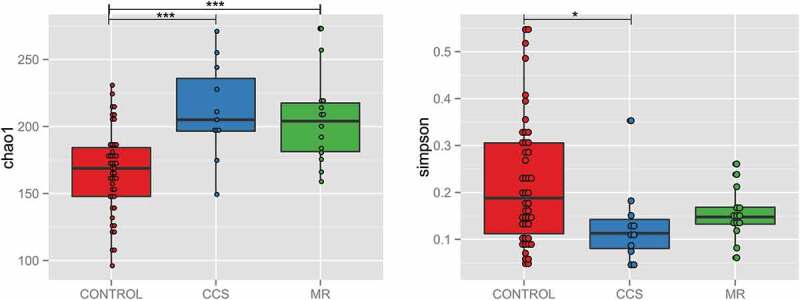
Boxplots of Chao1 species richness index (a) and Simpson community diversity index (b) in controls compared to marathoners (MR) and cross-country skiers (CCS). * p-value < 0.05.
The Firmicutes to Bacteroidetes (F/B) median ratio was at 0.4. 0.6 and 0.69 for healthy controls, MR and CCS, respectively, and reached a significant value of p = .043 for healthy controls vs CCS comparison. Thirty-eight and 5 metabolic pathways differentiated MR and CCS groups from controls, respectively, and the primary bile acid biosynthesis and D-Alanine metabolism pathways were common for athletes’ groups (Figure 3, Table S3).
Figure 3.

Boxplot of negative logarithm of abundances of 5 most significant metabolic pathways based (from comparison from each athlete group with controls) on KEGG pathway assignment to bacterial taxa in comparison between controls studied sportsmen groups. MR – marathon runners; CCS – cross-country skiers. The abbreviations for each pathway are as follows: Biotin metabolism, Btnm; Primary bile acid biosynthesis, Pbab; Arachidonic acid metabolism, Aram; D-Alanine metabolism, D-Am; Butirosin and neomycin biosynthesis, Banb; Starch and sucrose metabolism, Sasm; Histidine metabolism, Hstm; Phenylpropanoid biosynthesis, Phnb; Photosynthesis – antenna proteins, P-ap.
Diet characteristics The basic diet characteristics did not differ between discipline groups (Table 3 and Table S4). 75% of athletes declared that they ate at least 250 g of vegetables daily and 83% consumed at least one portion of fruit. Diversity, as measured by Simpson index, was positively correlated with quantities of nutrients consumed, represented by measures such as overall energy intake and amount of protein in diet. Diversity was also associated with copper and zinc intake (Table 4). 31 correlations (Spearman’s coefficients absolute value higher than 0.6) were found between different taxa abundance and various dietary characteristics (Figure 4, Table S5). The most abundant taxa correlated with diet were Prevotella (inverse correlation with sucrose intake), Phascolarctobacterium (negatively correlated with amount of polyunsaturated fatty acids in diet), taxa from Christensenellaceae family (correlated with folic acid) and Agathobacter (correlated with fiber intake).
Table 3.
Dietary characteristics of disciplines – a summary.
| MR |
CCS |
|||||
|---|---|---|---|---|---|---|
| Dietary characteristic | mean | median | sd | mean | median | sd |
| Calories intake [kcal] | 2650.32 | 2605.50 | 424.70 | 2684.13 | 2813.67 | 840.49 |
| % of energy derived from proteins | 20.66 | 20.20 | 4.05 | 20.01 | 19.60 | 2.24 |
| Protein [g] | 136.61 | 136.07 | 31.55 | 131.76 | 140.35 | 35.31 |
| % of energy derived from carbohydrates | 44.99 | 45.90 | 6.62 | 44.01 | 44.40 | 5.65 |
| Carbohydrates [g] | 312.35 | 306.33 | 62.12 | 305.26 | 331.58 | 74.09 |
| % of energy derived from fat | 34.35 | 34.65 | 3.83 | 35.98 | 35.45 | 6.41 |
| Fat [g] | 101.67 | 98.68 | 22.29 | 111.51 | 110.78 | 52.29 |
| Fiber [g] | 24.76 | 24.28 | 7.06 | 26.91 | 23.92 | 9.23 |
MR – marathon runners, CCS – cross-country skiers
Table 4.
Dietary characteristics associated with microbiota diversity. P-values, coefficient estimates and standard errors are derived from multivariate linear regression models with sex and discipline as cofounders.
| Dietary characteristic | Estimate | Std error | Statistic | p-value |
|---|---|---|---|---|
| Caloric intake | 5.43E-05 | 2.23E-05 | 2.44 | 0.025426 |
| Protein [g] | 9.90E-04 | 4.62E-04 | 2.14 | 4.59E-02 |
| Zinc [mg] | 9.22E-03 | 3.81E-03 | 2.42 | 2.65E-02 |
Figure 4.
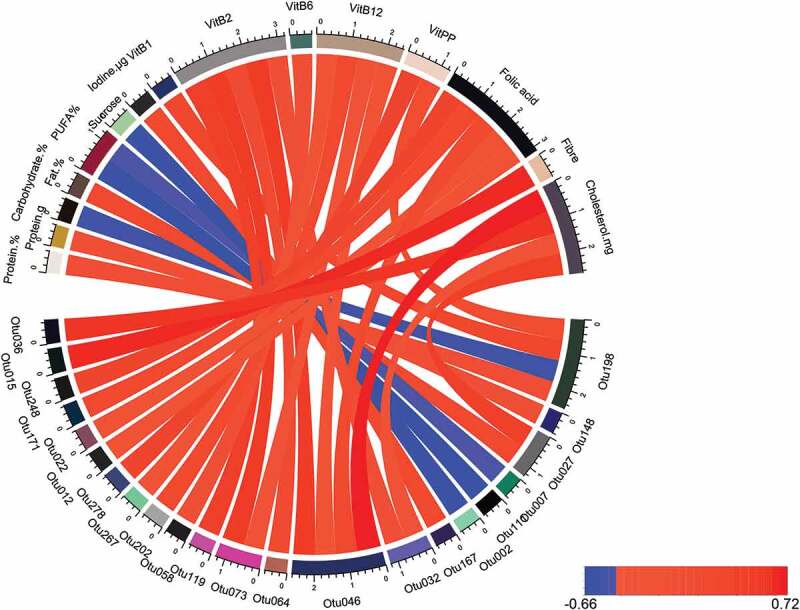
Correlations between taxa abundance and dietary elements. The correlations presented are for Spearman coefficient with absolute value larger than 0.6. Positive correlations are represented in red, while negative in blue. The visualization was prepared with R package circlize.21
Discussion
It has been consistently reported that physical exercise contributes to higher microbial diversity and compositional alterations in the gut.22,23 Microbial diversity is also elevated with higher maximal oxygen uptake (VO2 max/kg), which in elite athletes can be twice as high as in sedentary subjects.24 In our study, both athletes’ groups were characterized by elevated species richness and diversity. The changes seemed more pronounced in the CCS group, possibly due to sample collection during a more intensive training period. On principle, the more diverse gut microbiota is perceived as beneficial, as lack of diversity was found to be associated with multiple diseases, including arthritis,25 diabetes type 1 and 2,26,27 arterial stiffness28 and obesity.29 The more diverse microbiota is thought to be highly resistant against harmful environmental factors.30
Bacteroidetes and Firmicutes are two most abundant phyla in human gut microbiome, thus Firmicutes/Bacteroidetes (F/B) ratio is often used to characterize its general composition. Both groups of athletes present with elevated F/B ratio, which has been mostly associated with various disruptions to metabolic homeostasis (such as obesity31). However, different studies on this subject often contradict this statement (for instance in32), and there seems to be no consensus on optimal or healthy F/B ratio values. On the other hand, the increased abundance of Firmicutes was associated with intensity of exercise in mouse33 and rat34 models. Observed elevated abundance of Firmicutes is also in accordance with Clarke et al.15 The exact significance of this finding remains unknown. Unfortunately, our study lacks a metabolic assay and therefore we were unable to verify the existence of association between elevated F/B ratio and higher butyrate concentration. Recently, elevated F/B ratio was also correlated with higher maximal oxygen uptake35 (VO2 max/kg), which is a key characteristic of elite athletes, as mentioned above.
Another abundant gut taxon – Prevotella is overrepresented in both MR and CCS groups, with MR group displaying an overrepresentation of Prevotella driven enterotype as well. This genus is commonly associated with more “traditional”, rural diet, rich in carbohydrates and vegetables rather than animal fat and protein.36 Recently Petersen and coworkers found high abundance of the genus Prevotella (≥2.5%) in competitive cyclists’ gut microbiota. The abundance was significantly correlated with weekly duration of exercise.37 It was also found to promote better glucose tolerance and increased glycogen storage in mice.38 Interestingly, in our study, Prevotella shows a strong negative correlation with amounts of sucrose consumed. It may suggest that this particular genus tolerates poorly this relatively new addition to human diet. We have also observed a more than 4-fold increase of Veilonella genus abundance in MR, which is in line of recent findings by Scheiman et al., who have recently proved the performance-enhancing properties of Veilonella atypica.39
While we did not perform analysis of metabolome, we are able to indirectly infer metabolic alterations from KEGG pathways, associated with bacterial genera. Indeed, there is mounting evidence that the human metabolome is significantly affected by the gut microbiota.40 Significant alterations in the metabolic profiles of outstanding athletes were previously reported. Recently, Al-Khelaifi et al. showed that metabolome profiles of top-level power and endurance athletes are markedly distinct, reflecting steroid biosynthesis, fatty acid metabolism, oxidative stress, and energy-related metabolites.41 For instance, metabolites pinpointing histidine metabolism differentiate power athletes from sedentary controls, while galactose metabolism markers differentiate endurance athletes form controls. We can partially confirm these findings in our study, with D-alanine and primary bile acid biosynthesis differentiating both athletes’ groups from controls, while galactose and arachidonic acid metabolism differentiate marathon runners. The question remains to what extent the athletes benefit from these potential functional changes in microbiome. Alanine metabolism seems to be of crucial importance for athletes, as β-alanine along with L-histidine forms a dipeptide carnosine. While carnosine is synthesized in several tissues, it displays its highest concentrations in skeletal muscles and plays a role as proton buffer and/or calcium regulator.42 β-alanine serves as the rate-limiting precursor for carnosine synthesis in muscle, and raised muscle carnosine concentrations are associated with performance-enhancing (ergogenic) effects on high-intensity exercise.43 Arachidonic acid is crucial for prostaglandins synthesis (reviewed in44), which takes place in muscles during intensive physical exercise. However, its impact on muscle growth during supplementation seems to be limited.45
Another important pathway differentiating both athlete groups from sedentary controls is primary bile acid metabolism. Primary bile acids are ligands for fernesoid-X-receptor, which controls hepatic de novo lipogenesis, very-low-density lipoprotein-triglyceride export, and plasma triglyceride turnover leading to improved lipid and glucose metabolism.46 It is proposed that gut microbiota can affect hepatic adiposity by altering bile acid circulation via FXR and TGR5 mechanisms. Exercise training was also shown to alter circulation of bile acids. It was demonstrated that hypercholesterolemic mice heavily trained in a running wheel displayed increased bile acid secretion and increased fecal bile acid outputs compared to sedentary mice.47 As the bile acids are potent regulators of gut microbiota community structure, changes in their pool could significantly contribute to microbial alterations, associated with exercise.
Several limitations of our study are to be noted, especially concerning its cross-sectional design and lack of direct metabolomics assay. A longitudinal study would be beneficial to confirm our findings, as well as the stability of the observed changes.
To conclude, in this study, we provide the overview of gut microbiota in Polish elite athletes. We have confirmed previous findings that the physical exercise promotes higher microbial diversity and large alterations to microbial community composition. We have observed, as others previously did, the higher abundance of complex carbohydrates fermenters (from Prevotella genus and Firmicutes phylum). Indirect analysis of microbial pathways abundance suggests large alterations on metabolic level as well.
Subjects and methods
Participants
The study group consists of 14 MRs, 11 professional CCSs and 46 healthy control individuals. The control group consisted of 30 individuals enrolled in our previous study48 and 16 undergraduate students with a sedentary lifestyle. There were 31 women and 14 men, aged 14–72 (data were unavailable for one participant). Sportsmen were elite Polish athletes representing the highest level of training endurance sports (a master class sports). All were multiple Polish champions and most of the participants reached the highest places at international competitions and World Cups. The study was carried out during the preparatory period of the annual training cycle. The training protocol followed by individual athletes was designed in line with the demands of their sport, training objectives and the stage of the preparatory period.
A lifestyle that includes duration and type of daily physical activity, weekly frequency of physical efforts and training load characteristics were assessed by means of a survey using a questionnaire. Additionally, energy expenditure was estimated using a heart-rate monitoring method. The athletes trained on average 1.58 ± 0.58 times a day, taking 7.25 ± 2.17 training units per week lasting 2.79 ± 1.74 h per day on average. Additional physical activity (apart from endurance efforts) was undertaken by a small percentage of athletes (16.6%) and they were short-term (1.5 h) training in the gym. The baseline characteristics for athletes are presented in Table 5. The average value of VO2max in the CCS group was 66.57 [ml/kg/min] and average value of HRmax was 197.2 [bpm]. In the group of MRs the main measured parameter of sport level status was the achieved time of a marathon run (one of investigated runners – 2:07 h, seven runners – less than 2:30 h and six runners – 2:30–3:15 h). Exclusion criteria included antibiotic treatment within the previous 12 months and presence of gastrointestinal co-morbidities. Quantitative diet evaluation was based on 24-h diet recall with the use of the Aliant programme. Nutritional status (body fat, lean body mass, muscle mass, cell mass and water content) was evaluated with the BIA method using the Akern Srl; body analyzer and Bodygram software. This study was conducted in accordance with the Declaration of Helsinki and approved by Institute of Oncology Local Bioethics Board (decision 54/2017).
Table 5.
Anthropometric indicators and between-group differences in means.
| Group | FMR |
FCCS |
MMR |
MCCS |
||||||||||||
|---|---|---|---|---|---|---|---|---|---|---|---|---|---|---|---|---|
| Mean | SD | Min | Max | Mean | SD | Min | Max | Mean | SD | Min | Max | Mean | SD | Min | Max | |
| Age (years) | 34.5 | 3.5 | 32 | 37 | 28.6 | 4.6 | 23 | 35 | 29.8 | 3.9 | 24 | 35 | 21 | 3.3 | 18 | 27 |
| BH (cm) | 169 | 12.7 | 160 | 178 | 167 | 4.4 | 160 | 172 | 178.9 | 4.8 | 169 | 186 | 177.3 | 4.5 | 172 | 183 |
| BM (kg) | 50.4 | 7.1 | 45.4 | 55.4 | 59.4 | 5.2 | 51.7 | 63.7 | 65.8 | 5 | 54.8 | 75 | 71.9 | 5.4 | 62.4 | 78.5 |
| TBW (lt) | 30.9 | 4.4 | 27.8 | 34 | 36.5 | 2.7 | 32.2 | 39.4 | 43.2 | 3.6 | 36.5 | 47.8 | 49 | 3.4 | 43.2 | 53.5 |
| BF (kg) | 8.2 | 1.1 | 7.4 | 9 | 9.3 | 1.8 | 7.2 | 11.3 | 5.9 | 2.7 | 2.3 | 9.7 | 4.9 | 1 | 3.4 | 6.3 |
| FFM (kg) | 42.2 | 5.9 | 38 | 46.4 | 50 | 3.9 | 44 | 54.2 | 59.8 | 5.1 | 49.9 | 65.3 | 67 | 4.74 | 59 | 73.4 |
| MM (kg) | 23.4 | 3.25 | 21.1 | 25.7 | 28.3 | 2.3 | 24.8 | 30.9 | 38.5 | 10.1 | 28.7 | 59.2 | 39.3 | 2.9 | 33.9 | 42.5 |
FMR – female marathon runners, FCCS – female cross-country skiers, MMR – male marathon runners, MCCS – male cross-country skiers
BH – body height, BM – body mass, TBW – total body water, BF – body fat, FFM – fat free mass, MM – muscle mass
DNA extraction
The fecal samples were self-collected using a stool specimen collection kit consisting of a Styrofoam box containing a sterile tube with spatula for stool samples, and an ice pack. Following the collection, the samples were transported at 4°C to the laboratory. Each sample was divided in two 1.5 ml Eppendorf tubes and stored at 80°C until DNA isolation. DNA isolation was performed using the QIAamp DNA Stool Kit protocol (Qiagen) according to the manufacturer’s protocol, using 200 mg of fecal sample. DNA measured with Nanodrop (Thermo Scientific) spectrophotometer and is stored in EB buffer at – 20°C until further analysis.
16 S rRNA hypervariable regions sequencing, bacterial taxonomy identification, data visualization, and statistical analyses of taxonomy
Sequencing was performed using Ion 16S Metagenomics Kit (Thermo) on the Ion Torrent Personal Genome Machine (PGM) platform (Thermo) as described previously.48-50 Unmapped bam files were converted to fastq using Picard’s51 SamToFastq. Additional steps of the analysis were performed using Mothur52 version 1.38 software. Fastq files were converted into the fasta format. For analyses, only the sequences that were between 200 and 300 bases in length, had an average base quality of 20 in a sliding window of 50 bases, and had a maximum homopolymer length of 10 were kept. Chimeric sequences were identified with the UCHIME53 algorithm using default parameters and internal sequence collection as the reference database. Chimeric sequences were then removed. The remaining 16 S rRNA sequences were classified using the Wang method and the SILVA54 bacterial 16 S rRNA database for reference (release 132), at an 80% bootstrap cutoff. Simpson’s diversity index (D) and Chao richness index were counted with Mothur. Enterotypes were assigned according to methods described by Arumugam et al.,5 using R code present at https://enterotype.embl.de/enterotypes.html. Relationship between experimental group and enterotype was verified with Fisher’s exact test. Post-hoc analysis was performed according to methods described by Shan and Gerstenberger.55 Taxa abundances differences between groups were assessed with Mann-Whitney U-test. Diversity indices differences were assessed with Student’s t-test. All p-values were corrected for multiple hypotheses testing using the Benjamini–Hochberg procedure to minimize the false discovery rate (FDR).56
Functional analysis
The obtained sequences were re-classified with greengenes57 database reference (release 13_8_99) for further functional analyses. Metagenome functional content was assessed with PICRUSt ver. 1.0.58 Differential pathway abundance was assessed with Mann-Whitney U-test, taking only pathways from KEGG “Metabolism” category into consideration.
Analysis of diet contribution to microbial diversity Differences in intake of dietary elements were assessed with Mann-Whitney U-test. Association between diversity and richness indices was assessed with linear regression, after correction for gender and discipline. For this analysis, Simpson’s index was defined as 1-D to facilitate interpretation. For correlation between taxa abundance and major dietary components, the Spearman’s coefficients were computed.
Supplementary Material
Funding Statement
This work was supported by a grant to JO from the National Science Center (Narodowe Centrum Nauki) [2018/29/B/NZ7/00809].
Disclosure of Potential Conflicts of Interest
The authors declare no conflict of interest.
Supplementary material
Supplemental data for this article can be accessed on the publisher’s website.
References
- 1.Neish AS. Microbes in gastrointestinal health and disease. Gastroenterology. 2009;136(1):65–80. doi: 10.1053/j.gastro.2008.10.080. [DOI] [PMC free article] [PubMed] [Google Scholar]
- 2.Tilg H, Moschen AR.. Microbiota and diabetes: an evolving relationship. Gut. 2014;63:1513–1521. doi: 10.1136/gutjnl-2014-306928. [DOI] [PubMed] [Google Scholar]
- 3.Tuddenham S, Sears CL. The intestinal microbiome and health. Curr Opin Infect Dis. 2015;28(5):464–470. doi: 10.1097/QCO.0000000000000196. [DOI] [PMC free article] [PubMed] [Google Scholar]
- 4.Cani PD. Human gut microbiome: hopes, threats and promises. Gut. 2018;67(9):1716–1725. doi: 10.1136/gutjnl-2018-316723. [DOI] [PMC free article] [PubMed] [Google Scholar]
- 5.Arumugam M, Raes J, Pelletier E, Le Paslier D, Yamada T, Mende DR, Fernandes GR, Tap J, Bruls T, Batto J-M, et al. Enterotypes of the human gut microbiome. Nature. 2011;473(7346):174–180. doi: 10.1038/nature09944 [DOI] [PMC free article] [PubMed] [Google Scholar]
- 6.Caporaso JG, Lauber CL, Costello EK, Berg-Lyons D, Gonzalez A, Stombaugh J, Knights D, Gajer P, Ravel J, Fierer N, et al. Moving pictures of the human microbiome. Genome Biol. 2011;12(5):R50. doi: 10.1186/gb-2011-12-5-r50. [DOI] [PMC free article] [PubMed] [Google Scholar]
- 7.David LA, Materna AC, Friedman J, Campos-Baptista MI, Blackburn MC, Perrotta A, Erdman SE, Alm EJ. Host lifestyle affects human microbiota on daily timescales. Genome Biol. 2014;15(7):R89. doi: 10.1186/gb-2014-15-7-r89. [DOI] [PMC free article] [PubMed] [Google Scholar]
- 8.Faith JJ, Guruge JL, Charbonneau M, Subramanian S, Seedorf H, Goodman AL, Clemente JC, Knight R, Heath AC, Leibel RL, et al. The long-term stability of the human gut microbiota. Science. 2013;341(6141):1237439. doi: 10.1126/science.1237439. [DOI] [PMC free article] [PubMed] [Google Scholar]
- 9.De Filippo C, Cavalieri D, Di Paola M, Ramazzotti M, Poullet JB, Massart S, Collini S, Pieraccini G, Lionetti P. Impact of diet in shaping gut microbiota revealed by a comparative study in children from Europe and rural Africa. Proc Natl Acad Sci USA. 2009;136:65–80. doi: 10.1073/pnas.1005963107. [DOI] [PMC free article] [PubMed] [Google Scholar]
- 10.Frank DN, St Amand AL, Feldman RA, Boedeker EC, Harpaz N, Pace NR. Molecular-phylogenetic characterization of microbial community imbalances in human inflammatory bowel diseases. Proc Natl Acad Sci USA. 2007;104:13780–13785. doi: 10.1073/pnas.0706625104. [DOI] [PMC free article] [PubMed] [Google Scholar]
- 11.Chang JY, Antonopoulos DA, Kalra A, Tonelli A, Khalife WT, Schmidt TM, Young V. Decreased diversity of the fecal microbiome in recurrent clostridium difficile-associated diarrhea. J Infect Dis. 2008;197:435–438. doi: 10.1086/525047. [DOI] [PubMed] [Google Scholar]
- 12.Reijnders D, Goossens GH, Hermes GDA, Neis EPJG, van der Beek CM, Most J, Holst J, Lenaerts K, Kootte R, Nieuwdorp M. Effects of gut microbiota manipulation by antibiotics on host metabolism in obese humans: a randomized double-blind placebo-controlled trial. Cell Metab. 2016;24:63–74. doi: 10.1016/j.cmet.2016.06.016. [DOI] [PubMed] [Google Scholar]
- 13.Jackson MA, Goodrich JK, Maxan M-E, Freedberg DE, Abrams JA, Poole AC, Sutter JL, Welter D, Ley RE, Bell JT, et al. Proton pump inhibitors alter the composition of the gut microbiota. Gut. 2016;65(5):749–756. doi: 10.1136/gutjnl-2015-310861. [DOI] [PMC free article] [PubMed] [Google Scholar]
- 14.Campbell SC, Wisniewski PJ. Exercise is a novel promoter of intestinal health and microbial diversity. Exerc Sport Sci Rev. 2017;45:41–47. doi: 10.1249/JES.0000000000000096. [DOI] [PubMed] [Google Scholar]
- 15.Clarke SF, Murphy EF, O’Sullivan O, Lucey AJ, Humphreys M, Hogan A, Hayes P, O’Reilly M, Jeffery IB, Wood-Martin R, et al. Exercise and associated dietary extremes impact on gut microbial diversity. Gut. 2014;63(12):1913–1920. doi: 10.1136/gutjnl-2013-306541. [DOI] [PubMed] [Google Scholar]
- 16.Mach N, Fuster-Botella D. Endurance exercise and gut microbiota: A review. J Sport Health Sci. 2017;6(2):179–197. doi: 10.1016/j.jshs.2016.05.001. [DOI] [PMC free article] [PubMed] [Google Scholar]
- 17.Murtaza N, Burke LM, Vlahovich N, Charlesson B, O’Neill HM, Ross ML, Campbell K, Krause L, Morrison M. Analysis of the effects of dietary pattern on the oral microbiome of elite endurance athletes. Nutrients. 2019;11(3):614. doi: 10.3390/nu11030614. [DOI] [PMC free article] [PubMed] [Google Scholar]
- 18.Hsu YJ, Chiu CC, Li YP, Huang WC, Huang YT, Huang CC, Chuang HL. Effect of intestinal microbiota on exercise performance in mice. J Strength Cond Res. 2015;29(2):552–558. doi: 10.1519/JSC.0000000000000644. [DOI] [PubMed] [Google Scholar]
- 19.Redondo Useros N, Gheorghe A, Serrano Labajos R, Nova Rebato E, Marcos Sanchez A. HYDRAGUT study: influence of HYDRAtion status on the GUT microbiota and their impact on the immune system. Faseb J. 2015;29:593.1. [Google Scholar]
- 20.McIver LJ, Abu-Ali G, Franzosa EA, Schwager R, Morgan XC, Waldron L, Segata N, Huttenhower C. bioBakery: a meta’omic analysis environment. Bioinformatics. 2018;34(7):1235–1237. doi: 10.1093/bioinformatics/btx754. [DOI] [PMC free article] [PubMed] [Google Scholar]
- 21.Gu Z, Gu L, Eils R, Schlesner M, Brors B. circlize implements and enhances circular visualization in R. Bioinformatics. 2014;30(19):2811–2812. doi: 10.1093/bioinformatics/btu393. [DOI] [PubMed] [Google Scholar]
- 22.Allen JM, Mailing LJ, Niemiro GM, Moore R, Cook MD, White BA, Holscher HD, Woods JA. Exercise alters gut microbiota composition and function in lean and obese humans. Med Sci Sports Exerc. 2018;50:747–757. doi: 10.1249/MSS.0000000000001495. [DOI] [PubMed] [Google Scholar]
- 23.Cronin O, Barton W, Skuse P, Penney NC, Garcia-Perez I, Murphy EF, Woods T, Nugent H, Fanning A, Melgar S. A prospective metagenomic and metabolomic analysis of the impact of exercise and/or whey protein supplementation on the gut microbiome of sedentary adults. mSystems. 2018;3(3). doi: 10.1128/mSystems.00044-18. [DOI] [PMC free article] [PubMed] [Google Scholar]
- 24.Joyner MJ, Coyle EF. Endurance exercise performance: the physiology of champions. J Physiol. 2008;586(Pt 1):35–44. doi: 10.1113/jphysiol.2007.143834. [DOI] [PMC free article] [PubMed] [Google Scholar]
- 25.Scher JU, Ubeda C, Artacho A, Attur M, Isaac S, Reddy SM, Marmon S, Neimann A, Brusca S, Patel T, et al. Decreased bacterial diversity characterizes the altered gut microbiota in patients with psoriatic arthritis, resembling dysbiosis in inflammatory bowel disease. Arthritis Rheumatol (Hoboken, NJ). 2015;67(1):128–139. doi: 10.1002/art.38892. [DOI] [PMC free article] [PubMed] [Google Scholar]
- 26.de Goffau MC, Luopajärvi K, Knip M, Ilonen J, Ruohtula T, Härkönen T, Orivuori L, Hakala S, Welling GW, Harmsen HJ, et al. Fecal microbiota composition differs between children with β-cell autoimmunity and those without. Diabetes. 2013;62(4):1238–1244. doi: 10.2337/db12-0526. [DOI] [PMC free article] [PubMed] [Google Scholar]
- 27.Lambeth SM, Carson T, Lowe J, Ramaraj T, Leff JW, Luo L, Bell CJ, Shah VO. Composition, diversity and abundance of gut microbiome in prediabetes and type 2 diabetes. J Diabetes Obes. 2015;2:1–7. doi: 10.15436/2376-0949.15.031. [DOI] [PMC free article] [PubMed] [Google Scholar]
- 28.Menni C, Lin C, Cecelja M, Mangino M, Matey-Hernandez ML, Keehn L, Mohney RP, Steves CJ, Spector TD, Kuo C-F, et al. Gut microbial diversity is associated with lower arterial stiffness in women. Eur Heart J. 2018;39(25):2390–2397. doi: 10.1093/eurheartj/ehy226. [DOI] [PMC free article] [PubMed] [Google Scholar]
- 29.Turnbaugh PJ, Hamady M, Yatsunenko T, Cantarel BL, Duncan A, Ley RE, Sogin ML, Jones WJ, Roe BA, Affourtit JP, et al. A core gut microbiome in obese and lean twins. Nature. 2009;457(7228):480–484. doi: 10.1038/nature07540. [DOI] [PMC free article] [PubMed] [Google Scholar]
- 30.Sommer F, Anderson JM, Bharti R, Raes J, Rosenstiel P. The resilience of the intestinal microbiota influences health and disease. Nat Rev Microbiol. 2017;15(10):630–638. doi: 10.1038/nrmicro.2017.58. [DOI] [PubMed] [Google Scholar]
- 31.Ley RE, Turnbaugh PJ, Klein S, Gordon JI. Human gut microbes associated with obesity. Nature. 2006;444(7122):1022. doi: 10.1038/4441022a. [DOI] [PubMed] [Google Scholar]
- 32.Duncan SH, Lobley GE, Holtrop G, Ince J, Johnstone AM, Louis P, Flint HJ. Human colonic microbiota associated with diet, obesity and weight loss. Int J Obes (Lond). 2008;32(11):1720–1724. doi: 10.1038/ijo.2008.155. [DOI] [PubMed] [Google Scholar]
- 33.Evans CC, LePard KJ, Kwak JW, Stancukas MC, Laskowski S, Dougherty J, Moulton L, Glawe A, Wang Y, Leone V, et al. Exercise prevents weight gain and alters the gut microbiota in a mouse model of high fat diet-induced obesity. PLoS One. 2014;9(3):e92193. doi: 10.1371/journal.pone.0092193. [DOI] [PMC free article] [PubMed] [Google Scholar]
- 34.Petriz BA, Castro AP, Almeida JA, Gomes CP, Fernandes GR, Kruger RH, Pereira RW, Franco OL. Exercise induction of gut microbiota modifications in obese, non-obese and hypertensive rats. BMC Genomics. 2014;15(1):511. doi: 10.1186/1471-2164-15-511. [DOI] [PMC free article] [PubMed] [Google Scholar]
- 35.Durk RP, Castillo E, Márquez-Magaña L, Grosicki GJ, Bolter ND, Lee CM, Bagley JR.. Gut microbiota composition is related to cardiorespiratory fitness in healthy young adults. Int J Sport Nutr Exerc Metab. 2018;29:1–5. [DOI] [PMC free article] [PubMed] [Google Scholar]
- 36.Requena T, Martínez-Cuesta MC, Peláez C. Diet and microbiota linked in health and disease. Food Funct. 2018;9(2):688–704. doi: 10.1039/C7FO01820G. [DOI] [PubMed] [Google Scholar]
- 37.Petersen LM, Bautista EJ, Nguyen H, Hanson BM, Chen L, Lek SH, Sodergren E, Weinstock GM. Community characteristics of the gut microbiomes of competitive cyclists. Microbiome. 2017;5(1):98. doi: 10.1186/s40168-017-0320-4. [DOI] [PMC free article] [PubMed] [Google Scholar]
- 38.Kovatcheva-Datchary P, Nilsson A, Akrami R, Lee YS, De Vadder F, Arora T, Hallen A, Martens E, Björck I, Bäckhed F. Dietary fiber-induced improvement in glucose metabolism is associated with increased abundance of prevotella. Cell Metab. 2015;22(6):971–982. doi: 10.1016/j.cmet.2015.10.001. [DOI] [PubMed] [Google Scholar]
- 39.Scheiman J, Luber JM, Chavkin TA, MacDonald T, Tung A, Pham L-D, Wibowo MC, Wurth RC, Punthambaker S, Tierney BT, et al. Meta-omics analysis of elite athletes identifies a performance-enhancing microbe that functions via lactate metabolism. Nat Med. 2019;25(7):1104–1109. doi: 10.1038/s41591-019-0485-4. [DOI] [PMC free article] [PubMed] [Google Scholar]
- 40.Barton W, Shanahan F, Cotter PD, O’Sullivan O. The metabolic role of the microbiota. Clin Liver Dis. 2015;5(4):91–93. doi: 10.1002/cld.455. [DOI] [PMC free article] [PubMed] [Google Scholar]
- 41.Al-Khelaifi F, Diboun I, Donati F, Botrè F, Alsayrafi M, Georgakopoulos C, Suhre K, Yousri NA, Elrayess MA. A pilot study comparing the metabolic profiles of elite-level athletes from different sporting disciplines. Sports Med Open. 2018;4:2. [DOI] [PMC free article] [PubMed] [Google Scholar]
- 42.Boldyrev AA, Aldini G, Derave W. Physiology and pathophysiology of carnosine. Physiol Rev. 2013;93:1803–1845. [DOI] [PubMed] [Google Scholar]
- 43.Blancquaert L, Everaert I, Missinne M, Baguet A, Stegen S, Volkaert A, Petrovic M, Vervaet C, Achten E, De Maeyer M, et al. Effects of histidine and β-alanine supplementation on human muscle carnosine storage. Med Sci Sports Exerc. 2017;49:602–609. [DOI] [PubMed] [Google Scholar]
- 44.Trappe TA, Liu SZ. Effects of prostaglandins and COX-inhibiting drugs on skeletal muscle adaptations to exercise. J Appl Physiol. 2013;115(6):909–919. doi: 10.1152/japplphysiol.00061.2013. [DOI] [PMC free article] [PubMed] [Google Scholar]
- 45.Roberts MD, Iosia M, Kerksick CM, Taylor LW, Campbell B, Wilborn CD, Harvey T, Cooke M, Rasmussen C, Greenwood M, et al. Effects of arachidonic acid supplementation on training adaptations in resistance-trained males. J Int Soc Sports Nutr. 2007;4(1):21. doi: 10.1186/1550-2783-4-21. [DOI] [PMC free article] [PubMed] [Google Scholar]
- 46.Ma K, Saha PK, Chan L, Moore DD. Farnesoid X receptor is essential for normal glucose homeostasis. J Clin Invest. 2006;116:1102–1109. doi: 10.1172/JCI25604. [DOI] [PMC free article] [PubMed] [Google Scholar]
- 47.Meer M, Lombardo E, Havinga R, Tietge UJF, Kuipers F, Groen AK. Voluntary wheel running increases bile acid as well as cholesterol excretion and decreases atherosclerosis in hypercholesterolemic mice. Atherosclerosis. 2011;218:323–329. doi: 10.1016/j.atherosclerosis.2011.06.040. [DOI] [PubMed] [Google Scholar]
- 48.Zeber-Lubecka N, Kulecka M, Ambrozkiewicz F, Paziewska A, Goryca K, Karczmarski J, Rubel T, Wojtowicz W, Mlynarz P, Marczak L, et al. Limited prolonged effects of rifaximin treatment on irritable bowel syndrome-related differences in the fecal microbiome and metabolome. Gut Microbes. 2016;7:397–413. doi: 10.1080/19490976.2016.1215805. [DOI] [PMC free article] [PubMed] [Google Scholar]
- 49.Kulecka M, Paziewska A, Zeber-Lubecka N, Ambrozkiewicz F, Kopczynski M, Kuklinska U, Pysniak K, Gajewska M, Mikula M, Ostrowski J, et al. Prolonged transfer of feces from the lean mice modulates gut microbiota in obese mice. Nutr Metab (Lond). 2016;13(1):57. doi: 10.1186/s12986-016-0116-8. [DOI] [PMC free article] [PubMed] [Google Scholar]
- 50.Zeber-Lubecka N, Kulecka M, Ambrozkiewicz F, Paziewska A, Lechowicz M, Konopka E, Majewska U, Borszewska-Kornacka M, Mikula M, Cukrowska B, et al. Effect of saccharomyces boulardii and mode of delivery on the early development of the gut microbial community in preterm infants. PLoS One. 2016;11(2):e0150306. doi: 10.1371/journal.pone.0150306. [DOI] [PMC free article] [PubMed] [Google Scholar]
- 51.Picard2018toolkit . Broad Institute. http://broadinstitute.github.io/picard/.
- 52.Schloss PD, Westcott SL, Ryabin T, Hall JR, Hartmann M, Hollister EB, Lesniewski RA, Oakley BB, Parks DH, Robinson CJ, et al. Introducing mothur: open-source, platform-independent, community-supported software for describing and comparing microbial communities. Appl Environ Microbiol. 2009;75(23):7537–7541. doi: 10.1128/AEM.01541-09. [DOI] [PMC free article] [PubMed] [Google Scholar]
- 53.Edgar RC, Haas BJ, Clemente JC, Quince C, Knight R. UCHIME improves sensitivity and speed of chimera detection. Bioinformatics. 2011;27(16):2194–2200. doi: 10.1093/bioinformatics/btr381. [DOI] [PMC free article] [PubMed] [Google Scholar]
- 54.Quast C, Pruesse E, Yilmaz P, Gerken J, Schweer T, Yarza P, Peplies J, Glöckner FO. The SILVA ribosomal RNA gene database project: improved data processing and web-based tools. Nucleic Acids Res. 2013;41:D590–6. doi: 10.1093/nar/gks1219. [DOI] [PMC free article] [PubMed] [Google Scholar]
- 55.Shan G, Gerstenberger S, Benos PV. Fisher’s exact approach for post hoc analysis of a chi-squared test. PLoS One. 2017;12(12):e0188709. doi: 10.1371/journal.pone.0188709. [DOI] [PMC free article] [PubMed] [Google Scholar]
- 56.Benjamini Y, Hochberg Y. Controlling the false discovery rate: a practical and powerful approach to multiple testing. J R Stat Soc Ser B (Methodological). 1995;57:289–300. doi: 10.1111/j.2517-6161.1995.tb02031.x. [DOI] [Google Scholar]
- 57.DeSantis TZ, Hugenholtz P, Larsen N, Rojas M, Brodie EL, Keller K, Huber T, Dalevi D, Hu P, Andersen GL, et al. Greengenes, a chimera-checked 16S rRNA gene database and workbench compatible with ARB. Appl Environ Microbiol. 2006;72(7):5069–5072. doi: 10.1128/AEM.03006-05. [DOI] [PMC free article] [PubMed] [Google Scholar]
- 58.Langille MGI, Zaneveld J, Caporaso JG, McDonald D, Knights D, Reyes JA, Clemente JC, Burkepile DE, Vega Thurber RL, Knight R, et al. Predictive functional profiling of microbial communities using 16S rRNA marker gene sequences. Nat Biotechnol. 2013;31(9):814–821. doi: 10.1038/nbt.2676. [DOI] [PMC free article] [PubMed] [Google Scholar]
Associated Data
This section collects any data citations, data availability statements, or supplementary materials included in this article.
Data Citations
- Picard2018toolkit . Broad Institute. http://broadinstitute.github.io/picard/.