Abstract
Tissue homeostasis relies on the fine regulation between stem and progenitor cell maintenance and lineage commitment. In the adult prostate, stem cells have been identified in both basal and luminal cell compartments. However, basal stem/progenitor cell homeostasis is still poorly understood. We show that basal stem/progenitor cell maintenance is regulated by a balance between BMP5 self-renewal signal and GATA3 dampening activity. Deleting Gata3 enhances adult prostate stem/progenitor cells self-renewal capacity in both organoid and allograft assays. This phenotype results from a local increase in BMP5 activity in basal cells as shown by the impaired self-renewal capacity of Bmp5-deficient stem/progenitor cells. Strikingly, Bmp5 gene inactivation or BMP signaling inhibition with a small molecule inhibitor are also sufficient to delay prostate and skin cancer initiation of Pten-deficient mice. Together, these results establish BMP5 as a key regulator of basal prostate stem cell homeostasis and identifies a potential therapeutic approach against Pten-deficient cancers.
Research organism: Mouse
Introduction
Maintaining homeostasis in adult tissues requires a fine balance between stem cell maintenance and differentiation (Morrison and Kimble, 2006). An amplification of the stem/progenitor cell pool at the expense of cell differentiation or, conversely, the depletion of the stem/progenitor cell pool by premature differentiation are both expected to be detrimental to tissue homeostasis (Signer and Morrison, 2013; Tomasetti and Vogelstein, 2015). The dynamic process of stem/progenitor cell maintenance is regulated by signals from the microenvironment (niche) and by intrinsic regulatory mechanisms (Dumont et al., 2015). Similarly, cancer initiation and progression are thought to rely in large part on the self-renewal potential of cancer stem cells (Batlle and Clevers, 2017). In many systems, including the prostate, the molecular and cellular mechanisms regulating stem/progenitor cell homeostasis are still poorly understood.
The prostate consists of a multitude of branched epithelial ducts funneling prostatic fluids to the upper urethra. Prostatic ducts are composed of an inner layer of secretory luminal cells surrounded by a layer of basal cells interspersed with rare neuroendocrine cells. Tissue homeostasis and regeneration of the prostate have been shown to rely on endogenous stem cell populations. Allograft assays and lineage-tracing experiments revealed the presence of stem cells in both the basal and luminal compartments (Choi et al., 2012; Goldstein et al., 2010; Wang et al., 2013). During homeostasis and regeneration, adult stem cells are largely unipotent (Choi et al., 2012; Liu et al., 2011; Wang et al., 2013). However, basal stem cells act as facultative stem cells by activating basal to luminal lineage conversion under various stress conditions (Kwon et al., 2014; Toivanen et al., 2016). In contrast, basal stem cells are constitutively multipotent in the developing prostate, where they populate the luminal cell layer through asymmetric cell divisions (Ousset et al., 2012; Shafer et al., 2017; Wang et al., 2014a). In prostate cancer, basal and luminal stem cells can both act as tumor-initiating cells and are thought to contribute to tumor recurrence (Choi et al., 2012; Goldstein et al., 2010; Wang et al., 2009; Wang et al., 2013; Zhao et al., 2018).
In recent years, GATA transcription factors have emerged as important regulators of prostate development and cancer (Nguyen et al., 2013; Shafer et al., 2017; Xiao et al., 2016). During postnatal development, GATA3 is expressed in both basal and luminal cells and plays an important role in lineage specification and tissue organization (Shafer et al., 2017). In cancer, nuclear loss of GATA3 is associated with the progression to castration-resistant prostate cancer (CRPC) and poor prognosis (Nguyen et al., 2013). Accordingly, Pten-deficient mouse model of prostate cancer exhibits a progressive loss of Gata3 expression (Nguyen et al., 2013). In this model, prostate cancer could be accelerated by an acute loss of Gata3, or significantly delayed by GATA3 maintenance through transgenic expression (Nguyen et al., 2013). Despite this growing body of evidence of the importance of GATA3 in the prostate, its role in adult prostate stem/progenitor cell homeostasis is currently unknown.
Among the established regulators of stem cell homeostasis is the BMP signaling pathway (Oshimori and Fuchs, 2012). BMPs are part of the TGFβ family of signaling molecules, a group comprised of key regulators of cell differentiation, apoptosis, epithelial-mesenchymal transition and stem cell homeostasis (David and Massagué, 2018). BMPs are typically expressed in the stem cell niche and promote either stem cell quiescence or self-renewal depending on context (Genander et al., 2014; Haramis et al., 2004; He et al., 2004; Tadokoro et al., 2016; Tian and Jiang, 2014). In prostate cancer, BMP6 signaling appears to promote cancer progression (Darby et al., 2008; Lu et al., 2017), while BMP7 induces quiescence in metastatic cancer cells (Kobayashi et al., 2011). Yet, possible regulation of adult prostate stem cells by BMPs has received little attention so far.
Here, we explore the mechanisms of adult prostate stem/progenitor cell homeostasis. Combining mouse genetics, organoid cultures and RNA-seq analysis, we identify a crucial role for GATA3 in the control of basal stem/progenitor cell maintenance and identify BMP5 as a key effector of this activity. We further demonstrate that targeting the BMP pathway with a small molecule inhibitor significantly slows down cancer progression in the prostate as well as in the skin.
Results
Gata3 deficiency increases the long-term maintenance of prostate stem/progenitor cells
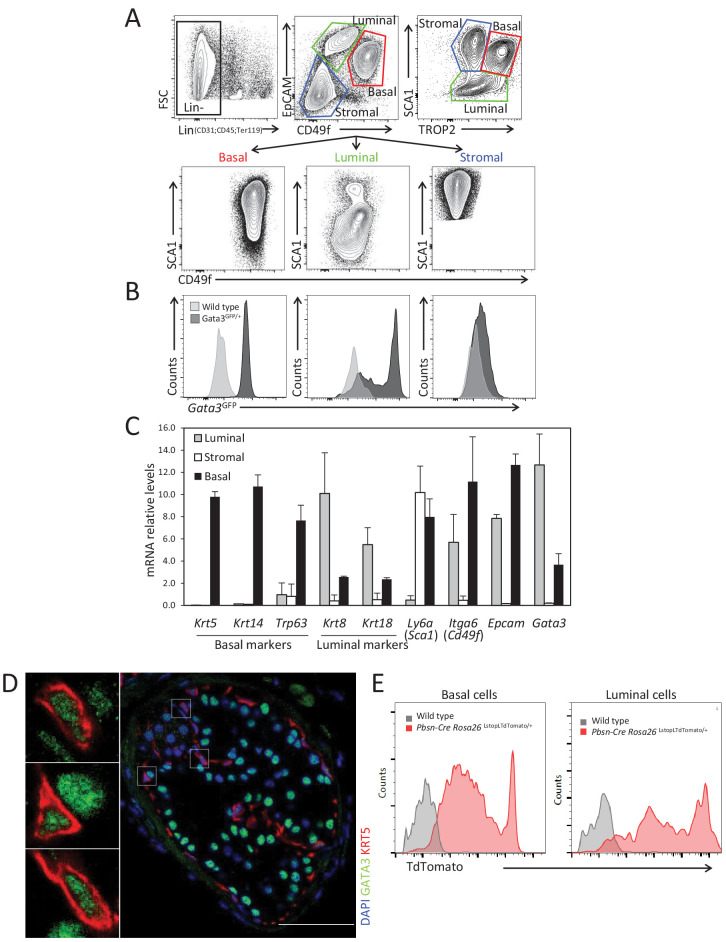
Gata3 has previously been reported to play a role in prostate development (Shafer et al., 2017) and in cancer progression (Nguyen et al., 2013). Whether Gata3 also regulates adult prostate stem cell homeostasis remains unknown. To explore this possibility, we first examined the expression pattern of Gata3 in adult prostate lineages using the surface markers Lin(CD31,TER119,CD45); SCA1; CD49f; EpCAM; TROP2-, to separate basal, luminal and stromal cells (Figure 1—figure supplement 1A,B and C). Taking advantage of a Gata3GFP knock-in reporter mouse strain, we found Gata3-driven GFP expression in both the basal and luminal populations (Figure 1—figure supplement 1B). This finding was confirmed by qRT-PCR analysis (Figure 1—figure supplement 1C) and by immunofluorescence staining of GATA3 in basal and luminal cells (Figure 1—figure supplement 1D).
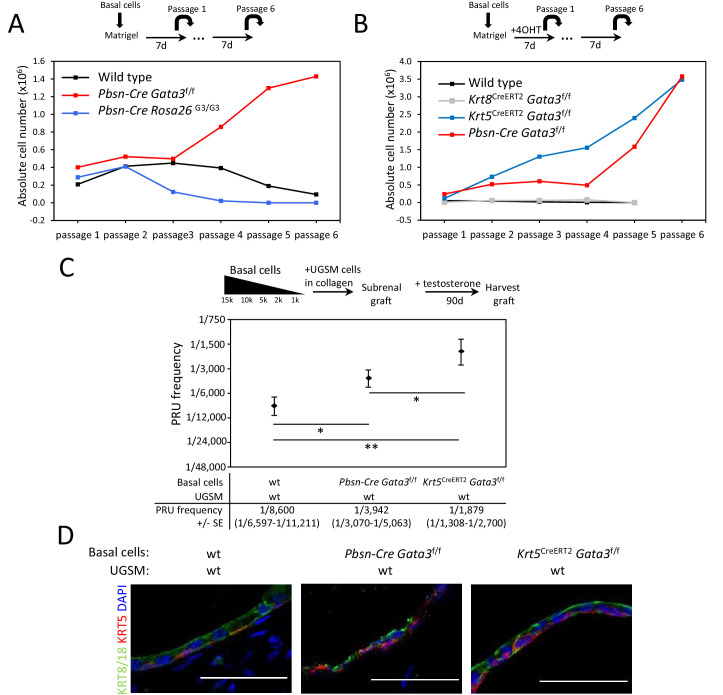
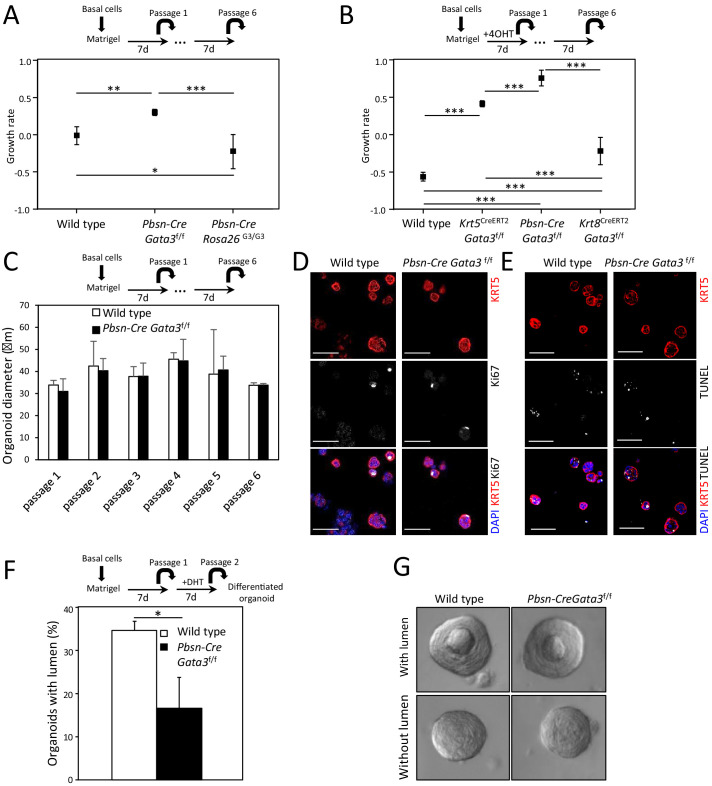
We next sought to determine whether GATA3 plays a role in prostate stem/progenitor cell homeostasis. For this, we purified basal cells from wild type, Pbsn-Cre Gata3f/f or Pbsn-Cre Rosa26G3/G3 adult prostates and performed a short-term organoid propagation assay where cultures were passaged after 7 days in order to specifically look at their propagation potential. Pbsn-Cre mice express the Cre recombinase in both basal and luminal cells of the prostate (Figure 1—figure supplement 1E; Wu et al., 2011). In this assay, short-term organoids grown from wild type basal cells could be passaged for three to five generations, as the organoids progressively lose their propagation potential (Figure 1A–B). Interestingly, cells obtained from Pbsn-Cre Rosa26G3/G3 mice, which express higher levels of GATA3 upon Cre-mediated deletion of a stop cassette (Nguyen et al., 2013), had a reduced organoid propagation potential (Figure 1A and Figure 1—figure supplement 2A). In striking contrast, cells derived from Gata3-deficient prostates (Pbsn-Cre Gata3f/f) (Grote et al., 2006) showed an increased organoid-forming potential over several passages (Figure 1A and Figure 1—figure supplement 2A-B). Organoid size, proliferation and apoptosis levels were unaffected by Gata3 expression levels (Figure 1—figure supplement 2C–D-E), indicating that the stem/progenitor maintenance potential rather than cell proliferation or survival is altered in those organoids. To study the effect of Gata3 loss on cell differentiation, testosterone was added to the media to favor differentiation of Pbsn-Cre Gata3f/f prostate organoids which revealed a decrease in organoids capable of forming lumens, pointing to a cell differentiation defect associated with the increase in organoid-forming potential (Figure 1—figure supplement 2F; Figure 1—figure supplement 2G).
Figure 1. Gata3 loss leads to an expansion of prostate basal stem/progenitor cells numbers.
(A) Effect of Gata3 loss and overexpression on in vitro basal stem/progenitor maintenance potential. Organoid-forming potential was assessed by plating equal numbers (105 cells) of sorted basal prostate cells from the indicated genotypes in Matrigel and passaged every 7 days. Shown is the absolute number of cells obtained after each passage for the indicated genotypes. Data are representative of two independent experiments from a pool of prostate cells from a minimum of three mice. (B) Specific deletion of Gata3 in KRT5+ basal cells affect the organoid-forming potential upon passage. Organoid-forming potential was assessed as in (A). Cre activity was induced in vitro by treatment with hydroxy-tamoxifen for the first passage. (C) Gata3 loss increase regenerative capacity in vivo. Different numbers of sorted basal cells from wild type (Pbsn-Cre, Pbsn-Cre Gata3f/f and Krt5CreERT2Gata3f/f) prostate were mixed with UGSM and transplanted under the kidney capsule of immunodeficient mice. All mice contain Rosa26LstopLTdTomato/+ allele and Cre activity was induced in vivo by tamoxifen injection in adult mice 4 weeks prior to organoid propagation potential assessment. Prostate reconstituting units (PRU) frequency of total basal cells was calculated based on growth of TdTomato+ grafts using the Limiting Dilution Analysis software L-Calc (StemCell Technologies) according to Poisson statistics (two-tailed t-test; *p<0.05, **p<0.001). (D) Immunofluorescence staining of lineage-specific markers KRT5 (basal) and KRT8/18 (luminal) in wild type, Pbsn-Cre Gata3f/f and Krt5CreERT2Gata3f/f allografts. Scale bar is representative of 50 μm. See also Figure 1—figure supplements 1–2.
Figure 1—figure supplement 1. GATA3 is expressed in prostate basal and luminal cells.
Figure 1—figure supplement 2. Gata3 is important for propagation and differentiation of organoids.
Figure 1—figure supplement 3. Ductal structures with multiple alveoli and a lumenized epithelial structure in allografts and organoids.
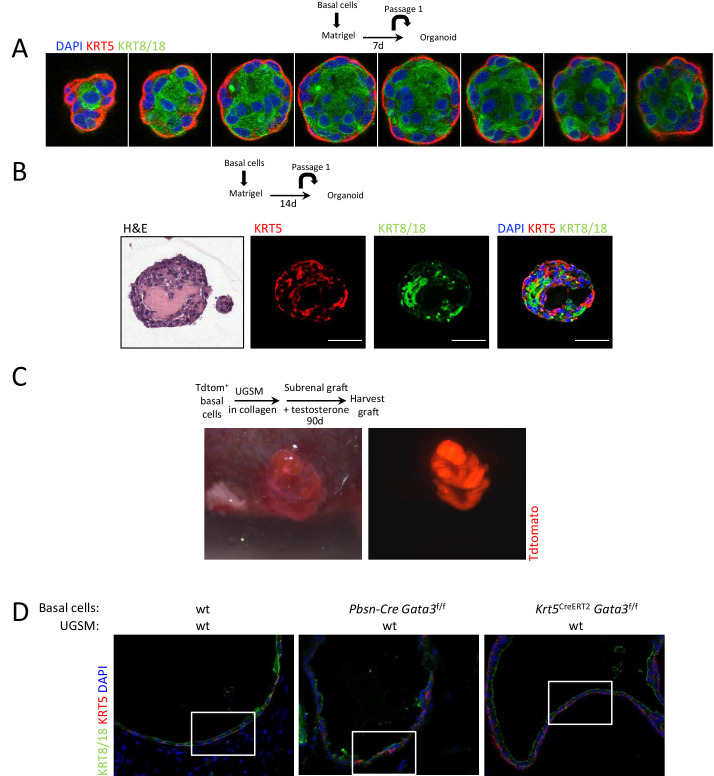
To confirm that the increased organoid-forming potential of Gata3-deficient cells is intrinsic to basal cells, we used the tamoxifen-inducible Krt5CreERT2 knock-in allele. In vitro activation of CreERT2 in KRT5+ cells reproduced the results obtained with the Pbsn-Cre strain (Figure 1B and Figure 1—figure supplement 2B). We further assessed the possibility that the increased organoid propagation potential comes from luminal cells generated during organoid growth and differentiation (Figure 1—figure supplement 3A–B). For this, we specifically inactivated Gata3 in vitro in luminal cells using Krt8CreERT2 transgene. This did not lead to an increase in organoid-forming potential (Figure 1B and Figure 1—figure supplement 2B), indicating that the role of GATA3 in basal stem/progenitor cell homeostasis is restricted to the basal compartment.
We next tested the capacity of GATA3 to regulate stem/progenitor cell homeostasis in vivo by allograft assay. To this end, basal cells from wild type, Pbsn-Cre Gata3f/f and Krt5CreERT2 Gata3f/f prostates (all expressing Rosa26TdTomato to trace donor tissues) were implanted with urogenital sinus mesenchyme (UGSM) (Goldstein et al., 2010; Wang et al., 2009) under the renal capsule of host mice and grown for 90 days in the presence of exogenous testosterone. Using serial dilution, we assessed the proportion of basal cells capable of generating TdTomato+ prostate tissue [measured as prostate reconstituting units (PRU)] (Figure 1C and Figure 1—figure supplement 3C). The PRU frequency in the basal population was found to be 1 per 8600 for control. In contrast, Pbsn-Cre Gata3f/f gave an average of 1 in 3,942, and Krt5CreERT2Gata3f/f of 1 in 1879 which corresponds respectively to over two- and four-fold increase in steady state stem/progenitor cell numbers in the Gata3-deficient basal cell pool. The difference between Pbsn-Cre and Krt5CreERT2 likely reflects the deletion efficiency of both transgenic lines in basal cells. The histological examination of these grafts showed ductal structures with multiple alveoli and a lumenized epithelial structure composed of a bilayer of basal and luminal cells as evidenced by KRT5 and KRT8/18 staining (Figure 1D and Figure 1—figure supplement 3D).
From these results, we conclude that GATA3 is critical for regulating basal stem/progenitor cell maintenance in the prostate. GATA3 inactivation promotes an increase in self-renewing capacity, leading to a gradual expansion of the stem/progenitor cell pool.
BMP signaling is upregulated in Gata3-deficient organoids
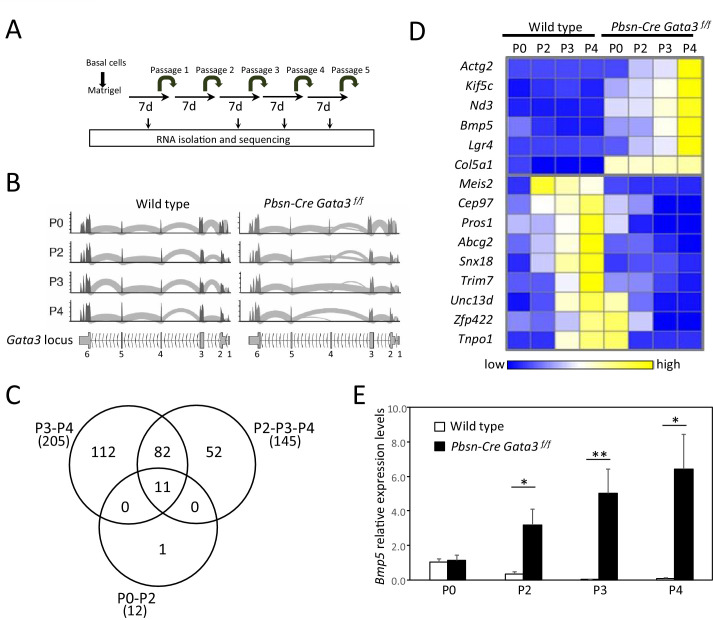
To gain insight into the molecular mechanisms leading to the amplification of the stem cell pool upon Gata3 inactivation, we performed RNA-seq on wild type and Pbsn-Cre Gata3f/f prostate organoids harvested after 0, 2, 3 and 4 passages (Figure 2A). To track the deletion of Gata3 exon four by the Pbsn-Cre transgene, we mapped RNA-seq transcript to the Gata3 locus (Figure 2B). Surprisingly, cells from passage 0 mostly retained the floxed exon 4 of Gata3. However, loss of exon four occurred in about 50% of cells at passage 2, and in the vast majority of cells from passages 3 and 4. This finding, likely due to a limited efficiency of Pbsn-Cre in basal cells, allowed us to use the dynamics of locus deletion as an additional filter to identify GATA3 regulated genes.
Figure 2. Bmp5 expression in organoids is regulated by Gata3.
(A) Schematic of RNA-seq strategy. mRNA was isolated from 4 days old wild type and Pbsn-Cre Gata3f/f organoids at passages P0, P2, P3 and P4. (B) Deletion of exon four in Pbsn-Cre Gata3f/f samples increases with passages. Shown are the read counts from RNAseq assigned to the Gata3 locus in samples isolated from wild type and Pbsn-Cre Gata3f/f prostate tissue at passage P0, P2, P3 or P4. (C) Venn diagram of genes differentially expressed between wild type and Pbsn-Cre Gata3f/f prostate organoids using likelihood-ratio test with q-value <0.01. (D) Heatmap of log2 transformed mRNA read counts of differentially expressed genes between wild type and Pbsn-Cre Gata3f/f organoids and whose expression pattern follows Gata3 loss with passages. (E) Bmp5 mRNA expression levels as assessed by quantitative RT-PCR in both wild type and Pbsn-Cre Gata3f/f organoids over passages. Data represent the average ± SD from three independent cDNA obtained from a pool of prostate cells from a minimum of three mice. Relative mRNA expression levels are normalized to Ppia mRNA levels (two-tailed t-test as compared to wild-type condition; *p<0.01, **p<0.005). See also Figure 2—figure supplements 1–2.
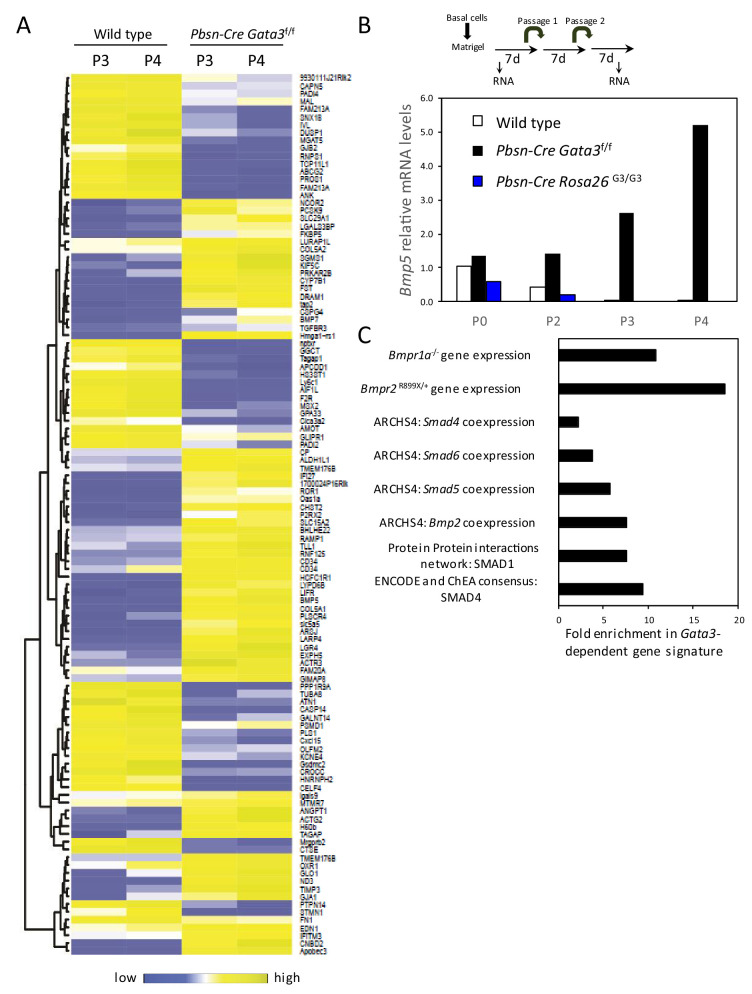
Figure 2—figure supplement 1. Gata3-dependent gene signature.
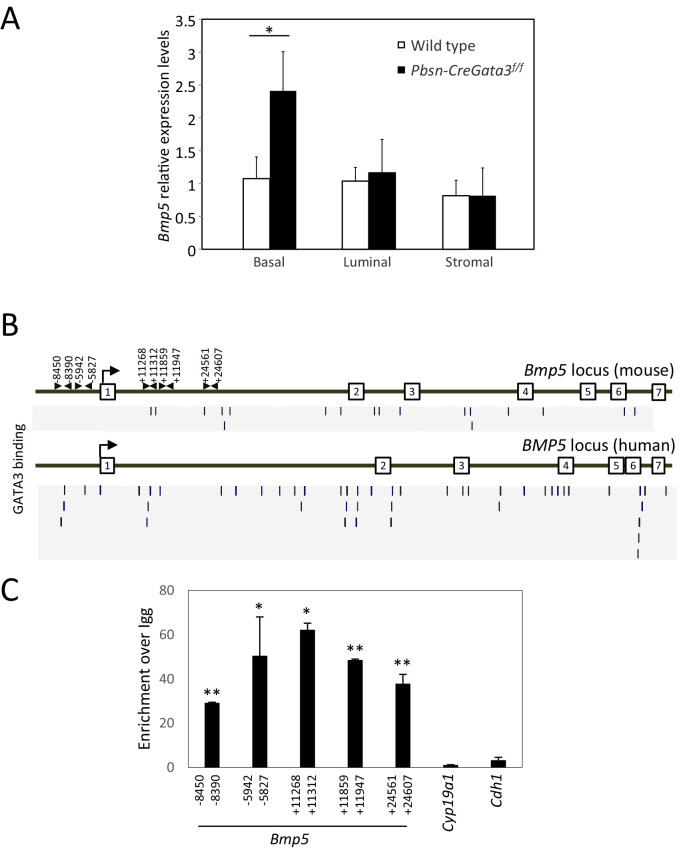
Figure 2—figure supplement 2. Bmp5 expression is specifically affected in Gata3-deficient basal cells.
The comparison of differentially regulated genes between wild type and Pbsn-Cre Gata3f/f samples at passages 3 and 4 identified 205 candidate genes (Figure 2C and Figure 2—figure supplement 1A). Of interest, Bmp5 emerged as the candidate with the highest differential expression ratio between wild type and mutant at passages 2, 3 and 4 (up to 48-fold difference), while being unaffected at passage 0, when the Gata3 locus is still intact (Figure 2D and Figure 2—figure supplement 1B). A quantification of Bmp5 levels by qRT-PCR validated the RNA-seq results (Figure 2E). In line with the dynamics of Bmp5 expression, the analysis of all differentially expressed genes with the ENRICHR resource (Chen et al., 2013; Kuleshov et al., 2016) identified a number of genes regulated by SMAD, BMP, BMPR1a- and BMPR2 (Software ARCH2 and GEO datasets; Figure 2—figure supplement 1C) as well as a strong enrichment for SMAD4 binding sites in the regulatory region of those genes (Software Encode-ChEA; Figure 2—figure supplement 1C).
On the grounds of the consistent association between the GATA3 response in prostate stem/progenitor cells and the BMP/SMAD signaling pathway, we decided to probe further the role of BMP5 in prostate stem cell regulation.
BMP signaling regulates basal stem/progenitor cell maintenance
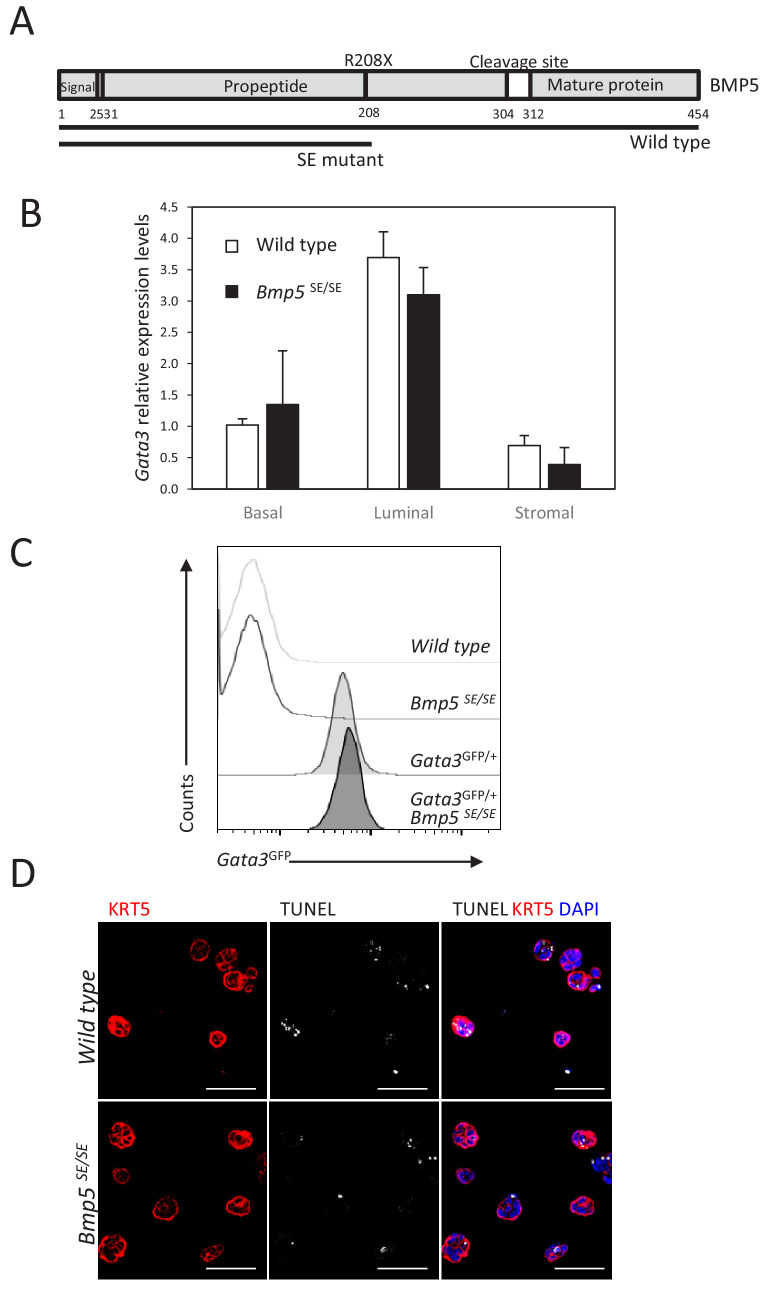
Previous studies have linked canonical BMP signaling to progenitor cell proliferation and differentiation in the epidermis, hair follicle and intestine (Genander et al., 2014; Haramis et al., 2004; He et al., 2004; Lewis et al., 2014). However, relatively little is known about the regulation of stem cell homeostasis by BMPs, notably in the prostate. To better understand the source of BMP5 in the adult prostate, we measured Bmp5 expression by qRT-PCR in basal, luminal and stromal cells sorted from wild type and Pbsn-Cre Gata3f/f prostates (Figure 2—figure supplement 2A). In wild-type prostates, Bmp5 was found to be expressed in all three cell types (Figure 2—figure supplement 2A). Interestingly, Gata3 inactivation primarily increased Bmp5 expression in basal cells, which suggests a specific role for Gata3 in this compartment. We next sought to determine whether GATA3 directly binds the Bmp5 locus. For this, we first probed ChIP-seq data from the Gene transcription regulation database (GTRD), which identified several regions of the Bmp5 locus bound by GATA3 in murine and human cells (Figure 2—figure supplement 2B). To validate this possibility in prostatic tissue, we took advantage of a biotinylated allele of Gata3 (Gata3bio) and performed BioChIP-PCR assay on adult prostates. Using this high-affinity system, we found that GATA3 is bound to the Bmp5 locus which suggest that GATA3 regulates directly Bmp5 expression in prostate basal cells (Figure 2—figure supplement 2C). In order to clarify the genetic relationship between Gata3 and Bmp5, we used the ‘small ear’ (SE) mouse strain, which harbor a nonsense mutation in the propeptide region of Bmp5 that prevents mature protein expression (King et al., 1994; Figure 3—figure supplement 1A). We found no difference in Gata3 expression levels in basal cells in the absence of Bmp5 both by qRT-PCR and by FACS using Gata3GFP knock-in reporter mouse strain on a wild type or Bmp5SE/SE background (Figure 3—figure supplement 1B–C), suggesting that BMP5 is not a critical regulator of Gata3 expression in the prostate.
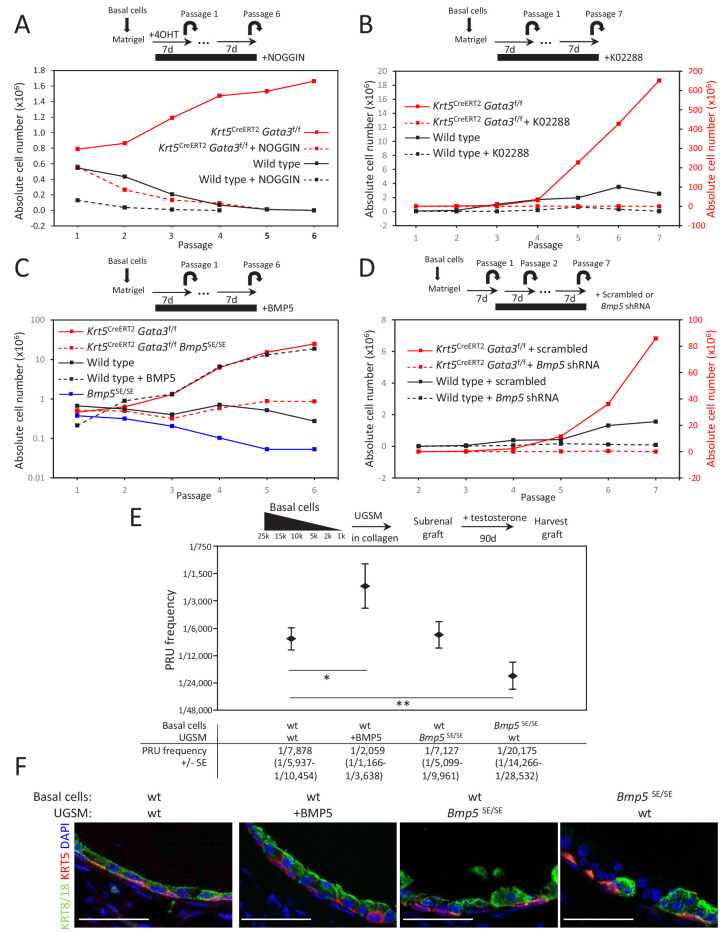
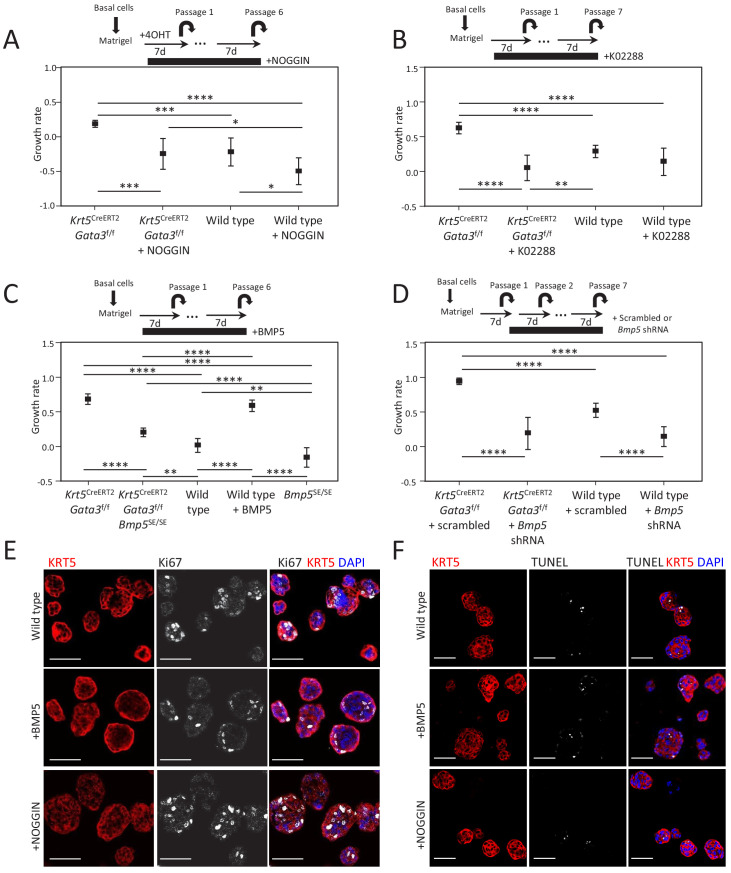
To test whether BMP signaling affects the self-renewal potential of Gata3-deficient basal cells, we blocked it with the inhibitory protein NOGGIN in culture. In wild-type organoids, NOGGIN treatment prevented basal cells from being passaged past four generations (Figure 3A and Figure 3—figure supplement 2A). Strikingly, NOGGIN treatment also abrogated the long-term amplification of Gata3-deficient organoids, suggesting that BMP signaling is a key mediator of the Gata3-deficient propagation phenotype (Figure 3A and Figure 3—figure supplement 2A). This decrease in organoid-forming potential was not caused by changes in proliferation nor apoptosis, as shown by unaltered Ki67 and TUNEL stainings in treated organoids (Figure 3—figure supplement 2E–F). To validate these result, we used K02288, a potent small molecule inhibitor selective to BMPR-SMAD1/5/8 signaling (Sanvitale et al., 2013) which showed similar results to NOGGIN treatment (Figure 3B and Figure 3—figure supplement 2B).
Figure 3. BMP5 increases the propagation potential of basal stem/progenitor cells.
(A–B) Organoid-forming capacity is abrogated by both BMP and BMPR-SMAD1/5/8 inhibitors treatment. Sorted basal cells from wild type or Krt5CreERT2Gata3f/f prostate were grown in presence or absence of NOGGIN (A) or small inhibitor K02288 (B) for six passages. Cre activity was induced by hydroxy-tamoxifen treatment in vitro for the first passage (A) or by tamoxifen injection in vivo 4 weeks prior to culture (B). Organoid-forming potential was assessed as in Figure 1A. (C) Bmp5 loss reduces organoid-forming activity in vitro, while propagation potential capacity of wild type cells is increased by BMP5 treatment. Basal cells (105) from wild type, Bmp5SE/SE, Krt5CreERT2Gata3f/f or Krt5CreERT2Gata3f/f Bmp5SE/SE mice were grown for six passages. Exogenous BMP5 was added to culture media where indicated. Cre activity was induced in vivo as in (B). (D) Bmp5 silencing specifically affects organoid-forming activity in vitro. ShRNA against Bmp5 or scrambled were electroporated in first passage organoid from wild type and Krt5CreERT2Gata3f/f basal cells and grown for seven passages. Cre activity was induced in vivo as in (B). (E) Bmp5 levels affects regenerative potential in vivo. Different numbers of sorted basal prostate cells from Rosa26LTdTomato (control) or Bmp5SE/SERosa26LTdTomato were transplanted with UGSM either wild type, ectopically expressing BMP5 or derived from Bmp5SE/SE mice. Limiting dilution analysis was done as in Figure 1C. Notice that the loss of Bmp5 in basal cells but not in UGSM affects prostate reconstituting units (PRU) frequency (two-tailed t-test as compared to wild-type condition; **p<0.02, *p<0.04). (F) Immunofluorescence of allografts show presence of prostatic ducts expressing both KRT5 and KRT8/18. Scale bar is representative of 50 μm. See also Figure 3—figure supplements 1–2.
Figure 3—figure supplement 1. GATA3 expression is not regulated by Bmp5 expression in the prostate.
Figure 3—figure supplement 2. BMP5 treatment does not affect proliferation nor survival in organoid.
Figure 3—figure supplement 3. Allografts form well-organized ductal structures with both basal and luminal lineages.
To determine whether BMP5 is sufficient to promote basal stem/progenitor cell maintenance, we treated wild-type basal prostate organoids with exogenous BMP5 over several passages. As expected, BMP5 treatment increased the organoid-forming capacity of basal cells over time (Figure 3C and Figure 3—figure supplement 2C). Conversely, Bmp5SE/SE cells showed an impaired organoid-forming potential comparable to NOGGIN or K02288-treated cells (Figure 3C and Figure 3—figure supplement 2C). Here again, neither survival (Figure 3—figure supplement 1D) nor proliferation was affected in the organoids that successfully grew, which supports a self-renewal phenotype. We next assessed whether Gata3-deficient phenotype was specifically dependent on the BMP5 ligand by inactivating both Bmp5 and Gata3 in KRT5-positive basal cells in vivo. Bmp5 mutation impaired the increased organoid-forming capacity of Gata3-deficient cells (Figure 3C and Figure 3—figure supplement 2C). In addition, the acute loss of Bmp5 using shRNA against Bmp5 showed a similar effect, inhibiting the passaging capacity of both wild type and Gata3-deficient organoid (Figure 3D and Figure 3—figure supplement 2D). Together, these results confirm that the increased propagation potential of Gata3-deficient basal cells requires BMP signaling driven by the BMP5 ligand.
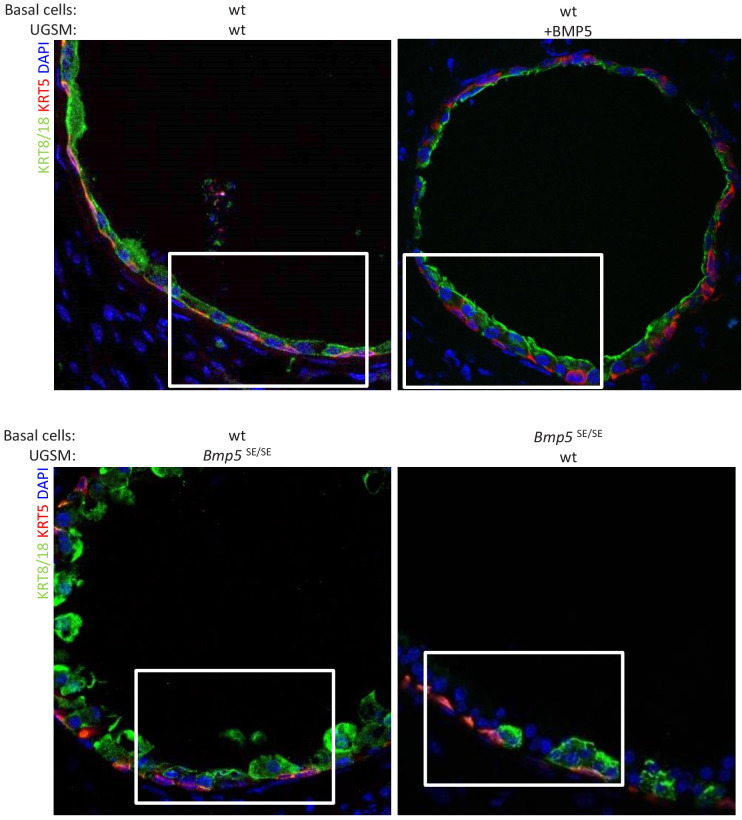
To validate this phenotype in vivo, we assessed whether BMP5 is sufficient to promote prostate tissue development from basal stem/progenitor cells in an allograft assay. For this, we compared the regenerative potential of wild-type basal cells (expressing the constitutively active Rosa26TdTomato lineage tracer) embedded in either wild-type UGSM or UGSM engineered to overexpress BMP5 (Figure 3E). After 90 days of growth under the kidney capsule, the PRU frequency averaged 1 in 7878 in normal UGSM and increased to 1 in 2059 in BMP5-expressing UGSM, an effect equivalent to the loss of Gata3 in KRT5+ basal cells (1 in 1,879) (Figure 1C). These grafts showed a formation of well-organized ductal structures including both basal and luminal lineages (Figure 3F and Figure 3—figure supplement 3). Hence, the exposure of basal stem/progenitor cells to increased BMP5 levels is sufficient to increase their regenerative potential. However, this experiment does not directly address whether BMP5 acts as a maintenance factor from the stromal mesenchyme or from within the basal cell compartment. To test this, we compared the regenerative potential of wild-type basal cells embedded in mesenchyme derived from either wild-type or Bmp5SE/SE animals (Figure 3E). This experiment revealed no significant difference in the PRU frequency or lineage potential of the grafts grown in presence or absence of mesenchymal Bmp5, indicating a role for BMP5 as a regulator of stem/progenitor cell homeostasis intrinsic to the basal cell layer.
To directly assess the autonomous role of BMP5 in the basal compartment, we compared the regenerative potential of wild type or Bmp5SE/SE basal cells (expressing the constitutively active Rosa26TdTomato lineage tracer) embedded in wild-type UGSM cultures. After 90 days under the kidney capsule, the calculated PRU frequency averaged 1 in 7878 in the wild-type basal population but dramatically decreased to 1 in 20,175 in the absence of Bmp5 (Figure 3E). Together, these results demonstrate that BMP5 is critically required to sustain a full regenerative capacity in basal cell-derived allografts and identify BMP5 as an important regulator of basal stem/progenitor cells maintenance in the prostate.
BMP5 deficiency delays Pten-dependent tumor progression
One of the earliest and most frequent events in prostate cancer progression is the loss of the tumor suppressor PTEN (Abeshouse et al., 2015). Accordingly, Pten loss in the mouse prostate leads to carcinoma within 6–8 weeks (Mulholland et al., 2011; Trotman et al., 2003; Wang et al., 2003). Those tumors are castration-resistant, which mimics recurrent castration-resistant prostate cancer (CRPC) and are highly enriched in prostate stem cells (Wang et al., 2003). We previously showed that GATA3 is progressively lost in the prostate epithelium of Pten-deficient mice, while enforced GATA3 expression slows down tumor progression (Nguyen et al., 2013). In light of these results, we hypothesized that BMP5 signaling may contribute to the maintenance of Pten-deficient cancer stem cells.
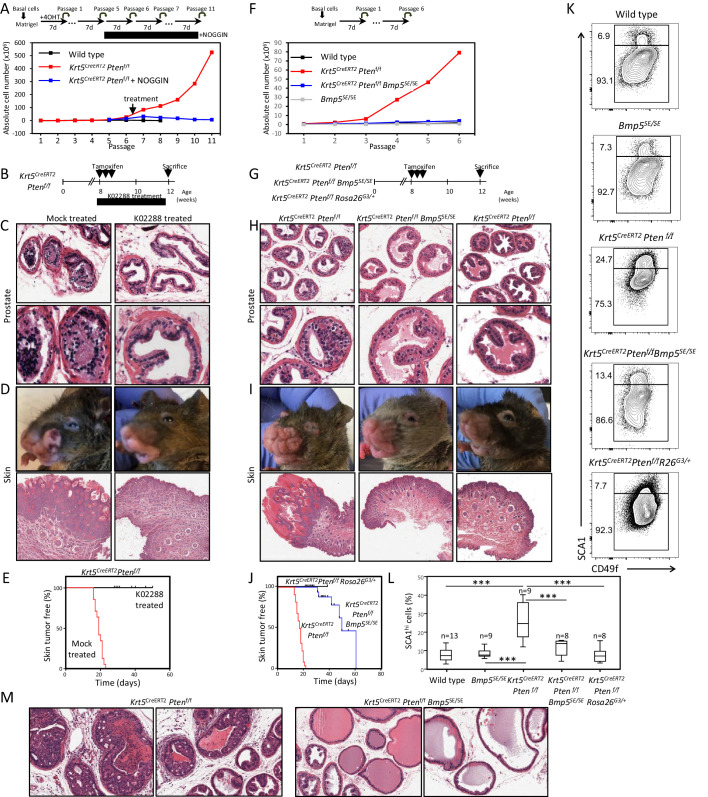
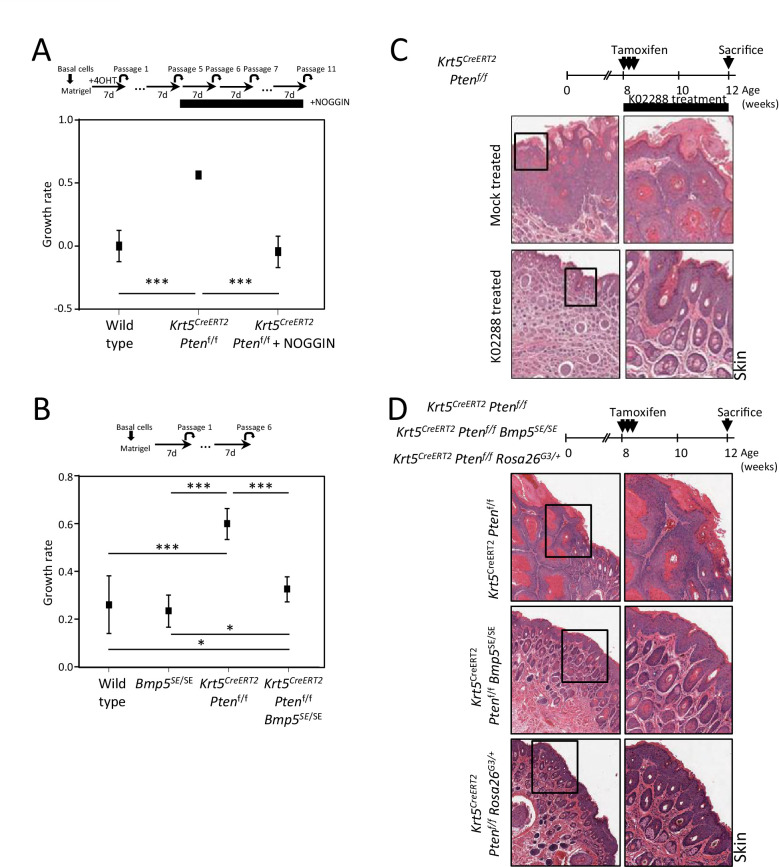
To assess this possibility, we first performed a short-term organoid-forming assay using purified basal cells from Krt5CreERT2Ptenf/f adult prostates. As expected, in vitro induction of the Cre recombinase by tamoxifen treatment led to an increase in organoid-forming potential over time (Figure 4A and Figure 4—figure supplement 1A). To test whether BMP signaling affects the self-renewal potential of cancer cells, we treated Pten-deficient basal prostate organoids with the inhibitory protein NOGGIN. Inhibition of BMP signaling affected their organoid-forming capacity, abrogating the long-term expansion in organoid cultures (Figure 4A and Figure 4—figure supplement 1A). This result suggests that the increased propagation potential of Pten-deficient prostate cancer stem/progenitor cells also requires BMP signaling.
Figure 4. BMP inhibition reduces Pten-deficient propagation potential and inhibits skin and prostate tumor initiation.
(A) The aberrant organoid-forming capacity of Pten-deficient basal cells is abrogated by BMP inhibitor (NOGGIN) treatment. Cre activity was induced in vitro by treatment with hydroxy-tamoxifen for the first passage of organoid derived from basal cells of Krt5CreERT2Ptenf/f mice. From passage 5, organoids were cultured in presence or absence of NOGGIN. Organoid-forming potential was assessed as in Figure 1A. (B) Krt5CreERT2Ptenf/f tamoxifen-treated mice were injected with either K02288 or PBS for 4 weeks. (C–D) Representative histological sections of prostate tissue (C) and skin tissue (D) stained with H&E showing an absence of PIN and skin hyperplasia in K02288-treated as compared to mock-treated mice. (E) Kaplan-Meier skin tumor free survival curves of tamoxifen-induced Krt5CreERT2Ptenf/f treated or not with K02288 (log-rank (Mantel-Cox) test; p<0.0001, n = 7 and n = 14, respectively). Tick-marks represent sacrificed animals. (F) Bmp5 loss rescues the aberrant organoid-forming capacity of Pten-deficient basal cells. Cre activity was induced in vivo by tamoxifen injection in adult mice 4 weeks prior to organoid propagation potential assessment. (G–L) Eight-week-old mice were treated with tamoxifen and sacrificed 4 weeks later. (H–I) Bmp5 loss and Gata3 overexpression rescues Pten-deficient prostate and skin hyperplasia. Shown are representative H&E pictures of prostate (H) and skin (I) tissues. (J) Kaplan-Meier skin tumor free survival curves of tamoxifen-induced Krt5CreERT2Ptenf/f, Krt5CreERT2Ptenf/fBmp5SE/SE and Krt5CreERT2Ptenf/fRosa26G3/+ mice (log-rank (Mantel-Cox) test; p<0.0001, n = 22, n = 17 and n = 9, respectively). Tick-marks represent sacrificed animals. (K–L) Representative FACS phenotype (K) and percentage of SCA1hi cells (L) in the luminal compartment as defined by Lin(CD45, CD31, TER119)-EpCAM+CD49fMed of total prostate (one-way ANOVA; ***p<0.0001). (M) Representative H&E pictures of prostate tissues of Krt5CreERT2Ptenf/f and Krt5CreERT2Ptenf/fBmp5SE/SE mice sacrificed 9 weeks after tamoxifen treatment. See also Figure 4—figure supplements 1,2.
Figure 4—figure supplement 1. BMP inhibition corrects Pten-deficient tumor phenotypes.
Figure 4—figure supplement 2. K02288 acts downstream of AKT pathway.
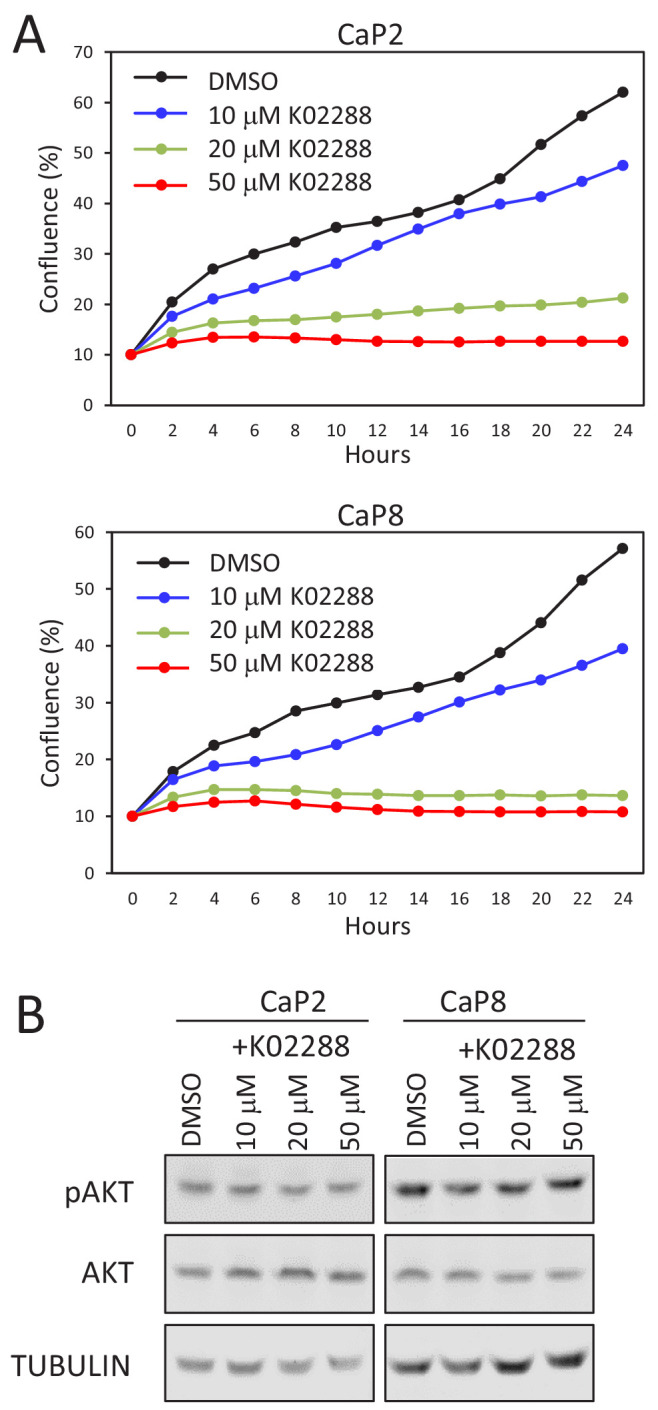
To validate this result, we used the specific BMPR-SMAD1/5/8 signaling inhibitor K02288 on two Pten-deficient cell lines (CaP2 and CaP8). K02288 specifically abrogated culture growth without affecting cell viability or the expression or phosphorylation of the PTEN effector AKT (Figure 4—figure supplement 2A–B), indicating that K02288 acts downstream of AKT-mediated signaling.
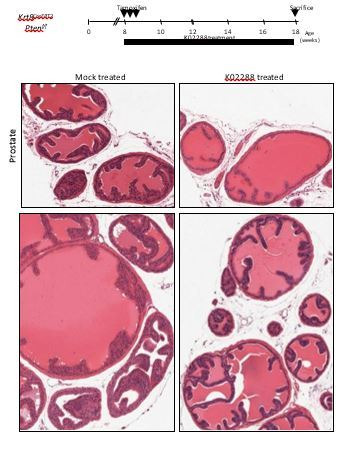
We then tested BMP signaling inhibition in vivo by K02288 treatment of Krt5CreERT2Ptenf/f adult mice for 30 days (at which point the mock-treated mice developed skin tumors and had to be sacrificed) (Figure 4B–E). Drug treatment led to a reduction of prostate lesions in comparison to mock-treated mice that had accumulated prostatic intraepithelial neoplasia (PIN) at this stage (Figure 4C). Interestingly, K02288 treatment additionally led to a marked reduction of the severity of skin lesions derived from KRT5-positive basal cells and greatly delayed the onset of tumor growth (Figure 4D-E and Figure 4—figure supplement 1A), indicating that the promotion of Pten-deficient tumor expansion by BMP signaling is not limited to the prostate. To determine whether Pten-deficient neoplasia was specifically dependent on the BMP5 ligand, we inactivated both Pten and Bmp5 in KRT5-positive basal cells of the prostate and skin (Figure 4G). Loss of Bmp5 impaired the aberrant organoid-forming capacity of Pten-deficient prostate cells (Figure 4F and Figure 4—figure supplement 1B), as well as the increase in numbers of aberrant SCA1hi luminal progenitor cells (Figure 4K–L). Strikingly, Krt5CreERT2Ptenf/fBmp5SE/SE mice showed a reduction in the formation of prostate and skin hyperplasia as well as a delay in tumor growth onset similar to animals treated with K02288 (Figure 4H,I,J and Figure 4—figure supplement 1D, E, F). This correction of prostate tumor phenotype by Bmp5 loss was still observed 9 weeks after Cre induction (Figure 4M). Interestingly, prostate and skin tumor phenotypes could also be dampened by overexpression of GATA3 in these tissues (Figure 4H–L) indicating that both Gata3 and BMP5 are key players in Pten-deficient cancer progression. These results additionally raise the possibility to use a small inhibitor against BMP signaling as a treatment against PTEN-deficient cancer progression both in the prostate and in the skin.
Discussion
In recent years, the presence of adult prostate stem cells has been reported in both the basal and luminal compartments (Choi et al., 2012; Goldstein et al., 2010; Liu et al., 2011; Wang et al., 2013). However, the question of how these cells regulate the balance between long-term maintenance and differentiation remained unanswered. Here, we tackle this question in adult basal stem/progenitor cells. We show that prostate basal cells devoid of the transcription factor Gata3 increase their self-renewal capacity in long-term propagation assays and further identify BMP5 as a crucial mediator of this activity. Using gain and loss-of-function approaches, we demonstrate that BMP signaling is required for sustained stem/progenitor cell propagation within the basal cell compartment. Using a mouse model of prostate cancer highly enriched in cancer stem cells, we finally show that inhibition of BMP5 signaling is sufficient to delay cancer progression from basal cells in the prostate and in the skin. Together, these observations demonstrate that BMP signaling promotes basal stem cell self-renewal, while GATA3 counteracts this activity to regulate the basal stem cell pool.
BMP signaling has been linked to stem cell maintenance in a number of organisms, often acting as a niche factor (Chen et al., 2011; Oshimori and Fuchs, 2012; Tian and Jiang, 2014). However, whether BMP signaling promotes stem cell self-renewal or quiescence is context-dependent (Badeaux et al., 2013; Chen et al., 2011; Chung et al., 2018; Genander et al., 2014; Kangsamaksin and Morris, 2011; Lewis et al., 2014; Li et al., 2012; Oshimori and Fuchs, 2012; Tadokoro et al., 2016; Tian and Jiang, 2014). Our results in the prostate clearly identify a role for BMP signaling in promoting the long-term maintenance of prostate stem/progenitor cells, that appears to be intrinsic to the basal cell compartment as opposed to an exogenous niche factor. In support of this, Gata3 deficiency leads to an increase in BMP5 expression specifically in basal cells, while Gata3-deficient prostate organoids show a strong stem/progenitor cell amplification phenotype despite being devoid of stromal niche. This basal cell amplification can be blocked by BMP inhibitor treatment and is blunted in Bmp5-deficient cells indicating that BMP signaling is required for stem/progenitor cell amplification. An alternative possibility would be that BMP5 acts as a niche factor from luminal cells. However, Gata3 inactivation by luminal-specific Krt8CreERT2 failed to increase the organoid-forming potential, arguing against this possibility. Importantly, while BMP5-overexpressing mesenchyme could enhance basal stem cell activity in renal allograft assay, Bmp5-deficient mesenchyme remained competent in stem cell derived allograft growth. In contrast, Bmp5-deficient basal cells had a blunted regenerative potential in the presence of wild-type mesenchyme. Hence, increased exposure to BMP5 expressed from the UGSM can support basal stem/progenitor cells, but ultimately it is BMP5 expression from the basal compartment that is critical to basal stem cell homeostasis. The intrinsic role of BMP5 in the basal cell compartment is further supported by the identification of Bmp5 as one of the most highly expressed genes in a prostate basal stem cell population defined by s-SHIP1 gene expression (Brocqueville et al., 2016). The molecular mechanism by which GATA3 modulates Bmp5 in basal cells remains elusive. However, the direct binding of GATA3 to the Bmp5 locus in mouse and human, combined with the fact that GATA3 is known to interact with repressive chromatin modifier complexes (Tremblay et al., 2018) suggests a molecular mechanism to be explored further.
Taken together, these results favor a model by which GATA3 regulates stem/progenitor cell long-term maintenance by modulating the expression levels of the autocrine stem cell factor BMP5.
PTEN mutation is one of the earliest and most frequent alterations in prostate cancer (Abeshouse et al., 2015). Accordingly, Pten-deficient prostates develop castration-resistant prostate cancer (Mulholland et al., 2011; Wang et al., 2003) that are highly enriched in cancer stem cells (this report) (Goldstein et al., 2010; Mulholland et al., 2009; Wang et al., 2014a). To validate whether the increase in BMP signaling was involved in Pten-deficient tumors, we treated Pten-deficient prostate organoids and mouse prostate tumors with a selective inhibitor against BMP signaling, which resulted in blunted organoid passaging potential and a delay in tumor progression in vivo. These results are in line with a previous report showing that loss of TGFβ signaling has been linked to prostate cancer progression in Pten-deficient tumor, in part through upregulation of BMP signaling (Zhao et al., 2018). Here, we identify the ligand BMP5 as prime driver of Pten-deficient cancer progression. It is possible that other BMPs are involved in tumor progression that would also be blocked by small molecule-mediated inhibition of BMP signaling. For example, BMP6, a member of the BMP5/6/7 subfamily, is upregulated in prostate cancer and contributes to cancer progression (Darby et al., 2008). Whether BMP5 and BMP6 have overlapping or distinct roles remains to be determined. However, our results clearly demonstrate that Bmp5 inactivation alone is sufficient to significantly delay cancer development with an efficiency similar to BMP pathway inhibition, identifying this ligand as a central player in the process.
In this study, we specifically inactivated Pten in basal cells, that are known to transition to a luminal fate and generate carcinoma under stress conditions (Wang et al., 2014b; Wang et al., 2013). Our results demonstrate that dampening the BMP-regulated cancer stem cell pool in basal cells is an effective strategy to reduce the tumorigenic potential of this population. Whether or not the GATA3-BMP axis is also effective in luminal cells of the prostate is still unclear. Our results suggest that the upregulation of BMP5 by Gata3 loss occurs mostly in basal cells. However, the fact that Gata3 could modulate prostate cancer progression in Pbsn-Cre; Pten-deficient mice (Nguyen et al., 2013) known to develop largely from luminal cells raise the possibility of a role in luminal cells. One possibility would be that Gata3 acts through the regulation of other BMP family members to achieve a similar role in different cell types.
Remarkably, as skin cancer can originate from KRT5-positive basal stem cells (Suzuki et al., 2003), the strategy of BMP inhibition proved also effective in this tissue. BMP5 was previously reported to play a role in non-cancerous keratinocytes where Bmp5 inactivation reduces the number of label-retaining cells, while exogenous BMP5 increased colony formation (Badeaux et al., 2013; Kangsamaksin and Morris, 2011). These results support a role for BMP5 in stem cell maintenance, comparable to the one described here. The effective activity of BMP inhibition in both tissues further raise the prospect of a therapeutic approach in the treatment of Pten-deficient tumors.
Materials and methods
Mice
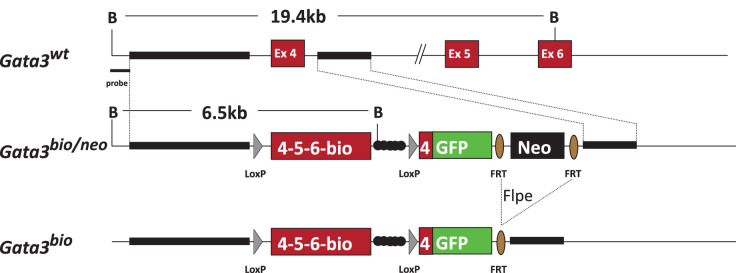
All experimental mice were kept in a C57BL/6 background. Pbsn-Cre (Wu et al., 2001), Gata3flox, Gata3GFP, Rosa26GATA3 (Grote et al., 2006), Gata3bio (kind gift from Dr. Busslinger, IMP, Vienna; see Figure 2—figure supplement 3 for generation strategy), Rosa26BirA (Wood et al., 2016), Krt5CreERT2 (Van Keymeulen et al., 2011), Krt8CreERT2 (Choi et al., 2012), Rosa26LstopLTdTomato (Madisen et al., 2010), Ptenflox (Trotman et al., 2003) and Bmp5SE (Kingsley et al., 1992) mice were described previously. Constitutively active Rosa26LTdTomato were generated from female Pbsn-Cre mice which express Cre in the germline and backcrossed to C57BL/6 to eliminate the Cre allele. Immunodeficient SCID-beige mice were obtained from Charles River and kept in pathogen-free conditions. Except stated otherwise, all experiments were done using 8-week-old adult mice. In vivo CreERT2 induction was done by intraperitoneal injection of three doses of 3 mg of tamoxifen dissolved in corn oil. Mice were injected daily intraperitoneally with either mock or 500 mg of K02288 (AdooQ Bioscience) dissolved in PBS containing 10% DMSO. Kaplan–Meier skin tumor‐free survival curves were obtained using Prism 6.0 software (GraphPad). All animal procedures were approved by McGill University Animal Care Committee according to the Canadian Council on Animal Care guidelines for use of laboratory animals in biological research.
FACS sorting and analysis
Whole prostate tissue from a minimum of three mice were dissected and pooled in cold PBS 2% FBS, minced and digested at 37°C for 2 hr in DMEM 5% FBS 1X Collagenase/hyaluronidase (Stemcell Technologies) for 5 min in 0.25% trypsin/EDTA and followed by 10 min in dispase II (5 U/ml) and DNase I (0.1 mg/ml) (Roche). All solution contained 10 μM of Rock inhibitor Y-27632 (ApexBio). The digested cells were passed through a 27G needle and filtered through a 70 μm cell strainer. Cell staining was done on ice for 30 min using human IgG blocking solution and antibodies CD45 (30-F11), TER119 (TER-119), CD31 (MEC13), CD49f (GoH3), EpCAM (G8.8), SCA1 (D7) (all from Biolegend) and TROP2 (from R and D). Dead cells were excluded by fixable Viability dye (eBioscience) staining. FACS analysis and sorting was performed on a BD Fortessa and Aria Fusion apparatus (BD Biosciences). Data was analyzed using DIVA (BD Biosciences) and FlowJo softwares.
Short-term organoid propagation assay
LIN-SCA1+CD49F+EPCAM+TROP2+ basal cells were sorted from whole prostate and plated in advanced DMEM/F12 (ThermoFisher) 50% matrigel (Corning) around the rims of 12-well plates. Organoids were grown for 7 days in modified organoid media composed of WIT basic media (Cellaria) supplemented with 10 ng/ml EGF, 25 ug/ml BPE, 1X B27 (Life Technologies) and 10 µM Y-27632. Pictures of organoid culture were taken with an AxioObserver (Zeiss) and organoid size was analyzed using ImageJ (Fiji) software. Passaging of organoids was done by digestion with dispase for 1 hr at 37°C and Trypsin 0.25% EDTA for 5 min, syringe trituration and replating in 50% matrigel. Viable cells from dissociated organoids were counted using TC10 cell counter (Biorad) with trypan blue and replated at a concentration of 105 per wells. In vitro CreERT2 induction was done by treatment of organoid with 500 ng/ml 4-hydroxy-tamoxifen (4-OHT). Media supplemented with either exogenous 50 ng/ml of recombinant hBMP5 (Aviscera Bioscience), 180 ng/ml recombinant hNOGGIN (RayBiotech) or 10 μM of K02288 inhibitor (AdooQ Bioscience) was changed every other day. Organoid differentiation was done by supplementing culture media with 10−8M 5α-dihydrotestosterone (DHT, Steraloids). Electroporation of shRNAs either scrambled or against Bmp5 (MISSION pLKO.1-Puro shRNA; Sigma-Aldrich) was done on single cells dissociated from passage one organoid using P1 Primary Cell 4D-Nucleofector Kit (Bioscience) using program EL-110 and selected using 0.5 μg/ml of puromycin. Growth rate of cells upon organoid passage was calculated using nonlinear regression curve fitting and significance between genotype was assessed by one-way ANOVA using Prism 6.0 software (GraphPad).
Allograft/limiting dilution assay
Urogenital sinus mesenchyme (UGSM) culture were described previously (Xin et al., 2003), briefly the urogenital sinus from wild type or Bmp5SE/SE embryos between E14.5 to E16.5 was digested in 1% trypsin in HBSS for 90 min at 4°C. Mesenchyme was separated from the epithelium and digested in 0.2% collagenase A for 1 hr at 37°C. Single cells were plated on fibronectin treated plastic in DMEM medium 5% FBS 5% Nu serum 1% Non-Essential Amino Acids (NEAA) 1% glutamine and 1 nM 5α-dihydrotestosterone (DHT, Steraloids). UGSM overexpressing BMP5, was generated by infection with lentiviral particles from either empty or BMP5 expressing pLenti plasmid and subjected to selection with puromycin. Subrenal regeneration assays have been previously described (Doles et al., 2005). Briefly, sorted TdTomato+ basal cells from a pool of a minimum of three mice from either Pbsn-Cre Rosa26LstopLTdtomato, Pbsn-Cre Gata3f/fRosa26LstopLTdtomato, Krt5CreERT2Gata3f/fRosa26LstopLTdtomato, constitutively active Rosa26LTdTomato or Bmp5SE/SERosa26LTdTomato genotype were mixed with 105 UGSM cells of the indicated genotype in rat collagen I (Corning) and implanted under the kidney capsule of SCID-beige recipient mice. Growth of prostate tissue grafts was stimulated by subcutaneous implantation of silastic testosterone implant of 25 mg every 3 weeks for 90 days. An outgrowth was defined as an epithelial TdTomato+ fluorescent structure comprising ducts. A minimum of four replicates was done per dilution and using Poisson distribution, Prostate reconstituting unit (PRU) frequency was calculated for basal cells from the whole prostate following limiting dilution transplantation using L-calc software (Stem cell technologies). Student's t-tests were performed for statistical analysis between two groups.
Microscopy and image analysis
Immunofluorescence and H&E staining were performed on PFA-fixed organoid or tissue embedded in paraffin or on freshly frozen tissue embedded in OCT, sectioned to obtain 4- and 10-μm-thick sections as described previously, respectively (Nguyen et al., 2013). Staining was done overnight using the following primary antibodies: KRT5 (1:500, Biolegend #905901), KRT8/18 (1:200, Fitzgerald #20R-CP004), GATA3 (1:100, SantaCruz #sc-9009) and Ki67 (1:200, eBioscience #14-5698-82). TUNEL staining was done using the In Situ Cell Death Detection Kit (Roche), following manufacturer’s protocol. Immunofluorescence images were acquired using either an LSM710, LSM780 or LSM800 confocal microscope (Zeiss). H&E images were scanned on an AperioScanScope AT, whereas brightfield images were taken with an Axio Observer Z1 (Zeiss).
RNA isolation, quantitative RT-PCR and transcriptomic profiling
Total RNA was extracted from sorted population of prostate cells or organoid cultures using a RNeasy micro kit (Qiagen). To increase the proportion of stem/progenitor cells in the population, organoids were harvested after 4 days in culture (instead of 7). RNA was reverse transcribed with MMLV (Invitrogen) according to manufacturer’s procedures. Real-time quantitative PCR was performed using Green-2-go mastermix (BioBasic Inc) on Realplex2 Mastercycler (Eppendorf). Total RNA was isolated and sequenced from day 4 organoids of wild type and Pbsn-Cre Gata33f/f at passages 0, 2, 3 and 4. Sequencing libraries were prepared by Genome Quebec Innovation Centre (Montreal, Canada), using the TruSeq Stranded Total RNA Sample Preparation Kit (Illumina TS-122–2301, San Diego, CA) following depletion or ribosomal and fragmented RNA. The libraries were sequenced using the Illumina HiSeq 2000 sequencer, 100 nucleotide paired-end reads, generating approximately 60 million reads per sample. The sequencing reads were pseudo aligned to the mouse reference genome (mm10) using default parameters in Kallisto (Bray et al., 2016). Transcripts were annotated using Ensembl release 89. Abundance estimate and bootstrap values generated by Kallisto were used for expression quantification (Bray et al., 2016). Differential expression testing was performed to identify genes differently expressed between genotypes and passages with Sleuth using either a likelihood ratio test (LRT) or Walds test (WT) (Pimentel et al., 2017) from Sleuth package. Maps of sequencing reads were generated using R and the ggplot2 package (version 1), and bedtools (Quinlan and Hall, 2010). Analysis of Gata3-deletion of exon four by Pbsn-Cre was done by mapping raw reads to the Gata3 genomic locus using the bedtools package. Heatmap of normalized gene expression (Average = 0; variance = 1) were generated using matrix2png program (Pavlidis and Noble, 2003). All raw and processed transcriptome data are available from NCBI GEO (accession GSE155289).
Biotin-chromatin immunoprecipitation pulldown
Prostate tissue from Gata3bio/bio Rosa26BirA/BirA mice were minced down and crosslinked for 10 min with 1% formaldehyde. Formaldehyde was quenched by addition of 0.125 M glycine. Fixed cells were pelleted by centrifugation, washed twice in cold phosphate-buffered saline, then washed once in Triton buffer for 15 min (10 mM Tris-HCl, pH 8.0, 10 mM EDTA, 0.5 mM EGTA, 0.25% Triton X-100) and once in NaCl buffer for 15 min (10 mM Tris-HCl, pH 8.0, 1 mM EDTA, 0.5 mM EGTA, 200 mM NaCl). Cells were pelleted, resuspended in RIPA buffer (10 mM Tris-HCl, pH 8.0, 140 mM NaCl, 1 mM EDTA, 1% Triton X-100, 0.1% SDS, 0.1% deoxycholate) and sonicated (7 × 10 s bursts) to make soluble chromatin ranging in size from 500 to 1000 bp. Cellular debris were removed by centrifugation (16,000 × g for 10 min), and protein concentrations were determined by Bradford staining. Crosslinked extracts were subjected to BioChIP pulldown using streptavidin conjugated beads or IgG control beads. Bound extracts were sequentially washed twice with 1 ml of RIPA buffer, twice with 1 ml of LiCl buffer (10 mM Tris-HCl, pH 8.0, 250 mMLiCl, 1 mM EDTA, 1% Nonidet P-40, 1% deoxycholate) and twice with 1 ml of TE buffer. Chromatin samples were then eluted by heating for 15 min at 65°C in 300 μl of elution buffer (50 mM Tris-HCl, pH 8.0, 10 mM EDTA, 1% SDS). After centrifugation, supernatants were diluted by addition of 300 μl of TE buffer and heated overnight at 65°C to reverse cross-links. RNA and proteins were sequentially degraded by addition of 30 μg of RNase A for 30 min at 37°C, and 120 μg of proteinase K for 2–3 hr at 37°C. DNA was phenol/chloroform-extracted and ethanol-precipitated in the presence of 10 μg of tRNA as a carrier. Amplification of the indicated locus was done by quantitative PCR using Green-2-go mastermix (BioBasic Inc) on Realplex2 Mastercycler (Eppendorf).
Cell lines and western blot
CaP2 and CaP8 murine prostatic cells were provided by Dr. Hong Wu (UCLA) and maintained as described (Jiao et al., 2007) and confirmed to be mycoplasma negative by PCR. Growth curves of treated cells with indicated amount of K02288 were obtained using phase object confluence as monitored every 2 hr by IncuCyte S3 live cell imaging (Essen Bioscience). Significance between genotype was assessed by one-way ANOVA using Prism 6.0 software (GraphPad). Protein extracts were prepared after 1 hr treatment with K02288 using RIPA lysis buffer (10 mM Tris–HCl (pH 8.0), 140 mM NaCl, 1% Triton X-100, 0.1% sodium dodecyl sulphate, 0.1% deoxycholate, 1 mM EDTA) supplemented with protease and phosphatase inhibitor cocktails (Roche). Proteins were immobilized on Immobilon FL PVDF membranes (Millipore) and probed with the following antibodies diluted in Odyssey blocking buffer (LI-COR): anti-pAKT S473 (1:500, CST), anti-AKT (1:500, CST), and anti-α-TUBULIN (DM1A) (1:2000, Sigma). Rabbit and mouse IR dye secondary antibodies (LI-COR Biosciences) were used at 1:10 000. Blots were scanned with the Odyssey imaging system (LI-COR).
Acknowledgements
We are grateful to members of the Bouchard laboratory and Drs. Luke McCaffrey, Peter Siegel, and Yojiro Yamanaka for critical reading of the manuscript. Special thanks to Dr Meinrad Busslinger (IMP, Vienna) for providing the Gata3bio/bio mice. We thank the Advanced BioImaging Facility (ABIF), the Flow Cytometry platform as well as the histology core facilities of McGill University for their technical support.
Appendix 1
Appendix 1—key resources table.
| Reagent type (species) or resource |
Designation | Source or reference | Identifiers | Additional information |
|---|---|---|---|---|
| Strain, strain background (Mus musculus) | ARR2-PB-Cre (Pbsn-Cre), C57BL/6 (Mus musculus) | Wu et al., 2001 | RRID:IMSR_JAX:026662 | (Mus musculus; male) |
| Strain, strain background (Mus musculus) | Gata3flox, C57BL/6 (Mus musculus) | Grote et al., 2006 | (Mus musculus; male) | |
| Strain, strain background (Mus musculus) | Gata3GFP, C57BL/6 (Mus musculus) | Grote et al., 2006 | (Mus musculus; male) | |
| Strain, strain background (Mus musculus) | Rosa26GATA3, C57BL/6 (Mus musculus) | Grote et al., 2006 | (Mus musculus; male) | |
| Strain, strain background (Mus musculus) | Gata3bio, C57BL/6 (Mus musculus) | Dr. Busslinger, IMP, Vienna | (Mus musculus; male) | |
| Strain, strain background (Mus musculus) | Rosa26BirA, C57BL/6 (Mus musculus) | Wood et al., 2016 | RRID:IMSR_JAX:010920 | (Mus musculus; male) |
| Strain, strain background (Mus musculus) | Krt5CreERT2, C57BL/6 (Mus musculus) | Van Keymeulen et al., 2011 | RRID:IMSR_JAX:029155 | (Mus musculus; male) |
| Strain, strain background (Mus musculus) | Krt8CreERT2, C57BL/6 (Mus musculus) | Choi et al., 2012 | (Mus musculus; male) | |
| Strain, strain background (Mus musculus) | Rosa26LstopLTdTomato, C57BL/6 (Mus musculus) | Madisen et al., 2010 | RRID:IMSR_JAX:007909 | (Mus musculus; male) |
| Strain, strain background (Mus musculus) | Ptenflox , C57BL/6 (Mus musculus) | Trotman et al., 2003 | (Mus musculus; male) | |
| Strain, strain background (Mus musculus) | Bmp5SE, C57BL/6 (Mus musculus) | Kingsley et al., 1992 | RRID:IMSR_JAX:000056 | (Mus musculus; male) |
| Strain, strain background (Mus musculus) | SCID-beige, C57BL/6 (Mus musculus) | Charles River | (Mus musculus; male) | |
| Cell line (Mus musculus) | CaP2 (Mus musculus) | Jiao et al., 2007 | male prostate | |
| Cell line (Mus musculus) | CaP8 (Mus musculus) | Jiao et al., 2007 | male prostate | |
| Transfected construct (Human) | BMP5_TRC3 LentiORF puromycin V5 (pLX317) (human) | Sigma-Aldrich | TRCN0000472902 | mouse UGSM |
| Transfected construct (Human) | TRC3 LentiORF puromycin V5 (pLX317) empty (human) | Sigma-Aldrich | mouse UGSM | |
| Antibody | CD45 (30-F11; rat monoclonal) | Biolegend | (1/500) | |
| Antibody | TER119 (TER-119; rat monoclonal) | Biolegend | (1/1,000) | |
| Antibody | CD31 (MEC13; rat monoclonal) | Biolegend | (1/1,000) | |
| Antibody | CD49f (GoH3; rat monoclonal) | Biolegend | (1/2,000) | |
| Antibody | EpCAM (G8.8; rat monoclonal) | Biolegend | (1/500) | |
| Antibody | SCA1 (D7; rat monoclonal) | Biolegend | (1/500) | |
| Antibody | TROP2 (goat polyclonal) | R&D | (1/100) | |
| Antibody | KRT5 (chicken polyclonal) | Biolegend | 905901 | (1/500) |
| Antibody | KRT8/18 (guinea pig polyclonal) | Fitzgerald | 20R-CP004 | (1/200) |
| Antibody | GATA3 (H-48; rabbit polyclonal) | SantaCruz | sc-9009 | (1/100) |
| Antibody | Ki67 (SolA15, rat monoclonal) | eBioscience | 14-5698-82 | (1/200) |
| Antibody | pAKT S473 (rabbit monoclonal) | CST | 4060 | (1/500) |
| Antibody | AKT (rabbit polyclonal) | CST | 9272 | (1/500) |
| Antibody | α-TUBULIN (DM1A; mouse monoclonal) | Sigma | T9026 | (1/2000) |
| Antibody | IRDye 800CW Donkey anti-Rabbit IgG | licor | 926-32213 | (1/10,000) |
| Antibody | IRDye 680RD Donkey anti-Mouse IgG | licor | 926-68072 | (1/10,000) |
| Recombinant DNA reagent | MISSION pLKO.1-Puro shRNA scrambled (mouse) | Sigma-Aldrich | ||
| Recombinant DNA reagent | MISSION pLKO.1-Puro shRNA Bmp5 (mouse) | Sigma-Aldrich | TRCN0000065609 | |
| Recombinant DNA reagent | MISSION pLKO.1-Puro shRNA Bmp5 (mouse) | Sigma-Aldrich | TRCN0000065610 | |
| Recombinant DNA reagent | MISSION pLKO.1-Puro shRNA Bmp5 (mouse) | Sigma-Aldrich | TRCN0000065611 | |
| Sequence-based reagent | Bmp5_Fw | Sigma-Aldrich | TTACTTAGGGGTATTGTGGGCT | |
| Sequence-based reagent | Bmp5_Rv | Sigma-Aldrich | CCGTCTCTCATGGTTCCGTAG | |
| Sequence-based reagent | Gata3_Fw | Sigma-Aldrich | GTGGTCACACTCGGATTCCT | |
| Sequence-based reagent | Gata3_Rv | Sigma-Aldrich | GCAAAAAGGAGGGTTTAGGG | |
| Sequence-based reagent | Krt5_Fw | Sigma-Aldrich | GAGATCGCCACCTACAGGAA | |
| Sequence-based reagent | Krt5_Rv | Sigma-Aldrich | TCCTCCGTAGCCAGAAGAGA | |
| Sequence-based reagent | Krt14_Fw | Sigma-Aldrich | CCTCTGGCTCTCAGTCATCC | |
| Sequence-based reagent | Krt14_Rv | Sigma-Aldrich | TGAGCAGCATGTAGCAGCTT | |
| Sequence-based reagent | Krt18_Fw | Sigma-Aldrich | ACTCCGCAAGGTGGTAGATGA | |
| Sequence-based reagent | Krt18_Rv | Sigma-Aldrich | TCCACTTCCACAGTCAATCCA | |
| Sequence-based reagent | Krt8_Fw | Sigma-Aldrich | CAAGGTGGAACTAGAGTCCCG | |
| Sequence-based reagent | Krt8_Rv | Sigma-Aldrich | CTCGTACTGGGCACGAACTTC | |
| Sequence-based reagent | Trp63_Fw | Sigma-Aldrich | AGCAGCAAGTATCGGACAGC | |
| Sequence-based reagent | Trp63_Rv | Sigma-Aldrich | CGTCTCACGACCTCTCACTG | |
| Sequence-based reagent | Ly6a_Fw | Sigma-Aldrich | CCATCAATTACCTGCCCCTA | |
| Sequence-based reagent | Ly6a_Rv | Sigma-Aldrich | GGCAGATGGGTAAGCAAAGA | |
| Sequence-based reagent | Itga6_Fw | Sigma-Aldrich | CGCTGCTGCTCAGAATATCA | |
| Sequence-based reagent | Itga6_Rv | Sigma-Aldrich | AAGAACAGCCAGGAGGATGA | |
| Sequence-based reagent | Epcam_Fw | Sigma-Aldrich | GCTGTCATTGTGGTGGTGTC | |
| Sequence-based reagent | Epcam_Rv | Sigma-Aldrich | CACGGCTAGGCATTAAGCTC | |
| Sequence-based reagent | Ppia_Fw | Sigma-Aldrich | GTGCCAGGGTGGTGACTTTACACG | |
| Sequence-based reagent | Ppia_Rv | Sigma-Aldrich | TCCCAAAGACCACATGCTTGCCA | |
| Sequence-based reagent | Bactin_Fw | Sigma-Aldrich | TTGCTGACAGGATGCAGAAGGAGA | |
| Sequence-based reagent | Bactin_Rv | Sigma-Aldrich | ACTCCTGCTTGCTGATCCACATCT | |
| Sequence-based reagent | Bmp5_prom_Fw-8450 | Sigma-Aldrich | TCGGGTGGACCAGATTTAAG | |
| Sequence-based reagent | Bmp5_prom_Rv-8390 | Sigma-Aldrich | CAGCCATTCACGAAGTTCTCT | |
| Sequence-based reagent | Bmp5_prom_Fw-5942 | Sigma-Aldrich | TGAAAGTGGAGATGGGGAAG | |
| Sequence-based reagent | Bmp5_prom_Rv-5827 | Sigma-Aldrich | CCCAGTTTTGGAGGTTCAGA | |
| Sequence-based reagent | Bmp5_prom_Fw+11268 | Sigma-Aldrich | AAAGGGAAAAGTGCTCACCA | |
| Sequence-based reagent | Bmp5_prom_Rv+11312 | Sigma-Aldrich | TCCTCCCTCAGCTCAAAGAA | |
| Sequence-based reagent | Bmp5_prom_Fw+11859 | Sigma-Aldrich | TTGGAAGAGTTCCGATGAGG | |
| Sequence-based reagent | Bmp5_prom_Rv+11947 | Sigma-Aldrich | CAGAGTGGGTGGCAACTTCT | |
| Sequence-based reagent | Bmp5_prom_Fw+24561 | Sigma-Aldrich | GTGAGGTGGCTCAGCATGTA | |
| Sequence-based reagent | Bmp5_prom_Rv+24607 | Sigma-Aldrich | CCAGGGATGGATCTCAGGT | |
| Sequence-based reagent | Cyp19a1_prom-322_Fw | Sigma-Aldrich | GCAAATGCTGCTGATGAAAT | |
| Sequence-based reagent | Cyp19a1_prom-207_Rv | Sigma-Aldrich | ACCTTATCATCTCGCCCTTG | |
| Sequence-based reagent | Cdh1_prom-175_Fw | Sigma-Aldrich | GAACGACCGTGGAATAGGAA | |
| Sequence-based reagent | Cdh1_prom-98_Rv | Sigma-Aldrich | TCCTCCACCCCTGTCTGTAG | |
| Sequence-based reagent | R26wt_geno_Fw | Sigma-Aldrich | AAGGGAGCTGCAGTGGAGTA | |
| Sequence-based reagent | R26wt_geno_Rv | Sigma-Aldrich | CCGAAAATCTGTGGGAAGTC | |
| Sequence-based reagent | R26Tomato_Fw | Sigma-Aldrich | CCCCGTAATGCAGAAGAAGA | |
| Sequence-based reagent | R26Tomato_Rv | Sigma-Aldrich | GAGGTGATGTCCAGCTTGGT | |
| Sequence-based reagent | Bmp5wt_geno_Fw | Sigma-Aldrich | TAAGGACAAGGGAAACCCTC | |
| Sequence-based reagent | Bmp5SE_geno_Fw | Sigma-Aldrich | TAAGGACAAGGGAAACCCTT | |
| Sequence-based reagent | Bmp5_geno_Rv | Sigma-Aldrich | GAACCATTTCACCAGCTCCT | |
| Sequence-based reagent | Rosa26Gata3-wt_geno_Fw | Sigma-Aldrich | AAAGTCGCTCTGAGTTGTTAT | |
| Sequence-based reagent | Rosa26Gata3_geno_Rv | Sigma-Aldrich | GCGAAGAGTTTGTCCTCAACC | |
| Sequence-based reagent | Rosa26wt_geno_Rv | Sigma-Aldrich | GGAGCGGGAGAAATGGATATG | |
| Sequence-based reagent | Gata3_flox_geno_Fw | Sigma-Aldrich | GTCAGGGCACTAAGGGTTGTT | |
| Sequence-based reagent | Gata3_flox_geno_Rv | Sigma-Aldrich | TGGTAGAGTCCGCAGGCATTG | |
| Sequence-based reagent | Gata3GFP_geno_Fw | Sigma-Aldrich | GGCCTACCCGCTTCCATTGCT | |
| Sequence-based reagent | Gata3GFP_geno_Rv | Sigma-Aldrich | TATCAGCGGTTCATCTACAGC | |
| Sequence-based reagent | Pten_flox-wt_geno_Fw | Sigma-Aldrich | AAAAGTTCCCCTGCTGATGATTTGT | |
| Sequence-based reagent | Pten_flox-wt_geno_Rv | Sigma-Aldrich | TGTTTTTGACCAATTAAAGTAGGCTG | |
| Sequence-based reagent | Cre_geno_Fw | Sigma-Aldrich | AGGTGTAGAGAAGGCACTTAGC | |
| Sequence-based reagent | Cre_geno_Rv | Sigma-Aldrich | CTAATCGCCATCTTCCAGCAGG | |
| Peptide, recombinant protein | EGF | Peprotech | 315-09 | 10 ng/ml |
| Peptide, recombinant protein | hBMP5 | Aviscera Bioscience | 00013-01-100 | 50 ng/ml |
| Peptide, recombinant protein | hNOGGIN | RayBiotech | 230-00704-100 | 180 ng/ml |
| Peptide, recombinant protein | Collagenase/hyaluronidase | Stemcell Technologies | . 07912 | |
| Peptide, recombinant protein | dispase II | Roche | 4942078001 | (5 U/ml) |
| Peptide, recombinant protein | DNase I | Roche | 11284932001 | 0.1 mg/ml |
| Peptide, recombinant protein | matrigel | Corning | CACB354234 | |
| Peptide, recombinant protein | BPE | Life technologies | 13028014 | 25 ug/ml |
| Peptide, recombinant protein | b27 SUPPLEMENT | Life technologies | 17504044 | |
| Peptide, recombinant protein | collagenase A | Bioshop | COL004 | |
| Peptide, recombinant protein | fibronectin | Sigma-Aldrich | 11051407001 | |
| Peptide, recombinant protein | collagen type I | Corning | 354236 | |
| Peptide, recombinant protein | proteinase K | biobasic | PB0451 | |
| Peptide, recombinant protein | RNase A | Roche | 10109169001 | |
| Commercial assay or kit | In Situ Cell Death Detection Kit | Roche | 12156792910 | |
| Commercial assay or kit | P1 Primary Cell 4D-Nucleofector Kit | Bioscience | V4XP-1024 | |
| Commercial assay or kit | RNeasy micro kit | Qiagen | 74004 | |
| Commercial assay or kit | Green-2-go mastermix | BioBasic | QPCR004 | |
| Commercial assay or kit | TruSeq Stranded Total RNA Sample Preparation Kit | Illumina | ||
| Chemical compound, drug | tamoxifen | Toronto Research Chemicals | T006000 | 3 mg |
| Chemical compound, drug | K02288 | AdooQ Bioscience | A14311 | 10 uM |
| Chemical compound, drug | Y-27632 | ApexBio | A3008 | 10 uM |
| Chemical compound, drug | 4-hydroxy-tamoxifen | Toronto Research Chemicals | H954725 | 500 ng/ml |
| Chemical compound, drug | 5α-dihydrotestosterone | steraloids | A2570-000 | 1nM |
| Chemical compound, drug | phosphatase inhibitor cocktails (Phostop) | Sigma | 4906845001 | |
| Chemical compound, drug | Fixable Viability Dye eFluor 780 | ebioscience | 65-0865-18 | |
| Software, algorithm | Prism 6.0 | GraphPad | ||
| Software, algorithm | ImageJ | Fiji | ||
| Software, algorithm | FlowJo | LLC | ||
| Software, algorithm | DIVA | BD Biosciences | ||
| Software, algorithm | L-calc | Stem cell technologies | ||
| Software, algorithm | matrix2png program | Pavlidis and Noble, 2003 |
Funding Statement
The funders had no role in study design, data collection and interpretation, or the decision to submit the work for publication.
Contributor Information
Maxime Bouchard, Email: maxime.bouchard@mcgill.ca.
Charles L Sawyers, Memorial Sloan Kettering Cancer Center, United States.
Anna Akhmanova, Utrecht University, Netherlands.
Funding Information
This paper was supported by the following grant:
Canadian Institutes of Health Research MOP-130460 to Maxime Bouchard.
Additional information
Competing interests
No competing interests declared.
Author contributions
Conceptualization, Data curation, Formal analysis, Validation, Investigation, Visualization, Writing - original draft, Writing - review and editing.
Data curation, Formal analysis, Validation, Investigation, Visualization.
Data curation, Software, Formal analysis, Validation, Investigation, Visualization.
Data curation, Formal analysis, Validation, Investigation, Visualization.
Data curation, Formal analysis, Validation, Investigation, Visualization.
Conceptualization, Supervision, Funding acquisition, Writing - original draft, Writing - review and editing.
Ethics
Animal experimentation: All animal procedures were approved by McGill University Animal Care Committee (Permit#2011-5954) according to the Canadian Council on Animal Care guidelines for use of laboratory animals in biological research.
Additional files
Data availability
Data from this study are included in the manuscript and supporting files. Source data files have been provided for Figures 1ABC-2C-3ABC-4AEFJ-2S1AC-4S1AB. Sequencing data have been deposited in GEO under accession codes GSE155289.
The following dataset was generated:
Tremblay M, Shafer ME, Bouchard M. 2020. Gata3 controls stem/progenitor maintenance potential in prostate organoids. NCBI Gene Expression Omnibus. GSE155289
References
- Abeshouse A, Ahn J, Akbani R, Ally A, Amin S, Andry CD, Annala M, Aprikian A, Armenia J, Arora A, Auman JT, Balasundaram M, Balu S, Barbieri CE, Bauer T, Benz CC, Bergeron A, Beroukhim R, Berrios M, Bivol A, Bodenheimer T, Boice L, Bootwalla MS, Borges dos Reis R, Boutros PC, Bowen J, Bowlby R, Boyd J, Bradley RK, Breggia A, Brimo F, Bristow CA, Brooks D, Broom BM, Bryce AH, Bubley G, Burks E, Butterfield YSN, Button M, Canes D, Carlotti CG, Carlsen R, Carmel M, Carroll PR, Carter SL, Cartun R, Carver BS, Chan JM, Chang MT, Chen Y, Cherniack AD, Chevalier S, Chin L, Cho J, Chu A, Chuah E, Chudamani S, Cibulskis K, Ciriello G, Clarke A, Cooperberg MR, Corcoran NM, Costello AJ, Cowan J, Crain D, Curley E, David K, Demchok JA, Demichelis F, Dhalla N, Dhir R, Doueik A, Drake B, Dvinge H, Dyakova N, Felau I, Ferguson ML, Frazer S, Freedland S, Fu Y, Gabriel SB, Gao J, Gardner J, Gastier-Foster JM, Gehlenborg N, Gerken M, Gerstein MB, Getz G, Godwin AK, Gopalan A, Graefen M, Graim K, Gribbin T, Guin R, Gupta M, Hadjipanayis A, Haider S, Hamel L, Hayes DN, Heiman DI, Hess J, Hoadley KA, Holbrook AH, Holt RA, Holway A, Hovens CM, Hoyle AP, Huang M, Hutter CM, Ittmann M, Iype L, Jefferys SR, Jones CD, Jones SJM, Juhl H, Kahles A, Kane CJ, Kasaian K, Kerger M, Khurana E, Kim J, Klein RJ, Kucherlapati R, Lacombe L, Ladanyi M, Lai PH, Laird PW, Lander ES, Latour M, Lawrence MS, Lau K, LeBien T, Lee D, Lee S, Lehmann K-V, Leraas KM, Leshchiner I, Leung R, Libertino JA, Lichtenberg TM, Lin P, Linehan WM, Ling S, Lippman SM, Liu J, Liu W, Lochovsky L, Loda M, Logothetis C, Lolla L, Longacre T, Lu Y, Luo J, Ma Y, Mahadeshwar HS, Mallery D, Mariamidze A, Marra MA, Mayo M, McCall S, McKercher G, Meng S, Mes-Masson A-M, Merino MJ, Meyerson M, Mieczkowski PA, Mills GB, Shaw KRM, Minner S, Moinzadeh A, Moore RA, Morris S, Morrison C, Mose LE, Mungall AJ, Murray BA, Myers JB, Naresh R, Nelson J, Nelson MA, Nelson PS, Newton Y, Noble MS, Noushmehr H, Nykter M, Pantazi A, Parfenov M, Park PJ, Parker JS, Paulauskis J, Penny R, Perou CM, Piché A, Pihl T, Pinto PA, Prandi D, Protopopov A, Ramirez NC, Rao A, Rathmell WK, Rätsch G, Ren X, Reuter VE, Reynolds SM, Rhie SK, Rieger-Christ K, Roach J, Robertson AG, Robinson B, Rubin MA, Saad F, Sadeghi S, Saksena G, Saller C, Salner A, Sanchez-Vega F, Sander C, Sandusky G, Sauter G, Sboner A, Scardino PT, Scarlata E, Schein JE, Schlomm T, Schmidt LS, Schultz N, Schumacher SE, Seidman J, Neder L, Seth S, Sharp A, Shelton C, Shelton T, Shen H, Shen R, Sherman M, Sheth M, Shi Y, Shih J, Shmulevich I, Simko J, Simon R, Simons JV, Sipahimalani P, Skelly T, Sofia HJ, Soloway MG, Song X, Sorcini A, Sougnez C, Stepa S, Stewart C, Stewart J, Stuart JM, Sullivan TB, Sun C, Sun H, Tam A, Tan D, Tang J, Tarnuzzer R, Tarvin K, Taylor BS, Teebagy P, Tenggara I, Têtu B, Tewari A, Thiessen N, Thompson T, Thorne LB, Tirapelli DP, Tomlins SA, Trevisan FA, Troncoso P, True LD, Tsourlakis MC, Tyekucheva S, Van Allen E, Van Den Berg DJ, Veluvolu U, Verhaak R, Vocke CD, Voet D, Wan Y, Wang Q, Wang W, Wang Z, Weinhold N, Weinstein JN, Weisenberger DJ, Wilkerson MD, Wise L, Witte J, Wu C-C, Wu J, Wu Y, Xu AW, Yadav SS, Yang L, Yang L, Yau C, Ye H, Yena P, Zeng T, Zenklusen JC, Zhang H, Zhang J, Zhang J, Zhang W, Zhong Y, Zhu K, Zmuda E, Cancer Genome Atlas Research Network The molecular taxonomy of primary prostate Cancer. Cell. 2015;163:1011–1025. doi: 10.1016/j.cell.2015.10.025. [DOI] [PMC free article] [PubMed] [Google Scholar]
- Badeaux MA, Jeter CR, Gong S, Liu B, Suraneni MV, Rundhaug J, Fischer SM, Yang T, Kusewitt D, Tang DG. In vivo functional studies of tumor-specific retrogene NanogP8 in transgenic animals. Cell Cycle. 2013;12:2395–2408. doi: 10.4161/cc.25402. [DOI] [PMC free article] [PubMed] [Google Scholar]
- Batlle E, Clevers H. Cancer stem cells revisited. Nature Medicine. 2017;23:1124–1134. doi: 10.1038/nm.4409. [DOI] [PubMed] [Google Scholar]
- Bray NL, Pimentel H, Melsted P, Pachter L. Near-optimal probabilistic RNA-seq quantification. Nature Biotechnology. 2016;34:525–527. doi: 10.1038/nbt.3519. [DOI] [PubMed] [Google Scholar]
- Brocqueville G, Chmelar RS, Bauderlique-Le Roy H, Deruy E, Tian L, Vessella RL, Greenberg NM, Rohrschneider LR, Bourette RP. s-SHIP expression identifies a subset of murine basal prostate cells as neonatal stem cells. Oncotarget. 2016;7:29228–29244. doi: 10.18632/oncotarget.8709. [DOI] [PMC free article] [PubMed] [Google Scholar]
- Chen S, Wang S, Xie T. Restricting self-renewal signals within the stem cell niche: multiple levels of control. Current Opinion in Genetics & Development. 2011;21:684–689. doi: 10.1016/j.gde.2011.07.008. [DOI] [PubMed] [Google Scholar]
- Chen EY, Tan CM, Kou Y, Duan Q, Wang Z, Meirelles GV, Clark NR, Ma'ayan A. Enrichr: interactive and collaborative HTML5 gene list enrichment analysis tool. BMC Bioinformatics. 2013;14:128. doi: 10.1186/1471-2105-14-128. [DOI] [PMC free article] [PubMed] [Google Scholar]
- Choi N, Zhang B, Zhang L, Ittmann M, Xin L. Adult murine prostate basal and luminal cells are self-sustained lineages that can both serve as targets for prostate Cancer initiation. Cancer Cell. 2012;21:253–265. doi: 10.1016/j.ccr.2012.01.005. [DOI] [PMC free article] [PubMed] [Google Scholar]
- Chung MI, Bujnis M, Barkauskas CE, Kobayashi Y, Hogan BLM. Niche-mediated BMP/SMAD signaling regulates lung alveolar stem cell proliferation and differentiation. Development. 2018;145:dev163014. doi: 10.1242/dev.163014. [DOI] [PMC free article] [PubMed] [Google Scholar]
- Darby S, Cross SS, Brown NJ, Hamdy FC, Robson CN. BMP-6 over-expression in prostate Cancer is associated with increased Id-1 protein and a more invasive phenotype. The Journal of Pathology. 2008;214:394–404. doi: 10.1002/path.2292. [DOI] [PubMed] [Google Scholar]
- David CJ, Massagué J. Contextual determinants of tgfβ action in development, immunity and Cancer. Nature Reviews Molecular Cell Biology. 2018;19:419–435. doi: 10.1038/s41580-018-0007-0. [DOI] [PMC free article] [PubMed] [Google Scholar]
- Doles JD, Vezina CM, Lipinski RJ, Peterson RE, Bushman W. Growth, morphogenesis, and differentiation during mouse prostate development in situ, in renal grafts, and in vitro. The Prostate. 2005;65:390–399. doi: 10.1002/pros.20321. [DOI] [PubMed] [Google Scholar]
- Dumont NA, Wang YX, Rudnicki MA. Intrinsic and extrinsic mechanisms regulating satellite cell function. Development. 2015;142:1572–1581. doi: 10.1242/dev.114223. [DOI] [PMC free article] [PubMed] [Google Scholar]
- Genander M, Cook PJ, Ramsköld D, Keyes BE, Mertz AF, Sandberg R, Fuchs E. BMP signaling and its pSMAD1/5 target genes differentially regulate hair follicle stem cell lineages. Cell Stem Cell. 2014;15:619–633. doi: 10.1016/j.stem.2014.09.009. [DOI] [PMC free article] [PubMed] [Google Scholar]
- Goldstein AS, Huang J, Guo C, Garraway IP, Witte ON. Identification of a cell of origin for human prostate Cancer. Science. 2010;329:568–571. doi: 10.1126/science.1189992. [DOI] [PMC free article] [PubMed] [Google Scholar]
- Grote D, Souabni A, Busslinger M, Bouchard M. Pax 2/8-regulated gata 3 expression is necessary for morphogenesis and guidance of the nephric duct in the developing kidney. Development. 2006;133:53–61. doi: 10.1242/dev.02184. [DOI] [PubMed] [Google Scholar]
- Haramis A-PG, Begthel H, van den Born M, van Es J, Jonkheer S, Offerhaus GJ, Clevers H. De Novo Crypt Formation and Juvenile Polyposis on BMP Inhibition in Mouse Intestine. Science. 2004;303:1684–1686. doi: 10.1126/science.1093587. [DOI] [PubMed] [Google Scholar]
- He XC, Zhang J, Tong W-G, Tawfik O, Ross J, Scoville DH, Tian Q, Zeng X, He X, Wiedemann LM, Mishina Y, Li L. BMP signaling inhibits intestinal stem cell self-renewal through suppression of Wnt–β-catenin signaling. Nature Genetics. 2004;36:1117–1121. doi: 10.1038/ng1430. [DOI] [PubMed] [Google Scholar]
- Jiao J, Wang S, Qiao R, Vivanco I, Watson PA, Sawyers CL, Wu H. Murine cell lines derived from pten null prostate Cancer show the critical role of PTEN in hormone refractory prostate Cancer development. Cancer Research. 2007;67:6083–6091. doi: 10.1158/0008-5472.CAN-06-4202. [DOI] [PubMed] [Google Scholar]
- Kangsamaksin T, Morris RJ. Bone morphogenetic protein 5 regulates the number of keratinocyte stem cells from the skin of mice. Journal of Investigative Dermatology. 2011;131:580–585. doi: 10.1038/jid.2010.378. [DOI] [PubMed] [Google Scholar]
- King JA, Marker PC, Seung KJ, Kingsley DM. BMP5 and the molecular, skeletal, and soft-tissue alterations in short ear mice. Developmental Biology. 1994;166:112–122. doi: 10.1006/dbio.1994.1300. [DOI] [PubMed] [Google Scholar]
- Kingsley DM, Bland AE, Grubber JM, Marker PC, Russell LB, Copeland NG, Jenkins NA. The mouse short ear skeletal morphogenesis locus is associated with defects in a bone morphogenetic member of the TGF beta superfamily. Cell. 1992;71:399–410. doi: 10.1016/0092-8674(92)90510-J. [DOI] [PubMed] [Google Scholar]
- Kobayashi A, Okuda H, Xing F, Pandey PR, Watabe M, Hirota S, Pai SK, Liu W, Fukuda K, Chambers C, Wilber A, Watabe K. Bone morphogenetic protein 7 in dormancy and metastasis of prostate Cancer stem-like cells in bone. The Journal of Experimental Medicine. 2011;208:2641–2655. doi: 10.1084/jem.20110840. [DOI] [PMC free article] [PubMed] [Google Scholar]
- Kuleshov MV, Jones MR, Rouillard AD, Fernandez NF, Duan Q, Wang Z, Koplev S, Jenkins SL, Jagodnik KM, Lachmann A, McDermott MG, Monteiro CD, Gundersen GW, Ma'ayan A. Enrichr: a comprehensive gene set enrichment analysis web server 2016 update. Nucleic Acids Research. 2016;44:W90–W97. doi: 10.1093/nar/gkw377. [DOI] [PMC free article] [PubMed] [Google Scholar]
- Kwon OJ, Zhang L, Ittmann MM, Xin L. Prostatic inflammation enhances basal-to-luminal differentiation and accelerates initiation of prostate Cancer with a basal cell origin. PNAS. 2014;111:E592–E600. doi: 10.1073/pnas.1318157111. [DOI] [PMC free article] [PubMed] [Google Scholar]
- Lewis CJ, Mardaryev AN, Poterlowicz K, Sharova TY, Aziz A, Sharpe DT, Botchkareva NV, Sharov AA. Bone morphogenetic protein signaling suppresses wound-induced skin repair by inhibiting keratinocyte proliferation and migration. Journal of Investigative Dermatology. 2014;134:827–837. doi: 10.1038/jid.2013.419. [DOI] [PMC free article] [PubMed] [Google Scholar]
- Li Z, Fei T, Zhang J, Zhu G, Wang L, Lu D, Chi X, Teng Y, Hou N, Yang X, Zhang H, Han JD, Chen YG. BMP4 signaling acts via dual-specificity phosphatase 9 to control ERK activity in mouse embryonic stem cells. Cell Stem Cell. 2012;10:171–182. doi: 10.1016/j.stem.2011.12.016. [DOI] [PubMed] [Google Scholar]
- Liu J, Pascal LE, Isharwal S, Metzger D, Ramos Garcia R, Pilch J, Kasper S, Williams K, Basse PH, Nelson JB, Chambon P, Wang Z. Regenerated luminal epithelial cells are derived from preexisting luminal epithelial cells in adult mouse prostate. Molecular Endocrinology. 2011;25:1849–1857. doi: 10.1210/me.2011-1081. [DOI] [PMC free article] [PubMed] [Google Scholar]
- Lu X, Jin EJ, Cheng X, Feng S, Shang X, Deng P, Jiang S, Chang Q, Rahmy S, Chaudhary S, Lu X, Zhao R, Wang YA, DePinho RA. Opposing roles of tgfβ and BMP signaling in prostate Cancer development. Genes & Development. 2017;31:2337–2342. doi: 10.1101/gad.307116.117. [DOI] [PMC free article] [PubMed] [Google Scholar]
- Madisen L, Zwingman TA, Sunkin SM, Oh SW, Zariwala HA, Gu H, Ng LL, Palmiter RD, Hawrylycz MJ, Jones AR, Lein ES, Zeng H. A robust and high-throughput Cre reporting and characterization system for the whole mouse brain. Nature Neuroscience. 2010;13:133–140. doi: 10.1038/nn.2467. [DOI] [PMC free article] [PubMed] [Google Scholar]
- Morrison SJ, Kimble J. Asymmetric and symmetric stem-cell divisions in development and cancer. Nature. 2006;441:1068–1074. doi: 10.1038/nature04956. [DOI] [PubMed] [Google Scholar]
- Mulholland DJ, Xin L, Morim A, Lawson D, Witte O, Wu H. Lin-Sca-1+CD49fhigh stem/progenitors are tumor-initiating cells in the Pten-null prostate Cancer model. Cancer Research. 2009;69:8555–8562. doi: 10.1158/0008-5472.CAN-08-4673. [DOI] [PMC free article] [PubMed] [Google Scholar]
- Mulholland DJ, Tran LM, Li Y, Cai H, Morim A, Wang S, Plaisier S, Garraway IP, Huang J, Graeber TG, Wu H. Cell autonomous role of PTEN in regulating castration-resistant prostate Cancer growth. Cancer Cell. 2011;19:792–804. doi: 10.1016/j.ccr.2011.05.006. [DOI] [PMC free article] [PubMed] [Google Scholar]
- Nguyen AH, Tremblay M, Haigh K, Koumakpayi IH, Paquet M, Pandolfi PP, Mes-Masson AM, Saad F, Haigh JJ, Bouchard M. Gata3 antagonizes Cancer progression in Pten-deficient prostates. Human Molecular Genetics. 2013;22:2400–2410. doi: 10.1093/hmg/ddt088. [DOI] [PubMed] [Google Scholar]
- Oshimori N, Fuchs E. The harmonies played by TGF-β in stem cell biology. Cell Stem Cell. 2012;11:751–764. doi: 10.1016/j.stem.2012.11.001. [DOI] [PMC free article] [PubMed] [Google Scholar]
- Ousset M, Van Keymeulen A, Bouvencourt G, Sharma N, Achouri Y, Simons BD, Blanpain C. Multipotent and unipotent progenitors contribute to prostate postnatal development. Nature Cell Biology. 2012;14:1131–1138. doi: 10.1038/ncb2600. [DOI] [PubMed] [Google Scholar]
- Pavlidis P, Noble WS. Matrix2png: a utility for visualizing matrix data. Bioinformatics. 2003;19:295–296. doi: 10.1093/bioinformatics/19.2.295. [DOI] [PubMed] [Google Scholar]
- Pimentel H, Bray NL, Puente S, Melsted P, Pachter L. Differential analysis of RNA-seq incorporating quantification uncertainty. Nature Methods. 2017;14:687–690. doi: 10.1038/nmeth.4324. [DOI] [PubMed] [Google Scholar]
- Quinlan AR, Hall IM. BEDTools: a flexible suite of utilities for comparing genomic features. Bioinformatics. 2010;26:841–842. doi: 10.1093/bioinformatics/btq033. [DOI] [PMC free article] [PubMed] [Google Scholar]
- Sanvitale CE, Kerr G, Chaikuad A, Ramel M-C, Mohedas AH, Reichert S, Wang Y, Triffitt JT, Cuny GD, Yu PB, Hill CS, Bullock AN. A new class of small molecule inhibitor of BMP signaling. PLOS ONE. 2013;8:e62721. doi: 10.1371/journal.pone.0062721. [DOI] [PMC free article] [PubMed] [Google Scholar]
- Shafer MER, Nguyen AHT, Tremblay M, Viala S, Béland M, Bertos NR, Park M, Bouchard M. Lineage Specification from Prostate Progenitor Cells Requires Gata3-Dependent Mitotic Spindle Orientation. Stem Cell Reports. 2017;8:1018–1031. doi: 10.1016/j.stemcr.2017.02.004. [DOI] [PMC free article] [PubMed] [Google Scholar]
- Signer RA, Morrison SJ. Mechanisms that regulate stem cell aging and life span. Cell Stem Cell. 2013;12:152–165. doi: 10.1016/j.stem.2013.01.001. [DOI] [PMC free article] [PubMed] [Google Scholar]
- Suzuki A, Itami S, Ohishi M, Hamada K, Inoue T, Komazawa N, Senoo H, Sasaki T, Takeda J, Manabe M, Mak TW, Nakano T. Keratinocyte-specific pten deficiency results in Epidermal Hyperplasia, accelerated hair follicle morphogenesis and tumor formation. Cancer Research. 2003;63:674–681. [PubMed] [Google Scholar]
- Tadokoro T, Gao X, Hong CC, Hotten D, Hogan BL. BMP signaling and cellular dynamics during regeneration of airway epithelium from basal progenitors. Development. 2016;143:764–773. doi: 10.1242/dev.126656. [DOI] [PMC free article] [PubMed] [Google Scholar]
- Tian A, Jiang J. Intestinal epithelium-derived BMP controls stem cell self-renewal in Drosophila adult midgut. eLife. 2014;3:e01857. doi: 10.7554/eLife.01857. [DOI] [PMC free article] [PubMed] [Google Scholar]
- Toivanen R, Mohan A, Shen MM. Basal progenitors contribute to repair of the prostate epithelium following induced luminal anoikis. Stem Cell Reports. 2016;6:660–667. doi: 10.1016/j.stemcr.2016.03.007. [DOI] [PMC free article] [PubMed] [Google Scholar]
- Tomasetti C, Vogelstein B. Variation in cancer risk among tissues can be explained by the number of stem cell divisions. Science. 2015;347:78–81. doi: 10.1126/science.1260825. [DOI] [PMC free article] [PubMed] [Google Scholar]
- Tremblay M, Sanchez-Ferras O, Bouchard M. GATA transcription factors in development and disease. Development. 2018;145:dev164384. doi: 10.1242/dev.164384. [DOI] [PubMed] [Google Scholar]
- Trotman LC, Niki M, Dotan ZA, Koutcher JA, Di Cristofano A, Xiao A, Khoo AS, Roy-Burman P, Greenberg NM, Van Dyke T, Cordon-Cardo C, Pandolfi PP. Pten dose dictates Cancer progression in the prostate. PLOS Biology. 2003;1:e59. doi: 10.1371/journal.pbio.0000059. [DOI] [PMC free article] [PubMed] [Google Scholar]
- Van Keymeulen A, Rocha AS, Ousset M, Beck B, Bouvencourt G, Rock J, Sharma N, Dekoninck S, Blanpain C. Distinct stem cells contribute to mammary gland development and maintenance. Nature. 2011;479:189–193. doi: 10.1038/nature10573. [DOI] [PubMed] [Google Scholar]
- Wang S, Gao J, Lei Q, Rozengurt N, Pritchard C, Jiao J, Thomas GV, Li G, Roy-Burman P, Nelson PS, Liu X, Wu H. Prostate-specific deletion of the murine pten tumor suppressor gene leads to metastatic prostate Cancer. Cancer Cell. 2003;4:209–221. doi: 10.1016/S1535-6108(03)00215-0. [DOI] [PubMed] [Google Scholar]
- Wang X, Kruithof-de Julio M, Economides KD, Walker D, Yu H, Halili MV, Hu YP, Price SM, Abate-Shen C, Shen MM. A luminal epithelial stem cell that is a cell of origin for prostate Cancer. Nature. 2009;461:495–500. doi: 10.1038/nature08361. [DOI] [PMC free article] [PubMed] [Google Scholar]
- Wang ZA, Mitrofanova A, Bergren SK, Abate-Shen C, Cardiff RD, Califano A, Shen MM. Lineage analysis of basal epithelial cells reveals their unexpected plasticity and supports a cell-of-origin model for prostate cancer heterogeneity. Nature Cell Biology. 2013;15:274–283. doi: 10.1038/ncb2697. [DOI] [PMC free article] [PubMed] [Google Scholar]
- Wang J, Zhu HH, Chu M, Liu Y, Zhang C, Liu G, Yang X, Yang R, Gao WQ. Symmetrical and asymmetrical division analysis provides evidence for a hierarchy of prostate epithelial cell lineages. Nature Communications. 2014a;5:4758. doi: 10.1038/ncomms5758. [DOI] [PubMed] [Google Scholar]
- Wang ZA, Toivanen R, Bergren SK, Chambon P, Shen MM. Luminal cells are favored as the cell of origin for prostate Cancer. Cell Reports. 2014b;8:1339–1346. doi: 10.1016/j.celrep.2014.08.002. [DOI] [PMC free article] [PubMed] [Google Scholar]
- Wood KH, Johnson BS, Welsh SA, Lee JY, Cui Y, Krizman E, Brodkin ES, Blendy JA, Robinson MB, Bartolomei MS, Zhou Z. Tagging methyl-CpG-binding domain proteins reveals different spatiotemporal expression and supports distinct functions. Epigenomics. 2016;8:455–473. doi: 10.2217/epi-2015-0004. [DOI] [PMC free article] [PubMed] [Google Scholar]
- Wu X, Wu J, Huang J, Powell WC, Zhang J, Matusik RJ, Sangiorgi FO, Maxson RE, Sucov HM, Roy-Burman P. Generation of a prostate epithelial cell-specific cre transgenic mouse model for tissue-specific gene ablation. Mechanisms of Development. 2001;101:61–69. doi: 10.1016/S0925-4773(00)00551-7. [DOI] [PubMed] [Google Scholar]
- Wu X, Xu K, Zhang L, Deng Y, Lee P, Shapiro E, Monaco M, Makarenkova HP, Li J, Lepor H, Grishina I. Differentiation of the ductal epithelium and smooth muscle in the prostate gland are regulated by the notch/PTEN-dependent mechanism. Developmental Biology. 2011;356:337–349. doi: 10.1016/j.ydbio.2011.05.659. [DOI] [PMC free article] [PubMed] [Google Scholar]
- Xiao L, Feng Q, Zhang Z, Wang F, Lydon JP, Ittmann MM, Xin L, Mitsiades N, He B. The essential role of GATA transcription factors in adult murine prostate. Oncotarget. 2016;7:47891–47903. doi: 10.18632/oncotarget.10294. [DOI] [PMC free article] [PubMed] [Google Scholar]
- Xin L, Ide H, Kim Y, Dubey P, Witte ON. In vivo regeneration of murine prostate from dissociated cell populations of postnatal epithelia and urogenital sinus mesenchyme. PNAS. 2003;100 Suppl 1:11896–11903. doi: 10.1073/pnas.1734139100. [DOI] [PMC free article] [PubMed] [Google Scholar]
- Zhao W, Zhu Q, Tan P, Ajibade A, Long T, Long W, Li Q, Liu P, Ning B, Wang HY, Wang RF. Tgfbr2 inactivation facilitates cellular plasticity and development of Pten-null prostate Cancer. Journal of Molecular Cell Biology. 2018;10:316–330. doi: 10.1093/jmcb/mjx052. [DOI] [PMC free article] [PubMed] [Google Scholar]


