

Abstract
High-throughput 3′ single-cell RNA-Sequencing (scRNA-seq) allows for cost-effective, detailed characterization of individual immune cells from tissues. Current techniques, however, are limited in their ability to elucidate essential immune cell features, including variable sequences of T cell antigen receptors (TCRs) that confer antigen specificity. Here, we present a strategy that enables simultaneous analysis of TCR sequences and corresponding full transcriptomes from 3′ barcoded scRNA-seq samples. This approach is compatible with common 3′ scRNA-seq methods, and adaptable to processed samples post hoc. We applied the technique to identify transcriptional signatures associated with T cells sharing common TCRs from immunized mice and from food allergy patients. We observed preferential phenotypes among subsets of expanded clonotypes, including type 2 helper CD4+ T cell (TH2) states associated with food allergy. These results demonstrate the utility of our method when studying diseases in which clonotype-driven responses are critical to understanding the underlying biology.
Antigen-specific T cells play key roles in a number of diseases including autoimmune disorders and cancer1–3. Assessing the phenotypes and functions of these cells is essential to both understanding underlying disease biology and designing new therapeutic modalities4,5. To study antigen-specific T cells comprehensively, two sequencing-based approaches have emerged: bulk genomic sequencing of T cell antigen receptor (TCR) gene repertoires to assess clonal diversity; and RNA-sequencing (RNA-seq) to reveal phenotypic attributes. The TCR recognizes antigenic peptides bound in major histocompatibility complex (MHC) receptors and mediates CD3-dependent signaling upon cognate recognition; sequencing of the TCR repertoire thus can highlight clonotypic diversity and the dynamics of antigen-dependent responses associated with disease, such as clonal expansion or selection2,6,7. RNA-seq, in contrast, can reveal novel states and functions of disease-relevant T cells through unique patterns of gene expression, albeit without determination of whether those cells are recognizing common antigens8–10.
Coupling these two types of data is of great interest for modeling the dynamics of T cell responses and isolating those cells most relevant to disease states11–13. Currently, the preferred method for linking these measures relies on sorting single T cells into multi-well plates by flow cytometry, performing full-length scRNA-seq, and then reconstructing the sequences of rearranged TCRα and TCRβ genes. This strategy is limited in throughput (~10–1,000 cells) by cost, labor and time6,14,15. Recently developed high-throughput scRNA-seq methods can profile the transcriptomes of 103–105 single cells at once, but accomplish this task by first barcoding mRNAs on their 3′ ends during reverse transcription followed by quantification of gene expression by sequencing only those 3′ ends16–18. While sufficient to enumerate mRNA abundances, this process hinders precise, direct sequencing of recombined TCR genes because the variable regions of those transcripts—particularly the complementarity-determining region 3 (CDR3) regions closer to the 5′ end of those mRNAs—are not captured efficiently by 3′ library preparation and sequencing protocols9. Primer-based approaches that target constant regions of the TCR transcripts to directly enrich CDR3 sequences eliminate reverse-transcription-appended cellular barcodes and unique molecular identifiers (UMIs) positioned on the 3′ ends of transcripts during amplification, and thus obscure the single-cell resolution of the data.
New approaches have emerged to determine clonotypes from high-throughput 3′ or 5′ scRNA-seq libraries. These typically rely on specialized RNA-capture reagents (e.g., the customized TCR transcript capture beads of DART-seq or specific kits for InDrop, Dolomite and 10X), limiting their adoption and application to previously archived samples. Some also require combinations of different sequencing technologies (e.g., Illumina and Nanopore in RAGE-seq), complicating their implementation11,19–23. Methods that allow for cost-efficient and simple recovery of TCR sequences from 3′ scRNA-seq libraries would enable the study of clonotypic T cell responses with confidence.
RESULTS
TCR CDR3 sequences recovered via targeted sequencing
Here, we report a simple process to sequence concomitantly both the transcriptome and TCR and TCR sequences of T cells from a single sequencing library generated using a massively-parallel 3′ scRNA-seq platform, such as Seq-Well or Drop-seq (Fig. 1). Our approach both overcomes the 3′ bias and maintains the single-cell resolution in the sequencing library introduced by these platforms (Supplementary Fig. 1a,b). In our approach, a 3′ barcoded whole transcriptome amplification (WTA) is performed using standard protocols for Seq-Well or Drop-seq16,18,24. Next, one fraction of the amplified product is used to generate a 3′ scRNA-seq library to quantify single-cell mRNA expression levels in individual cells; another is used to perform direct single-cell sequencing of TCRα and TCRβ transcripts. For the latter, TCRα and TCRβ transcripts contained within amplified 3′ barcoded WTA products are first enriched by affinity capture using biotinylated oligonucleotide-probes targeting sequences encoding the TCR constant regions, and are then re-amplified with the same universal primer site (UPS) used in the original WTA (Supplementary Table 1,2). This step yields up to a 104-fold enrichment of TCR-encoding fragments, as determined by qPCR (Supplementary Fig. 1c). Next, the amplified pool is selectively modified by primer extension using a set of oligonucleotides comprising a shared 5′ second universal primer site (UPS2) linked to regions specific for each TCRα or TCRβ Variable (V) -region (Supplementary Table 3). The modified products are then further amplified with primers specific for UPS2 and an extended version of the original UPS, which is only present on the 3′ end of the library. This final amplification adds flanking regions of oligonucleotides for sequencing to the TCR-enriched library (Supplementary Table 2). The combination of targeted enrichment and primer extension produces a size-defined, CDR3-enriched library that does not require additional fragmentation before short-read sequencing (e.g., Illumina). The resulting library can then be sequenced using custom primers targeting the constant regions of the TCR genes to directly recover the CDR3 region (Fig. 1 and Supplementary Table 4). This approach produces high-quality coverage of the CDR3 region as well as the original cellular and molecular identifiers appended during WTA, making it possible to match TCR sequences computationally with the corresponding whole transcriptome profiles determined using traditional 3′ scRNA-seq (Supplementary Fig. 1d).
Fig. 1|. Strategy for TCR recovery from 3′ barcoded single-cell sequencing libraries.
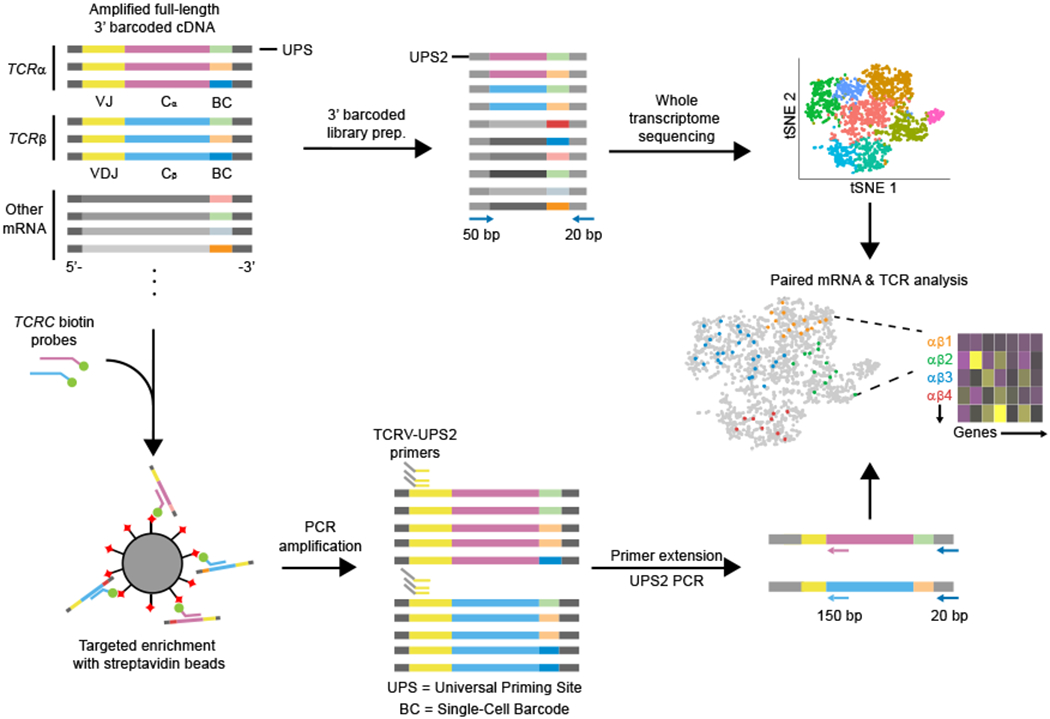
Barcoded cDNA libraries (WTA products) including TCRα and TCRβ transcripts in addition to other transcripts (top). Fragmentation and selective amplification of cDNA results in sequencing library used for transcriptomic sequencing, and analyzed via 3′ gene mapping as previously described18. TCR enrichment of same cDNA library through affinity capture with biotinylated oligonucleotides results in produces amplified products enriched in TCRα and β transcripts. Sequencing library is made by primer extension with V-region primer sets followed by PCR amplification using the UPS2 handles (bottom). The CDR3 region is sequenced using Illumina MiSeq with custom sequencing primers, and merged with the transcriptomic data based on single-cell barcodes.
Paired Tcra and Tcrb sequences recovered from OT-I T cells
To test the sensitivity of our approach, we enriched TCR transcripts from Seq-Well WTA products derived from mouse splenic T cells spiked with T cells from an OT-I transgenic Rag1+/+Rag2+/+ mouse (0.01-10%). We recovered Tcra 25+/−3%) and Tcrb (65+/−4%) CDR3 sequences from cells detected in our whole transcriptome data (n = 4 samples). Both chains were recovered for 20 +/− 3% of cells—similar to the predicted rate of recovery, assuming the capture of each transcript is an independent event (16+/−7%; Supplementary Fig. 2a). Mapped Tcr sequences coincided with expression of T cell markers, such as Cd3e (Supplementary Fig. 2b). Sequences sharing the same UMI also had high degree of sequence consensus (Supplementary Fig. 2c; Methods). The proportion of OT-I CDR3 sequences recovered in each sample was consistent with expectations (Fig. 2a). Cells with an OT-I Tcra chain almost exclusively matched to the expected OT-I Tcrb chain (97.7%; 33/34 cells); cells with OT-I Tcrb chains, meanwhile, primarily matched with the expected OT-I Tcra chain (70.5%; 33/45), though not exclusively (Fig. 2b). These results are similar to previous studies, wherein Rag1+/+Rag2+/+ OT-I T cells were observed to produce functional TCRα chains in addition to the OT-I TCRα chain25.
Fig. 2|. Recovery of OT-I Tcra and Tcrb CDR3s.
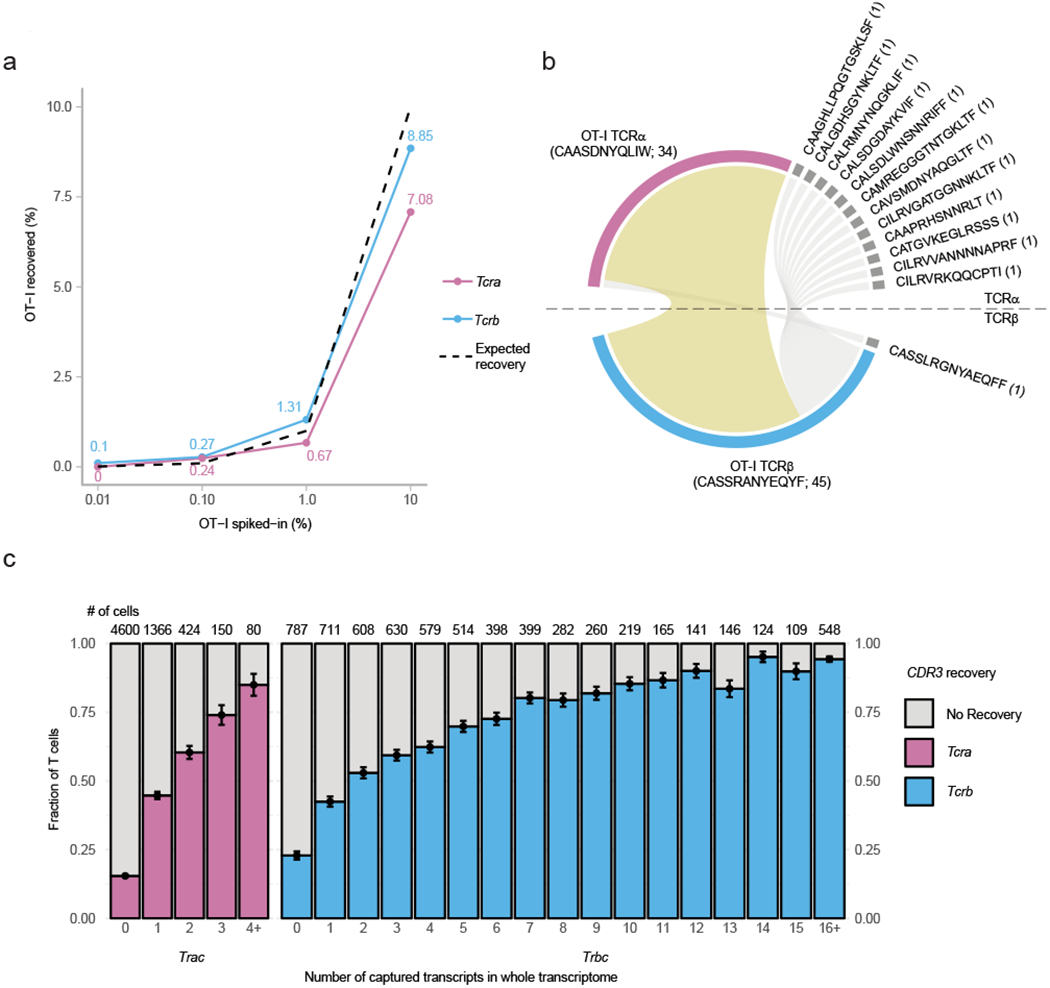
a, Proportions of recovered OT-I Tcra and Tcrb sequences from murine samples spiked-in with 10%, 1%, 0.1%, and 0.01% OT-I Rag1+/+Rag2+/+ T cells. Dash line indicates expected recovered proportions. b, Pairing of recovered OT-I Tcra and Tcrb chain from cells in all spiked-in libraries with either OT-1 Tcra or Tcrb chain sequences. Number of detected cells indicated in parenthesis. Yellow band indicates pairing of OT-I Tcra and Tcrb sequences from recovered cells. c, Proportion of T cells with successful CDR3 recovery (y-axis) as a function of the constant region mapping via scRNA-Seq by Seq-Well (x-axis). Number of cells with the corresponding number TCR constant region transcripts within their 3′ scRNA-Seq data are indicated above the respective column. Error bar indicates standard deviation of estimated binomial distribution.
CDR3 recovery correlates with abundance of TCR transcripts
We next assessed the relationship between the fraction of cells expressing TCR transcripts in their whole transcriptome data (based on TCR constant region mapping) and the percentage of CDR3’s recovered from the same cells (Fig. 2c). We observed a high correlation: cells with more copies of TCR transcripts in their whole transcriptome data yielded higher rates of CDR3 recovery from the TCR-targeted libraries (Tcra: rs = 1, n = 5, P value =0.017 by Spearman; Tcrb: rs = 1, n = 15, P value < 10−6 by Spearman). Overall, excluding classified T cells with no detected TCR genes in their transcriptomic data, we recovered CDR3 from an average of 70+/−4% of cells, and CDR3 from 52+/−3%, resulting in combined pairings of Tcra and Tcrb sequences for 40+/−4% of T cells (Supplementary Fig. 2a). Finally, we investigated the reproducibility of our approach by comparing technical replicates of the TCR-targeted libraries produced from the same starting WTA material. Across replicates, 94% of detected cellular barcodes were the same, and 99.7% of detected shared transcripts (12,849 out of 12,883) resulted in identical assignment of clonotypes (Supplementary Table 5). Taken together, our results show the method allows consistent and reproducible recovery of CDR3 sequences with high yields.
TCR recovery reveals clonal expansion in immunized mice
Antigen-specific T cells are often enumerated by flow cytometry using tetrameric reagents comprising known antigenic peptides bound to recombinant MHC molecules. The same peptide-MHC complex, however, can select multiple T cell clonotypes26. This intrinsic multiplicity can obscure the underlying relationships between phenotypic states and associated clonotypes. We sought to resolve the clonotypic diversity of tetramer-sorted T cells by applying our approach to murine T cells specific to a canonical envelope antigen (E7) from human papilloma virus (HPV16). After immunization and challenge, splenocytes were harvested from mice. Half of the splenocytes were stimulated ex vivo with E7 antigen for six hours, and half of the cells were not (Methods). E7 tetramer+ CD8+ T cells were then sorted from both groups of splenocytes (Supplementary Fig. 3a). These cells were prepared for scRNA-seq using Seq-Well, and their TCR CDR3s were recovered (Supplementary Fig. 3b). In total, 14,424 cells from across four mice were included in the study. We found a diverse set of clonal, expanded T cells within the tetramer-sorted populations isolated from individual animals (Supplementary Table 6). For each animal, the 20 most expanded Tcrb clones accounted for 69% to 89% of recovered T cells (mean = 908+/−332 cells; Supplementary Fig. 3c). Between 77% to 90% of the recovered T cells had clonal Tcrb chains. In total, over 900 unique Tcra and 1200 Tcrb clonotypes were detected.
We next analyzed the clonality of these cells with respect to their whole transcriptomes (Fig. 3a,b and Supplementary Fig. 3d,e). The majority of stimulated cells were transcriptionally distinct from unstimulated cells isolated directly ex vivo (Extended Data 1a). Computationally-determined clusters of cells (PCA followed by tSNE visualization; Methods) were preferentially enriched for either unstimulated or stimulated cells; only cluster 5 contained nearly equal portions of both (Extended Data 1b). The degree of expansion observed among the clonotypes—that is, the number of cells sharing the same clonotype in the dataset—associated strongly with phenotypic clusters of T cells determined based on scRNA-Seq (Fig. 3b). The most expanded clonotypes were observed in clusters 0 through 4. These clusters were enriched (compared to cluster 5) in genes associated with cytotoxic effector functions such as Gzmb and Id2. The least expanded clonotypes were concentrated in cluster 5, and were characterized by enrichments for genes encoding naïve or central memory markers, such as Ccr7 and Sell27 (compared to clusters 0-4) (Fig. 3b and Supplementary Fig. 3f). This association between the degree of clonal expansion and T cell activation affirms common principles of antigen-dependent activation among T cells28.
Fig. 3|. scRNA-Seq and TCR analysis of HPV-E7 immunized mice.
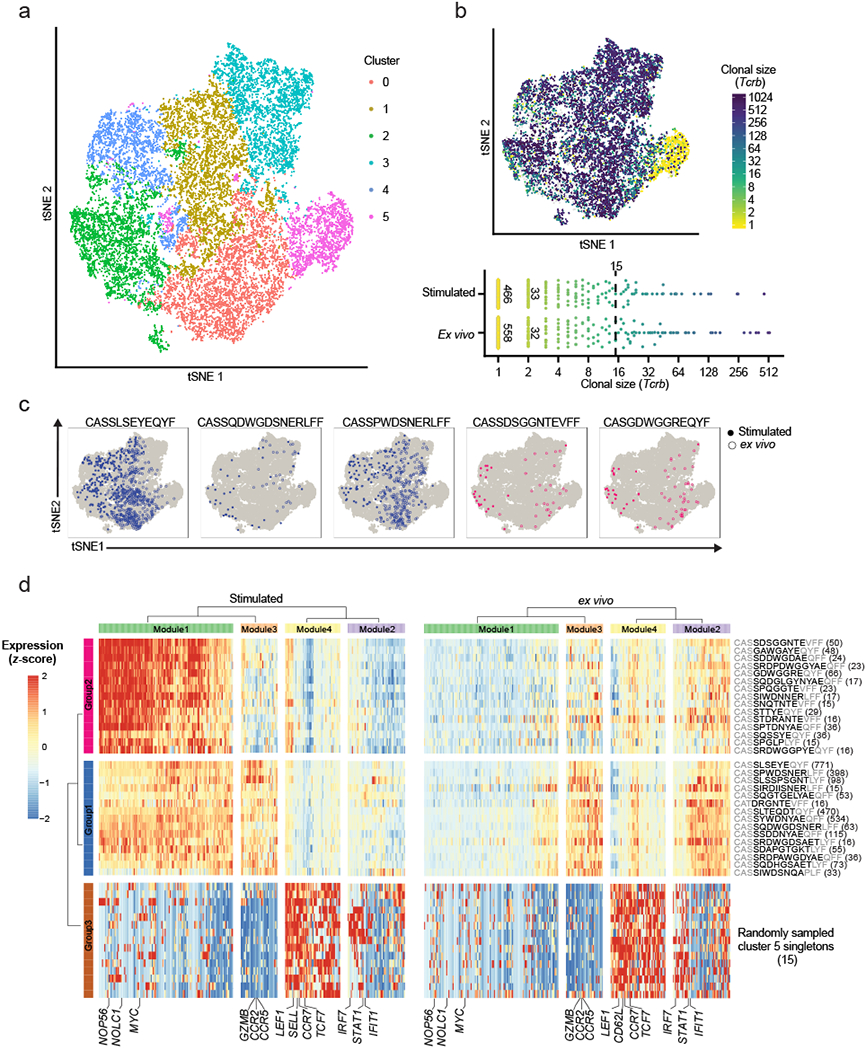
a, tSNE visualization of all cells colored by computationally determined clusters based on transcriptomic data (n = 14,424 cells). b, (top) Clonal size of Tcrb chain mapped on tSNE visualization of scRNA-Seq results. Cells are colored by the clonal size of their detected Tcrb clonotype. Clonal size is defined as the number of cells that share the particular clonotype. (bottom) Distribution of differentially expanded clonotypes between the stimulated and ex vivo conditions. Each colored circle indicates a unique clonotype. c, Example mappings of selected clonotypes from Group 1 (blue) and 2 (magenta) shown in d on tSNE visualization of all cells. d, Heatmaps of differentially expressed genes amongst the expanded clonotypes (>=15 cells) and 15 randomly sampled non-expanded cells (singletons) from Cluster 5 (see a) between the ex vivo and antigen-stimulated conditions. Gene expression represent scaled averages within cells of the same clonotype across the two conditions. Number of cells shown in parenthesis. Data represent combined data from four independent experiments of four mice total (a-d).
Stimulated cells show clonotype-associated transcriptional profiles
To further investigate transcriptomic differences between the expanded clonotypes, we filtered the data to expanded clonotypes (detected in at least 15 cells) that were shared between the stimulated and the ex vivo groups (Fig. 3b–d). We also included 15 randomly sampled singletons (i.e. clonotypes that were only detected once in the dataset) from the naïve cluster (cluster 5) in each stimulation condition as a point of comparison. We examined the gene expression among these clonotypes ex vivo and after antigenic stimulation (Fig. 3d). We observed three groups of clonotypes associated with four modules of differentially expressed genes. Unsurprisingly, by comparing to annotated gene sets (MsigDb; Methods), we found that the sampled singletons (group 3) associated with a set of naïve and central memory T cell-related genes (e.g. Sell, Ccr7; Module 4) across both ex vivo and stimulated conditions27. We also observed another group (group 2) of clonotypes that strongly upregulated cell-cycle related genes, characterized by Myc and Myc-targeted genes (module 1). The last group of clonotypes (group 1) exhibited higher expression of canonical cytotoxic effector markers such as Gzmb, Ccr2, and Ccr5 (module 3), but only moderately upregulated genes in module 1 upon stimulation27 (Fig. 3d and Extended Data 1c). These observed signatures were also consistent with previously published signatures of effector CD8+ T cells29 (Supplementary Fig. 3g).
While module 2 and module 3 were both associated with phenotypes of effector T cells, module 2 contained markers of cytokine signaling and interferon response such as Irf7 and Ifit1, as opposed to the cytotoxic markers in module 3 (Fig. 3d). Module 2 was accordingly enriched in cytokine-mediated signaling signatures, while module 3 was enriched in cell motility signatures (Supplementary Fig. 3h). Module 3 was differentially expressed between group 1 and group 2 of clonotypes, but module 2 was upregulated directly ex vivo for both groups of clonotypes. Downregulation of module 2 upon stimulation may represent a transcriptional response to TCR-dependent activation30. We also note that group 1 clonotypes were also significantly more expanded than group 2 clonotypes, suggesting that the two groups of clonotypes may have experienced different levels of activation and expansion in vivo (P value < 0.001 by Mann-Whitney U test; Extended Data 2b). Overall, the clonotypes within groups 1 and 2 responded similarly upon exposure to antigens. That is, similar genes were up- or down-regulated upon stimulation in both groups (Extended Data 2b). The two groups of clonotypes differed, however, in the magnitude of transcriptional changes, particularly for genes in module 1 (Myc-related genes), and in the expression of genes in module 3 (cytotoxic-associated genes) (Fig. 3d; Extended Data 3c). Together, these results highlight how our method can further reveal clonotype-specific transcriptional responses not delineated by scRNA-seq alone.
Public clonotypes exhibit similar CDR3 sequences
We next investigated public clones that were shared among the four animals. We detected 76 unique Tcrb sequences shared in at least two of the four animals (Extended Data 3a). We focused our analysis on the 21 clonotypes detected in at least three of the four mice (Supplementary Table 7). Amongst the public clones, we observed five sequences across mice that exhibited clear convergence, wherein only two amino acid residues (7th and 8th residues) varied across the CDR3s (Extended Data 3b). Among these, Leu-Gly account of 70% of cells, Ser/Ala/Gly-Gly for 20%, and a shortened Asp-only sequence the remaining 10%. Analysis of shared CDR3 s revealed variable pairing with CDR3 sequences both within and across mice, but several identical pairings were observed in multiple animals (Extended Data 3c). The most common CDR3 (CASSQDLGNYAEQFF) and its two distinct CDR3 partners (CAMREGLMATGGNNKLTF and CAVSNSGGSNYKLTF) were present in the same cells in three of the four animals (n = 225 cells; Extended Data 3c and Supplementary Table 8). These data suggest that these cells may possess dual functional TCRα chains, a molecular feature that may play an important role in infection-induced autoimmunity14,15,31.
Clonally expanded T cells detected in peanut-allergic patients
We next adapted the technique for use with human antigen-reactive CD4+ T cells. Antigen-specific MHC-tetramers are often not available for human T cells, making identification of disease-relevant T cells difficult compared to standard inbred mouse models. Instead, it is common to use either proliferation or expression of proteins associated with antigen-dependent activation (e.g., CD154) as a proxy for response to disease-relevant antigens32,33. We applied our approach to profile T cells isolated from patients with peanut allergy—a type 1 hypersensitivity condition linked to dysregulation of CD4+ T cells34. Peripheral blood mononuclear cells (PBMCs) from four patients were incubated overnight with peanut antigens and then sorted for CD154+ expression to enrich antigen-activated cells32,33 (Supplementary Fig. 4a and Supplementary Table 9; Methods). Single-cell RNA-Seq was then performed on the sorted cells via Seq-Well, and the corresponding TCR sequences were recovered (Supplementary Fig. 4b–d and Supplementary Table 10). We note that there were differences observed in the gene expression of cells from different patients, even after controlling for technical sources of variation (i.e. sequencing depth, mitochondrial content; Methods). The differences observed were due in part to varied expression of a number of genes associated with basal cellular functions, including sex-linked genes (XIST and RPS4Y1) that were upregulated in cells from female and male subjects, respectively (Supplementary Fig. 4e and Supplementary Table 9). Overall, 2,712 cells from four patients were included in the analysis. Contrary to what was observed for the tetramer-sorted mouse cells, the majority of the human CD154+ T cells were not clonal (mean = 75+/−12%). One of the patients (patient 77) exhibited a substantial expansion of T cells sharing common TCR sequences relative to the others (All patients: Supplementary Fig. 4b,c; patient 77: Fig. 4a). These clonally expanded T cells expressed genes associated with activation, such as CD154, CD69 and TNFRSF4, as well as GATA3, a transcription factor associated with TH2 cells32,35. In contrast, the non-expanded cells exhibited genes associated with central memory or naïve cells including CCR7, SELL and LEF136,37(Fig. 4b). Composite scores of known signatures of CD4+ T cell subtypes confirmed an enrichment of TH2 signature in some of the expanded T cells38 (Supplementary Fig. 4f).
Fig. 4|. ScRNA-Seq and TCR analysis of peanut-dependent activated T cells from one of the peanut-allergic individuals (patient 77) combined with pseudotemporal analysis.
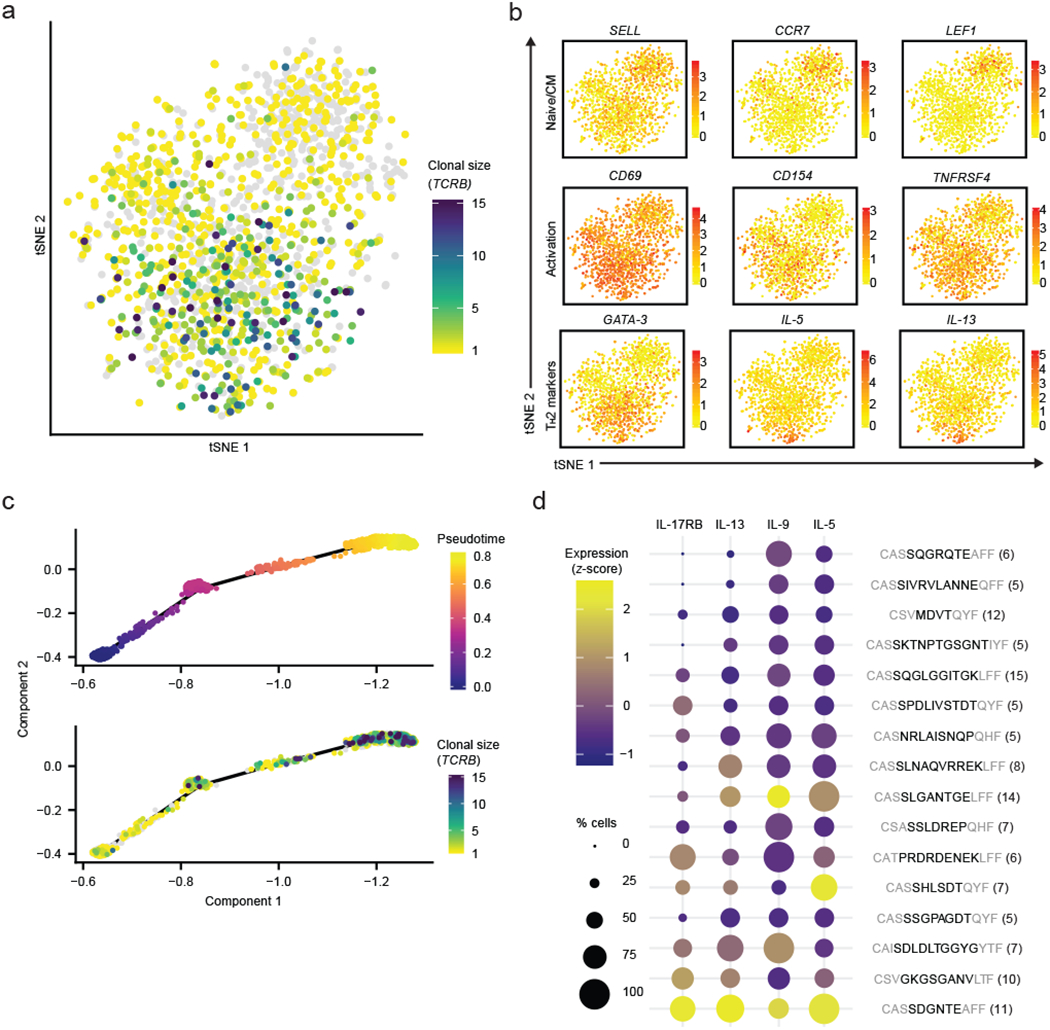
a, Clonal size of TCRB clonotypes mapped onto tSNE visualization of transcriptomic data (n = 1,496 cells). b, Expression of canonical markers associated with naive/central memory, T cell activation, and TH2 phenotypes. Color indicates log-normalized gene expression (yellow to red). c, (top) Pseudotime trajectory of scRNA-Seq results with (bottom) TCRB clonal size mapped. d, TH2 pathogenic markers expression amongst expanded (n>=5 cells per clonotype, resulting in 16 total clonotypes included) TCRB clonotypes with high pseudotime value (mean > 0.4, see Extended Data 5b). Gene expression represent averages within each clonotype group and scaled across all groups. Structural amino acids shown in grey. Number of cells shown in parenthesis. Color indicates scaled and log-normalized gene expression (purple to yellow).
Expanded clonotypes exhibit varied expression of TH2 genes
To examine whether these heterogeneous T cells from patient 77 might represent a spectrum of activation states, we next performed pseudotemporal analysis that showed a trajectory correlated with the degree of T cell stimulation, marked by increased expression of JUN, FOS, NFKB and CD154, among others32,39 (Extended Data 4). Genes associated with early pseudotime were enriched in canonical markers for naïve T cells; while genes associated with late pseudotime were enriched in markers for effector T cells (Extended Data 5a). The T cells most associated with activation on the trajectory were also the most clonally expanded (rs = 0.39, n = 851, P value < 0.001 by Spearman; Fig. 4c). Further, our pseudotemporal trajectory correlated strongly with expression of IL-5, IL-9, IL-13 and IL-17RB, known to encode markers of pathogenic TH2 cells34,35 (Extended Data 4, cluster 1). From these data, we posit that clonotypes that are both expanded and located towards the end of the trajectory may enumerate activated peanut-specific T cells. Among such cells, a subset of clonotypes exhibited TH2 functional signatures (Fig. 4d). In particular, only one clonotype (CASSDGNTEAFF) had high expression for all four TH2 markers, suggesting a robust polyfunctionality that may represent a highly differentiated TH2-polarized clone involved in the allergic state of the individual40,41. Although the majority of expanded clonotypes were located at the end of the pseudotime trajectory, we noted some clonotypes showed higher variation in phenotypic states than others (Extended Data 5b). It is possible that other factors may also contribute to the observed cell state and expansion of these T cells, such as transcriptional pulsing or bystander activation42–44. Taken together, our data suggest that our method can resolve differential degrees of antigen-dependent activation among clonotypes from human T cells and potentially highlight clonotypes among enriched pools of activated T cells that are most relevant to a disease state of interest.
Discussion
Our approach allows for the reliable recovery of TCR CDR3s from 3′ barcoded scRNA-Seq samples generated by Seq-Well or related common massively-parallel 3′ scRNA-seq methods, such as Drop-seq. With minor modifications, our method should adapt to other 3′-based sequencing methods. We recapitulated pairings of known Tcra and Tcrb chains in transgenic murine models, and found transcriptomic signatures that were associated with clonally-expanded T cells bearing the same TCRs in both murine and human samples. We note there was a distinct difference in the magnitude of clonal expansion observed between the murine and human samples. This observed variation likely reflects both the difference in methods used for enrichment of antigen-reactive T cells (MHC-tetramer staining vs CD154 enrichment) and in the history of antigen exposure in vivo (immunization vs peanut-avoidance).
Our method relies on simple and inexpensive reagents that are widely available and can be used to sequence the variable regions of TCRs for both new and pre-existing whole transcriptome amplified products. As such, our method is also compatible with other multiplex, high-throughput scRNA-seq techniques, such as antibody-based cell hashing45. Future experiments combining the approach we present here with other technologies, such as germline genomic barcoding, should allow further mechanistic studies of TCR clonotypic responses. Such strategies could further illuminate the degree to which TCR sequence (i.e. shared antigen-recognition) versus clonotypic identity (i.e. cell lineage) shape the trajectories of phenotypes accessible in health and disease46.
In addition to its simplicity, our approach also targets sequencing reads to the CDR3 region of the transcripts, allowing for deep sequencing of clonotypes with high efficiency using ubiquitous, high accuracy short-read sequencing technologies. Because our method does not rely on amplification with multiplexed primer pools (used for a single extension to append UPS2), it minimizes amplification bias and artifacts introduced by these primers, maximizing the complexity and efficiency of the sequencing pools4,47. Similarly, since it relies on a universal primer element for PCR amplification (UPS2 and a modified UPS), the method simplifies adaptation to other model species, such as non-human primates, by minimizing the need for additional optimization with new multiplex pools of primers. Finally, we foresee that our general approach can also be used for other targets where isoform information is paramount, such as identification of CD45RA or CD45RO in T cells48.
Nonetheless, there are currently two practical limitations. First, the innate efficiency of capturing mRNA using available reagents (i.e. 3′ barcoded beads for Seq-Well and Drop-seq) limits the maximum potential representation (and thus recovery) of TCRs in libraries. Currently, for Drop-seq, it is estimated that the barcoded beads capture 10-12% of available transcripts16. Improved quality of these reagents or the molecular biology used to generate WTA products will likely address this limitation24. Second, due to the incorporation of V-region primers, the method presently does not recover full-length TCR transcripts, and therefore our analysis is restricted to the CDR3 region. The CDR3 region contains the majority of variability in TCR transcripts, and therefore, is likely sufficient for assessing clonal expansion and clonal tracking analysis47. Further, the design of the V-region primers depends on adequate annotation of V-genes, which may not be available for less characterized model species. Though we expect characterization of V-genes in many species to improve in the future, approaches using 5′ scRNA-seq can employ constant-region primers, thus circumventing the need for V-region primers all together. For these 5′ cellular barcoding approaches, our methodology, modified to use baits targeting TCR constant regions, could potentially aid in more efficient TCR characterization.
In summary, we have developed a simple approach to recover TCR CDR3 sequences from whole transcriptome libraries produced by common high-throughput scRNA-seq techniques that rely on 3′ barcoding of transcripts. We found the technique reliable and also high yielding, limited by the efficiency of initial capture of mRNA. Our approach can map murine and human antigen-reactive T cells, and in principle, is extensible to other species (e.g., non-human primates) and target genes of interest (e.g., viral antigens, isoforms, germline and somatic variations of B cell receptors). Extension of this technique should be feasible so long as the targeted variable regions are flanked by suitable known sequences. Overall, our data demonstrated that enhancing the resolution of these populations of cells by the combined recovery of TCRs and scRNA-seq can further reveal phenotypic variations that emerge as a function of clonotype and reveal convergent public clones with precision. We anticipate that our method will be especially useful for elucidating the intrinsic heterogeneity among antigen-specific T cells and their roles in immunological diseases such as cancer and autoimmune disorders.
Methods
Mouse splenocyte processing for OT-I spiked-in experiments
Spleens were taken from C57BL/6NTac (Taconic) wild-type (WT) mice and B6 Rag1+/+Rag2+/+ OT-I (C57BL/6-Tg; Jackson) transgenic mice. Mice were male at age of 8-12 weeks. T cells from each spleen were isolated using magnetic bead-based enrichment (StemCell; Cat.No.19751). Cell concentration was estimated by counting on a hemocytometer. Four mixes of WT and OT-I cells were made with 10%, 1%, 0.1%, and 0.01% of OT-I T cells. Each cell mixture was processed via Seq-Well as previously described18. No OT-I Tcra or Tcrb chain was observed in the 0.01% spiked-in sample. The resulting single-cell libraries were sequenced on the Illumina NextSeq 500 as previously described. Part of the constructed libraries were used for TCR recovery as described below. All animal work was conducted under the approval of the Massachusetts Institute of Technology (MIT) Division of Comparative Medicine in accordance with federal, state, and local guidelines (CAC protocol #01717-076-20, #0917-092-20).
Mouse splenocyte processing for HPV-E7 experiment
C57BL/6NTac (Taconic) mice (female, 8 weeks of age) were primed with 100 μg of MSA-E7 and 25 μg of cyclic di-GMP subcutaneously in the tail base (Day 0). The mice were boosted with the same mixture at Day 14, and at Day 20 spleens from the mice were collected. Splenocytes were stimulated for 6 hours with 10 μg/mL of E7 peptide (RAHYNIVTF) in RPMI with 10% FBS. The cells were then stained with anti-CD8-APC (clone 53-6.7; BioLegend) and E7-tetramer-PE (MBL; Cat.No.TB-5008-2) and flow sorted with a FACSAria II instrument (BD Biosciences) for double-positive T cells. The sorted cells were processed via updated version of Seq-Well (Seq-Well S3)24. All animal work was conducted under the approval of the Massachusetts Institute of Technology (MIT) Division of Comparative Medicine in accordance with federal, state, and local guidelines (CAC protocol #01717-076-20, #0917-092-20).
Human subjects
The human subjects in this study were all screened for participation in a peanut oral immunotherapy trial (NCT01750879), and some were included in a high threshold peanut challenge study (NCT02698033), at the Food Allergy Center at Massachusetts General Hospital. All subjects were recruited with informed consent, and the study was approved by the Institutional Review Board of Partners Healthcare (protocol no. 2012P002153) and MIT (protocol no. 1312006071). The participants all had a previous diagnosis of peanut allergy, a history of peanut-induced reactions consistent with immediate hypersensitivity, and confirmatory peanut- and Ara h 2 (a dominant peanut allergen)-specific serum IgE concentrations (> 0.35 kU/l; ImmunoCAP; Thermo Fisher). Blood samples were taken at the time of patient intake, before any treatment of peanut allergy.
Human PBMC processing for allergy samples
PBMCs were isolated from patient blood samples by density gradient centrifugation (Ficoll-Paque Plus; GE Healthcare). Fresh PBMC were cultured in AIM V medium (Gibco) for 20 h with 100 μg/ml peanut protein extract. The peanut extract was prepared by agitating defatted peanut flour (Golden Peanut and Tree Nuts) with PBS, centrifugation, and sterile-filtering. Anti-CD154-PE (clone TRAP1; BD Biosciences) was added to the cultures for the last 3 h. After harvesting, the cells were labeled with anti-CD3-AF700 (clone UCHT1), anti-CD4-APC-Cy7 (RPA-T4), anti-CD45RA-FITC (HI100), anti-CD154-PE (all from BD Biosciences), anti-CD69-AF647 (FN50; BioLegend), and Live/Dead Fixable Violet stain (L34955; Thermo Fisher). Live CD3+CD4+CD45RA− activated CD154+ were sorted with a FACSAria II instrument (BD Biosciences). The sorted cells were processed via Seq-Well18.
Enrichment of TCR transcripts
Enrichment of TCR-encoding transcripts from whole transcriptome amplified (WTA) starting materials was done with the XGen Lockdown reagents (IDT; Cat.No.1072281), with modifications. Biotinylated TCRA-TCRB probes were purchased (IDT Ultramer services; Supplementary Table 1), mixed, and diluted to 1.5 μM each. Up to 3.5 μL of WTA was added to 8.5 μL of xGen 2x hybridization buffer, 2.7 μL of buffer enhancer, 0.8μL of UPS primer (50 μM; Supplementary Table 2), and 0.5 μL of human cot-1 DNA (Invitrogen; Cat.No.15279011). The mixture was incubated at 95°C for 10 min, and 1 μL of diluted TCRC mix was added. The final mixture was then incubated at 65°C for 1 h. Then the remainder of the xGen Lockdown protocol was followed. 50 μL of streptavidin Dynabeads (Invitrogen; Cat.No.65306) was used for each sample. Each sample was eluted into 20 μL of water.
To amplify the TCRA and TCRB transcripts after enrichment, five PCR reactions were done for each enriched sample with the following composition: 2 μL of eluted sample, 2 μL of UPS primer (10 μM), 8.5 μL of water, and 12.5 μL of 2x Kapa Hifi Hotstart Readymix (Kapa Biosystems). The following PCR cycling condition was used: 1 cycle of 95°C for 3 min; 25 cycles of 98°C for 40 s, 67°C for 20 s, 72°C for 1 min; and 1 cycle of 72°C for 5 minThe five reactions were then pooled to a final volume of 100 μL. Products of >1,000bp were purified using homemade purification reagents outlined by Rohland and Reich49. The purified product was eluted into 15 μL of water. Quality of the final product was assessed using fragment analyzer (Advanced Analytical/Agilent).
Construction of TCR sequencing libraries
TCRV-UPS2 primers were purchased13,15 (Eurofin; Supplementary Table 3). Two primers mixes were made (one for TCRB and one for TCRA), and diluted to 10μM each. TCRA and TCRB reaction mixes were made with 4 μL of purified enriched product, 6 μL of water, 2.5 μL of TCRV-UPS2 primer mix (TCRA or TCRB), and 12.5 μL of 2x Kapa Readymix. Primer extension was done with the following condition: 1 cycle of 98°C for 5 min, 1 cycle of 55°C for 30 s, and 1 cycle of 72°C for 2 min. The final product was purified as previously described, and eluted into 11 μL of water.
Complete sequencing handles were added to the final product using the following PCR mix: 0.5 μL of UPS2-N70x primer (10 μM), 0.5 μL of UPS2-N50x primer (10 μM), 9 μL of water, and 12.5 μL of 2x Kapa readymix were added to 2.5 μL of previously eluted products. Four reactions were performed for each sample, using a total of 10 μL of eluted products. Amplification was done using the following cycling condition: 1 cycle of 95°C for 2 min; 12-15 cycles of 95°C for 30 s, 60°C for 30 s, and 72°C for 1.5 min; and 1 cycle of 72°C for 5 min. All four reactions were pooled and purified for products >1000bp as previously described. Final product was assessed using fragment analyzer, and a major peak of around 1100 bp was observed for TCRB product, and 1300 bp for TCRA products. Library concentrations were assessed using the KAPA Library qPCR quantification kit (Kapa Biosystems). A more detailed step-by-step protocol (including example size distributions of successfully amplified samples) will be available on http://shaleklab.com/resources/ and Nature Protocol Exchange.
Conditions for TCR sequencing
TCRA and TCRB libraries were pooled at equimolar concentration. 1-2 nmol of the final library was used to sequencing on the Illumina MiSeq for single-end sequencing. 150 cycles was performed on read 1 using the TCR-specific sequencing primers, and 20 cycles was performed on index 1 using Seq-Well sequencing primer (Supplementary Table 4). Sequencing primers were used at a final concentration of 2.5 μM. We aimed for 8-12 * 106 pass filter reads per lane (cluster density of roughly 450K/mm2). Based on the whole-transcriptome data, we allotted ~6,000 T cells per lane.
Assessment of TCR transcript enrichment
A qPCR assay was used to assess enrichment of TCRA or TCRB transcripts after affinity enrichment. Three rounds of TCR affinity enrichment were performed as described. TaqMan Fast Advanced Master Mix (Applied Biosystems; Cat.No.4444556) was used along with FAM TaqMan primer mixes (TCRA, HS00354482_m1; TCRB, HS01588269_g1; GAPDH, HS02758991_g1). Amplification was done according to manufacturer’s instruction. qPCR was done before and after TCR enrichment, and the difference of crossing point (ΔCp) for TCR and GAPDH was calculated. ΔCp for each the enriched sample was compared to that of the unenriched sample, and the difference was calculated (ΔΔCp). ΔΔCp was used to calculate relative increase in concentration of TCR transcripts after enrichment compared to GAPDH.
Determination of clonotypes from sequencing data
TCR sequencing data was filtered by mapping to the TCR-encoding loci (chromosome TCRB 7 and TCRA 14 for human, and Tcrb 6 and Tcra 14 for mouse). The filtered data was categorized by cell barcodes and unique molecular identifier (UMI). Cell barcodes and UMI with at least 10 filtered reads were kept and the rest were discarded. Each set of reads was then mapped to TCRV and TCRJ IMGT (imgt.org) reference sequences via IgBlast, and mapping to each V and J region was tabulated. The reads were then filtered for “strong plurality,” wherein the ratio of the most frequent V and J calls to the second most frequent calls was calculated, resulting in a possible value of 0.5 to 1. Cell barcodes with top V and J calls with ratio of greater than 0.6 was kept, and the rest was filtered out. Within each cell barcode group, reads with the top V and J calls were then used for CDR3 calling, and a similar ratio was calculated based on the nucleotide sequence (Supplementary Fig. 2c). For CDR3 calling, nucleotides corresponding to the 104-cysteine and 118-phenylalanine were identified according to IMGT references, and amino acid sequences in between the residues were translated. TCR sequences were then matched to single-cell data via the cell barcodes. If multiple TCRα and β chains were detected for a cell barcode, the TCRβ sequences with highest number of UMI and raw reads mapping were kept. Up to two TCRα sequences with the top two highest number of UMI and raw reads mapping were kept. We note that non-functional CDR3s (i.e. CDR3s with stop-codon or out-of-frame sequences) are often a result of initially unsuccessful V(D)J recombination, and are often shared in clonal cells15. As such, non-functional CDR3s were excluded from additional functional phenotype analysis, but used as unique markers for clonal tracking. Read depth and number of UMI recovered for each of the CDR3 for each of the mouse and human samples are shown in Supplementary Fig. 5b,d.
Data analysis for transcriptomic data
Single-cell transcriptomic data was processed using Drop-seq tools (http://mccarrolllab.com/dropseq) as previously described16,18. In brief, barcodes and UMIs were collapsed with a single-base error tolerance. Cells with less than 500 detected genes and 1,000 UMIs were filtered. The resulting data was then natural-log normalized for each cell to account for library size, and variance due to detected mitochondrial genes were regressed from the data.
Single-cell analysis of T cells from mice immunized with HPV-E7
Single-cell analysis was performed as previously described, with modifications18. The modifications are as follows: we identified 461 variable genes with log-mean expression values greater than 0.1 and dispersion (variance/mean) of greater than 1. Principal component analysis (PCA) was performed on the variable genes using the RunPCA function in Seurat. Principal components (PCs) were analyzed with the PCElbowPlot function in Seurat, and five significant components were identified. A two-dimensional tSNE visualization was then generated from the PC loadings for these first five PCs. Clusters were identified using the FindClusters function in Seurat with resolution = 0.4. Genes shown in Figure 3d was chosen by using the FindAllMarkers function in Seurat using the previous defined clusters. The resulting list was filtered for genes that show average fold change of greater than 2 with an adjusted P value of less than 0.001. To calculate gene expression by clonotypes, normalized gene count of cells sharing the same clonotypes were averaged. Then each gene was scaled to produce a z-score with maximum and minimum of +/− 2, respectively. The clonotype gene expression was clustered using ward.D2. Module 2 and 3 were also separately queried against C5 reference set. Signatures from Singer et al.29 was implemented on the dataset using the AddModuleScore function in Seurat (Supplementary Table 11). Numbers of genes, UMI, Reads, and percent of mitochondrial genes recovered for each sample are shown in Supplementary Fig. 5a.
Single-cell analysis of T cells in peanut allergy
Single-cell analysis was performed as previously described, with modifications18. The modifications are as follows: for dataset including all four patients, we identified 486 genes with log-mean expression values greater than 0.1 and dispersion (variance/mean) of greater than 1. PCA was performed on the variable genes using the RunPCA function in Seurat. A two-dimentional tSNE visualization was then generated from the PC loadings 20 most significant PCs. For patient 77, we identified 701 variable genes with log-mean expression values greater than 0.1 and dispersion (variance/mean) of greater than 1. PCA was performed on the variable genes using the RunPCA function in Seurat. PCs were analyzed with the PCElbowPlot function in Seurat, and 15 significant components were identified. A two-dimentional tSNE visualization was then generated from the PC loadings for these first 15 PCs. UMAP was also separately applied to the loadings of these identified principal components. The cluster of T cells with highest clonal expansion was used pseudotemporal analysis by Monocle 350. UMAP dimension reduction was used for pseudotemporal analysis, as was suggested by the authors of Monocle 3. Trajectory was calculated using the implementation of DDRTree in the learnGraph function in Monocle. Signatures from Wei, et al.38 were implemented using the AddModuleScore function in Seurat (Supplementary Table 11). Numbers of genes, UMI, Reads, and percent of mitochondrial genes recovered for each sample are shown in Supplementary Fig. 5c.
MsigDb signature enrichment analysis
Genes of interest (Modules from Figure 3, Cluster 3 and 4 from Extended Data 4) were queried against gene sets from MsigDb to calculate significant overlap of gene signatures51,52. For the murine dataset, Module 2, 3, and 4 were compared against H, C2, and C7 reference sets. The results were filtered for signatures relevant to T cells, and the top five most significant signatures for each Module were shown in Extended Data 1c. Module 1 was compared against H reference set, and the top five most significant signatures were shown in Extended Data 1c. For the human dataset, Cluster 3 and 4 were compared against C7 reference set. The results were filtered for signatures relevant to T cells, and the top 10 most significant signatures for each Cluster were shown in Extended Data 5a. Each signature was manually assigned a short description to aid visualization. Full MsigDb overlap calculation results as well as the manually assigned description are available in Supplementary Table 12.
Statistics and Reproducibility
R was used for statistical analysis. Specific statistical tests are indicated in the figure legends and corresponding sections in the main text. Circlize was used for TCR circus plots53. All confidence intervals were calculated by standard deviation unless otherwise indicated. All box and whisker plots indicate the (box) 25th and 75th percentile along with (whisker) +/− 1.5*interquartile range, unless otherwise indicated. For OT-I T cell analysis in Figure 2a, recovery percentage was calculated using number cells with OT-I Tcra or Tcrb CDR3s divided by total number of cells with recovered Tcra or Tcrb CDR3s. One cell with OT-I CDR3ϐ was detected in the 0.01% spiked-in sample. For OT-I T cell analysis in Figure 2b, two doublet cells were excluded from analysis. For OT-I T cell analysis in Supplementary Fig. 2a, the predicted rate of recovery for both TCRα and TCRβ chains was calculated by multiplying the rates of individual recovery and summing the variance of each chain. Clustering of heatmap in Figure 3d was done on the data of stimulated cells, and super-imposed on the ex vivo portion. Clonotypes in Group 1 were randomly downsampled to 15 clones to aid visualization. Spearman’s correlation between TCRB clonal size and pseudotime in human peanut allergy samples was calculated using T cells with recovered TCRB. All adjusted P values were calculated using Bonferroni correction, unless noted otherwise.
Data availability
FASTQ file format data related to murine samples will be available through GEO and BioProject under accession numbers GSE136028 and PRJNA560970. FASTQ file format data related to human samples will be available through dbGaP under accession number phs001897.v1.p1. Source data files and associated metadata tables for Figures 2–4 will be made available on http://shaleklab.com/resources/, https://github.com/mitlovelab/, or upon request. MsigDB results for Extended Data 1c, Extended Data 5a, and Supplementary Fig. 3h are available as Supplementary Table 12. Full results from differential gene expression comparison shown in Extended Data 2c are available as Supplementary Table 13. All recovered CDR3 sequences, and their frequencies, of TCR alpha and beta chains from E7-immunized mice and peanut allergy patients are available as Supplementary Tables 6, 10. Gene expression matrices for E7-immunized mice and peanut allergy patients are available as Supplementary Data 1, 2.
Code availability
R scripts for generating all analysis, Matlab scripts for processing TCR sequencing data, as well as all updates, will be made available on http://shaleklab.com/resources/, https://github.com/mitlovelab/, or upon request.
Extended Data
Extended Data Fig. 1. Stimulated and ex vivo cells are transcriptionally distinct.
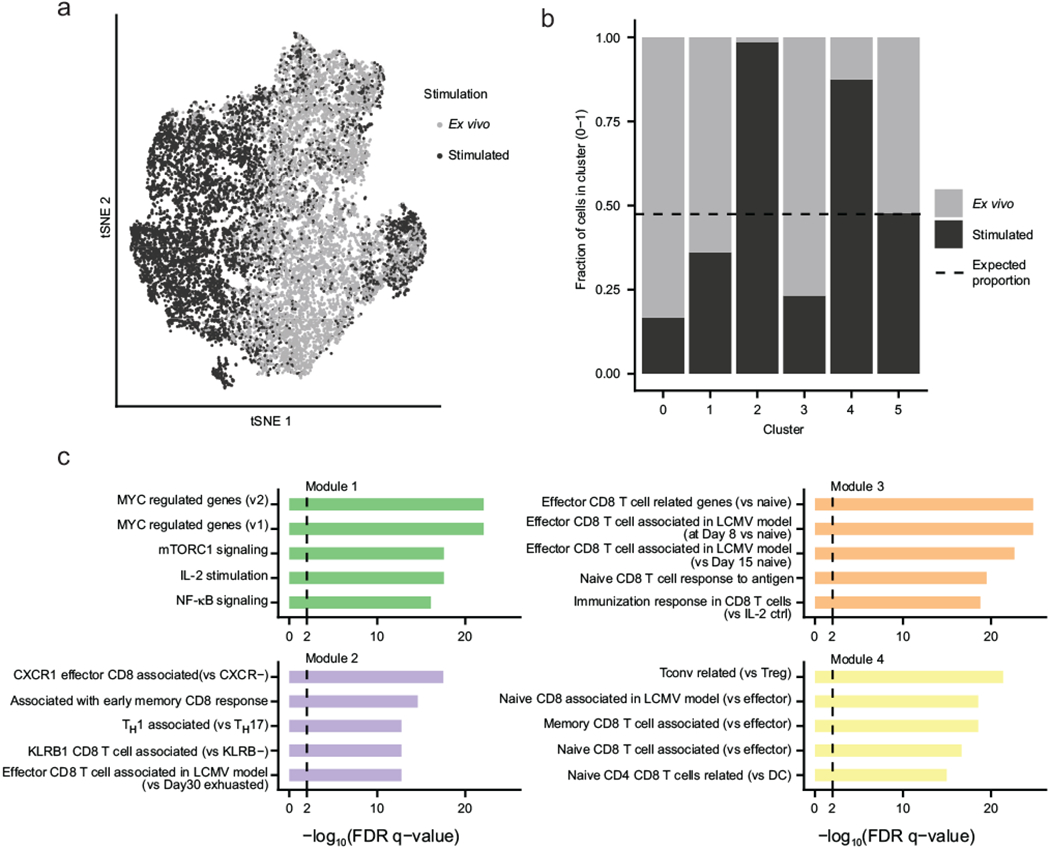
a, tSNE visualization of all cells colored based on stimulation condition (n = 6,912 stimulated cells, dark grey; 7,512 ex vivo cells, light grey). b, Proportions of stimulated and ex vivo cells in each of the computationally determined clusters shown in Figure 3a. Dash line indicates expected proportions assuming even distributions of cells from both conditions. c, Enriched MsigDb signatures of the four modules of genes identified in Figure 3d. FDR q-values represent Benjamini and Hochberg-corrected, one-tailed hypergeometric P values. 50, 49, 35, and 48 genes are included in Module 1, 2, 3, and 4, respectively for enrichment calculation. See Supplementary Table 12 for more details. Data represent combined data from four independent experiments of four mice total (a-c).
Extended Data Fig. 2. Group 1 and 2 clonotypes differ in expansion and gene expression upon stimulation.
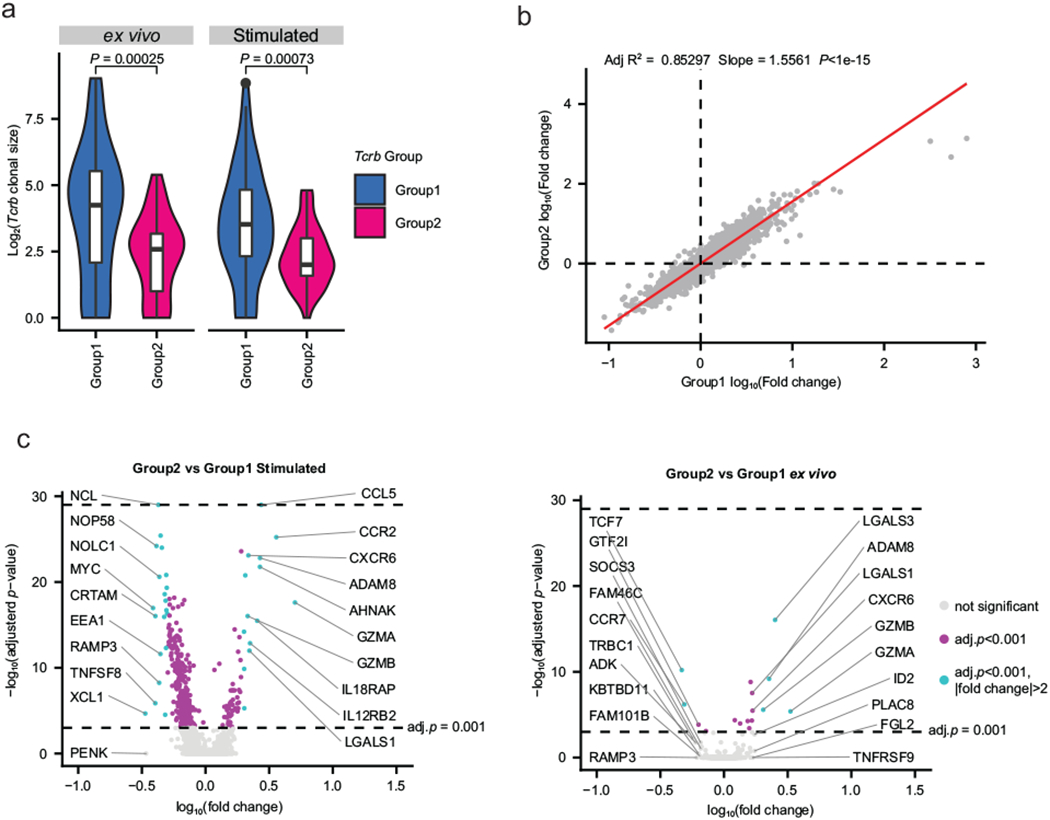
a, Clonal sizes of Group 1 and 2 clonotypes in the stimulated and ex vivo conditions shown in Figure 3d. P value calculated by two-sample Mann-Whitney U test (Stimulated: n = 74 clonotype groups in Group 1; 37 Group 2 clonotypes. ex vivo: n = 82 Group 1 clonotypes; 40 Group 2 clonotypes). Box and whisker plots indicate the (box) 25th and 75th percentile along with (whisker) +/− 1.5*interquartile range. Violin plots represent estimated density of clonotypes. b, Gene expression fold changes between stimulated and ex vivo cells in (x-axis) Group 1 clonotypes and (y-axis) Group 2 clonotypes. Each point represents a shared gene across Group 1 and 2 clonotypes. Red line indicates fitted linear model. P value calculated by one-tailed F statistics (F(1,5908)) of the linear regression. n = 5908 genes. c, Volcano plots of differentially expressed genes between Group 1 and 2 clonotypes in the (left) stimulated and the (right) ex vivo conditions. P values were determined using a two-tailed likelihood ratio test, and adjusted by Bonferroni correction. Top 10 genes with positive or negative fold changes are labeled. Cells in Group 1 and 2 have been downsampled to 300 each (n = 300 cells for each of the groups). See Supplementary Table 13 for more details.
Extended Data Fig. 3. Analysis of shared clonotypes across four E7-HPV immunized mice.
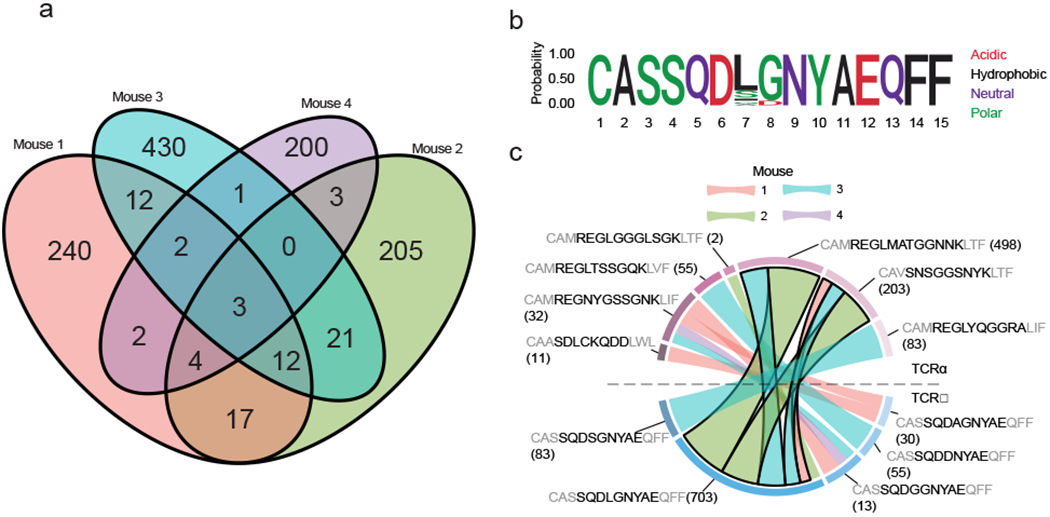
a, Venn diagram of shared unique Tcrb clones across the four mice. b, Amino acid logo plot of TCRβ sequences that show high similarity among public clones shared by at least three of four animals. Individual sequences are shown in c. c, TCRα and β matching of highly similar clonotypes found in public clones shared by at least three of four animals (Supplementary Table 9). Bold outline indicates dual TCRα chains found in the same cells (Supplementary Table 3). Structural amino acids shown in grey. Number of cells shown in parenthesis. TCRα and β sequences that were detected in less than two cells were excluded for visualization.
Extended Data Fig. 4. Distinct patterns of gene expression correlate with pseudotime.
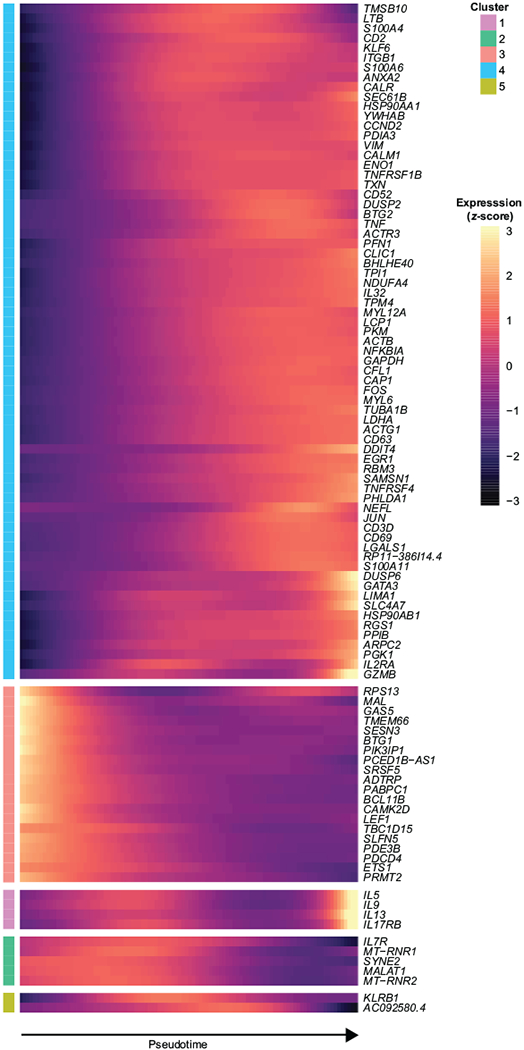
a, Expression of top 100 most significant genes visualized across pseudotime. Genes were clustered via Ward. D2 based on their patterns of expression. Data represent an individual experiment with 1847 single-cells from one patient (patient 77).
Extended Data Fig. 5. Psuedotime correlates with effector T cell signatures.
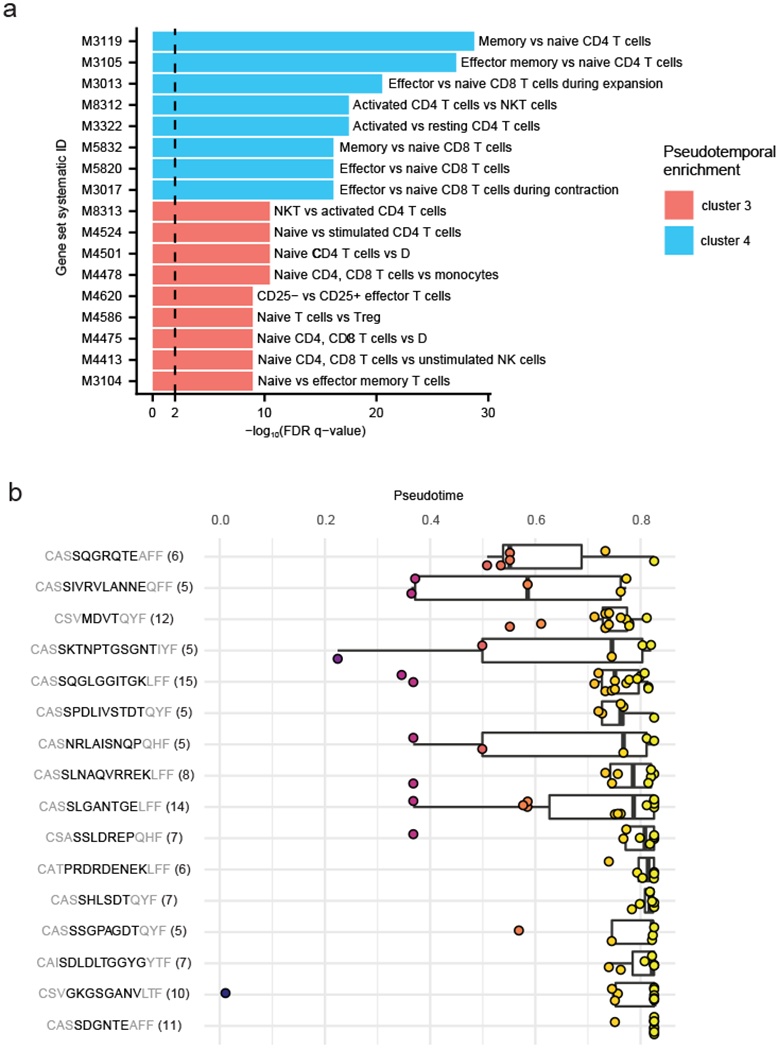
a, MsigDB analysis of genes enriched early (cluster 3 in Extended Data 4a; n = 38 genes) or late (cluster 4 in Extended Data 4a; n = 123 genes) on the pseudotemporal trajectory. Description indicates cell state enriched with the corresponding gene set in comparison to another cell state. FDR q-values represent Benjamini and Hochberg-corrected, one-tailed hypergeometric P values. See Supplementary Table 12 for more details. b, Pseudotime distribution of expanded clones shown in Figure 4d. Number of cells for each clonotype group indicated in parenthesis. A total of 16 clonotype groups are shown. All box and whisker plots indicate the (box) 25th and 75th percentile along with (whisker) +/− 1.5*interquartile range (b). Data represent an individual experiment with 1847 single-cells from one patient (patient 77; a,b).
Supplementary Material
Acknowledgements
We thank P. Blainey and M. Birnbaum for fruitful discussions. This work was supported in part by the Koch Institute Support (core) NIH Grant P30-CA14051 from the National Cancer Institute, as well as the Koch Institute - Dana-Farber/Harvard Cancer Center Bridge Project. This work was also supported by the Food Allergy Science Initiative at the Broad Institute and the NIH (5P01AI039671, 5U19AI089992, U19AI095261). A.K.S. was supported by the Searle Scholars Program, the Beckman Young Investigator Program, the Pew-Stewart Scholars Program for Cancer Research, a Sloan Fellowship in Chemistry, the NIH (1DP2GM119419, 2U19AI089992, 2R01HL095791, 1U54CA217377, 2P01AI039671, 5U24AI118672, 2RM1HG006193, 1R33CA202820, 1R01AI138546, 1R01HL126554, 1R01DA046277, 1U2CCA23319501), and Agilent Technologies.
Footnotes
Competing interests
A.A.T., T.M.G., J.C.L., and the Massachusetts Institute of Technology have filed a patent application (patent no. PCT/US2018/013443) that relates to T cell receptors recovery, compositions of matter, the outlined experimental and computational methods and uses thereof. J.C.L. and A.K.S. are co-founders and shareholders of Honeycomb Biotechnologies, Inc. T.M.G. is currently an employee of Honeycomb Biotechnologies, Inc.
References
- 1.Schrama D, Ritter C & Becker JC T cell receptor repertoire usage in cancer as a surrogate marker for immune responses. Semin. Immunopathol. 39, 255–268 (2017). [DOI] [PubMed] [Google Scholar]
- 2.Lossius A et al. High-throughput sequencing of TCR repertoires in multiple sclerosis reveals intrathecal enrichment of EBV-reactive CD8(+) T cells. Eur. J. Immunol. 44, 1–41 (2014). [DOI] [PubMed] [Google Scholar]
- 3.Kirsch IR et al. TCR sequencing facilitates diagnosis and identifies mature T cells as the cell of origin in CTCL. Sci. Transl. Med 7, 1–13 (2015). [DOI] [PMC free article] [PubMed] [Google Scholar]
- 4.Carlson CS et al. Using synthetic templates to design an unbiased multiplex PCR assay. Nat. Commun 4, 2680 (2013). [DOI] [PubMed] [Google Scholar]
- 5.Crosby EJ et al. Complimentary mechanisms of dual checkpoint blockade expand unique T-cell repertoires and activate adaptive anti-tumor immunity in triple-negative breast tumors. Oncoimmunology 7, e1421891 (2018). [DOI] [PMC free article] [PubMed] [Google Scholar]
- 6.Tirosh I et al. Dissecting the multicellular ecosystem of metastatic melanoma by single-cell RNA-seq. Science (80-. ). 352, 189–196 (2016). [DOI] [PMC free article] [PubMed] [Google Scholar]
- 7.Khodadoust MS et al. Antigen presentation profiling reveals recognition of lymphoma immunoglobulin neoantigens. Nature 543, 723–727 (2017). [DOI] [PMC free article] [PubMed] [Google Scholar]
- 8.Avraham R et al. Pathogen Cell-to-Cell Variability Drives Heterogeneity in Host Immune Responses. Cell 162, 1309–1321 (2015). [DOI] [PMC free article] [PubMed] [Google Scholar]
- 9.Papalexi E & Satija R Single-cell RNA sequencing to explore immune cell heterogeneity. Nat. Rev. Immunol 18, 35–45 (2017). [DOI] [PubMed] [Google Scholar]
- 10.Shalek AK et al. Single-cell transcriptomics reveals bimodality in expression and splicing in immune cells. Nature 498, 236–240 (2013). [DOI] [PMC free article] [PubMed] [Google Scholar]
- 11.Azizi E et al. Single-Cell Map of Diverse Immune Phenotypes in the Breast Tumor Microenvironment. Cell 174, 1293–1308.e36 (2018). [DOI] [PMC free article] [PubMed] [Google Scholar]
- 12.Zhang L et al. Lineage tracking reveals dynamic relationships of T cells in colorectal cancer. Nature 564, 268–272 (2018). [DOI] [PubMed] [Google Scholar]
- 13.Han A, Glanville J, Hansmann L & Davis MM Linking T-cell receptor sequence to functional phenotype at the single-cell level. Nat. Biotechnol. 32, 684–692 (2014). [DOI] [PMC free article] [PubMed] [Google Scholar]
- 14.Stubbington MJT et al. T cell fate and clonality inference from single-cell transcriptomes. Nat. Methods 13, 329–332 (2016). [DOI] [PMC free article] [PubMed] [Google Scholar]
- 15.Dash P et al. Paired analysis of TCRα and TCRβ chains at the single-cell level in mice. J. Clin. Invest. 121, 288–95 (2011). [DOI] [PMC free article] [PubMed] [Google Scholar]
- 16.Macosko EZ et al. Highly Parallel Genome-wide Expression Profiling of Individual Cells Using Nanoliter Droplets. Cell 161, 1202–1214 (2015). [DOI] [PMC free article] [PubMed] [Google Scholar]
- 17.Klein AM et al. Droplet Barcoding for Single-Cell Transcriptomics Applied to Embryonic Stem Cells. Cell 161, 1187–1201 (2015). [DOI] [PMC free article] [PubMed] [Google Scholar]
- 18.Gierahn TM et al. Seq-Well: portable, low-cost RNA sequencing of single cells at high throughput. Nat. Methods 14, 395–398 (2017). [DOI] [PMC free article] [PubMed] [Google Scholar]
- 19.Saikia M et al. Simultaneous multiplexed amplicon sequencing and transcriptome profiling in single cells. bioRxiv 328328 (2018). doi: 10.1101/328328 [DOI] [PMC free article] [PubMed] [Google Scholar]
- 20.Singh M et al. High-throughput targeted long-read single cell sequencing reveals the clonal and transcriptional landscape of lymphocytes. bioRxiv 424945 (2018). doi: 10.1101/424945 [DOI] [PMC free article] [PubMed] [Google Scholar]
- 21.Zemmour D et al. Single-cell gene expression reveals a landscape of regulatory T cell phenotypes shaped by the TCR. Nat. Immunol 19, 291–301 (2018). [DOI] [PMC free article] [PubMed] [Google Scholar]
- 22.Jain M et al. Nanopore sequencing and assembly of a human genome with ultra-long reads. Nat. Biotechnol 36, 338–345 (2018). [DOI] [PMC free article] [PubMed] [Google Scholar]
- 23.Gupta I et al. Single-cell isoform RNA sequencing characterizes isoforms in thousands of cerebellar cells. Nat. Biotechnol 36, 1197–1202 (2018). [DOI] [PubMed] [Google Scholar]
- 24.Hughes TK et al. Highly Efficient, Massively-Parallel Single-Cell RNA-Seq Reveals Cellular States and Molecular Features of Human Skin Pathology. bioRxiv 689273 (2019). doi: 10.1101/689273 [DOI] [Google Scholar]
- 25.Blüthmann H et al. T-cell-specific deletion of T-cell receptor transgenes allows functional rearrangement of endogenous α- and β-genes. Nature 334, 156–159 (1988). [DOI] [PubMed] [Google Scholar]
- 26.Dash P et al. Quantifiable predictive features define epitope-specific T cell receptor repertoires. Nature 547, 89–93 (2017). [DOI] [PMC free article] [PubMed] [Google Scholar]
- 27.Mousset CM et al. Comprehensive Phenotyping of T Cells Using Flow Cytometry. Cytometry Part A 95, 647–654 (2019). [DOI] [PubMed] [Google Scholar]
- 28.Farber DL, Yudanin NA & Restifo NP Human memory T cells: generation, compartmentalization and homeostasis. Nat. Rev. Immunol 14, 24–35 (2014). [DOI] [PMC free article] [PubMed] [Google Scholar]
- 29.Singer M et al. A Distinct Gene Module for Dysfunction Uncoupled from Activation in Tumor-Infiltrating T Cells. Cell 166, 1500–1511.e9 (2016). [DOI] [PMC free article] [PubMed] [Google Scholar]
- 30.Huang W & August A The signaling symphony: T cell receptor tunes cytokine-mediated T cell differentiation. J. Leukoc. Biol 97, 477–85 (2015). [DOI] [PMC free article] [PubMed] [Google Scholar]
- 31.Padovan E et al. Expression of two T cell receptor alpha chains: dual receptor T cells. Science (80-. ). 262, 422–424 (1993). [DOI] [PubMed] [Google Scholar]
- 32.Bacher P & Scheffold A Flow-cytometric analysis of rare antigen-specific T cells. Cytom. Part A 83A, 692–701 (2013). [DOI] [PubMed] [Google Scholar]
- 33.Chattopadhyay PK, Yu J & Roederer M Live-cell assay to detect antigen-specific CD4+ T-cell responses by CD154 expression. Nat. Protoc 1, 1–6 (2006). [DOI] [PubMed] [Google Scholar]
- 34.Syed A, Kohli A & Nadeau KC Food allergy diagnosis and therapy: where are we now? Immunotherapy 5, 931–944 (2013). [DOI] [PMC free article] [PubMed] [Google Scholar]
- 35.Seumois G et al. Transcriptional Profiling of Th2 Cells Identifies Pathogenic Features Associated with Asthma. J. Immunol 197, 655–664 (2016). [DOI] [PMC free article] [PubMed] [Google Scholar]
- 36.Mueller SN, Gebhardt T, Carbone FR & Heath WR Memory T Cell Subsets, Migration Patterns, and Tissue Residence. Annu. Rev. Immunol 31, 137–161 (2013). [DOI] [PubMed] [Google Scholar]
- 37.Nish SA et al. CD4+ T cell effector commitment coupled to self-renewal by asymmetric cell divisions. J. Exp. Med 214, 39–47 (2017). [DOI] [PMC free article] [PubMed] [Google Scholar]
- 38.Wei G et al. Global mapping of H3K4me3 and H3K27me3 reveals specificity and plasticity in lineage fate determination of differentiating CD4+ T cells. Immunity 30, 155–67 (2009). [DOI] [PMC free article] [PubMed] [Google Scholar]
- 39.Foletta VC, Segal DH & Cohen DR Transcriptional regulation in the immune system: all roads lead to AP-1. J. Leukoc. Biol 63, 139–152 (1998). [DOI] [PubMed] [Google Scholar]
- 40.Müller U et al. Lack of IL-4 receptor expression on T helper cells reduces T helper 2 cell polyfunctionality and confers resistance in allergic bronchopulmonary mycosis. Mucosal Immunol. 5, 299–310 (2012). [DOI] [PubMed] [Google Scholar]
- 41.Upadhyaya B, Yin Y, Hill BJ, Douek DC & Prussin C Hierarchical IL-5 expression defines a subpopulation of highly differentiated human Th2 cells. J. Immunol 187, 3111–20 (2011). [DOI] [PMC free article] [PubMed] [Google Scholar]
- 42.Ritvo P-G et al. High-resolution repertoire analysis reveals a major bystander activation of Tfh and Tfr cells. Proc. Natl. Acad. Sci. U. S. A 115, 9604–9609 (2018). [DOI] [PMC free article] [PubMed] [Google Scholar]
- 43.Raj A & van Oudenaarden A Nature, Nurture, or Chance: Stochastic Gene Expression and Its Consequences. Cell 135, 216–226 (2008). [DOI] [PMC free article] [PubMed] [Google Scholar]
- 44.Han Q et al. Polyfunctional responses by human T cells result from sequential release of cytokines. Proc. Natl. Acad. Sci. U. S. A 109, 1607–12 (2012). [DOI] [PMC free article] [PubMed] [Google Scholar]
- 45.Stoeckius M et al. Cell Hashing with barcoded antibodies enables multiplexing and doublet detection for single cell genomics. Genome Biol. 19, 224 (2018). [DOI] [PMC free article] [PubMed] [Google Scholar]
- 46.Schumacher TNM, Gerlach C & van Heijst JWJ Mapping the life histories of T cells. Nat. Rev. Immunol 10, 621–631 (2010). [DOI] [PubMed] [Google Scholar]
- 47.Rosati E et al. Overview of methodologies for T-cell receptor repertoire analysis. BMC Biotechnol. 17, 61 (2017). [DOI] [PMC free article] [PubMed] [Google Scholar]
- 48.Hermiston ML, Xu Z & Weiss A CD45: A Critical Regulator of Signaling Thresholds in Immune Cells. Annu. Rev. Immunol 21, 107–137 (2003). [DOI] [PubMed] [Google Scholar]
Methods-only References
- 49.Rohland N & Reich D Cost-effective, high-throughput DNA sequencing libraries for multiplexed target capture. Genome Res. 22, 939–46 (2012). [DOI] [PMC free article] [PubMed] [Google Scholar]
- 50.Qiu X et al. Reversed graph embedding resolves complex single-cell trajectories. Nat. Methods 14, 979–982 (2017). [DOI] [PMC free article] [PubMed] [Google Scholar]
- 51.Liberzon A et al. Molecular signatures database (MSigDB) 3.0. Bioinformatics 27, 1739–1740 (2011). [DOI] [PMC free article] [PubMed] [Google Scholar]
- 52.Liberzon A et al. The Molecular Signatures Database Hallmark Gene Set Collection. Cell Syst. 1, 417–425 (2015). [DOI] [PMC free article] [PubMed] [Google Scholar]
- 53.Gu Z, Gu L, Eils R, Schlesner M & Brors B circlize implements and enhances circular visualization in R. Bioinformatics 30, 2811–2812 (2014). [DOI] [PubMed] [Google Scholar]
Associated Data
This section collects any data citations, data availability statements, or supplementary materials included in this article.
Supplementary Materials
Data Availability Statement
FASTQ file format data related to murine samples will be available through GEO and BioProject under accession numbers GSE136028 and PRJNA560970. FASTQ file format data related to human samples will be available through dbGaP under accession number phs001897.v1.p1. Source data files and associated metadata tables for Figures 2–4 will be made available on http://shaleklab.com/resources/, https://github.com/mitlovelab/, or upon request. MsigDB results for Extended Data 1c, Extended Data 5a, and Supplementary Fig. 3h are available as Supplementary Table 12. Full results from differential gene expression comparison shown in Extended Data 2c are available as Supplementary Table 13. All recovered CDR3 sequences, and their frequencies, of TCR alpha and beta chains from E7-immunized mice and peanut allergy patients are available as Supplementary Tables 6, 10. Gene expression matrices for E7-immunized mice and peanut allergy patients are available as Supplementary Data 1, 2.