Abstract
PURPOSE
A challenge in the diagnosis of renal cell carcinoma (RCC) is to distinguish chromophobe RCC (chRCC) from benign renal oncocytoma, because these tumor types are histologically and morphologically similar, yet they require different clinical management. Molecular biomarkers could provide a way of distinguishing oncocytoma from chRCC, which could prevent unnecessary treatment of oncocytoma. Such biomarkers could also be applied to preoperative biopsy specimens such as needle core biopsy specimens, to avoid unnecessary surgery of oncocytoma.
METHODS
We profiled DNA methylation in fresh-frozen oncocytoma and chRCC tumors and adjacent normal tissue and used machine learning to identify a signature of differentially methylated cytosine-phosphate-guanine sites (CpGs) that robustly distinguish oncocytoma from chRCC.
RESULTS
Unsupervised clustering of Stanford and preexisting RCC data from The Cancer Genome Atlas (TCGA) revealed that of all RCC subtypes, oncocytoma is most similar to chRCC. Unexpectedly, however, oncocytoma features more extensive, overall abnormal methylation than does chRCC. We identified 79 CpGs with large methylation differences between oncocytoma and chRCC. A diagnostic model trained on 30 CpGs could distinguish oncocytoma from chRCC in 10-fold cross-validation (area under the receiver operating curve [AUC], 0.96 (95% CI, 0.88 to 1.00)) and could distinguish TCGA chRCCs from an independent set of oncocytomas from a previous study (AUC, 0.87). This signature also separated oncocytoma from other RCC subtypes and normal tissue, revealing it as a standalone diagnostic biomarker for oncocytoma.
CONCLUSION
This CpG signature could be developed as a clinical biomarker to support differential diagnosis of oncocytoma and chRCC in surgical samples. With improved biopsy techniques, this signature could be applied to preoperative biopsy specimens.
INTRODUCTION
Renal cell carcinoma (RCC) is the sixth most common cancer diagnosis among men and eighth most common among women.1 Small RCCs are generally associated with good prognosis in the absence of metastasis or local invasion. However, early-stage RCC is usually asymptomatic; therefore, many RCCs are detected at later stages, resulting in poorer prognosis.2
Context
Key Objective
We profiled DNA methylation to determine if it is possible to distinguish oncocytoma from chromophobe renal cell carcinoma (chRCC).
Knowledge Generated
We found that oncocytoma has a similar DNA methylation profile to chRCC but features more extensive abnormal methylation; this suggests that oncocytoma does not represent a precursor lesion that can progress to chRCC, as was previously conjectured. We identified a methylation signature that could reproducibly distinguish oncocytoma from chRCC with high accuracy and also distinguishes oncocytoma from other RCC subtypes.
Relevance
This signature could be applied as a diagnostic biomarker to distinguish oncocytoma from RCC in surgical samples to prevent overdiagnosis and overtreatment of oncocytoma.
A prerequisite for developing a clinically applicable diagnostic biomarker for RCC is to identify markers that can distinguish RCC from noncancerous renal tumors such as a renal oncocytoma, which is the most common benign histology discovered at the time of surgery.3 Failure to distinguish oncocytomas from RCC can lead to overdiagnosis and overtreatment of oncocytoma, in the form of unnecessary or excessive surgery.3-5 Oncocytomas are benign tumors composed of oncocytes (epithelial cells that contain excessive mitochondria), which are partially recognized because of their eosinophilic histology (ie, eosin dye staining on hematoxylin-and-eosin–stained slides).3
A longstanding challenge in RCC biomarker development is to distinguish oncocytoma from chromophobe RCCs (chRCCs), which are cytological and morphologically similar and are understood to share a cell of origin (ie, distal nephron epithelial cells).6,7 It is particularly challenging to distinguish oncocytoma from the “eosinophilic” chRCC, a chRCC subtype that shares hallmark morphologic and genetic features with oncocytoma.8,9 In clinical care, it is challenging to distinguish oncocytoma from chRCC using renal tumor biopsy samples, and pathologists often require large amounts of tissue for a definitive diagnosis (eg, the surgically resected tumor). For this reason, pathologists often cannot distinguish oncocytoma from chRCC before surgery, and they typically label such tumors as “oncocytic neoplasms.”10
Here, we investigate DNA methylation, an epigenetic modification that is perturbed in virtually all cancers,11 as a source of diagnostic biomarkers to distinguish between oncocytoma and chRCC. We profiled genome-wide patterns of DNA methylation in both oncocytoma and chRCC, enabling us to characterize methylation differences between these two histologies. We identified DNA methylation signatures that can classify oncocytoma and chRCC with high accuracy, using a core set of cytosine-phosphate-guanine sites (CpGs).
MATERIALS AND METHODS
Patients and Samples
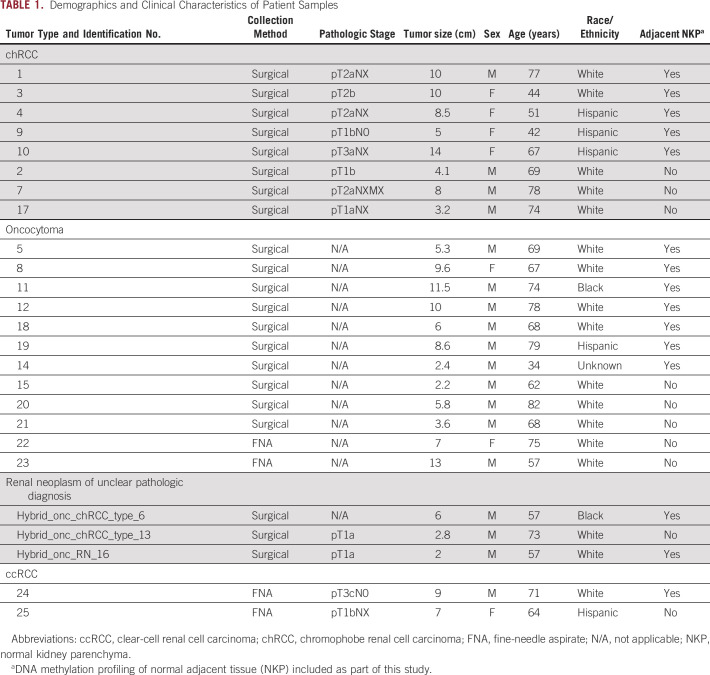
Study approval was obtained from the Stanford Institutional Review Board (protocol no. 26213). Primary tumor tissue samples were collected from patients with RCC or oncocytoma who were treated at Stanford Hospital. Samples were collected at the time of extirpative surgery and freshly frozen. Details of patient clinicopathologic features are provided in the Data Supplement and are summarized in Table 1.
TABLE 1.
Demographics and Clinical Characteristics of Patient Samples
DNA Methylation Arrays
DNA methylation profiles were generated from the Stanford study patients’ samples using the Illumina Infinium HumanMethylation450 Beadchip array (ie, the “450k array”), as described in the Data Supplement.
Identification of Differentially Methylated CpGs
Significance of microarrays (SAM)12 analysis was used to identify CpGs that were differentially methylated between sample types, as described in the Data Supplement.
Development of Sample Group Diagnostic Classifiers Using Modeling on DNA Methylation
Prediction of microarrays (PAM) analysis13 was used to develop diagnostic models to classify or distinguish between sample types (renal mass types and tumor-adjacent normal kidney parenchyma [NKP]), as described in the Data Supplement.
Development of a Diagnostic Model Trained on Data From The Cancer Genome Atlas to Classify Stanford Study Samples
PAM analysis13 was used to train a model to classify clear-cell RCC (ccRCC), papillary RCC (pRCC), chRCC, and NKP using The Cancer Genome Atlas (TCGA) RCC study data. This model was then applied to classify Stanford study samples as one of the training sample classes. PAM analysis was trained on DNA methylation data for CpGs that were abnormally methylated in RCC relative to NKP (identified using MethylMix14).
Inferring Tumor Purity
We applied InfiniumPurify15 to calculate tumor purity scores for surgical samples and biopsy specimens, as described in the Data Supplement.
Validation of the Diagnostic Model in Independent Patient Samples
PAM analysis was used to train a model on TCGA chRCC, oncocytoma, and NKP DNA methylation data and then classify oncocytoma and chRCC tumors from a “test set” of tumor samples derived from previously reported independent studies.16,17 Test-set data included DNA methylation Illumina 450k array data for formalin-fixed, paraffin-embedded oncocytoma tumors (n = 37) from a study by Chopra et al,16 and of fresh-frozen chRCC tumors (n = 65) from the TCGA study.18 The Data Supplement provides a description of the Chopra et al study data.
Classification of Ex Vivo Core Needle Biopsy Specimens
A 3-class PAM diagnostic model was applied to DNA methylation profiles of ex vivo core needle biopsy specimens that were collected from tumors and NKP of chRCC and oncocytoma as part of the Chopra et al study.16
RESULTS
DNA Methylation-Based Classification of Oncocytoma
We first sought to classify oncocytoma in terms of its similarity to malignant RCC histological subtypes at the level of abnormal DNA methylation. To do this, we applied MethylMix14 to identify abnormally methylated CpGs in RCC (Data Supplement). We then applied PAM analysis to methylation data for all abnormally methylated CpGs to develop a DNA methylation-based diagnostic model that could classify RCC subtypes.13 We trained this PAM model to classify chRCC (n = 65), ccRCC (n = 315), pRCC (n = 275), and NKP (n = 204), using TGCA DNA methylation data sets. Ten-fold cross-validation was used to test the performance of this model, indicating that it classified NKP with perfect accuracy, and pRCC, ccRCC, and chRCC tumors with 90%-92% accuracy (overall multiple-class area under the curve [AUC], 0.97; Data Supplement).
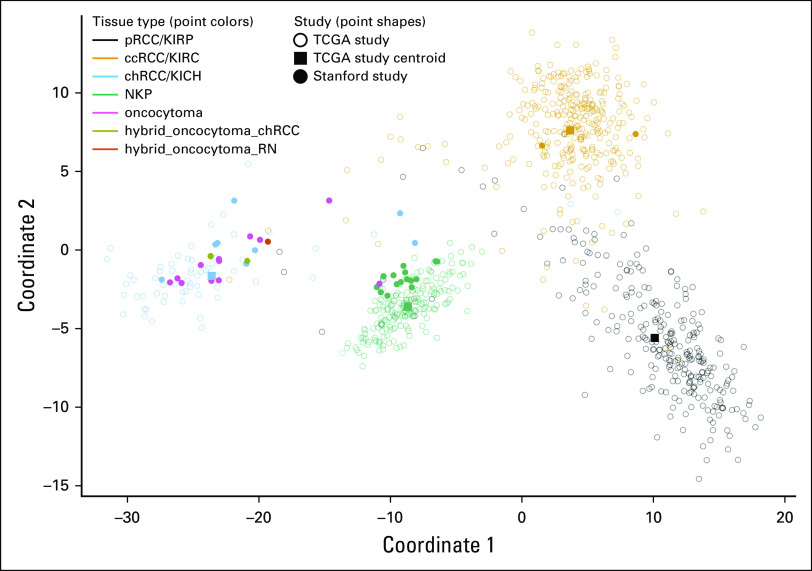
We then used this model to classify tumor and NKP samples that were collected from patients diagnosed with oncocytoma and chRCC at Stanford (Table 1). All the chRCC, NKP, and ccRCC samples were correctly classified, validating the diagnostic model using samples from an external data set (Data Supplement). Using this unsupervised external model, 11 of 12 oncocytomas were classified as most similar to chRCC; the remaining oncocytoma tumor was most similar to NKP. The similarity of oncocytomas to chRCC at the level of methylation was particularly apparent when the relative distances of each patient sample were visualized (Fig 1).
FIG 1.
Multidimensional scaling analysis of differential DNA methylation between renal cell carcinoma (RCC) subtypes and oncocytoma. Multidimensional scaling plot illustrating dissimilarity between RCC subtypes (pRCC, ccRCC, and chRCC), NKP, and oncocytoma in terms of their DNA methylation profiles. The cytosine-phosphate-guanine sites used for multidimensional scaling (n = 46,530) include all those that were used by a diagnostic model that was trained on TCGA data to distinguish RCC subtypes. Unfilled circles represent TCGA patient samples. Square points represent centroids for each of the TCGA sample groups (pRCC, ccRCC, chRCC, and NKP). Filled circles represent Stanford study patient samples. ccRCC, clear-cell renal cell carcinoma; chRCC, chromophobe renal cell carcinoma; KICH, kidney chromophobe (TCGA study abbreviation); KIRC, kidney renal clear cell carcinoma (TCGA study abbreviation); KIRP, kidney renal papillary cell carcinoma (TCGA study abbreviation); NKP, normal kidney parenchyma; pRCC, papillary renal cell carcinoma; RN, renal neoplasm; TCGA, The Cancer Genome Atlas.
The methylation profiles of oncocytomas were most similar to chRCC, consistent with the difficulty of distinguishing oncocytoma from chRCC at the histological level. Despite this, we observed a lower classification confidence for oncocytoma compared with other sample types that were represented in the study, indicated by lower posterior probabilities for classification (Data Supplement). The uncertainty of classifications for oncocytomas indicates that their methylation profiles do not perfectly match that of chRCC.
Comparative Surveys of Abnormal DNA Methylation in Oncocytoma and chRCC Versus Normal Tissue
To characterize and compare the landscapes of abnormal DNA methylation in oncocytoma and chRCC, we identified CpGs that were significantly differentially methylated in each histology compared with NKP separately. Overall, there were 70% more abnormally methylated CpGs in oncocytoma relative to NKP (n = 8,550 hypomethylated CpGs; n = 962 hypermethylated CpGs) than in chRCC relative to NKP (n = 5,058 hypomethylated CpGs; n = 517 hypermethylated CpGs) (Data Supplement). This is despite considerable overlap between the sets of CpGs that were abnormally methylated in each histology compared with NKP: Two-thirds of the CpGs that were hypomethylated in chRCC relative to NKP were also hypomethylated in oncocytoma (n = 3,377 of 5,058) and 58% of CpGs sites that were hypermethylated in chRCC were hypermethylated in oncocytoma (n = 297 of 515), relative to NKP (Fig 2B). Oncocytomas also featured more extreme abnormal methylation than chRCC in terms of the most extreme methylation β-value differences between tumor and normal tissue (Fig 2A).
FIG 2.
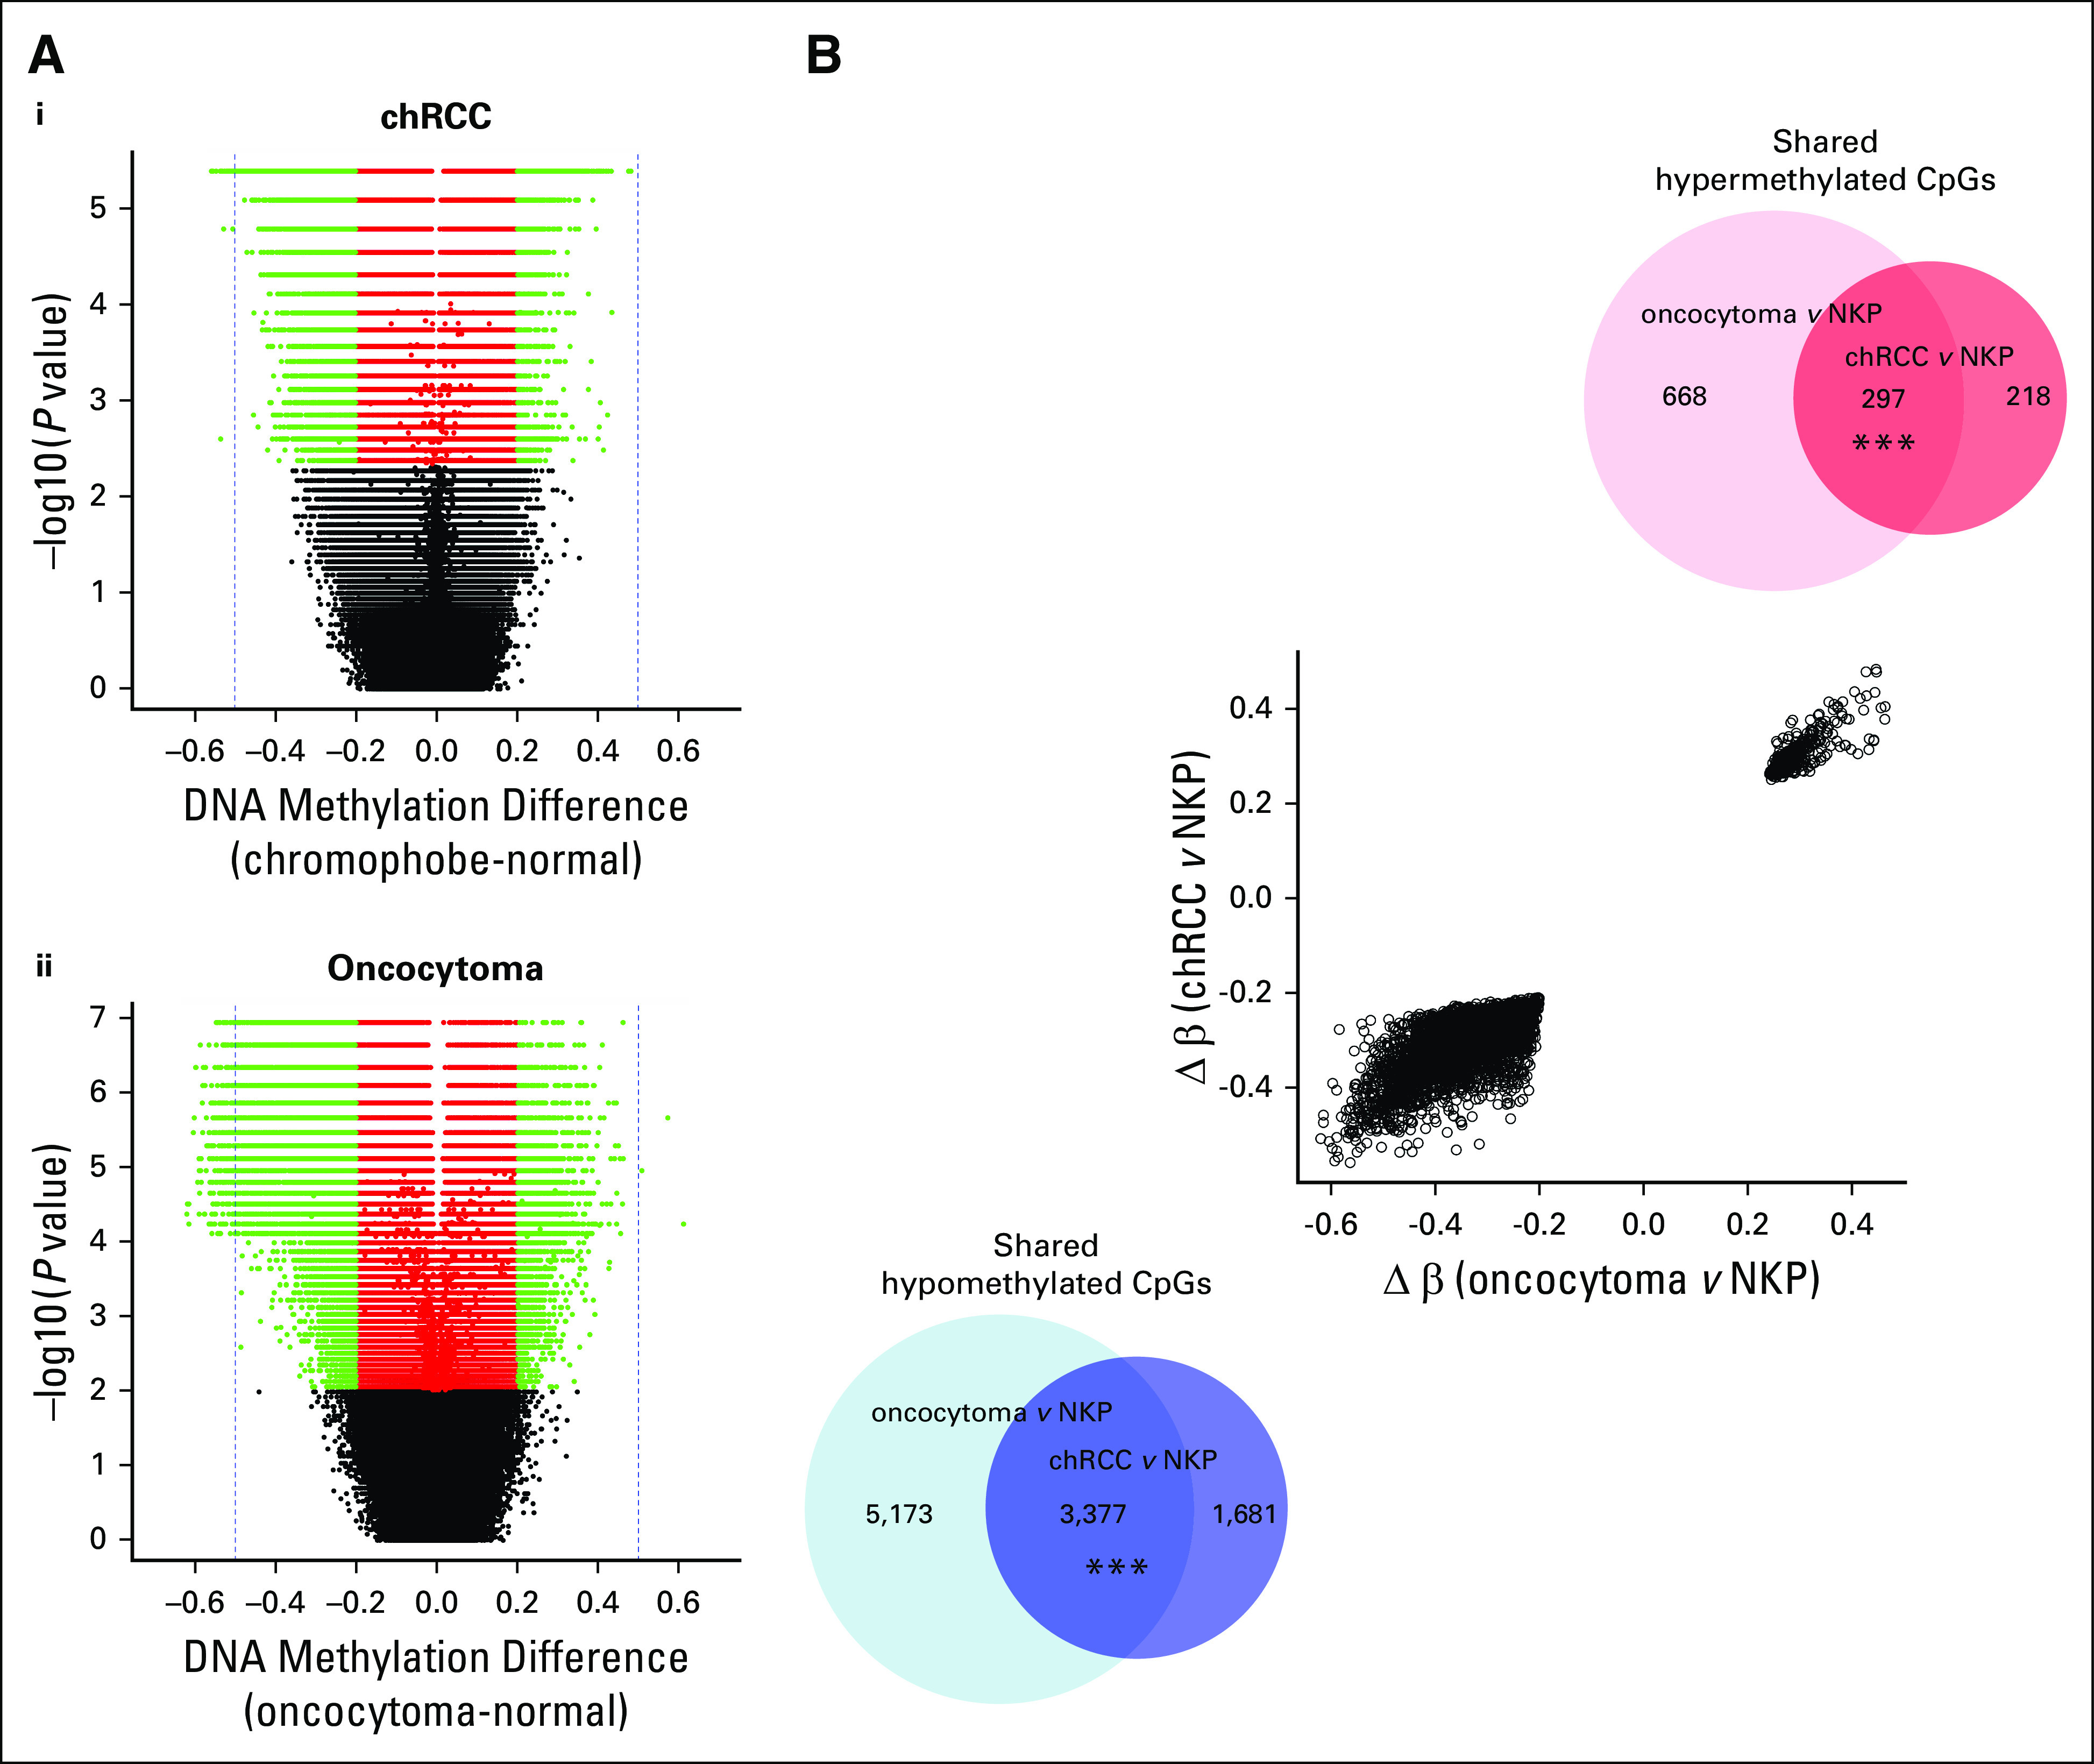
Relative degrees of abnormal DNA methylation in oncocytoma and chRCC. (A) For (i) chRCC (n = 8) and (ii) oncocytoma (n = 15), volcano plots illustrate the statistical significance (y-axes), and mean β value differences (x-axes) for differential methylation between tumor and NKP (n = 12), of all cytosine-phosphate-guanine sites (CpGs). Red points represent CpGs with statistically significant methylation differences (false-discovery-rate–corrected Wilcoxon rank-sum test, P < .05); green points indicate statistically significant CpGs with absolute β value differences of > 0.2. (B) Scatter plot indicates change in β values (mean methylation β value in tumor minus mean methylation β value in NKP) in oncocytoma and chRCC for CpGs that are shared between tumor types (abnormally methylated in both tumor types, in the same direction). This indicates the relative degrees of differential methylation between tumor and histologically normal tumor-adjacent tissue for each renal mass type, when considering CpGs that are abnormally methylated in both renal mass types. Venn diagrams indicate the number of overlapping hypomethylated and hypermethylated CpGs between tumor types (*** P < .0001, hypergeometric test). Δ, change in; chRCC, chromophobe renal cell carcinoma; NKP, normal kidney parenchyma.
Differential Methylation Between Oncocytoma and chRCC
To identify biomarkers that could distinguish oncocytoma from chRCC, we next profiled differential methylation between these two histologies. We performed SAM analysis12 to identify CpGs that were most differentially methylated between oncocytoma and chRCC samples. SAM analysis identified 37 CpGs that were hypermethylated and 42 that were hypomethylated in oncocytoma relative to chRCC, with absolute mean β-value differences of up to 0.48 between oncocytoma and chRCC (Fig 3; Data Supplement). Some of the CpGs that were hypermethylated in oncocytoma reside within genes that were reported to be transcriptionally deregulated in oncocytoma, including KRT7, TSPAN5, NXPH2, ADCY5, IGFBP1.8
FIG 3.
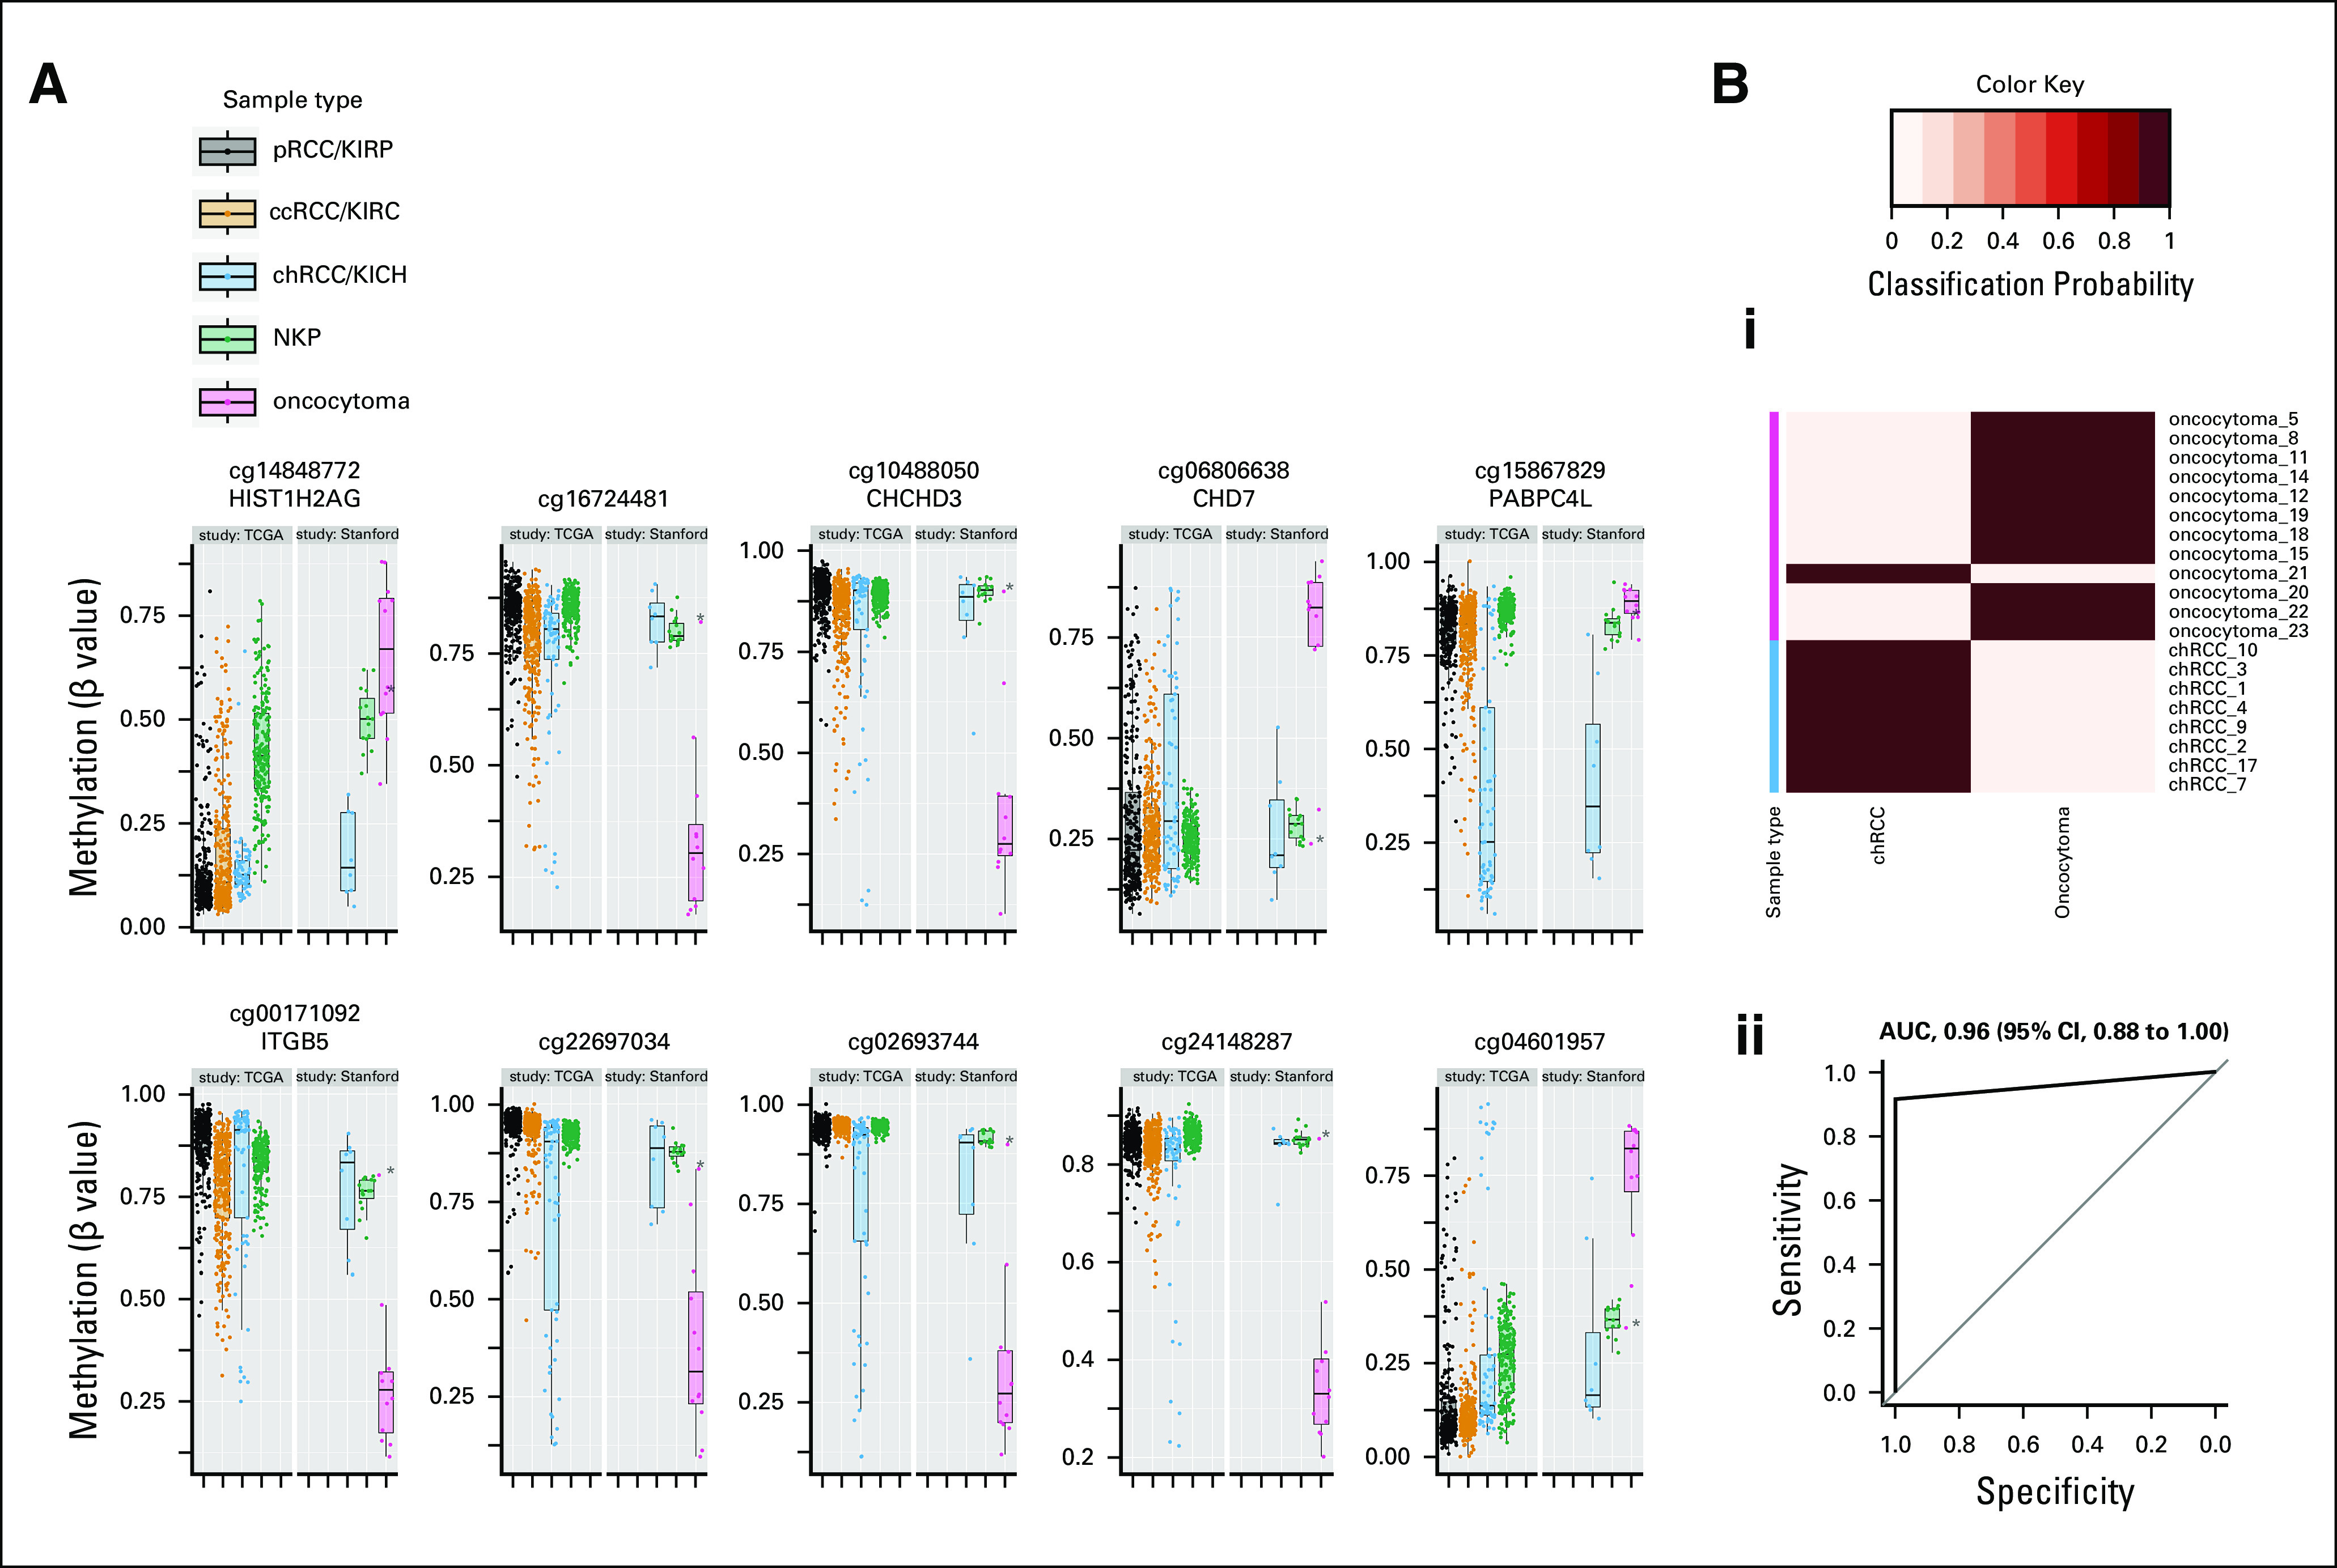
Differential methylation distinguishing oncocytoma from chRCC. (A) Box plots illustrate methylation of cytosine-phosphate-guanine sites (CpGs) that were differentially methylated between oncocytoma and chRCC within Stanford study data. Included are the top 10 statistically significant CpGs with the greatest mean methylation differences between oncocytoma and chRCC. Methylation of the same CpGs in TCGA data for tumors in all three RCC subtypes (pRCC, ccRCC, and chRCC) and NKP are shown for reference. Points represent individual patient samples. (B) Differential classification of chRCC versus oncocytoma based on differential methylation of 79 CpGs (including those illustrated in A): (i) Heatmap indicating the posterior probabilities (classification probability) for classification of patient samples as either chRCC or oncocytoma by a diagnostic model (prediction of microarrays analysis13) in combination with 10-fold cross-validation. The true histological class of each sample is indicated by the color key, and the probabilities for belonging to each of the two tumor type classes (chRCC or oncocytoma) are indicated in columns by the heatmap color gradient. (ii) Received operating indicating the overall classification of the diagnostic model. The AUC is indicated with 95% CIs. (*) Misclassified sample (oncocytoma 21). AUC, area under the receiver operating curve; ccRCC, clear-cell renal cell carcinoma; chRCC, chromophobe renal cell carcinoma; kidney chromophobe (TCGA study abbreviation); KIRC, kidney renal clear cell carcinoma (TCGA study abbreviation); KIRP, kidney renal papillary cell carcinoma (TCGA study abbreviation); NKP, normal kidney parenchyma; pRCC, papillary renal cell carcinoma; TCGA, The Cancer Genome Atlas.
Development of a DNA Methylation-Based Diagnostic Model to Distinguish Oncocytoma From chRCC
We trained a diagnostic model to distinguish chRCC by using DNA methylation data for 79 CpGs that were differentially methylated between the two histologies. We tested the accuracy of this model in classifying oncocytoma from chRCC on the basis of 10-fold cross-validation within the Stanford study. This diagnostic model could distinguish oncocytoma from chRCC with very high accuracy (area under the receiver operating curve [AUC], 0.96; Fig 3B; Data Supplement). Visualization of the methylation profile of the only misclassified sample (oncocytoma_21) indicates that this oncocytoma clearly displayed an NKP-like methylation profile (Data Supplement).
DNA Methylation-Based Diagnostic Models to Distinguish Oncocytoma From NKP and chRCC From NKP
We next tested the ability of methylation-based diagnostic models to distinguish each renal mass histology (oncocytoma and chRCC) from NKP separately, using the sets of CpGs that were differentially methylated between each histology and NKP. A diagnostic model that was trained to distinguish oncocytoma from NKP accurately classified 11 of 12 oncocytomas and 15 of 15 NKP samples in 10-fold cross-validation (AUC, 0.96; 95% CI, 0.88 to 1.00; Data Supplement). Oncocytoma_21, the oncocytoma that was previously misclassified as chRCC by our diagnostic model to distinguish oncocytoma from chRCC, was here misclassified as NKP. A diagnostic model that was trained to distinguish chRCC from NKP accurately classified 8 of 10 chRCCs and 15 of 15 NKP samples in 10-fold cross-validation (AUC, 0.88; 95% CI, 0.71 to 1.00; Data Supplement).
We further evaluated if misclassification of oncocytoma_21 and two chRCC cases, because NKP could be explained by lower tumor purity (ie, low fractions of tumor cells relative to NKP). To do this, we applied InfiniumPurify15 to calculate tumor purity scores for each sample and confirmed that that these scores represent a valid measure of the fraction of tumor cells within both chRCC and oncocytoma samples (Data Supplement). Indeed, the tumor purity scores in each of the three misclassified samples were much lower than those of tumors that were correctly classified, and were similar to NKP, indicating that these samples contain relatively low tumor cell fractions (Data Supplement).
Validation of the Diagnostic Model in Independent Patient Cohorts
We next sought to validate our diagnostic model to distinguish oncocytoma from chRCC in an independent patient cohort. To do this, we trained the model on the completed set of chRCCs, oncocytomas, and NPK samples from the Stanford study (“training set”), and then applied it to classify oncocytoma and chRCC tumors from independent patient studies (ie, “test set”). To build this test set, we combined 37 formalin-fixed, paraffin-embedded oncocytomas from Chopra et al.16 with the 65 TCGA chRCC tumors. Our 79 CpGs diagnostic model correctly classified 62 of 65 chRCCs (95%) and 32 of 37 oncocytomas (86%; multiple-class AUC, 0.87; Fig 4; Data Supplement). The tumor purity scores of the 5 misclassified oncocytomas were slightly lower than that for the correctly classified oncocytomas (Data Supplement), although the mean difference in tumor purity scores between misclassified and correctly classified oncocytomas was not statistically significant.
FIG 4.
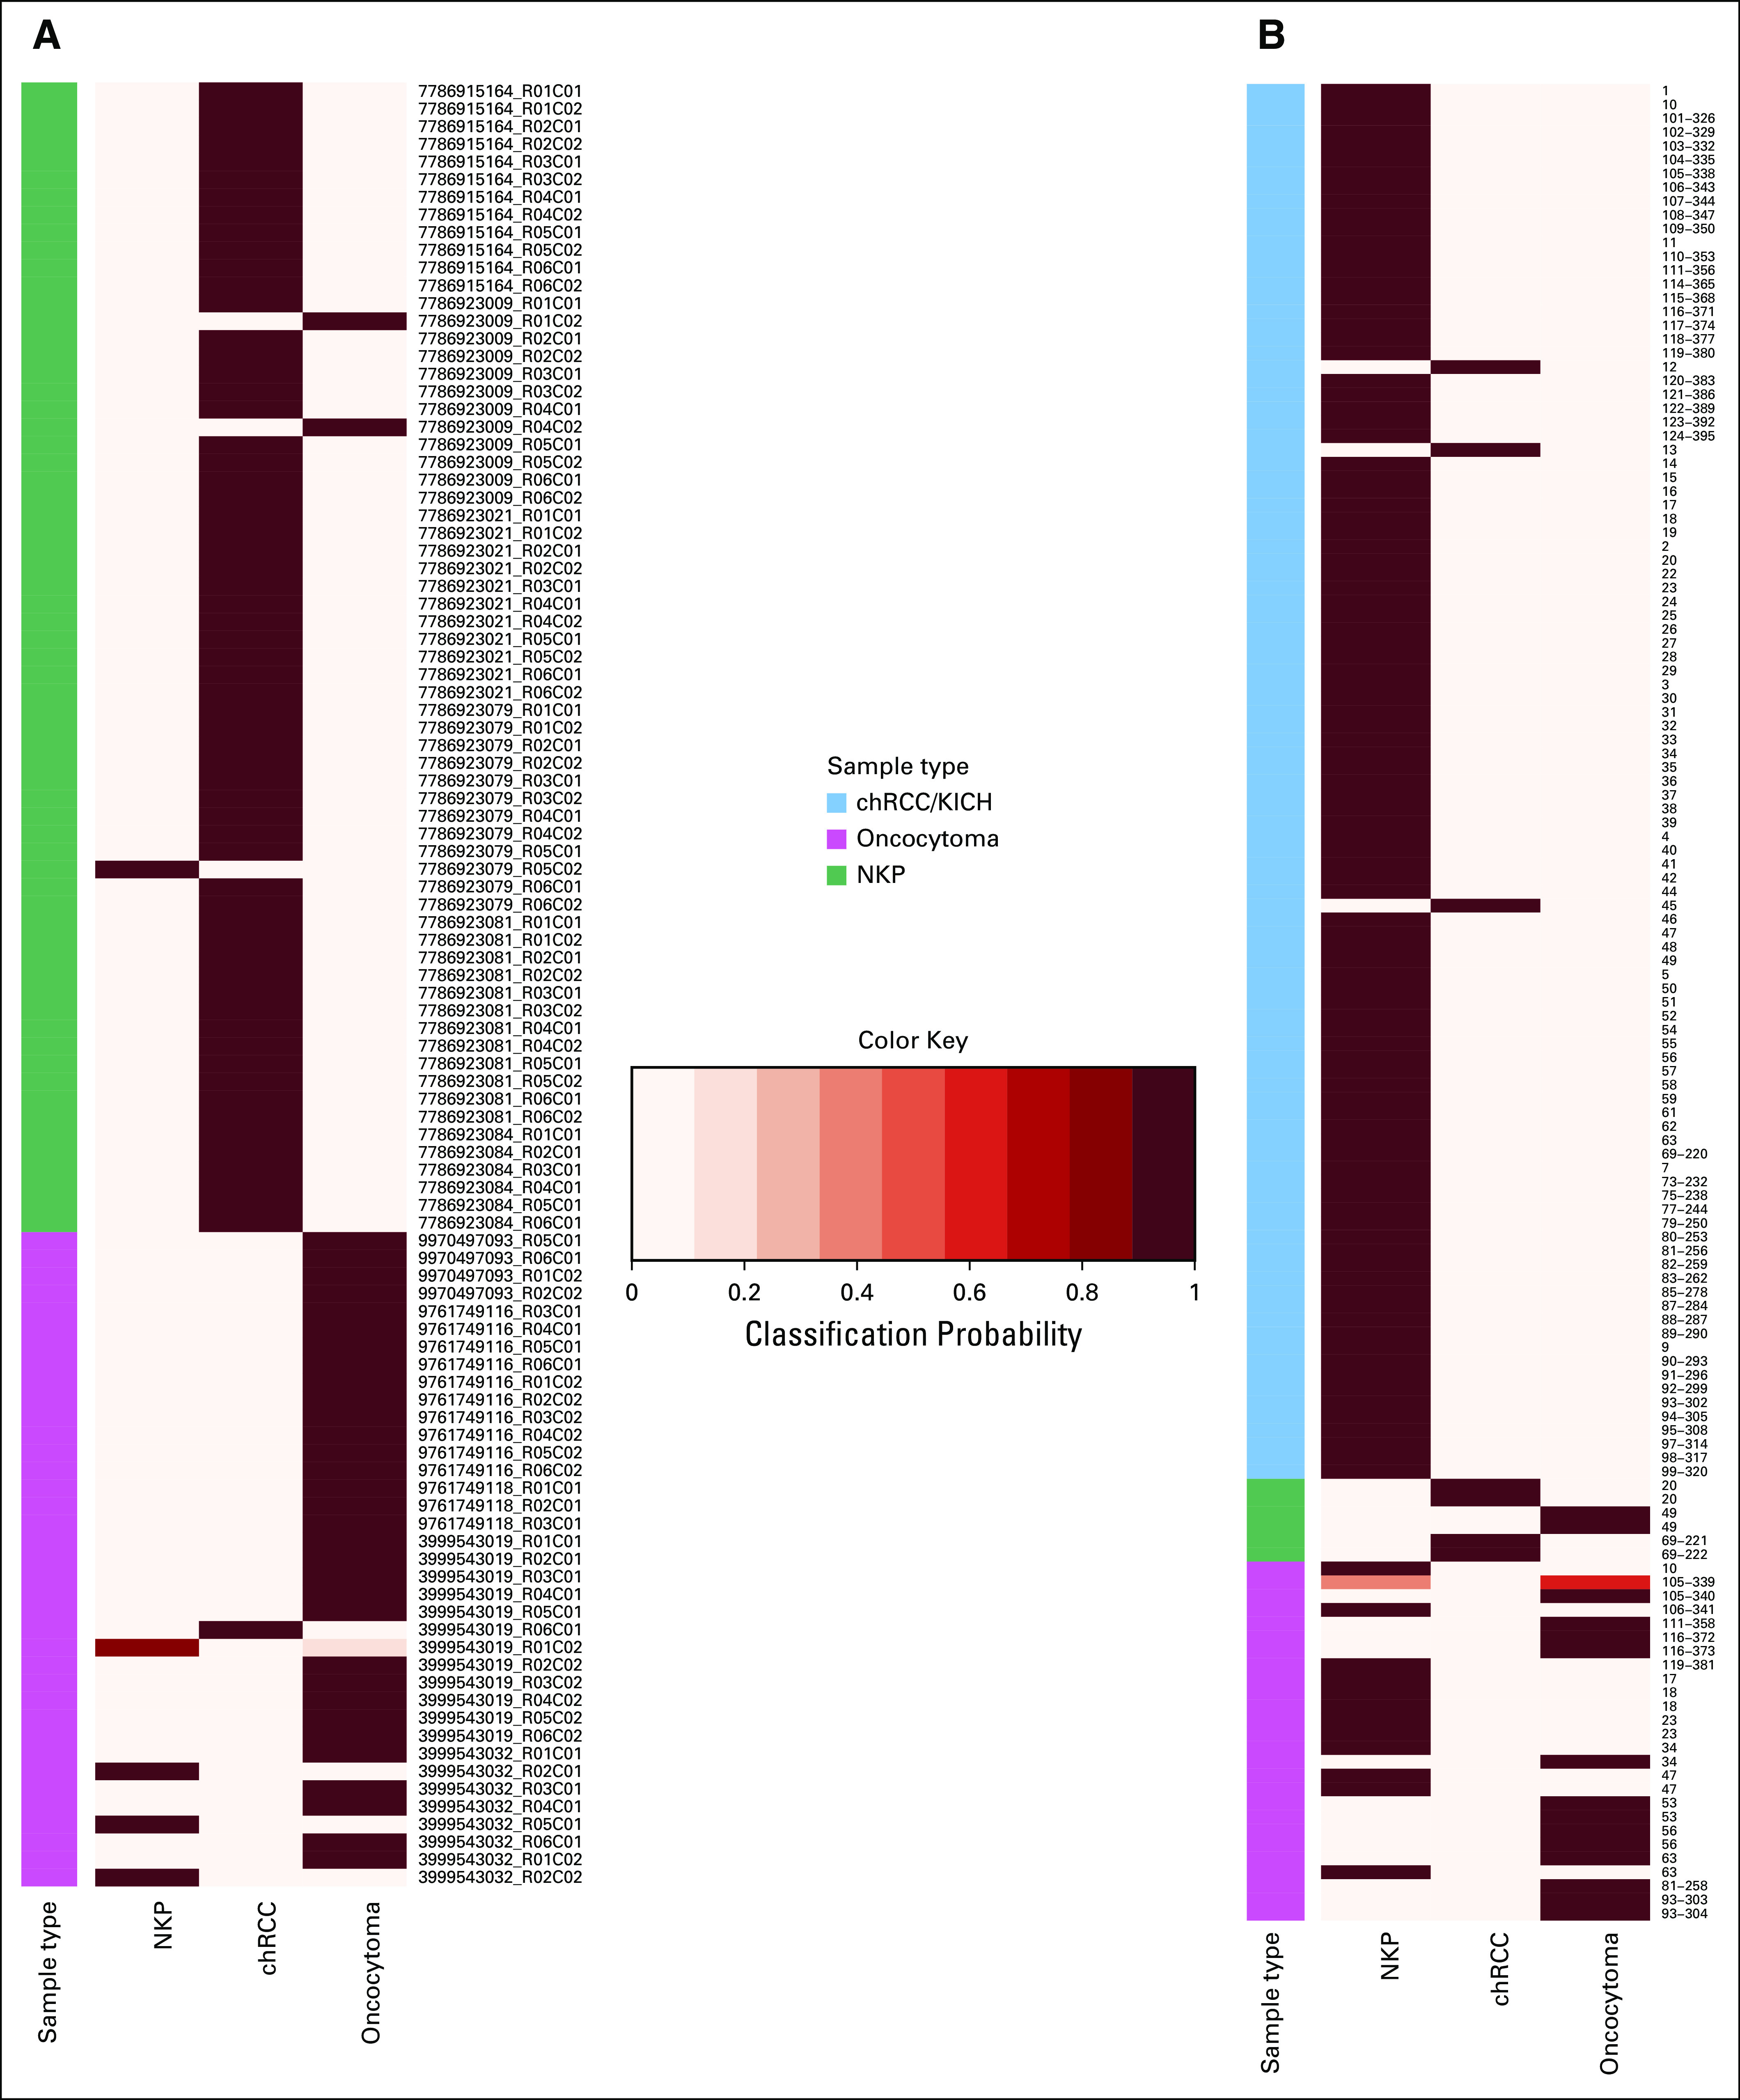
Classification of tumors and core needle biopsy specimens from an independent patient study by a diagnostic model. Heatmaps illustrating posterior probability (classification probability) for classification of (A) tumors and (B) core needle biopsy specimens from independent patient studies by a methylation-based diagnostic model that was trained to distinguish oncocytoma from chRCC. (A) These validation-set tumors included chRCC tumors from The Cancer Genome Atlas study (n = 65) and oncocytomas from a previous study reported by Chopra et al16 (n = 37). The model was trained using DNA methylation data for Stanford study chRCC, oncocytoma, and NKP samples (training set) to distinguish among these three sample types, and its classification accuracy was then tested using validation-set DNA methylation data. The true histological class of each sample is indicated by the color key, and the probabilities for belonging to each of the three classes (chRCC, oncocytoma, and NKP) are indicated in columns by the heatmap color gradient. (B) Classification of ex vivo core needle biopsy specimens collected from chRCC (n = 6) and oncocytoma tumors (n = 26), as well as NKP tissue samples (n = 101) collected from patients with chRCC, oncocytoma, or other renal mass types (eg, papillary renal cell carcinoma, clear-cell renal cell carcinoma, angiomyolipoma, or other benign renal masses). chRCC, chromophobe renal cell carcinoma; KICH, XXXX; NKP, normal kidney parenchyma.
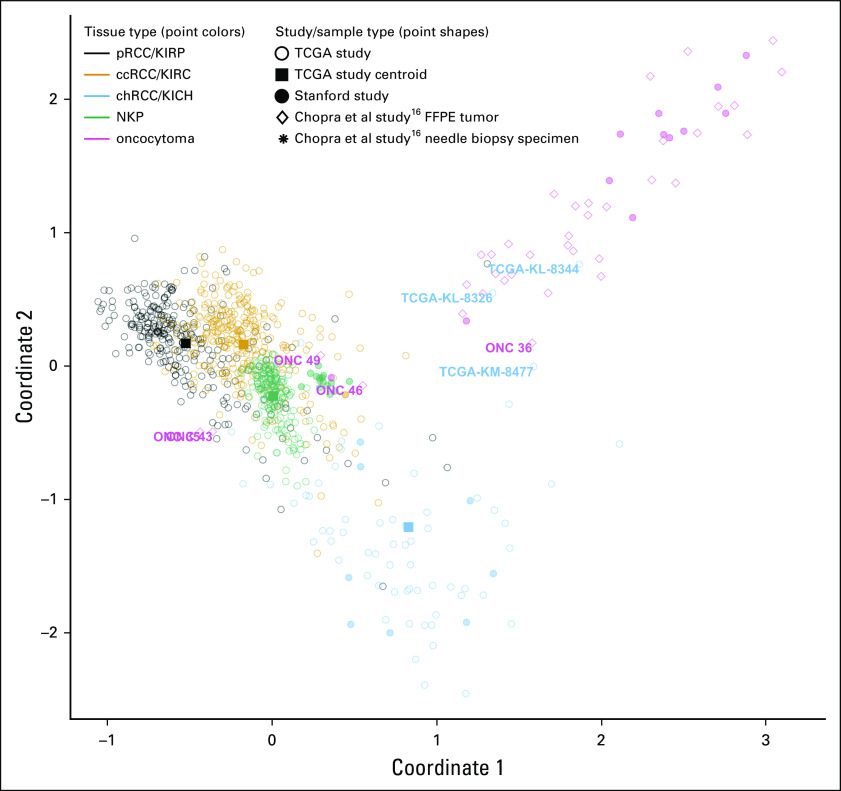
Visual inspection of the separation of Stanford and Chopra et al study oncocytomas from all TCGA samples by the full CpG signature indicated that this signature separates oncocytoma not only from chRCC but from all tissue types included in the analysis (Fig 5). Moreover, this signature separated oncocytomas from both the eosinophilic and classic subtypes of chRCC to a similar extent (Data Supplement), despite the much greater histological and genetic similarity of eosinophilic chRCC to oncocytoma.17,19 This suggests it is possible to detect oncocytoma against a background of NKP and distinguish oncocytoma from all RCC subtypes using a manageable number of CpGs.
FIG 5.
Multidimensional scaling plot illustrating similarity of tumors from the Chopra et al study16 to Stanford and TCGA samples based on the diagnostic methylation signature. Multidimensional scaling (MDS) plots illustrating patient samples from three studies in terms of their DNA profiles. Classic MDS was applied to methylation data for 61 cytosine-phosphate-guanine sites (CpGs) that were included within the 79 CpGs model that could distinguish oncocytoma from chRCC (as illustrated in Fig 3B). These 61 CpGs represent those for which data were available for all three studies. Open circles represent TCGA patient samples. Filled squares represent centroids for each of the TCGA sample groups. Closed circles represent Stanford study patient samples. MDS illustrates the similarity of Chopra et al16 study tumors to each of the sample classes. Text labels indicate samples that were misclassified by our methylation models. ccRCC, clear-cell renal cell carcinoma; chRCC, chromophobe renal cell carcinoma; FFPE, formalin-fixed, paraffin-embedded; KICH, kidney chromophobe (TCGA study abbreviation); KIRC, kidney renal clear cell carcinoma (TCGA study abbreviation); KIRP, kidney renal papillary cell carcinoma (TCGA study abbreviation); NKP, normal kidney parenchyma; pRCC, papillary renal cell carcinoma; TCGA, The Cancer Genome Atlas.
Development of a Minimal CpG Diagnostic Model
We investigated the minimal number of CpGs needed to establish a diagnostic model that could robustly distinguish oncocytoma from chRCC. This analysis revealed a set of 30 CpGs that could distinguish oncocytoma from chRCC with optimal accuracy (ie, with accuracy equivalent to a model using all 79 differentially methylated CpGs) within both the Stanford data set and validation Chopra data set (Data Supplement). These 30 CpGs represent those with the highest discriminatory value to distinguish between oncocytoma and chRCC, as indicated in the Data Supplement.
Investigation of Ability of a Diagnostic Model to Distinguish Core Needle Biopsy Specimens From Oncocytoma and chRCC
As a preliminary investigation of the utility of DNA methylation data to differentially diagnose oncocytoma from chRCC within presurgical biopsy specimens, we tested the ability of our 79 CpGs model to distinguish chRCC (n = 6), oncocytoma (n = 26), and NKP (n = 101) samples that were collected as ex vivo core needle biopsy specimens reported by Chopra et al.16 Classification accuracy for core needle biopsy specimens was considerably lower than those for tumor samples that were collected (multiple-class AUC, 0.73; Data Supplement). Moreover, the accuracy when considering only classifications for tumor biopsy specimens (ie, oncocytoma and chRCC biopsy specimens, excluding NKP biopsy specimens) was particularly low (multiple-class AUC, 0.45). Twelve of 26 oncocytomas (46%) were misclassified as NKP and had methylation profiles that clustered with NKP (Data Supplement). We examined if this misclassification could, again, be due to low tumor purity. Indeed, the mean tumor purity score for misclassified oncocytoma tumors was lower than for correctly classified oncocytoma biopsy specimens (Data Supplement). Moreover, the mean purity score for misclassified oncocytoma biopsy specimens was similar to NKP biopsy specimens, whereas correctly classified oncocytoma biopsy specimens had purity scores similar to resected oncocytomas, suggesting the misclassified biopsy specimens contain very low fractions of tumor cells.
We investigated if a tumor purity score could be used as a quality-control measure to exclude biopsy specimens that were below a certain threshold of purity. Indeed, 12 of 13 oncocytoma biopsy specimens with above-median purity were correctly classified as oncocytoma by the diagnostic methylation signature (92% accuracy), compared with only 2 of 13 oncocytoma biopsy specimens with below median purity (15% accuracy).
Of the three patients with chRCC with available duplicate biopsy specimens, one patient had both biopsy specimens misclassified as oncocytoma. Because both biopsy specimens were of high purity, this indicates the potential for generation of false-positive results and overdiagnosis when samples are collected by core needle biopsy.
DISCUSSION
We classified the DNA methylome of oncocytoma in terms of its similarity to NKP and three RCC subtypes. This revealed that oncocytomas are more similar to chRCC than other RCC subtypes at the level of DNA methylation. And the finding confirms the molecular similarity of oncocytoma to chRCC, which was suggested by a previous study8 that reported similar co-clustering of oncocytoma and chRCC on the basis of gene expression.
A surprising finding of our study was that oncocytoma features more extensive abnormal DNA methylation than does chRCC. This contrasts with the genetic profiles of oncocytoma and chRCC, because chRCC features several concurrent nuclear genome alterations, whereas oncocytomas have few nuclear genome alterations.20 The authors of a recent study8 classified oncocytoma into two subtypes on the basis of their genetic profiles, including a relatively benign subtype, and a subtype with more mutations that they speculated could progress to chRCC. Our observation of greater epigenetic deregulation in oncocytoma than chRCC conflicts with the hypothesis that oncocytoma represents a precursor to chRCC.8 In addition to the previously reported observations that oncocytomas possess genetic alterations that are rare in chRCC,8.21 our observation of epigenetic deregulation in oncocytoma that is absent in chRCC suggests oncocytoma represents a distinct entity.
Although oncocytoma is considered benign,22 rare cases of metastatic oncocytoma have been reported.23 Noting the challenges in diagnosing oncocytoma, there is debate as to whether these seemingly malignant oncocytoma cases should be classified as oncocytoma, because they could represent eosinophilic chRCCs or ccRCCs that have been misdiagnosed as oncocytoma because of similar histological profiles. On the basis of these observations, we suggest that our DNA methylation signature be applied to future cases of malignant tumors that are diagnosed histologically as oncocytoma, to determine if these cases truly represent oncocytomas. This signature could help determine if oncocytoma is universally benign, which would indicate a need for deintensification of oncocytoma treatment.
Despite the overall molecular similarity of chRCC to oncocytoma, we identified a methylation signature that can robustly distinguish oncocytoma from chRCC in clinical tumor samples using as few as 30 CpGs. This signature includes hypermethylated genes in oncocytoma that were previously reported as expression markers of oncocytoma, suggesting that differential methylation represents the underlying cause of this differential expression. Notably, we observed hypermethylation of two CpGs within the promoter of KRT7, lower expression of which distinguishes oncocytoma from chRCC.24,25
Despite our focus on distinguishing oncocytoma from chRCC specifically, we observed that the signature also separated oncocytoma from ccRCC and pRCC, as well as NPK. This suggests that, using this signature alone, it could be possible to detect and distinguish oncocytoma from any RCC subtype against a background of NKP. This signature could be developed as a diagnostic biomarker to distinguish oncocytoma from chRCC using existing technologies.26 This would prevent misdiagnosis that could result in undertreatment of chRCC and overtreatment of oncocytoma.7 Moreover, this signature could help automate the labor-intensive process of pathological diagnosis, perhaps in combination with signatures that classify other RCC subtypes.27
We tested the ability of our signature to classify oncocytoma in ex vivo core needle biopsy specimens as a preliminary investigation of whether it might be possible to diagnose oncocytoma using percutaneous renal mass biopsy specimens. Preoperative diagnosis of oncocytoma would enable patients to forego unnecessary surgery or to minimize the need for surveillance after a percutaneous ablation. Initially, the diagnostic signature in biopsy specimens did not appear to provide any diagnostic value, because 12 of 14 oncocytoma biopsy specimens were misclassified as NKP. We found, however, that the lower accuracy in biopsy samples could be explained by biopsy specimen impurity. This suggests that it could be possible to diagnose oncocytoma by applying our diagnostic signature in combination with measures to optimize biopsy specimen purity and by excluding impure biopsy specimens as inadequate. When applied to biopsy specimens with greater than median tumor purity, our signature classified biopsy specimens with 92% accuracy. Although the current threshold of tumor purity needed to achieve accurate classification of needle biopsy specimens by our diagnostic signature is high, reducing the overtreatment of even half of oncocytomas would avoid thousands of unnecessary surgeries. Potential optimization approaches that might help to improve the classification accuracy are outlined in the Data Supplement.
A limitation of our study is the modest sample size, which limits our ability to establish a reliable estimate of the diagnostic accuracy of the signature. Follow-up research is needed to validate this signature as a biomarker to diagnose oncocytoma in patient populations and to confirm that the signature can accurately classify pure needle biopsy specimens.
SUPPORT
Supported by the Stanford Cancer Institute, Population Science Pilot Award (M.H., J.B., J.L., O.G.); and a Cambridge/Canary Pump Priming Award 2018 (J.L., O.G., C.M., G.S.); and by The Fund for Innovation in Cancer Informatics, the National Institute of Biomedical Imaging and Bioengineering of the National Institutes of Health Grants No. R01 EB020527 and R56 EB020527, and National Cancer Institute Grants No. U01 CA217851 and U01 CA199241 (all to O.G.). The content is solely the responsibility of the authors and does not necessarily represent the official views of the National Institutes of Health.
DATA AVAILABILITY STATEMENT
All R code required to reproduce the results are available at https://github.com/gevaertlab/methylation-based-diagnostic-signature-to-distinguish-renal-cell-carcinoma-from-oncocytoma. All the original data generated as part of this study have been submitted to Gene Expression Omnibus: Accession No. GSE156932.
AUTHOR CONTRIBUTIONS
Conception and design: Kevin Brennan, James D. Brooks, Megan P. Hitchins, John T. Leppert, Olivier Gevaert
Financial support: Megan P. Hitchins, John T. Leppert, Olivier Gevaert
Administrative support: Grant D. Stewart, Olivier Gevaert
Provision of study material or patients: Thomas J. Metzner, Chia-Sui Kao, James D. Brooks, John T. Leppert
Collection and assembly of data: Kevin Brennan, Thomas J. Metzner, Chia-Sui Kao, Megan P. Hitchins, John T. Leppert, Olivier Gevaert
Data analysis and interpretation: All authors
Manuscript writing: All authors
Final approval of manuscript: All authors
Accountable for all aspects of the work: All authors
AUTHORS' DISCLOSURES OF POTENTIAL CONFLICTS OF INTEREST
The following represents disclosure information provided by authors of this manuscript. All relationships are considered compensated unless otherwise noted. Relationships are self-held unless noted. I = Immediate Family Member, Inst = My Institution. Relationships may not relate to the subject matter of this manuscript. For more information about ASCO's conflict of interest policy, please refer to www.asco.org/rwc or ascopubs.org/po/author-center.
Open Payments is a public database containing information reported by companies about payments made to US-licensed physicians (Open Payments).
Charlie E. Massie
Patents, Royalties, Other Intellectual Property: Academic patent pending for cell-free DNA analysis (unrelated to current submissions to ASCO journals) (Inst)
Grant D. Stewart
Honoraria: Pfizer, Merck
Consulting or Advisory Role: CMR Surgical
Research Funding: Pfizer, AstraZeneca
Travel, Accommodations, Expenses: Novartis, Astellas Pharma
James D. Brooks
Stock and Other Ownership Interests: Guardant Health
Megan P. Hitchins
Travel, Accommodations, Expenses: Epigenomics
John T. Leppert
Stock and Other Ownership Interests: Calcula
Oliver Gevaert
Research Funding: Paragon Development Systems (Inst), Lucence Diagnostics (Inst)
No other potential conflicts of interest were reported.
REFERENCES
- 1.Siegel RL, Miller KD, Jemal A. Cancer statistics, 2020. CA Cancer J Clin. 2020;70:7–30. doi: 10.3322/caac.21590. [DOI] [PubMed] [Google Scholar]
- 2.Hsieh JJ, Purdue MP, Signoretti S, et al. Renal cell carcinoma. Nat Rev Dis Prim. 2017;3:17009. doi: 10.1038/nrdp.2017.9. [DOI] [PMC free article] [PubMed] [Google Scholar]
- 3.Wobker SE, Williamson SR. Modern pathologic diagnosis of renal oncocytoma. J Kidney Cancer VHL. 2017;4:1–12. doi: 10.15586/jkcvhl.2017.96. [DOI] [PMC free article] [PubMed] [Google Scholar]
- 4.Sohlberg EM, Metzner TJ, Leppert JT. The harms of overdiagnosis and overtreatment in patients with small renal masses: A mini-review. Eur Urol Focus. 2019;5:943–945. doi: 10.1016/j.euf.2019.03.006. [DOI] [PubMed] [Google Scholar]
- 5.Kim JH, Li S, Khandwala Y, et al. Association of prevalence of benign pathologic findings after partial nephrectomy with preoperative imaging patterns in the United States from 2007 to 2014. JAMA Surg. 2019;154:225–231. doi: 10.1001/jamasurg.2018.4602. [DOI] [PMC free article] [PubMed] [Google Scholar]
- 6.Lindgren D, Eriksson P, Krawczyk K, et al. Cell-type-specific gene programs of the normal human nephron define kidney cancer subtypes. Cell Rep. 2017;20:1476–1489. doi: 10.1016/j.celrep.2017.07.043. [DOI] [PubMed] [Google Scholar]
- 7.Ng KL, Rajandram R, Morais C, et al. Differentiation of oncocytoma from chromophobe renal cell carcinoma (RCC): Can novel molecular biomarkers help solve an old problem? J Clin Pathol. 2014;67:97–104. doi: 10.1136/jclinpath-2013-201895. [DOI] [PubMed] [Google Scholar]
- 8.Joshi S, Tolkunov D, Aviv H, et al. The genomic landscape of renal oncocytoma identifies a metabolic barrier to tumorigenesis. Cell Rep. 2015;13:1895–1908. doi: 10.1016/j.celrep.2015.10.059. [DOI] [PMC free article] [PubMed] [Google Scholar]
- 9.Kryvenko ON, Jorda M, Argani P, et al. Diagnostic approach to eosinophilic renal neoplasms. Arch Pathol Lab Med. 2014;138:1531–1541. doi: 10.5858/arpa.2013-0653-RA. [DOI] [PMC free article] [PubMed] [Google Scholar]
- 10.Gorin MA, Rowe SP, Allaf ME: Oncocytic neoplasm on renal mass biopsy: A diagnostic conundrum. Oncol; United States: 2016. [PubMed] [Google Scholar]
- 11.Klutstein M, Nejman D, Greenfield R, et al. DNA methylation in cancer and aging. Cancer Res. 2016;76:3446–3450. doi: 10.1158/0008-5472.CAN-15-3278. [DOI] [PubMed] [Google Scholar]
- 12.Tusher VG, Tibshirani R, Chu G. Significance analysis of microarrays applied to the ionizing radiation response. Proc Natl Acad Sci USA. 2001;98:5116–5121. doi: 10.1073/pnas.091062498. [DOI] [PMC free article] [PubMed] [Google Scholar]
- 13.Tibshirani R, Hastie T, Narasimhan B, et al. Diagnosis of multiple cancer types by shrunken centroids of gene expression. Proc Natl Acad Sci USA. 2002;99:6567–6572. doi: 10.1073/pnas.082099299. [DOI] [PMC free article] [PubMed] [Google Scholar]
- 14.Cedoz PL, Prunello M, Brennan K, et al. MethylMix 2.0: An R package for identifying DNA methylation genes. Bioinformatics. 2018;34:3044–3046. doi: 10.1093/bioinformatics/bty156. [DOI] [PMC free article] [PubMed] [Google Scholar]
- 15.Qin Y, Feng H, Chen M, et al. InfiniumPurify: An R package for estimating and accounting for tumor purity in cancer methylation research. Genes Dis. 2018;5:43–45. doi: 10.1016/j.gendis.2018.02.003. [DOI] [PMC free article] [PubMed] [Google Scholar]
- 16.Chopra S, Liu J, Alemozaffar M, et al. Improving needle biopsy accuracy in small renal mass using tumor-specific DNA methylation markers. Oncotarget. 2017;8:5439–5448. doi: 10.18632/oncotarget.12276. [DOI] [PMC free article] [PubMed] [Google Scholar]
- 17. doi: 10.1016/j.ccr.2014.07.014. Davis CF, Rickets CJ, Wang M, et al: The somatic genomic landscape of chromophobe renal cell carcinoma. Cancer Cell 26:319-330, 2014 . [DOI] [PMC free article] [PubMed] [Google Scholar]
- 18. doi: 10.1038/nature12222. Creighton C, Morgan M, Gunaratne D, et al: Comprehensive molecular characterization of clear cell renal cell carcinoma. Nature 499:43-49, 2013. [DOI] [PMC free article] [PubMed] [Google Scholar]
- 19.Gopal RK, Calvo SE, Shih AR, et al. Early loss of mitochondrial complex I and rewiring of glutathione metabolism in renal oncocytoma. Proc Natl Acad Sci USA. 2018;115:E6283–E6290. doi: 10.1073/pnas.1711888115. [DOI] [PMC free article] [PubMed] [Google Scholar]
- 20.Kürschner G, Zhang Q, Clima R, et al. Renal oncocytoma characterized by the defective complex I of the respiratory chain boosts the synthesis of the ROS scavenger glutathione. Oncotarget. 2017;8:105882–105904. doi: 10.18632/oncotarget.22413. [DOI] [PMC free article] [PubMed] [Google Scholar]
- 21.Wilhelm M, Veltman JA, Olshen AB, et al. Array-based comparative genomic hybridization for the differential diagnosis of renal cell cancer. Cancer Res. 2002;62:957–960. [PubMed] [Google Scholar]
- 22.Wobker SE, Przybycin CG, Sircar K, et al. Renal oncocytoma with vascular invasion: A series of 22 cases. Hum Pathol. 2016;58:1–6. doi: 10.1016/j.humpath.2016.07.020. [DOI] [PubMed] [Google Scholar]
- 23.Cacciamani G, Cima L, Ficial M, et al. Liver metastases from renal oncocytoma with vascular extension. Appl Immunohistochem Mol Morphol. 2017 doi: 10.1097/PAI.0000000000000490. [DOI] [PubMed] [Google Scholar]
- 24.Adley BP, Papavero V, Sugimura J, et al. Diagnostic value of cytokeratin 7 and parvalbumin in differentiating chromophobe renal cell carcinoma from renal oncocytoma. Anal Quant Cytol Histol. 2006;28:228–236. [PubMed] [Google Scholar]
- 25.Leroy X, Moukassa D, Copin MC, et al. Utility of cytokeratin 7 for distinguishing chromophobe renal cell carcinoma from renal oncocytoma. Eur Urol. 2000;37:484–487. doi: 10.1159/000020172. [DOI] [PubMed] [Google Scholar]
- 26.Melnikov AA, Scholtens D, Talamonti MS, et al. Methylation profile of circulating plasma DNA in patients with pancreatic cancer. J Surg Oncol. 2009;99:119–122. doi: 10.1002/jso.21208. [DOI] [PubMed] [Google Scholar]
- 27.Lasseigne BN, Burwell TC, Patil MA, et al. DNA methylation profiling reveals novel diagnostic biomarkers in renal cell carcinoma. BMC Med. 2014;12:235. doi: 10.1186/s12916-014-0235-x. [DOI] [PMC free article] [PubMed] [Google Scholar]
Associated Data
This section collects any data citations, data availability statements, or supplementary materials included in this article.
Data Availability Statement
All R code required to reproduce the results are available at https://github.com/gevaertlab/methylation-based-diagnostic-signature-to-distinguish-renal-cell-carcinoma-from-oncocytoma. All the original data generated as part of this study have been submitted to Gene Expression Omnibus: Accession No. GSE156932.


