Supplemental Digital Content is available in the text.
Keywords: bibliometrics, category normalized citation impact, publications, PubMed, specialization index
Abstract
Bibliometric analysis, a powerful tool for assessing trends in research output, was employed to analyze the evolution of hypertension research over a 20-year period. The analysis was based on 90 308 original articles and a citation analysis. The use of bibliometric as a potential tool for shaping research policy at the institution or country level was also explored. The number of published hypertension articles increased by 43.5% over the 20-year period. By contrast, the increase in the number of articles in all medical disciplines was 96%, and in the cardiovascular field was 64%. Of the 6 countries producing the largest number of articles, the United States was consistently the major contributor. There was a slight decrease from Japan, a slight increase from the United Kingdom, and relatively stable output from Germany and Italy over the study period. Output from China showed the strongest growth. The trends in Specialization Index and Category Normalized Citation Impact varied by country. In Russia, Poland, and Brazil, increases in output were greater for hypertension research than for medical research in general. The United Kingdom and Denmark had greater hypertension research output than the other countries. VOSviewer analysis showed an intensification of collaborations between countries and a shift, over 10 years, from 3 clusters towards 2 clusters. Such analysis may help to shape research policy at the country level and can be similarly performed for institutions. Historical changes in hypertension research can be monitored over decades if the same channels continue to be used for communication of scientific results.
Graphic Abstract—
A graphic abstract is available for this article.
See Editorial, pp 1423–1424
MEDLINE remains to date the largest publications database in the biomedical field. This fact, together with free access via the PubMed portal, has led to the database being widely used by researchers for literature reviews, meta-analyses, and bibliographic research. Over the past 20 years, there has been rapid development in bibliometric analyses. In 1999, ≈160 articles about bibliometrics were published and made accessible via PubMed; in 2019, this figure had risen to 850. In total, >11 000 bibliometric articles were published and made accessible via PubMed in this time period.
Bibliometric assessments provide objective data on scientific output in a disciplinary field (eg, physics, mathematics, biology), a medical specialty (eg, cardiology, radiology), or a disease area (eg, tuberculosis, brain tumors, or hypertension).1–3 Comparisons are commonly made between countries, institutions, and disciplines, and temporal trends are frequently analyzed. Bibliometrics is also very important in providing information that helps a nation to shape its research policy (eg, determining support for centers of scientific excellence or for specific research related to local public health needs).4–6
Bibliometrics uses metrics (indicators) to evaluate research performed in countries, institutions, or disease areas. For example, we can cite the main university rankings: the Shanghai ranking,7 the Leiden ranking,8 or the Times Higher Education ranking.9 Use of overall scores is attractive because it appears to be straightforward. For this reason, scores are often reported in the media. However, interpretation of these scores merits careful consideration—and often requires more in-depth analysis. Recently, recommendations have been made to promote ethical use of bibliometrics to minimize abuse, especially with regard to the calculation of indicators at the individual level.10,11
Calculations of the various bibliometric indicators are performed using software that analyses the corpus of publications based on queries, either on addresses (rankings) or on key words (disease areas), with risks of errors related to the query terms. In general, the number of documents returned by these types of query can reach several thousands; it would, therefore, be very difficult to check manually how each item corresponds to the field being investigated. However, it is important to check the aptness of the queries used via sampling.
We have previously conducted a bibliometric analysis of the scientific output in hypertension. As there were few data already available on the scientific output on hypertension, we assessed trends in European research into hypertension between 1997 and 2016.12 This assessment made it possible to compare the scientific output of the European Union with that of the United States and a few other large countries, as well as the impact of this research in terms of citations. It did not include the use of the Specialization Index (SI), and therefore, did not take into account the overall biomedical research output of these countries, so we could not assess whether hypertension research was more or less developed than the overall biomedical research of each country. This assessment made it possible to compare the scientific output of the European Union with that of the United States and a few other large countries, as well as the impact of this research in terms of citations.
The objectives of the present study of hypertension research are (1) to verify whether the trends observed up to 2016 are continued in 2017 and 2018; (2) to identify the 20 countries contributing most to hypertension research output over 4 periods of 5 years; (3) to look for possible links between country specialization and scientific impact; and (4) to discuss how these results contribute to understanding of the research policies of different countries, and whether they could influence these policies by providing a reasoning framework that can be used within each country by research institutions or hypertension societies.
Methods
Data were extracted from the PubMed database13 using a query based on MeSH major topics14 and titles. PubMed does not allow analyses based on addresses or citations.
Analysis was performed on articles published in the period 1999 to 2018, examining four 5-year periods within this time span (1999–2003, 2004–2008, 2009–2013, and 2014–2018).
Bibliometric analysis was, therefore, performed using InCites, an analytical tool developed and marketed by Clarivate Analytics15 and based on data indexed in Web of Science. Only documents defined as an article in Web of Science were included in the analysis; other documents such as recommendations, guidelines, reviews, letters, or editorials were excluded.
The authors declare that all supporting data are available within the article and in the Data Supplement.
Search Terms
We used a specific query that we had applied in our previous work on hypertension.12 This query was reviewed to exclude heart failure. MeSH terms are available only for articles already indexed in MEDLINE; therefore, we also searched the PubMed database based on the article title and a list of journals specializing in hypertension. The manual review of each summary of the top 1% most cited articles were performed to exclude pathologies not related to hypertension. The item “heart failure”, as other exclusion terms, was specifically eliminated from the search. Research was focused on original articles to look for new contributions to knowledge.
A detailed analysis was performed on articles published in the 2 most recent periods (2009–2013 and 2014–2018) and classified in the top 1% (ie, the 1% most cited articles globally, adjusted by publication year and Web of Science category) to verify the validity of the query.
After several iterations, the following search string was used in this study.
((Hypertension[majr] OR Antihypertensive Agents[majr] OR Pheochromocytoma[majr] OR Hyperaldosteronism[majr] OR Renin[majr] OR Angiotensin-Converting Enzyme Inhibitors[majr] OR Aldosterone[majr] OR Renin–Angiotensin System[majr] OR Angiotensin II[majr] OR Receptors, Angiotensin[majr] OR Angiotensinogen[majr] OR Vascular Stiffness[majr] OR Angiotensin II Type 1 Receptor Blockers[majr] OR Angiotensin Receptor Antagonists[majr] OR hypertension[ti] OR aldosteron*[ti] OR angiotensin*[ti] OR hyperaldosteronism[ti] OR pheochromocytoma[ti] OR renin*[ti] OR ‘arterial stiffness’[ti] OR ‘vascular stiffness’[ti]) OR (J Hypertens[Journal] OR Hypertension[Journal] OR Am J Hypertens[Journal] OR J Hum Hypertens[Journal] OR J Renin Angiotensin Aldosterone Syst[Journal]) NOT (‘Hypertension, Pulmonary’[mh] OR ‘Ocular Hypertension’[mh] OR ‘Hypertension, Portal’[mh] OR ‘Heart Failure’[mh] OR pulmonary[ti] OR Intracranial[ti] OR ’Practice Guideline’[Publication Type] OR Guideline[Publication Type])) AND ‘journal article’[Publication Type]
Analysis
After extraction, data were transferred into InCites for analysis of several bibliometric indicators relating to countries. We first looked at the number of documents identified in PubMed, then the number of documents found in Web of Science after transfer, and finally, the number of documents declared as articles in InCites.
We then looked at the contributions from major countries to the global output, assessed on the basis of the number of articles that had authors from each country.
In addition, 2 other bibliometric indicators were computed.
The SI is the ratio of the percentage of articles from a given country relating to specific disease area to the percentage of articles about the same disease area worldwide. If the index is >1, the country is regarded as having an over-specialization in that disease area; if it is <1, the country is regarded as having an under-specialization.
The Category Normalized Citation Impact (CNCI) of an article is the ratio of the observed number of citations to the expected number of citations (defined as the mean number of citations for all articles published in the same year in the same Web of Science category). Using a normalized bibliometric indicator compensates for the fact that the number of citations of an article is influenced partly by the year of publication (older articles have had more opportunity to be cited) and the size of the scientific field.
Finally, we identified collaborations between countries for articles classified in the top 10% (ie, the 10% most cited articles globally, adjusted by publication year, and Web of Science category) in the periods 1999 to 2003 and 2014 to 2018. We used the VOSviewer software developed by the Centre for Science and Technology Studies (the bibliometric department of Leiden University, Leiden, the Netherlands) to enable collaborations between researchers, institutions, or countries to be visualized.16,17 The software allows to visualize the collaborations between the authors of a list of publications. A classification method, using a metric based on the number of co-authored articles, allows countries or researchers to be grouped into different groups (clusters), researchers belonging to the same group having a high level of collaboration. Then, a 2-dimensional representation is used to visualize the resulting clusters. The size of each colored circle is proportional to the total number of articles from that country or author, and the distance between 2 circles is inversely proportional to the number of cooperative articles. The thickness of the connecting lines reflects the strength of collaborations. Colors are used by the software to differentiate clusters. On the basis of authors ‘addresses, the same technique can be applied to institutions. The number of researchers, institutions, or countries to be considered in the analysis is based on the choice of a minimum number of articles or citations.
Results
Our literature search identified 127 786 documents in PubMed for the period 1999 to 2018. Of these, 100 789 were indexed in Web of Science and were available via the InCites platform and 90 308 were declared to be original articles (70.7%). The percentage of PubMed documents that were indexed in Web of Science and declared to be articles remained at a similar level over the 20-year period (Table S1 and Graph S1 in the Data Supplement).
Figure 1 shows the trends in research output for the 6 countries that had >5000 articles related to hypertension over the past 20 years. The United States output remained predominant over this period and showed an increase overall in the number of articles published. There was a slight decrease in output overall from Japan, a slight increase in output from the United Kingdom and a relatively stable output from Germany and Italy. Most notable was the growth in output from China. At a worldwide level, however, the growth in the number of articles was less for hypertension (+43%) than for all biomedical articles (+96%) or cardiovascular articles (+64%; Table S2).
Figure 1.
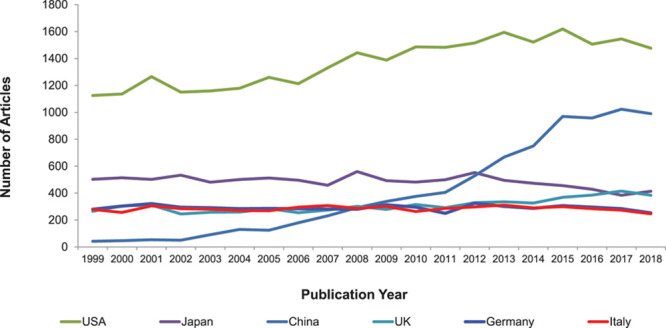
Numbers of articles by year of publication for the 6 countries that had a total of >5000 articles related to hypertension over the 20-year study period.
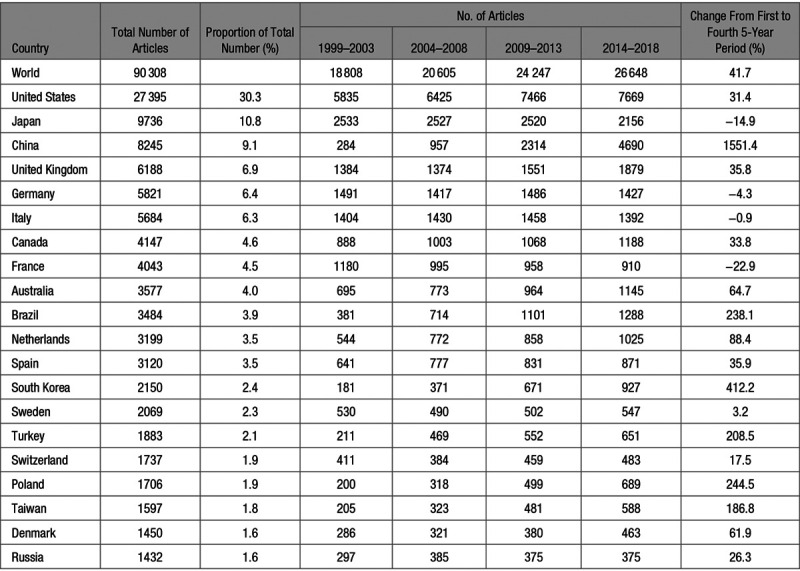
Table 1 lists the 20 countries with the most hypertension-related articles published in the period 1999 to 2018. As well as presenting the total number of articles by country and globally, the table shows the corresponding market share for each country, the number of articles published in the four 5-year study periods, and the percentage change in the number of published articles from the first to the last 5-year period. Worldwide, there was an increase of 41.7% from the first to the last period. The country with the greatest percentage increase in hypertension research output was China (+1551%), followed by South Korea (+412%), Poland (245%), Brazil (+238%), Turkey (+208%), and Taiwan (+187%). The hypertension research output from France (−23%) and Japan (−15%) decreased slightly. Numbers of articles by year of publication are available in Table S3.
Table 1.
The 20 Countries Contributing the Most Hypertension-Related Articles Published Between 1999 and 2018, Listed by Decreasing Number of Articles
We then investigated whether these trends were specific to hypertension research or reflected general trends in biomedical research in these countries.
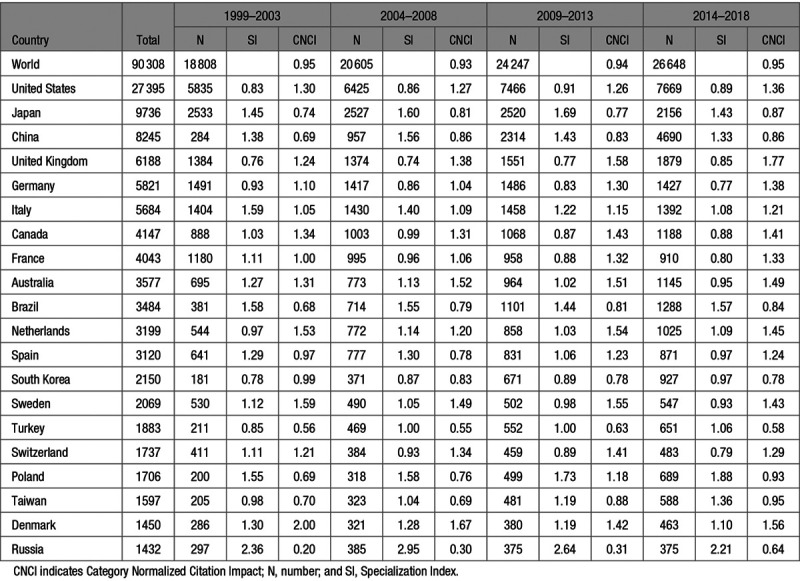
Table 2 shows that the CNCI for the global output is close to 0.95 level for all four 5-year periods, which means that research in hypertension is cited to a similar extent to research in other disease areas. At the country level, SIs and CNCIs vary across study periods and from one country to another.
Table 2.
Specialization Indices and CNCIs for the 20 Countries Contributing the Most Articles for the Four 5-Year Periods, Listed by Decreasing Number of Articles
To interpret the trends better, SIs were plotted against CNCIs for each of the 20 countries for the first and last of the 5-year study periods (Figure 2). The sizes of the bubbles are proportional to the number of articles published. We noticed marked changes over time for some countries. Russia showed a small increase in SI but a large increase in CNCI; Taiwan increased both its SI and its CNCI; and Poland strongly increased its SI and slightly increased its CNCI. Italy slightly increased its CNCI but sharply decreased its SI. The United Kingdom and Denmark increased their SI slightly. United Kingdom sharply increased its CNCI while Denmark sharply decreased its CNCI. For China, little change was seen in SI and CNCI, though the bubble size (number of articles) increased markedly. Other countries showed relatively little change.
Figure 2.
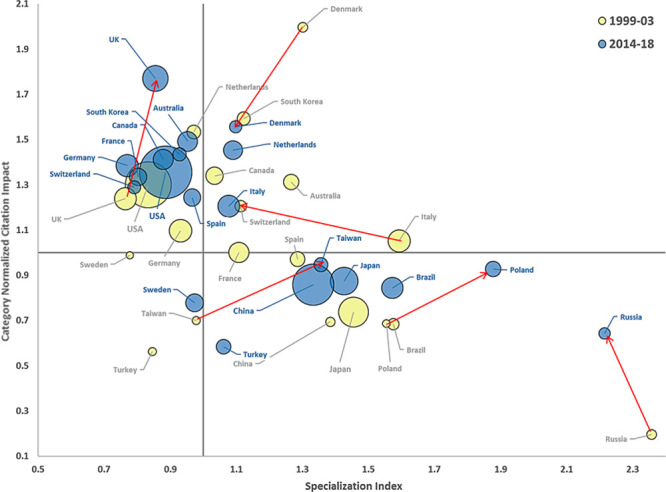
Changes in specialization indices and Category Normalized Citation Impacts for the periods 1999–2003 to 2014–2018 for the 20 countries making the most contribution to hypertension research output.
Finally, we looked at collaborations between countries in the first and last 5-year periods. To restrict the analysis to articles with an important scientific impact, we focused on the 10% of articles that were most cited articles in each period. Analysis of these articles was then performed using VOSviewer software (Figure 3). Only countries with at least 25 articles in the top 10% for each of these periods are presented. In the first period, 3 clusters appeared: one focused on countries in the European Union, another focused on Nordic countries, and the third centered on the United States. Germany and United Kingdom, 2 members of the European Union at the time of the study, held one of the central positions. In the last period, 2 clusters were observed: one cluster focused on the United States, United Kingdom, Canada and China, and the other on Germany, Italy, the Netherlands and France. In this last period, the United Kingdom had moved closer to the United States but also remained near of the European cluster. When a similar analysis was conducted for individual investigators in the same 2 periods, the top 10% most cited articles showed complete reorganization of collaborations with different clusters (Graph S4 and Graph S5).
Figure 3.
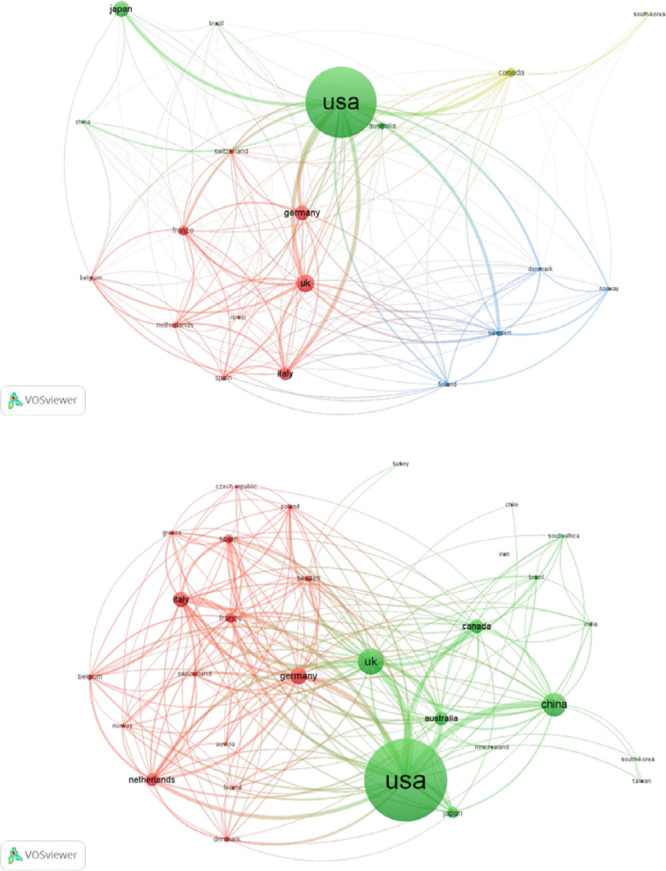
VOSviewer analysis of collaborations for the periods 1999–2003 (Top) and 2014–2018 (bottom), based on the top 10% of articles cited. The size of each colored circle is proportional to the total number of articles with authors from that country. The distance between 2 countries is inversely proportional to the number of articles from those 2 countries.
Discussion
Our bibliometric analysis of the worldwide output of articles in the field of hypertension revealed major changes over the period 1999 to 2018. There has been an increase in the number of articles, an increase in the number of collaborations between countries, and changes in the relative contributions of different countries. The increase in the published research in hypertension is, however, markedly less than the corresponding increase in biomedical fields overall and in cardiovascular research.
Like any bibliometric analysis, the results of our study have been influenced by the database used and the query posed: limiting the analysis to original articles included in Web of Science excluded about 30% of the corpus of articles identified via PubMed. A preliminary analysis of the initial search results from France revealed that the top 10% most cited articles included a number on heart failure (as an initial query had not excluded congestive heart failure). This confusion arose from the multiplicity of actions of the renin–angiotensin aldosterone system and the numerous inhibitors used for indications other than hypertension. In the worldwide results, articles on congestive heart failure accounted for only 3% of the publications, but the impact could have been greater when analyzed at a regional level. Furthermore, the prevalence of heart failure is growing faster than hypertension, which could lead to a marked impact on future searches. This highlights the need not only for skill in data extraction and analysis, but also for expertise in the field to enable verification of the consistency of the results obtained in terms of scientific content, authors, and institutions.
All guidelines and consensus statements were excluded from the analysis because of the absence of transparency in the choice of authors, which is likely to generate differences between recommendations. Georg et al18 compared the bibliographic references for the rationales of 4 guidelines for hypertension management across countries published between 2003 and 2006. Of the total number of references, 1.2%, 2.2%, and 8.8% were common to 4, 3, and 2 authoring bodies, respectively. Park et al19 conducted a bibliometric analysis including co-citation network analysis, which showed major differences in the choice of references; this explains some of the differences between United States and European guidelines.
Our analysis shows that the number of publications alone is not sufficiently informative, because it provides only a volumetric analysis. CNCI, based on the number of citations, investigates the impact of scientific output better than the total number of articles (many of which will never be cited). However, the number of citations can be biased, because reference to an article may be either confirmatory or contradictory. At the country level, China increased its number of publications nearly 16-fold but hardly moved in terms of SI. This means that the observed increase is a general characteristic of scientific output in China during this time period and is not specific to hypertension. When a change in a country SI is observed for one disease compared with others, it raises the question of how research priorities influence output. Changes in SI can also be used to assess the association of scientific output with the burden of disease in the country, and with previous public and private funding.4
For instance, 14% of the global research output on space research comes from France. This is higher than might be expected given that France’s contribution to global research output, and its gross domestic product, both account for ≈4% to 5% of the global total, but reflects the priority that France gives to investment in space research.
Our analysis shows the potential benefit of combined use of SIs and CNCIs. The 2 parameters provide different perspectives and allow identification of different trends in research output. For example, in this study the United Kingdom had a SI slightly below 1 but a CNCI that was gradually increasing. Russia had a high SI during both the first and the last periods but a CNCI that was struggling to increase. China had little movement in either the SI or the CNCI. We can speculate about the causes of over- or under-specialization relating to a given disease area in a given country. It undoubtedly depends on collaboration networks. These will be helped when overseas postdoctoral researchers return to their home countries but continue to collaborate within the framework of international networks, thereby increasing the connections between countries—trends that can be illustrated by VosViewer algorithms.
Analysis of the top 10% most cited articles over the 1999 to 2003 and 2014 to 2018 periods showed some changes in collaborations in hypertension research between the major industrialized countries. There was greater proximity between the United Kingdom and the United States in the last 5-year period compared with first period, although clustering of European countries remained strong. There was also a marked increase in collaborations between China and other regions, particularly North American and European countries. Analysis of collaborations between authors revealed clustering around a few international leaders.
Bibliometric indicators are numerical data that allow sorting and classification. Unfortunately, these indicators are subject to misuse by individuals, institutions, and countries alike, in communicating superficially examined classifications and rankings to university or private bodies for the purpose of regulating careers and research funding, it is much more important to use such data to examine research trends at different levels (eg, countries, universities, research institutions, and hospitals) and to stimulate cooperation rather than to establish rankings.
In conclusion, the profile of hypertension research output has changed dramatically over the past 20 years, and analyzing these changes may be useful for Hypertension Societies all over the world. Although care must be taken when using bibliometric indicators, they can provide insight into the contribution that research groups make within their own country as well as assessing research relationships with other countries. Increased hypertension research output from China in the last 5-year period of this study was seen to correlate with increased collaboration with other nations. Exchange of young researchers and technologies between countries will contribute to advances in hypertension research internationally, which will be particularly important for low- and middle-income countries.
Periodic bibliometric analysis at the national and international level will provide information on trends in hypertension research output. As we have previously shown for European research, bibliometric analysis also reveals where main scientific results are disclosed and compares the evolution of various research fields (eg, epidemiology, genetics, cardiology, endocrinology, and nephrology) and approaches (eg, meta-analyses, socio-economic approaches). Blood pressure research should continue leading instead of behind cardiovascular research, because it is really the converging point of hemodynamics (physics), cell physiology, genetics, clinical investigation, and public health. Blood pressure is the best monitoring and modifiable marker of cardiovascular health. Adoption of a scientific approach instead of simple production of unverified matrices means that periodic bibliometric analysis can provide valuable insights to policy-makers, enabling them to base decisions on objective data.
Perspectives
We are currently considering several further analyses: (1) a more in-depth analysis of selected pathologies within the field of hypertension, such as secondary forms of hypertension; (2) a comparison of research output trends in other disease areas for which the combination of bibliometric and medical skills are useful; and (3) periodic repetition of such analyses to observe the temporal trends in research outputs and eventually to encourage collaborations.
Acknowledgments
We thank Oxford PharmaGenesis, Oxford, United Kingdom for assistance with the editing and formatting of this article. Thanks to the reviewers who allowed us to improve the manuscript.
Sources of Funding
None.
Disclosures
None.
Supplementary Material
Footnotes
The Data Supplement is available with this article at https://www.ahajournals.org/doi/suppl/10.1161/HYPERTENSIONAHA.120.15711.
Novelty and Significance
What Is New?
A worldwide bibliometric analysis of hypertension research output between 1999 and 2018.
Evolution of the research output in hypertension from 20 major countries.
First analysis of specialization and impact of this research.
What Is Relevant?
Major changes in worldwide hypertension research output over the past 20 years.
Complementarity of bibliometric indicators.
Summary
Bibliometrics is an efficient tool contributing to understanding trends in research in a specific field.
Bibliometrics can be used by hypertension societies and policy managers to improve public health and research investments.
References
- 1.Chaw L, Chien LC, Wong J, Takahashi K, Koh D, Lin RT. Global trends and gaps in research related to latent tuberculosis infection. BMC Public Health. 2020;20:352 doi: 10.1186/s12889-020-8419-0 [DOI] [PMC free article] [PubMed] [Google Scholar]
- 2.Pertz M, Popkirov S, Schlegel U, Thoma P. Research on cognitive and sociocognitive functions in patients with brain tumours: a bibliometric analysis and visualization of the scientific landscape. Neurol Sci. 2020;41:1437–1449. doi: 10.1007/s10072-020-04276-x [DOI] [PMC free article] [PubMed] [Google Scholar]
- 3.Oh YS, Galis ZS. Anatomy of success: the top 100 cited scientific reports focused on hypertension research. Hypertension. 2014;63:641–647. doi: 10.1161/HYPERTENSIONAHA.113.02677 [DOI] [PMC free article] [PubMed] [Google Scholar]
- 4.Gross CP, Anderson GF, Powe NR. The relation between funding by the National Institutes of Health and the burden of disease. N Engl J Med. 1999;340:1881–1887. doi: 10.1056/NEJM199906173402406 [DOI] [PubMed] [Google Scholar]
- 5.Luengo-Fernandez R, Leal J, Gray AM. UK research expenditure on dementia, heart disease, stroke and cancer: are levels of spending related to disease burden?. Eur J Neurol. 2012;19:149–154. doi: 10.1111/j.1468-1331.2011.03500.x [DOI] [PubMed] [Google Scholar]
- 6.Gillum LA, Gouveia C, Dorsey ER, Pletcher M, Mathers CD, McCulloch CE, Johnston SC. NIH disease funding levels and burden of disease. PLoS One. 2011;6:e16837 doi: 10.1371/journal.pone.0016837 [DOI] [PMC free article] [PubMed] [Google Scholar]
- 7.ARWU: Academic Ranking of World Universities. http://www.shanghairanking.com/. Accessed June 4, 2020.
- 8.CWTS Leiden Ranking. https://www.leidenranking.com/. Accessed June 4, 2020.
- 9.Times Higher Education (THE) World University Ranking. https://www.timeshighereducation.com/world-university-rankings. Accessed June 4, 2020.
- 10.San Francisco Declaration on Research Assessment. https://sfdora.org/read/. Accessed June 4, 2020.
- 11.Hicks D, Wouters P, Waltman L, de Rijcke S, Rafols I. Bibliometrics: The Leiden Manifesto for research metrics. Nature. 2015;520:429–431. doi: 10.1038/520429a [DOI] [PubMed] [Google Scholar]
- 12.Devos P, Menard J. Bibliometric analysis of research relating to hypertension reported over the period 1997-2016. J Hypertens. 2019;37:2116–2122. doi: 10.1097/HJH.0000000000002143 [DOI] [PMC free article] [PubMed] [Google Scholar]
- 13.PubMed. https://www.ncbi.nlm.nih.gov/pubmed. Accessed June 4, 2020
- 14.InCites, Clarivate Analytics. https://clarivate.com/products/incites/. Accessed June 4, 2020.
- 15.PubMed – Search field descriptions and tags. https://www.ncbi.nlm.nih.gov/books/NBK3827/#pubmedhelp.MeSH_Major_Topic_MAJR. Accessed June 4, 2020.
- 16.VOSviewer – Visualizing scientific landscapes. http://www.vosviewer.com/. Accessed June 4, 2020.
- 17.Van Eck NJ, Waltman L, Dekker R, Van den Berg J. A comparison of two techniques for bibliometric mapping: multidimensional scaling and VOS. J Am Soc Inf Sci Technol. 2010;61:2405–2416 [Google Scholar]
- 18.Georg G, Colombet I, Durieux P, Ménard J, Meneton P. A comparative analysis of four clinical guidelines for hypertension management. J Hum Hypertens. 2008;22:829–837. doi: 10.1038/jhh.2008.99 [DOI] [PubMed] [Google Scholar]
- 19.Park Y, Kim HW, You SC, Hripcsak G, Cho HE, Han JH, Shin SJ, Park RW. Network analysis of citation in hypertension clinical guidelines. Stud Health Technol Inform. 2019;264:1017–1020. doi: 10.3233/SHTI190378 [DOI] [PubMed] [Google Scholar]
Associated Data
This section collects any data citations, data availability statements, or supplementary materials included in this article.


