Supplemental Digital Content is available in the text.
Keywords: blood pressure, body mass index, obesity, registries, twin study
Abstract
Blood pressure (BP) and obesity phenotypes may covary due to shared genetic or environmental factors or both. Furthermore, it is possible that the heritability of BP differs according to obesity status—a form of G×E interaction. This hypothesis has never been tested in White twins. The present study included 15 924 White male twin pairs aged between 15 and 33 years from the National Academy of Sciences–National Research Council World War II Veteran Twin Registry. Systolic and diastolic BPs, as well as height and weight, were measured at the induction physical examination. Body mass index (BMI) was used as the index of general obesity. Quantitative genetic modeling was performed using Mx software. Univariate analysis showed that narrow sense heritabilities (95% CI) for systolic BP, diastolic BP, height, and BMI were 0.401 (0.381–0.420), 0.297 (0.280–0.320), 0.866 (0.836–0.897), and 0.639 (0.614–0.664), respectively. Positive phenotypic correlations of BMI with systolic BP (r=0.13) and diastolic BP (r=0.08) were largely due to genetic factors (70% and 86%, respectively). The gene-BMI interaction analysis did not show any support for a modifying effect of BMI on genetic and environmental influences of systolic BP and diastolic BP. Our results suggest that correlations between BP and BMI are mainly explained by common genes influencing both. Higher BMI levels have no influence on the penetrance of genetic vulnerability to elevated BP. These conclusions may prove valuable for gene-finding studies.
Essential hypertension refers to a clinically significant increase in blood pressure (BP) without identifiable cause and constitutes an important risk factor for cardiovascular disease.1 However, until the recent advent of very large genome-wide association studies, identification of risk alleles for hypertension or BP has been difficult even though the influence of genetic factors has been well-described with twin-based heritabilities for systolic BP (SBP) and diastolic BP (DBP) in the 40% to 60% range.2,3 One potential reason for the initial lack of success of gene-finding studies is that main effects are masked by gene-environment interaction effects.4 That is, genetic effects on BP may only come to expression after exposure to certain environments or an unhealthy lifestyle characterized by obesity (as measured by body mass index [BMI]). Another interesting question is the extent to which genetic influences on SBP and DBP can be explained by genes predisposing to obesity. The National Academy of Sciences–National Research Council (NAS-NRC) World War (WW) II Veteran Twin Registry of White male twin pairs5 had their height, weight, and BP measured at the induction physical examination, which offers a unique opportunity to investigate the following questions: (1) the relative influence of genetic and environmental factors on height, weight, BMI, and BP (SBP and DBP); (2) the extent to which genetic and environmental influences on SBP and DBP are shared with those influencing BMI; (3) whether BMI has any modifying effect on genetic and environmental influences on SBP and DBP.
Methods
Data Availability
All the data used in the current study are available without any financial charge through the National Archive of Computerized Data on Aging.6,7
Participants and Measurements
Our research participants were all from the WW II Veteran Twin Registry including 15 924 pairs of White, male, veteran twin pairs born in the United States between 1917 and 1927, both of whom served in the military during WW II or the Korean conflict. This historic cohort study was established in the early 1960s and is maintained by the NAS-NRC.5,8 All measurements were collected at the induction physical examination taking place between 1934 and 1957. Height of participants was measured to the closest quarter inch and weight to the nearest pound as part of a standardized protocol.9 Data were converted to kilograms and meters to calculate BMI as weight/height2 (kg/m2). BP was recorded using a single measurement with a standard sphygmomanometer. Values that deviated >4 SD from the mean were scrutinized and resulted in exclusion from further analyses of the 2 lowest values for height (<1.45 m), the 2 lowest values for SBP (<75 mm Hg), and the 25 lowest (≤45 mm Hg) and 2 highest values (≥118 mm Hg) for DBP. For BMI, the 2 largest values (>40 kg/m2) and 3 very low BMI values (<15.1 kg/m2) of monozygotic twins that were considered implausible based on the twin1 versus twin2 scatterplot were set to missing. For weight, no exclusions were necessary.
Zygosity Classification
Both members of each twin pair were asked 2 key zygosity questions. The first question was based on similarity, “As children, were you and your twin alike as 2 peas in a pod or of only ordinary family resemblance?” The other question captures confusion of identity, “In childhood, did your parents, brothers and sisters, or teachers have trouble in telling you apart?” If answers to both questions were “yes” by one or both cotwins, the pair was classified as monozygotic. Similarly, a “no”-“no” response led to a classification of the pair as dizygotic. If fingerprint and physical characteristics, only available in about 18% of the twin pairs, were consistent with questionnaire assignment of zygosity, the pairs were classified by questionnaire data. Otherwise, the pairs were categorized as unknown for zygosity, along with pairs with incomplete or conflicting responses. A total of 2391 pairs had unknown zygosity in the panel.8,10
More recently, DNA genotyping was used in 578 pairs from various substudies to reclassify zygosity.11 Responses to the two zygosity questions were coded ranging from 1 (yes-yes) to 6 (no-no) and regressed on the DNA-based zygosity in these 578 pairs using a logistic regression model. Absolute intrapair differences of height and weight were tested as additional independent variables. However, only weight was retained in the model as height did not contribute significantly. The accuracy of this model for predicting zygosity was 94.1% compared with the DNA classification. Subsequently, we applied this logistic regression model to all remaining 15 346 twin pairs in the registry for which DNA fingerprinting was not available to predict their zygosity probability.
Analytical Approach
Structural equation modeling was used to analyze the twin data and estimate the relative influence of genetic and environmental factors, as well as their interactions. Structural equation modeling of twin data is based on modeling the variance-covariance matrices in monozygotic and dizygotic twin pairs and allows the quantification of the sources of individual differences by separation of observed phenotypic variance into additive genetic (A), common (shared) environmental (C) or dominant genetic (D), and unique (or nonshared) environmental (E) components. The initial full model was based on the pattern of correlations within zygosity groups indicating either shared environment or dominance variance: ACE if the dizygotic correlation was larger than half the monozygotic correlation and ADE if the dizygotic correlation was smaller than half the monozygotic correlation.12
To properly account for the inaccuracy of zygosity assignment and still make optimal use of all available data, we used a mixture distribution approach for predicted zygosity probability as described by Neale13 in all models. This probability of being monozygotic ranged from zero (dizygotic) to 1 (monozygotic). That is, the study population of twin pairs was considered to consist of a mixture of 2 zygosity groups. The likelihood of observed scores of twin pairs may be computed as a weighted sum of the monozygotic and dizygotic likelihoods with the zygosity probabilities P(monozygotic) and P(dizygotic)=1−P(monozygotic) used as weights.
Models were fitted to the raw data using normal theory maximum likelihood allowing inclusion of incomplete data, for example, when data were only available in one twin or one of the variables in the bivariate model. We first fitted saturated and univariate models to, respectively, estimate monozygotic/dizygotic correlations and variance components for height, weight, BMI, SBP, and DBP. To investigate the shared extent of genetic and environmental influences of BMI with SBP and DBP, bivariate structural equation modeling was performed using a so-called Cholesky decomposition (Figure S1 in the Data Supplement). This bivariate model not only estimates the heritability of BMI and BP but also the overlap of A, C, D, and E components underlying the two traits expressed as correlations, for example, the genetic correlation equals rg=COVA(BMI, BP)/√(VABMI×VABP), where COVA is the additive genetic covariance and VA is the additive genetic variance. Whether the genes influencing BP are the same as those that affect BMI was determined by testing the significance of a21 and a22 (a21=0 means no correlation; a21≠0 and a22≠0 means they are partly correlated; a22=0 means the correlation is perfect).14,15 The 95% CIs of the A, D, and E components in the bivariate model were estimated using bootstrapping.16 The number of samples was set to 3000 while using 100% of the original sample size. We then fitted the gene-environment interaction models as described by Purcell17 using BMI as a continuous moderator and incorporating all available twin pairs (Figure S2). In this gene-environment interaction model, the phenotypic variance of the outcome variables (SBP and DBP) was portioned into A, C, and E components, with the path coefficients associated with each variable expressed as linear functions of the moderator (eg, A+T×M, C+U×M, and E+V×M), in which M represents the value of the moderator and B represents the linear effect of the moderator (BMI) on the mean outcome (BP). Because we were primarily interested in the effects of BMI on the variance components, we included B into the model to prevent errors of inference. That is, by including the effect of BMI into the model, we guarded against detecting G×E that is actually due to gene-environment correlation (rGE). A significant compromise of model fit when parameters T, U, and V were fixed to zero would indicate significant moderation of additive genetic, common environmental, and unique environmental variance by BMI, respectively. For example, a significant moderation of additive genetic variance alone would suggest that the magnitude of the heritability of SBP changes as the moderator increases or decreases. Variance components were only tested for significance if the respective interaction terms had been dropped from the model; for example, A was not tested unless T was not significant, to avoid modeling interactions in the absence of the main effects. In the final model, all parameters were retained that could not be removed from the model without a significant reduction in model fit. BMI may be correlated with the genetic effects on BP (rGE) rather than modifying the genetic effects on BP (G×E). However, entering BMI in the mean model to allow for a main effect would effectively remove from the covariance model any genetic effects that may be shared between BP and BMI (a21 in Figure S1). Thus, any interactions detected will not be due to gene-environment correlation (rGE) but will instead be interactions between BMI and the variance components specific to BP.
SBP, DBP, height, weight, and BMI were log-transformed to obtain a better approximation of the normal distribution. The effect of age was regressed on the log-transformed SBP, DBP, height, weight, and BMI before using the residuals in model fitting. To obtain the heritabilities for SBP and DBP independent of obesity, we additionally adjusted for BMI in a second univariate model. For the gene-BMI interaction analysis, only SBP and DBP were log-transformed.
The significance of variance components A and C (or D) and moderator effects T, U, and V were assessed by testing deterioration in model fit after each component was dropped from the full model. To account for the fact that we tested multiple (sub)models and that (very) small effects tend to become significant given our very large sample size, we decided to use a slightly conservative P of 0.01 as our level of significance. Standard likelihood ratio χ2 tests were used to select the best-fitting model in combination with Akaike Information Criterion (χ2−2df). Generally, the lowest Akaike Information Criterion indicates the best balance of goodness of fit and parsimony. To apply the mixture distribution approach for predicted zygosity probability as described by Neale,13 genetic modeling was conducted with classic Mx software.16 For each of the 3 types of twin models (univariate, bivariate, and G×BMI interaction), see example Mx scripts in the Data Supplement.
Results
Table 1 presents basic demographic information of the sample. The participants, aged between 15 and 33 years at the time of the measurements, comprised White male twin pairs of whom 5957 were monozygotic, 7576 were dizygotic, and 2391 were pairs of unknown zygosity. Age, height, weight, BMI, SBP, and DBP were all similar among these 3 groups. Rates of missing values were very low for anthropometric measures (between 0.09% and 0.12%) but ≈11% for BP and similar between zygosity groups (Table 1). Height, weight, and BMI did not show clinically meaningful differences between those with or without missing BP values. However, the group with missing BP values was on average 1.15 years older, and they entered the military ≈2 years earlier (Table 2). We see a relatively large proportion of missing BP values during the steep rise in new recruits in the early years of the Second WW between 1941 and 1942 (Figure).
Table 1.
Basic Characteristics of Participants
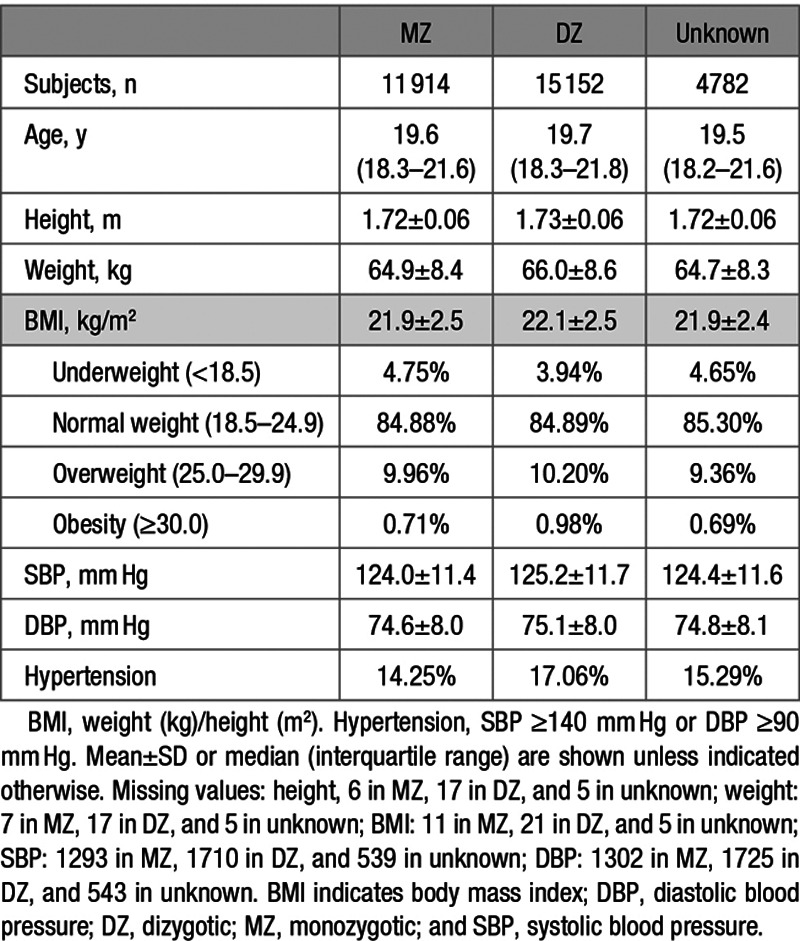
Table 2.
Basic Characteristics of Participants With Missing BP Data Compared With Those Without Missing BP Data
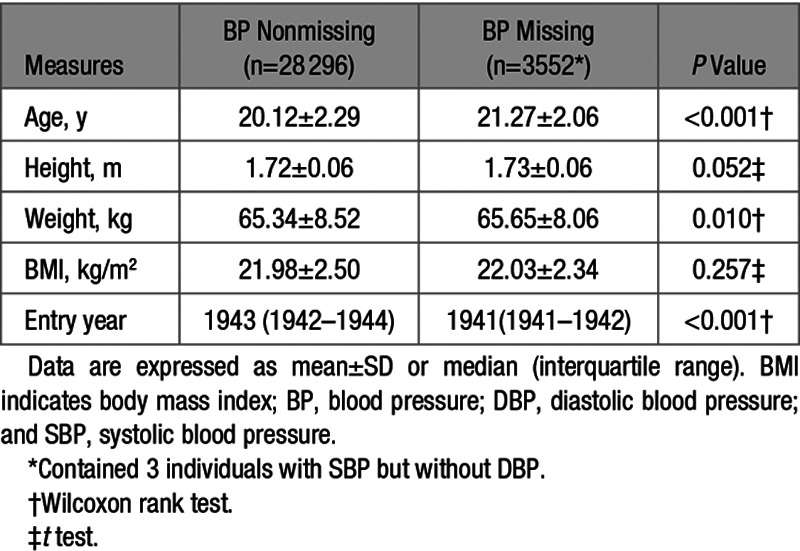
Figure.
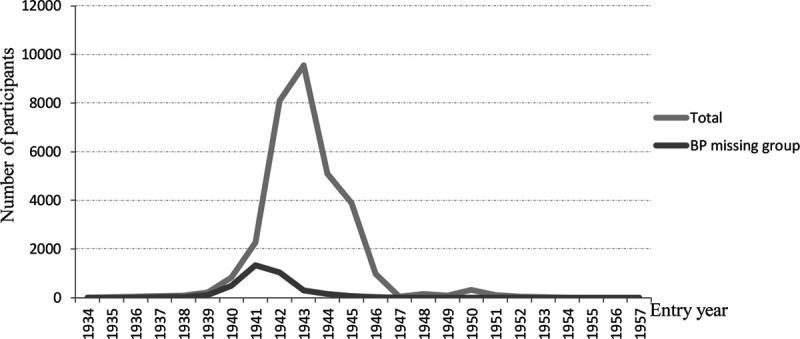
Distribution of the number of participants by entry year of the total cohort and the subgroup with missing blood pressure (BP) data.
The predicted zygosity probability was used in all model-fitting analyses. Correlations within monozygotic and dizygotic twin pairs for SBP, DBP, and BMI were estimated in the saturated model and presented in Table 3. Based on the patterns of twin correlations, we chose an ACE model for SBP and height and ADE models for DBP, weight, and BMI. However, correlations of dizygotic pairs for both SBP and DBP were approximately equal to half the values of monozygotic correlations, which suggested that the AE model likely provides the most parsimonious model.
Table 3.
Twin Correlations and Parameter Estimates of Best-Fitting Univariate Models
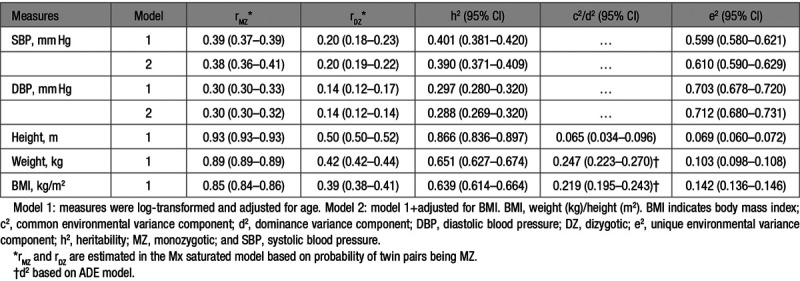
Results of univariate analysis indeed confirmed that the AE model was the best-fitting model for SBP and DBP, whereas the full ACE model for height and ADE model for weight and BMI were the best, respectively. All traits were significantly heritable with narrow sense heritabilities (95% CI) of 0.401 (0.381–0.420) for SBP and 0.297 (0.280–0.320) for DBP, 0.866 (0.836–0.897) for height, 0.651 (0.627–0.674) for weight, and 0.639 (0.614–0.664) for BMI. Heritability estimates (95% CI) for SBP (0.390 [0.371–0.409]) and DBP (0.288 [0.269–0.320]) changed very little when additionally adjusted for BMI.
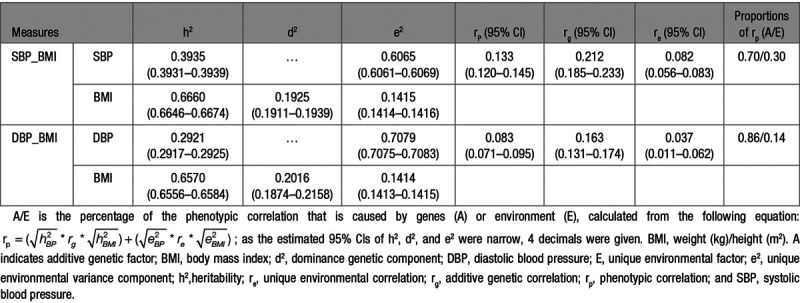
Table 4 shows the results of the 2 bivariate analyses of BMI with (1) SBP and (2) DBP. Phenotypic correlations (95% CI) of BMI with SBP and DBP were 0.133 (0.120–0.145) and 0.083 (0.071–0.095), respectively. Genetic correlations (95% CI) between BMI and BP were 0.212 (0.185–0.233) for SBP and 0.163 (0.131–0.174) for DBP. Unique environmental correlations (95% CI) of BMI with SBP and DBP were relatively low with estimates of 0.082 (0.056–0.083) and 0.037 (0.011–0.062), respectively. Consequently, large proportions of the phenotypic correlations between BMI and BP were due to genetic factors: 70% for SBP and 86% for DBP.
Table 4.
Bivariate Parameter Estimates and 95% CIs of Best-Fitting Models for SBP and DBP With BMI
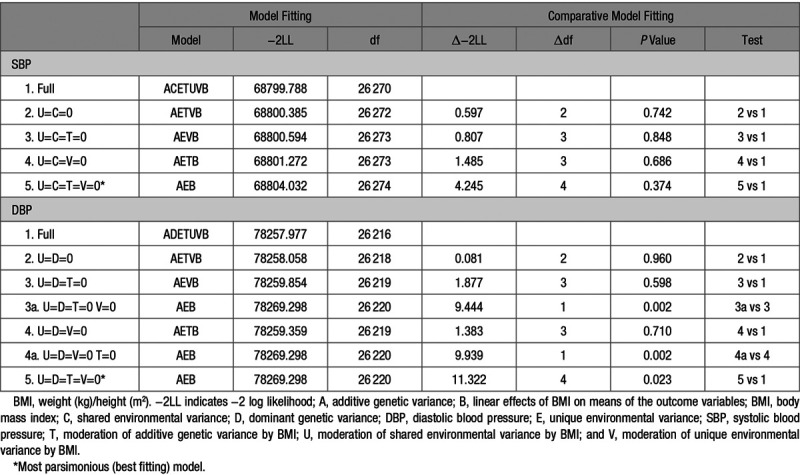
Comparative model fitting was conducted to investigate whether genetic influences on SBP and DBP are dependent on BMI as an environmental moderator (G×E; Table 5). For both SBP and DBP, none of the submodels showed a significant (P<0.01) reduction in fit compared with the full model. U, C, T, and V could be removed from the full model simultaneously. According to the parsimony principle, the AEB model was the best-fitting model, which indicated no moderating effect of BMI on variance components of BP. A graphical representation of the full AETVB model for DBP confirms the lack of a substantial interaction effect on variance components and heritability of DBP (Figure S3).
Table 5.
Comparative Model Fitting for BMI as a Continuous Moderator of SBP and DBP
Discussion
The current study was conducted in the NAS-NRC Veteran Twin Registry—the largest twin registry with measured, as opposed to self-reported, weight, height, and BP—and estimated the relative influence of genetic and environmental factors on height, weight, BMI, SBP, and DBP, as well as the genetic and environmental correlations of BMI with SBP and DBP. Furthermore, the moderating effects of BMI on SBP and DBP heritabilities were tested to explore potential gene-obesity interactions on BP.
Contributions to the total phenotypic variances of SBP and DBP could best be explained by additive genetic and unique environmental components (ie, an AE model) with heritability estimates of about 40% and 30%, respectively. Shared environment did not contribute significantly. For both weight and BMI, significant dominance (25% and 22%) and additive genetic (65% and 64%) components were found. We found the ACE model to be the best-fitting model for height, with a heritability of 87% and a small but significant contribution of shared environment (6.5%). Previously reported heritability estimates of these traits varied widely between different study populations and designs. Estimates for SBP and DBP mostly lie between 40% and 60% in twin studies and between 20% and 40% in family studies.3 Thus, our heritability estimates of 40% for SBP and 30% for DBP are at the lower end of the range typically found in twin studies. This was confirmed by Wang et al18 who conducted a systematic review and meta-analysis on up to 10 613 independent twin pairs from 17 studies in which the weighted mean values for heritability estimates of SBP and DBP were 0.54 (95% CI, 0.48–0.60) and 0.49 (95% CI, 0.42–0.56), respectively, with no significant effects of sex, age, and ethnicity. Another meta-analysis on twin studies from the past 50 years reported monozygotic and dizygotic twin correlations for weight maintenance functions (rmonozygotic=0.810 and rdizygotic=0.437) and height (rmonozygotic=0.908 and rdizygotic=0.543) that were similar to the monozygotic and dizygotic twin correlations in the current study for weight/BMI and height, respectively.19 Another systematic review summarized 32 twin studies of BMI in different ethnic groups and reported a median of BMI heritability of 73%, which varied between 31% and 90%.20 In line with our estimate of 87%, the narrow sense heritability of height is generally reported to be around 80%.21 Thus, our twin correlations and heritability estimates for height, weight, and BMI were similar to those reported in the literature, whereas the heritabilities of 40% for SBP and 30% for DBP were somewhat lower than expected based on previous twin studies. The main reason may be that at the induction physical examination of the WW II military recruits, BP was recorded using only a single measurement with a standard sphygmomanometer. This will likely have introduced some measurement error, which inflates the estimate of unique environmental variance (E), simultaneously reducing the heritability estimate (h2=A/[A+E]). As such, the current very large twin study can be considered to have provided precise but conservative estimates of the total genetic contribution to BP.
Bivariate quantitative genetic models of BMI with SBP and DBP yielded substantial genetic correlations of 0.21 and 0.16 for BMI with SBP and DBP, respectively, highlighting the importance of shared genetic pathways between obesity and high BP. Unique environmental correlations of BMI with SBP and DBP were much lower. Thus, the phenotypic correlations between SBP/DBP and BMI could largely be attributed to genetic factors. This general pattern of results was similar to those from other twin studies of different ethnicities that also investigated genetic and environmental overlap between BMI and BP15,22–24 with this difference that the magnitude of estimates in our study was somewhat lower. Again, the most likely explanation is that BP was only measured once per subject, which will have increased measurement error and reduced the strength of correlations with BMI.
The current gene-BMI interaction analysis did not find any modifying effect of BMI on genetic and environmental influences on SBP and DBP, inconsistent with previous studies of smaller sample sizes. One family-based study, conducted in African, Asian, White, and Hispanic Americans (median age ranged from 32 to 55 years in the different ethnic groups), also investigated the modulation of BP heritability by BMI.25 It found significant BMI interactions for SBP in Asians, Whites, and Hispanic Americans. A gene-BMI interaction for DBP was only found in Asians. The shape of the interaction between BMI and the heritability differed for the population of European ancestry compared with the other 3 ethnic groups. European Americans showed a normal-like distributed SBP heritability that peaked between BMI values of 33 and 37 kg/m2 ranging from about 0.10 (BMI, 20 kg/m2) to 0.55 (BMI, 35 kg/m2). However, the SBP and DBP heritability curves in Japanese and Chinese participants, respectively, were decreasing functions of BMI. Another twin study with 1034 pairs (mean age±SD, 37.81±9.82 years; range, 19.1–81.4 years) using the same interaction modeling method as the current article in Han Chinese also reported decreasing heritability estimates with increasing BMI, from about 0.50 (BMI, 18 kg/m2) to 0.25 (BMI, 35 kg/m2), but no moderation effect was found on DBP.15 Thus the modulation of BP heritability by BMI appears to vary across different ethnic groups, and its overall effect was not found in the current study. However, future genome-wide interaction studies may still identify some specific genetic variants whose effects on BP are modified by BMI. Similar studies have been done for specific exposures such as smoking and alcohol use but not yet for indices of obesity.26,27
The present study was performed in a very large population-based twin registry, which offered ample power to estimate heritabilities, genetic correlations, and interactions. Furthermore, we used an innovative approach to deal with (partly) missing zygosity information by assigning a predicted zygosity probability based on the certainty of the zygosity information compared with DNA fingerprinting in a subsample. These are the main strengths of the current study, but there are also some limitations. All participants were men and aged <33 years, and we observed relatively low prevalences of overweight (≈10%), obesity (≈1%), and hypertension (≈16%) in this relatively young and healthy male twin population. However, BP means and hypertension rates were similar to National Health Examination Survey data from the 1960s on US White males of the same age group.28 Nonetheless, our results may not be generalizable to women or older individuals. More specifically, our lack of G×BMI findings may not generalize to older and less healthy populations who may show moderation of BP heritability with variation in BMI. In addition, anthropometric and BP measurements from the induction physical examination were not originally collected for research purposes, which may have led to increased measurement error, particularly for BP, which was measured only once per subject as mentioned above and a relatively large percentage of missing BP values of around 11%. However, the group with missing BP values did not differ in their height, weight, or BMI. One striking difference was that those that entered the military in the early WW II years of 1941 and 1942 had a relatively large proportion of missing BP values. Most likely, the speed of enrollment in those early war years took precedence over carefully conducting BP measurements in all recruits during the induction exams. Furthermore, BMI was treated and analyzed as an environmental factor in the interaction model, although our bivariate model showed genetic overlap. However, we adjusted for any effects of the moderator (BMI) on the mean BP in the interaction model, thereby ensuring that any interactions detected were not caused by BP-BMI genetic correlations. Our study did not consider any other environmental factors such as smoking, drinking, and diet as potential moderators as these were not available in our data. Finally, the NAS-NRC Veteran Twin Registry included only pairs where both members of the twins were enrolled after passing a health screening (ie, the physical induction examination). As described by Kendler and Holm,29 this selection into the registry affected prevalence and concordance of many major disorders and had differential effects on monozygotic and dizygotic twins: many disorders were more common in dizygotic than in monozygotic twins. Thus, monozygotic twins in the NAS-NRC registry were, on average, healthier than dizygotic twins. However, differential selection into the registry between the different zygosity groups is much less of a concern for the continuous traits of BMI and BP investigated here as confirmed by only minimal differences in mean BMI and BP between monozygotic and dizygotic twins (Table 1).
Perspectives
We found precise but conservative estimates of the total genetic contribution to SBP and DBP of around 40% and 30%, respectively. Correlations between BP and BMI are mainly explained by common genes influencing both. Higher BMI levels have no influence on the penetrance of genetic vulnerability to elevated BP. These findings may prove valuable for gene-finding studies attempting to identify shared genetic pathways (eg, pleiotropic genes) with potential relevance for hypertension treatment but predict that the amount of BP variance explained by specific genetic variants interacting with BMI is limited.
Acknowledgments
We would like to thank all of the twins who participated; William F. Page, Harriet Crawford, and the other staff of the Medical Follow-up Agency at the Institute of Medicine; and the previous members and leadership of the Institute of Medicine Committee on Twins Studies.
Sources of Funding
None.
Disclosures
None.
Supplementary Material
Footnotes
These authors contributed equally to this work.
The Data Supplement is available with this article at https://www.ahajournals.org/doi/suppl/10.1161/HYPERTENSIONAHA.120.15232.
Novelty and Significance
What Is New?
In the largest twin cohort with measured (rather than self-reported) weight, height, and blood pressure (BP), we investigated (1) the relative influence of genetic and environmental factors on height, weight, body mass index (BMI), and BP (systolic BP [SBP] and diastolic BP [DBP]); (2) the extent to which genetic and environmental influences on SBP and DBP are shared with those influencing BMI; (3) whether BMI has any modifying effect on genetic and environmental influences on SBP and DBP.
What Is Relevant?
Precise but conservative heritability estimates were 40% for SBP and 30% for DBP while correlations between BP and BMI are mainly explained by shared genes.
Higher BMI levels have no influence on the penetrance of genetic vulnerability to elevated BP.
Findings may prove valuable for gene-finding studies attempting to identify pleiotropic genes for BP and BMI.
Summary
Our study estimated heritabilities for SBP, DBP, height, and BMI. Genetic rather than environmental factors mainly explained the phenotypic correlations of BMI with SBP and DBP. No modifying effects of BMI on genetic and environmental influences of SBP and DBP were found.
References
- 1.James PA, Oparil S, Carter BL, Cushman WC, Dennison-Himmelfarb C, Handler J, Lackland DT, LeFevre ML, MacKenzie TD, Ogedegbe O, et al. 2014 evidence-based guideline for the management of high blood pressure in adults: report from the panel members appointed to the Eighth Joint National Committee (JNC 8). JAMA. 2014;311:507–520. doi: 10.1001/jama.2013.284427 [DOI] [PubMed] [Google Scholar]
- 2.Evans A, Van Baal GC, McCarron P, DeLange M, Soerensen TI, De Geus EJ, Kyvik K, Pedersen NL, Spector TD, Andrew T, et al. The genetics of coronary heart disease: the contribution of twin studies. Twin Res. 2003;6:432–441. doi: 10.1375/136905203770326439 [DOI] [PubMed] [Google Scholar]
- 3.Wang X, Snieder H. Flynn J, Ingelfinger J, Redwine K. Heritability and familial aggregation of blood pressure. In: Pediatric Hypertension. 2018Springer [Google Scholar]
- 4.Ober C, Vercelli D. Gene-environment interactions in human disease: nuisance or opportunity?. Trends Genet. 2011;27:107–115. doi: 10.1016/j.tig.2010.12.004 [DOI] [PMC free article] [PubMed] [Google Scholar]
- 5.Gatz M, Harris JR, Kaprio J, McGue M, Smith NL, Snieder H, Spiro A, 3rd, Butler DA; Institute of Medicine Committee on Twins Studies. Cohort profile: the National Academy of Sciences-National Research Council twin registry (NAS-NRC twin registry). Int J Epidemiol. 2015;44:819–825. doi: 10.1093/ije/dyu181 [DOI] [PMC free article] [PubMed] [Google Scholar]
- 6.Gatz M, Plassman BL, Tanner CM, Goldman SM, Swan GE, Chanti-Ketterl M, Walters EE, Butler DA. The NAS-NRC twin registry and duke twins study of memory in aging: an update. Twin Res Hum Genet. 2019;22:757–760. doi: 10.1017/thg.2019.45 [DOI] [PMC free article] [PubMed] [Google Scholar]
- 7.Gatz M, Butler DA. National Academy of Sciences-National Research Council Twin Registry (NAS-NRC Twin Registry), 1958-2013 [RESTRICTED]. Inter-university Consortium for Political and Social Research [distributor]. June 29, 2017. 10.3886/ICPSR36234.v5. Accessed July 8, 2020 [DOI]
- 8.Jablon S, Neel JV, Gershowitz H, Atkinson GF. The NAS-NRC twin panel: methods of construction of the panel, zygosity diagnosis, and proposed use. Am J Hum Genet. 1967;19:133–161 [PMC free article] [PubMed] [Google Scholar]
- 9.Fabsitz RR, Carmelli D, Hewitt JK. Evidence for independent genetic influences on obesity in middle age. Int J Obes Relat Metab Disord. 1992;16:657–666 [PubMed] [Google Scholar]
- 10.Hrubec Z, Neel JV. The National Academy of Sciences–National Research Council twin registry: ten years of operation. Prog Clin Biol Res. 1978;24 Pt B:153–172 [PubMed] [Google Scholar]
- 11.Reed T, Plassman BL, Tanner CM, Dick DM, Rinehart SA, Nichols WC. Verification of self-report of zygosity determined via DNA testing in a subset of the NAS-NRC twin registry 40 years later. Twin Res Hum Genet. 2005;8:362–367. doi: 10.1375/1832427054936763 [DOI] [PMC free article] [PubMed] [Google Scholar]
- 12.Snieder H, Boomsma DI, Van Doornen LJ, De Geus EJ. Heritability of respiratory sinus arrhythmia: dependency on task and respiration rate. Psychophysiology. 1997;34:317–328. doi: 10.1111/j.1469-8986.1997.tb02402.x [DOI] [PubMed] [Google Scholar]
- 13.Neale MC. A finite mixture distribution model for data collected from twins. Twin Res. 2003;6:235–239. doi: 10.1375/136905203765693898 [DOI] [PubMed] [Google Scholar]
- 14.Neale MC, Cardon LR. Methodologies for Genetic Studies of Twins and Families. 1992;Dordrecht, the Netherlands: Kluwer Academic Publishers [Google Scholar]
- 15.Wu T, Snieder H, Li L, Cao W, Zhan S, Lv J, Gao W, Wang X, Ding X, Hu Y. Genetic and environmental influences on blood pressure and body mass index in Han Chinese: a twin study. Hypertens Res. 2011;34:173–179. doi: 10.1038/hr.2010.194 [DOI] [PubMed] [Google Scholar]
- 16.Neale MC, Boker SM, Xie G, Maes HH. Mx: statistical modeling. Department of Psychiatry. 2004;6th edn Richmond: Virginia Commonwealth University [Google Scholar]
- 17.Purcell S. Variance components models for gene-environment interaction in twin analysis. Twin Res. 2002;5:554–571. doi: 10.1375/136905202762342026 [DOI] [PubMed] [Google Scholar]
- 18.Wang B, Liao C, Zhou B, Cao W, Lv J, Yu C, Gao W, Li L. Genetic contribution to the variance of blood pressure and heart rate: a systematic review and meta-regression of twin studies. Twin Res Hum Genet. 2015;18:158–170. doi: 10.1017/thg.2015.8 [DOI] [PubMed] [Google Scholar]
- 19.Polderman TJ, Benyamin B, de Leeuw CA, Sullivan PF, van Bochoven A, Visscher PM, Posthuma D. Meta-analysis of the heritability of human traits based on fifty years of twin studies. Nat Genet. 2015;47:702–709. doi: 10.1038/ng.3285 [DOI] [PubMed] [Google Scholar]
- 20.Min J, Chiu DT, Wang Y. Variation in the heritability of body mass index based on diverse twin studies: a systematic review. Obes Rev. 2013;14:871–882. doi: 10.1111/obr.12065 [DOI] [PMC free article] [PubMed] [Google Scholar]
- 21.Visscher PM, McEvoy B, Yang J. From Galton to GWAS: quantitative genetics of human height. Genet Res (Camb). 2010;92:371–379. doi: 10.1017/S0016672310000571 [DOI] [PubMed] [Google Scholar]
- 22.Schieken RM, Mosteller M, Goble MM, Moskowitz WB, Hewitt JK, Eaves LJ, Nance WE. Multivariate genetic analysis of blood pressure and body size. The Medical College of Virginia twin study. Circulation. 1992;86:1780–1788. doi: 10.1161/01.cir.86.6.1780 [DOI] [PubMed] [Google Scholar]
- 23.McCaffery JM, Pogue-Geile MF, Debski TT, Manuck SB. Genetic and environmental causes of covariation among blood pressure, body mass and serum lipids during young adulthood: a twin study. J Hypertens. 1999;1712 Pt 11677–1685. doi: 10.1097/00004872-199917120-00004 [DOI] [PubMed] [Google Scholar]
- 24.Nelson TL, Brandon DT, Wiggins SA, Whitfield KE. Genetic and environmental influences on body fat and blood pressure in African-American adult twins. Int J Obes (Lond). 2006;30:243–250. doi: 10.1038/sj.ijo.0803121 [DOI] [PubMed] [Google Scholar]
- 25.Simino J, Shi G, Weder A, Boerwinkle E, Hunt SC, Rao DC. Body mass index modulates blood pressure heritability: the family blood pressure program. Am J Hypertens. 2014;27:610–619. doi: 10.1093/ajh/hpt144 [DOI] [PMC free article] [PubMed] [Google Scholar]
- 26.Sung YJ, Winkler TW, de Las Fuentes L, Bentley AR, Brown MR, Kraja AT, Schwander K, Ntalla I, Guo X, Franceschini N, et al. ; CHARGE Neurology Working Group; COGENT-Kidney Consortium; GIANT Consortium; Lifelines Cohort Study. A large-scale multi-ancestry genome-wide study accounting for smoking behavior identifies multiple significant loci for blood pressure. Am J Hum Genet. 2018;102:375–400. doi: 10.1016/j.ajhg.2018.01.015 [DOI] [PMC free article] [PubMed] [Google Scholar]
- 27.Feitosa MF, Kraja AT, Chasman DI, Sung YJ, Winkler TW, Ntalla I, Guo X, Franceschini N, Cheng CY, Sim X, et al. ; InterAct Consortium. Novel genetic associations for blood pressure identified via gene-alcohol interaction in up to 570K individuals across multiple ancestries. PLoS One. 2018;13:e0198166 doi: 10.1371/journal.pone.0198166 [DOI] [PMC free article] [PubMed] [Google Scholar]
- 28.Burt VL, Whelton P; Roccella EJ. Prevalence of hypertension in the US adult population: results from the third National Health and Nutrition Examination Survey, 1988–1991. Hypertension. 1995;25:305–313. doi: 10.1161/01.hyp.25.3.305 [DOI] [PubMed] [Google Scholar]
- 29.Kendler KS, Holm NV. Differential enrollment in twin registries: its effect on prevalence and concordance rates and estimates of genetic parameters. Acta Genet Med Gemellol (Roma). 1985;34:125–140. doi: 10.1017/s0001566000004657 [DOI] [PubMed] [Google Scholar]
Associated Data
This section collects any data citations, data availability statements, or supplementary materials included in this article.
Supplementary Materials
Data Availability Statement
All the data used in the current study are available without any financial charge through the National Archive of Computerized Data on Aging.6,7


