

Abstract
Aging is associated with redox imbalance according to the redox theory of aging. Consistently, a mouse model of premature aging (Lmna G609G/+) showed an increased level of mitochondrial reactive oxygen species (ROS) and a reduced basal antioxidant capacity, including loss of the NADPH‐coupled glutathione redox system. Lmna G609G/+ mice also exhibited reduced mitochondrial ATP synthesis secondary to ROS‐induced mitochondrial dysfunction. Treatment of Lmna G609G/+ vascular smooth muscle cells with magnesium‐enriched medium improved the intracellular ATP level, enhanced the antioxidant capacity, and thereby reduced mitochondrial ROS production. Moreover, treatment of Lmna G609G/+ mice with dietary magnesium improved the proton pumps (complexes I, III, and IV), stimulated extramitochondrial NADH oxidation and enhanced the coupled mitochondrial membrane potential, and thereby increased H+‐coupled mitochondrial NADPH and ATP synthesis, which is necessary for cellular energy supply and survival. Consistently, magnesium treatment reduced calcification of vascular smooth muscle cells in vitro and in vivo, and improved the longevity of mice. This antioxidant property of magnesium may be beneficial in children with HGPS.
Keywords: aging, HGPS, magnesium, progeria, vascular calcification
Subject Categories: Metabolism, Chemical Biology
A mouse model of Hutchinson‐Gilford progeria syndrome (HGPS) exhibited reduced ATP availability and elevated oxidative stress, two hallmarks of aging. Treatment with dietary magnesium improved the longevity of HGPS mice.

The paper explained.
Problem
Loss of antioxidant capacity, excessive generation of reactive oxygen species (ROS) and mitochondrial dysfunction contribute to the main symptoms observed in premature aging associated to Hutchinson‐Gilford progeria syndrome (HGPS).
Results
Here, we show that treatment with exogenous magnesium improved the mitochondrial function and reduced oxidative stress both in HGPS mice and vascular smooth muscle cells. Magnesium treatment improved mitochondrial ATP synthesis, and thus greater ATP availability, which is necessary for cellular energy supply and survival. Consistently, magnesium treatment improved mice longevity and reduced vascular calcification.
Impact
This study shows antioxidant properties of magnesium and its capacity to increase the ATP viability in a mouse model of HGPS, which in turn suggest novel possibilities for treating children with HGPS.
Introduction
Hutchinson–Gilford progeria syndrome (HGPS) is an extremely rare, sporadic genetic disorder that is characterized by premature aging and accelerated cardiovascular disease progression, including that of vascular calcification(Nair et al, 2004; Salamat et al, 2010; Hanumanthappa et al, 2011). Most HGPS patients carry a de novo non‐inherited autosomal dominant heterozygous mutation of the LMNA gene (p.G608G in humans; p.G609G in mice) (De Sandre‐Giovannoli et al, 2003; Eriksson et al, 2003). This mutation activates a cryptic splice donor site, which causes synthesis of a lamin A mutant that disrupts nuclear membrane architecture and induces multiple cellular defects, including abnormal gene transcription, signal transduction, and DNA damage. HGPS patients die at a mean age of 13–14 years (a mean of ~38 weeks old in Lmna G609G/+ mice), typically because of a cardiovascular event (Merideth et al, 2008).
Experimental and observational studies have shown that high magnesium intake has beneficial effects on cardiovascular risk factors, mediated by improvements in insulin‐glucose metabolism, endothelium‐dependent vasodilation, and the lipid profile, a reduction in vascular calcification, and the induction of anti‐hypertensive and anti‐inflammatory effects (DiNicolantonio et al, 2018; Rosique‐Esteban et al, 2018). For example, vascular calcification in uremic rats is prevented by magnesium supplementation (Diaz‐Tocados et al, 2017). However, magnesium also plays diverse roles in the pathogenesis of cardiovascular diseases at the biochemical and cellular levels (DiNicolantonio et al, 2018; Rosique‐Esteban et al, 2018).
Magnesium is an essential mineral that serves as a cofactor in more than 300 enzymatic reactions, including those involved in energy metabolism and protein/nucleic acid synthesis. Magnesium is essential for mitochondrial function and particularly for ATP production, and magnesium deficiency is found in cardiovascular disease, type 2 diabetes mellitus, hypertension, heart failure, and ventricular arrhythmia patients (DiNicolantonio et al, 2018; Rosique‐Esteban et al, 2018). In addition, magnesium supplementation improves mitochondrial and cardiac diastolic function in diabetic patients (Liu et al, 2019).
Vascular calcification has been identified in a mouse model of Hutchinson–Gilford progeria syndrome (Villa‐Bellosta et al, 2013). The excessive accumulation of calcium in the vessels of HGPS mice (Osorio et al, 2011) is associated with defective extracellular pyrophosphate metabolism, due to a reduction in ATP synthesis secondary to mitochondrial dysfunction (Villa‐Bellosta et al, 2013).
In the present study, we aimed to determine whether magnesium supplementation ameliorates vascular calcification and improves longevity in Lmna G609G/+ mice.
Results
Magnesium improves Lmna G609G/+ vascular smooth muscle cell (VSMC) viability
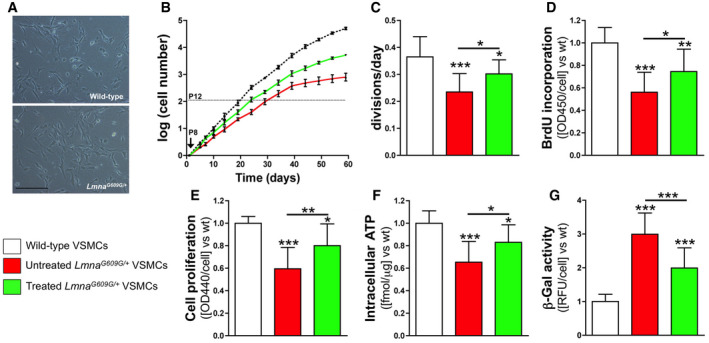
Several studies have shown that the accumulation of DNA damage in cells activates DNA damage and replication checkpoints, which attenuate cell‐cycle progression and arrest replication (Liu et al, 2005, 2006; Varela et al, 2005; Richards et al, 2011; Sieprath et al, 2015). We first performed a comparative analysis of the proliferative ability of primary vascular smooth muscle cells from Lmna G609G/+ mice and their wild‐type littermates. Notably, microscopy images showed an apparent similar cellular morphology in both genotypes during its growth (Fig EV1A). However, Lmna G609G/+ VSMCs exhibited much lower proliferation than control cells (Fig EV1B). The rate of division per day was significantly lower (by 36%) than that of wild‐type control cells (0.36 ± 0.07 versus 0.23 ± 0.06 divisions per day; Fig EV1C; Appendix Table S1).
Figure EV1. Magnesium improves Lmna G609G/+ VSMC viability.
-
ARepresentative microscopy images (10x; scale bar: 100 μm) of wild‐type and Lmna G609G/+ VSMCs at passage 10.
-
BNumber of replicative cells at the indicated times. Cell count begins at passage 8 and ends after 60 days.
-
CMean number of divisions per day over the first 30 days.
-
DReplicative incorporation of 5‐bromodeoxyuridine (BrdU) into DNA.
-
ECell viability measured using the cleavage of tetrazolium salt by cellular mitochondria dehydrogenases.
-
FIntracellular ATP content.
-
Gβ‐galactosidase (β‐Gal) activity.
To determine the status of DNA replication, the replicative incorporation of 5‐bromodeoxyuridine (BrdU) was assessed (Fig EV1D; Appendix Table S1). DNA synthesis in Lmna G609G/+ VSMCs occurred at a 44% slower rate than in wild‐type cells. Notably, Lmna G609G/+ VSMCs incubated in medium containing a high magnesium concentration showed a significantly higher replication rate, both with respect to the number of divisions per day (0.30 ± 0.05), and the replicative incorporation of BrdU (75% of wild type).
Cellular activity, measured as cellular mitochondrial dehydrogenase activity, was significantly lower (by 35%) in Lmna G609G/+ VSMCs than in control cells (Fig EV1E; Appendix Table S1). Moreover, Lmna G609G/+ VSMCs had significantly lower (40%) intracellular ATP concentrations versus control cells (Fig EV1F; Appendix Table S1). In addition, senescence‐associated β‐galactosidase (β‐gal) activity was significantly higher (3‐fold) in Lmna G609G/+ VSMCs than in wild‐type cells (Fig EV1G; Appendix Table S1). Notably, Lmna G609G/+ VSMCs treated with magnesium‐enriched medium showed significantly higher intracellular ATP (24%) and cellular activity (21%) than untreated Lmna G609G/+ VSMCs. In contrast, Lmna G609G/+ VSMCs treated with magnesium‐enriched medium showed significantly lower β‐gal activity (33%) than untreated Lmna G609G/+ VSMCs.
Magnesium improves mitochondrial ATP synthesis in Lmna G609G/+ VSMCs
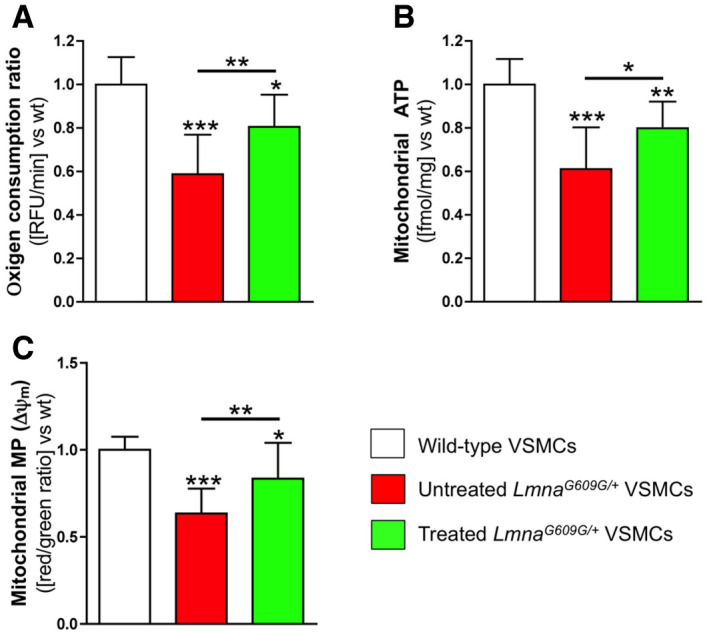
Previous studies have demonstrated mitochondrial dysfunction in progeria (Rivera‐Torres et al, 2013; Villa‐Bellosta et al, 2013; Aliper et al, 2015). Both oxygen consumption ratio (OCR) and ATP synthesis were significantly lower (by 41% and 39%, respectively) in Lmna G609G/+ VSMCs than in wild‐type cells (Fig 1A and B; Appendix Table S2). Moreover, Lmna G609G/+ VSMCs had significantly lower mitochondrial membrane potential (ΔΨm; 37%), assessed using the red‐to‐green ratio of JC‐10 fluorescence, than wild‐type cells (Fig 1C; Appendix Table S2). Notably, Lmna G609G/+ VSMCs showed significant higher ΔΨm (32%), OCR (37%), and mitochondrial ATP synthesis (31%) when incubated in a magnesium‐enriched medium.
Figure 1. Magnesium improves ATP synthesis in Lmna G609G/+ VSMCs.
-
A–C(A) Oxygen consumption ratio, (B) mitochondrial ATP synthesis, and (C) mitochondrial membrane potential (MP), in the indicated VSMC types. Results are presented as the mean ± SD of three independent experiments (four wells per experiment). One‐way ANOVA and Tukey's multiple comparisons post hoc test were used for statistical analysis. *P < 0.05; **P < 0.01; ***P < 0.001.
Source data are available online for this figure.
Magnesium ameliorates mitochondrial oxidative stress in Lmna G609G/+ VSMCs
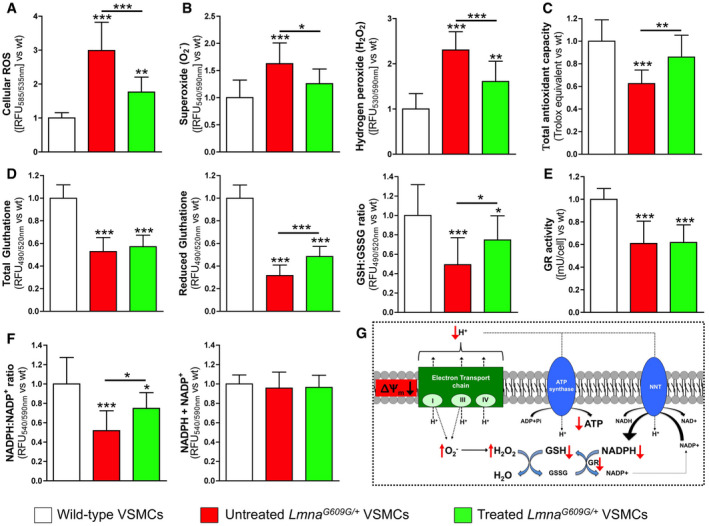
Mitochondrial reactive oxygen species (ROS)‐mediated cell damage has been implicated in progeria (Richards et al, 2011; Sieprath et al, 2015; Kadoguchi et al, 2020). To evaluate the antioxidant properties of magnesium, ROS concentration was measured using the cell permeant reagent 2′,7′‐dichlorofluorescin diacetate (DCFDA), a fluorogenic dye that can be used to quantify hydroxyl, peroxyl, and other ROS activities within the cell. Lmna G609G/+ VSMCs showed significantly higher (3‐fold) ROS content than wild‐type cells (Fig EV2A; Appendix Table S3). In addition, the concentrations of two specific ROSs were also assessed. Mitochondrial superoxide (O2 −) and hydrogen peroxide (H2O2) were present in significantly higher (1.6‐fold and 2.3‐fold, respectively) concentrations in Lmna G609G/+ VSMCs than in wild‐type cells (Fig EV2B; Appendix Table S3). Notably, this overproduction of ROS was significantly reduced (by 69% for ROS, by 43% for H2O2, and by 29% for O2 −) in Lmna G609G/+ VSMCs incubated in magnesium‐enriched medium.
Figure EV2. Magnesium ameliorates oxidative stress in Lmna G609G/+ VSMCs.
-
A, B(A) Reactive oxygen species, and (B) superoxide and hydrogen peroxide radicals generated by the indicated VSMC types.
-
C, D(C) Total antioxidant capacity and (D) total glutathione (which includes reduced ‐GSH- and oxidized ‐GSSG- glutathione), reduced glutathione (GHS), and the ratio of reduced and oxidized glutathione (GSSG) in the indicated cell types.
-
E, F(E) Glutathione reductase (GR) activity, and (F) NADPH:NADP+ ratio and total NADPH (NADPH + NADP+) in the indicated VSMC types.
-
GThe boxed scheme shows the NADPH‐coupled glutathione redox systems, H+‐coupled ATP synthesis by mitochondrial ATP synthase, and H+‐coupled synthesis of NADPH by mitochondrial NADPH transhydrogenase (NNT). ΔΨm: mitochondrial membrane potential.
The rate of ROS generation and the cellular defenses against ROS toxicity (which include enzymes, small molecules, and proteins) contribute to the overall level of oxidative stress. The total antioxidant capacity (TAC) can be considered a cumulative index of antioxidant status. To evaluate the overall cellular capacity to counteract ROS, TAC was assessed using a Cu2+ reduction assay. Lmna G609G/+ VSMCs showed significantly lower TAC (38%) than wild‐type VSMCs (Fig EV2C; Appendix Table S3). This reduction was significantly ameliorated (by 27%) in Lmna G609G/+ VSMCs incubated in magnesium‐enriched medium.
Reduced glutathione (GSH) is the major detoxifying redox buffer in cells and participates in the defense against ROS and the repair of mitochondrial oxidative damage, by being both a potent antioxidant itself and a substrate for antioxidant enzymes, including the glutathione reductase redox systems. Notably, total glutathione, which includes GSH and oxidized glutathione (GSSG), and glutathione reductase (GR) activity were significant lower in Lmna G609G/+ VSMCs than in wild‐type cells (Fig EV2D and E; Appendix Table S3). In addition, the ratio of reduced glutathione to oxidized glutathione (GSH:GSSG) was measured to assess the oxidative profile of the cells. Lmna G609G/+ VSMCs showed a significantly lower (51%) GSH:GSSG ratio than wild‐type VSMCs (Fig EV2D). Notably, this reduction was significantly ameliorated (by 51%) in treated Lmna G609G/+ VSMCs, although the GR activity and total glutathione concentration were similar in treated and untreated Lmna G609G/+ VSMCs.
GR uses reduced nicotinamide adenine dinucleotide phosphate (NADPH) to maintain the GSH redox state. Notably, although both types of VSMCs contained similar amounts of total nicotinamide adenine dinucleotide phosphate (NADPH and its oxidized form, NADP+), Lmna G609G/+ VSMCs had a significantly lower (48%) NADPH:NADP+ ratio than wild‐type cells (Fig EV2F and G; Appendix Table S3). However, the NADPH:NADP+ ratio was significantly improved (by 45%) by magnesium treatment of Lmna G609G/+ VSMCs.
Magnesium ameliorates acidification‐induced mitochondrial calcium overload
An increase in glycolysis that compensates for the loss of mitochondrial ATP synthesis has previously been shown in patient cells (Rivera‐Torres et al, 2013). Lmna G609G/+ VSMCs showed higher cytosolic ATP synthesis (1.8‐fold, Fig 2A; Appendix Table S4), lactate production (1.9‐fold, Fig 2B; Appendix Table S4), and extracellular acidification (2.1‐fold, Fig 2C; Appendix Table S4) than wild‐type cells. However, Lmna G609G/+ VSMCs incubated in a magnesium‐enriched medium showed significantly lower intracellular lactate concentration (19%) and extracellular acidification (14%). In contrast, cytosolic ATP synthesis was 21% higher in treated Lmna G609G/+ VSMCs than in untreated cells. This result is consistent with the notion that magnesium increases the activities of the ATP‐coupled glycolytic enzymes hexokinase, phosphofructokinase, phosphoglycerate kinase, and pyruvate kinase (Pilchova et al, 2017).
Figure 2. Magnesium reduces acidification‐induced mitochondrial calcium overload.

-
ACytosolic ATP synthesis in the indicated VSMC types, measured by incorporation of phosphate‐32 (32Pi) into ADP. [32Pi]‐ATP was separated from 32Pi using the molybdate method, as explained in the Materials and Methods section.
-
B, C(B) Intracellular lactate concentration and (C) external acidification in the indicated VSMC types.
-
DCalcium accumulation in mitochondria after 24 h of incubation in MEM containing 10 μCi/ml calcium‐45 (45Ca2+) as a radiotracer.
-
EMagnesium concentration in isolated mitochondria.
-
FThe boxed scheme describes the mitochondrial calcium overload hypothesis. Lactic acidosis forces the Na+/H+ exchanger (NHX) to import Na+, resulting in cytosolic Na+ overload. Subsequently, the Na+/Ca2+ exchanger (NCX) is forced into reverse mode to dispose of excess Na+, resulting in cytosolic calcium overload. This Ca2+ is then taken up by mitochondria, resulting in mitochondrial calcium overload. 2‐DG (2‐deoxyglucose; 50 mM) blocks glycolysis through competitive hexokinase inhibition, whereas oligomycin (10 μM) inhibits mitochondrial ATP synthase. G‐6-P: glucose‐6-phosphate.
Intracellular acidification can lead to cytosolic and mitochondrial calcium overload, which depolarizes ΔΨm to limit ATP production and stimulates mitochondrial ROS generation and permeability transition (Brookes et al, 2004; Görlach et al, 2015; Santulli et al, 2015). Lmna G609G/+ VSMCs incubated with 45Ca2+ as a radiotracer showed significantly higher (55%) mitochondrial calcium than wild‐type cells, which was significantly reduced (by 21%) in treated Lmna G609G/+ VSMCs (Fig 2D). In addition, Lmna G609G/+ VSMCs showed significantly lower (35%) mitochondrial magnesium than wild‐type cells, which was significantly increased (by 37%) in treated Lmna G609G/+ VSMCs (Fig 2E and F).
Magnesium prevents phosphate‐induced Lmna G609G/+ VSMC calcification
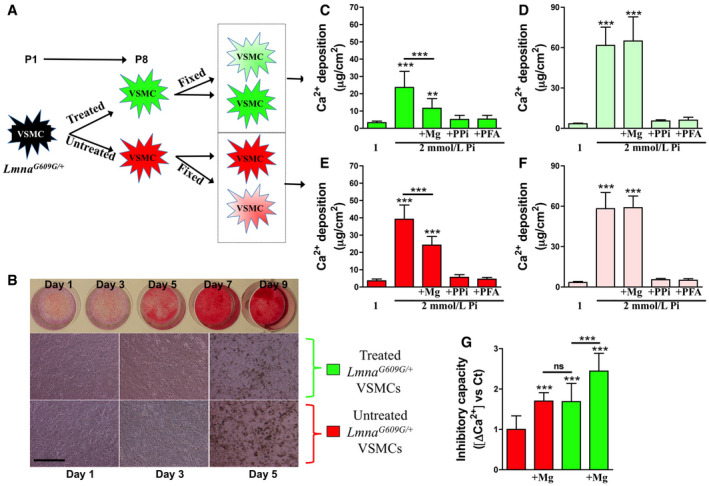
Previous studies show that calcification can occur without cellular activity, both in cultured devitalized aortas (Villa‐Bellosta, 2018) and in fixed smooth muscle cells (Villa‐Bellosta & Sorribas, 2009; Villa‐Bellosta et al, 2011). To determine the effect of magnesium on vascular calcification, treated and untreated Lmna G609G/+ VSMCs were incubated in 2 mM phosphate‐calcifying medium. Phosphate‐induced calcification was then assessed in both living and fixed cells (Fig 3A–G; Appendix Table S5). Untreated Lmna G609G/+ VSMCs showed 11‐fold higher (in live cells) and 17‐fold higher (in fixed cells) calcium deposition after 7 days of incubation in phosphate‐calcifying medium. However, treated living Lmna G609G/+ VSMCs showed significantly lower calcium accumulation (7.3‐fold), although the calcium content in fixed cells was similar in treated and untreated Lmna G609G/+ VSMCs (17‐fold). The addition of pyrophosphate or phosphonoformic acid (two known inhibitors of calcium phosphate crystal deposition) (Villa‐Bellosta & Sorribas, 2009) to the phosphate‐calcifying medium completely prevented calcium accumulation in both fixed/living and treated/untreated Lmna G609G/+ VSMCs. Notably, magnesium supplementation of the phosphate‐calcifying medium significantly reduced (by 38% in untreated and 51% in treated cells) calcium deposition in living cells. By contrast, magnesium supplementation did not reduce calcium deposition in either treated or untreated fixed VSMCs. Taken together, these results suggest that magnesium prevents calcium phosphate deposition by a cellular activity‐dependent mechanism, and not by direct binding to calcium phosphate crystals, preventing their formation and growth. Finally, the capacity to inhibit calcification (ΔCa2+) was calculated as the difference in calcium deposition in living versus fixed cells (Ca2+ in fixed cells − Ca2+ in living cells). The ΔCa2+ in treated cells was significantly higher than that in untreated cells (Fig 3G). Importantly, magnesium supplementation of the phosphate‐calcifying medium caused significant increases in ΔCa2+ in both treated and untreated cells.
Figure 3. Magnesium improves Lmna G609G/+ vascular smooth muscle cell calcification.
-
AScheme showing the principle of the measurement. Lmna G609G/+ VSMCs were incubated in MEM (containing 0.8 mM magnesium; untreated) or in magnesium‐enriched MEM (containing 1.8 mM magnesium; treated) from passage 1 to passage 8. Then, cells were incubated overnight in MEM containing 0.1% FBS and some cells were fixed, as described in the Materials and Methods section. Then, cells were incubated in MEM (containing 0.1% FBS) with 1 or 2 mM phosphate, 1.8 mM magnesium (+Mg), 100 μM pyrophosphate (+PPi), or 500 μM phosphonoformic acid (+PFA). After 7 days of incubation, during which the media were replaced daily, the calcium content was measured as described in the Materials and Methods section.
-
BRepresentative time‐course of 2 mM phosphate on calcification of Lmna G609G/+ VSMCs (up). Calcification was visualized with Alizarin red. Representative microscopic images (10x; scale bar: 100 μm) showing calcification of treated and untreated Lmna G609G/+ VSMCs (down).
-
C–FMeasures of calcium in treated living Lmna G609G/+ VSMCs (C), treated fixed Lmna G609G/+ VSMCs (D), untreated living Lmna G609G/+ VSMCs (E), and untreated fixed Lmna G609G/+ VSMCs (F).
-
GThe calcification inhibitory capacity was calculated as the difference in calcium deposition between living and fixed cells (ΔCa2+).
Magnesium prevents vascular calcification in HGPS mice
Clinically, plasma magnesium is usually measured despite the fact that less than 1% of magnesium exists extracellularly. Hence, plasma magnesium levels do not always accurately reflect total body magnesium stores. In fact, plasma magnesium levels can be normal despite depletion of the total body magnesium content. Notably, plasma magnesium levels were in the normal range in both wild‐type and Lmna G609G/+ mice, although they were significantly lower in 21‐ and 34‐week‐old Lmna G609G/+ mice than in wild‐type littermates (Table EV1).
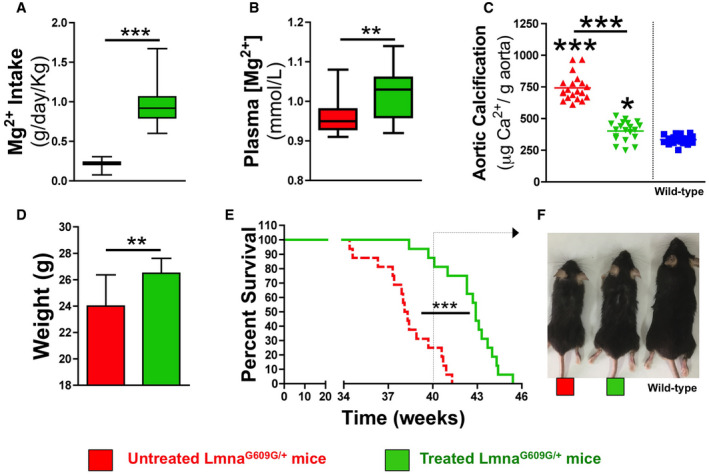
To assess the effect of supplemental magnesium on Lmna G609G/+ mice, their drinking water was supplemented with MgCl2. Thereafter, the consumption of food and water was measured in the mice between 8 and 34 weeks of age. The median food and water consumption of untreated and treated Lmna G609G/+ mice was similar (3.46 ± 0.77 versus 3.53 ± 0.72 g/day/mouse and 3.96 ± 0.62 versus 4.01 ± 0.73 ml/day/mouse, respectively). Therefore, the total magnesium intake by treated Lmna G609G/+ mice was significantly higher (4.6‐fold) than that by untreated Lmna G609G/+ mice (976.2 ± 261.7 versus 213.9 ± 45.0 mg/day/kg; Fig 4A, see Materials and Methods section). Notably, the plasma magnesium concentration was significantly higher in treated Lmna G609G/+ mice than in untreated Lmna G609G/+ mice (1.02 ± 0.06 versus 0.96 ± 0.05 mM; Fig 4B; Appendix Table S6). Finally, the total calcium content of aortas obtained from treated Lmna G609G/+ mice was significantly lower than that of aortas obtained from untreated Lmna G609G/+ mice (401.5 ± 77.7 versus 741.9 ± 101.6 μg/g aorta; Fig 4C; Appendix Table S6).
Figure 4. Oral magnesium treatment improves the longevity of Lmna G609G/+ mice.
-
A, B(A) Magnesium intake and (B) plasma magnesium concentration in 34‐week-old untreated and treated Lmna G609G/+ mice (n = 16).
-
CCalcium content of aortas obtained from 34‐week-old wild‐type mice and untreated and treated Lmna G609G/+ mice (n = 20).
-
DBody masses of 34-week‐old untreated and treated Lmna G609G/+ mice.
-
EKaplan–Meier graph for untreated and treated Lmna G609G/+ mice (n = 16).
-
FRepresentative photographs of 40‐wk-old wild‐type, untreated, and treated Lmna G609G/+ mice.
Magnesium improves the longevity of HGPS mice
The body mass of 34‐wk‐old treated Lmna G609G/+ mice was significantly higher (10%) than that of untreated Lmna G609G/+ mice (26.5 ± 1.1 versus 24.0 ± 2.4 g; Fig 4D). Moreover, the median survival time of treated Lmna G609G/+ mice was extended from 38.2 weeks to 42.9 weeks (Fig 4E and F).
Magnesium improves the antioxidant status of HGPS mice
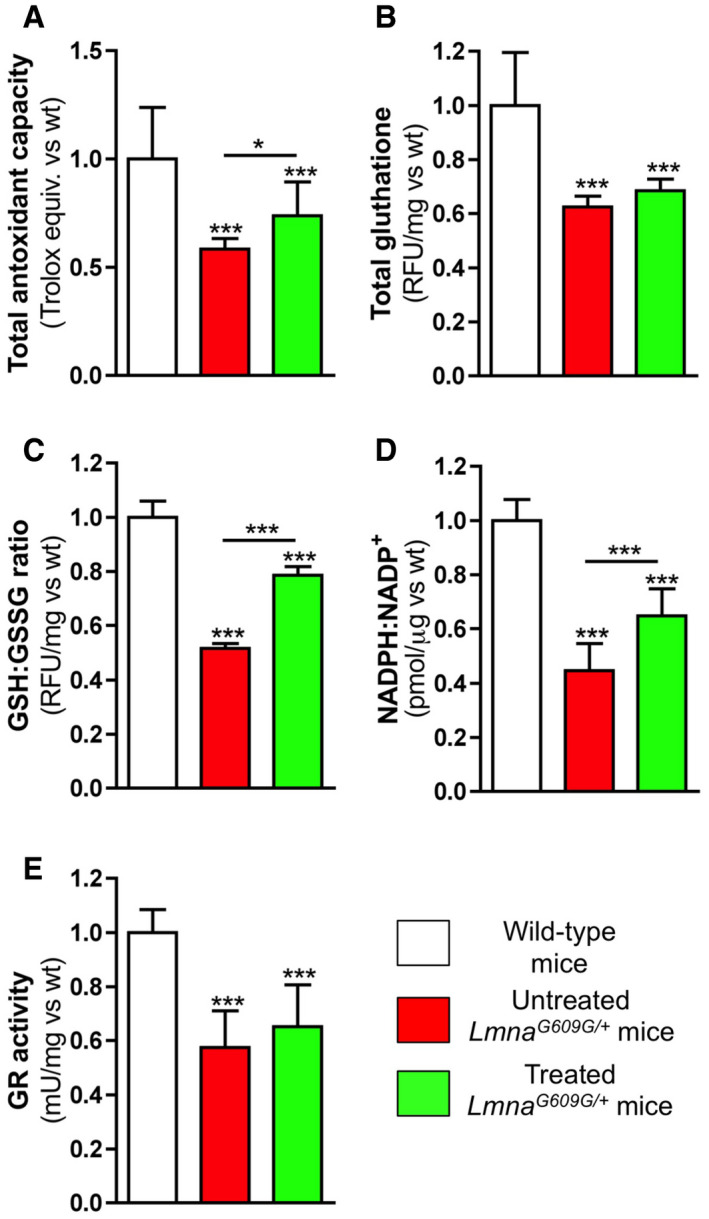
Liver homogenates from Lmna G609G/+ mice had 42% lower TAC (Fig EV3A; Appendix Table S7), 38% lower total glutathione (Fig EV3B; Appendix Table S7), 48% lower GSH:GSSG ratio (Fig EV3C; Appendix Table S7), 55% lower NADPH:NAD+ ratio (Fig EV3D; Appendix Table S7), and 43% lower GR activity (Fig EV3E; Appendix Table S7) than wild‐type mice, implying the presence of an impairment in the NADPH‐coupled GR redox system. Notably, treated Lmna G609G/+ mice showed significant improvements in TAC (26%), GSH:GSSG ratio (52%), and NADPH:NAD ratio (45%) compared with untreated Lmna G609G/+ mice. However, total glutathione and GR activity were not significantly better in treated Lmna G609G/+ mice versus untreated Lmna G609G/+ mice.
Figure EV3. Magnesium improves the NADPH‐coupled glutathione redox status in Lmna G609G/+ mice.
-
A–C(A) Total antioxidant capacity, (B) total glutathione (which includes reduced and oxidized glutathione), and (C) the ratio of reduced (GSH) and oxidized (GSSG) in the indicated experimental mouse groups.
-
D, E(D) The NADPH:NADP+ ratio and (E) glutathione reductase (GR) activity.
Magnesium improves ATP synthesis in HGPS mice
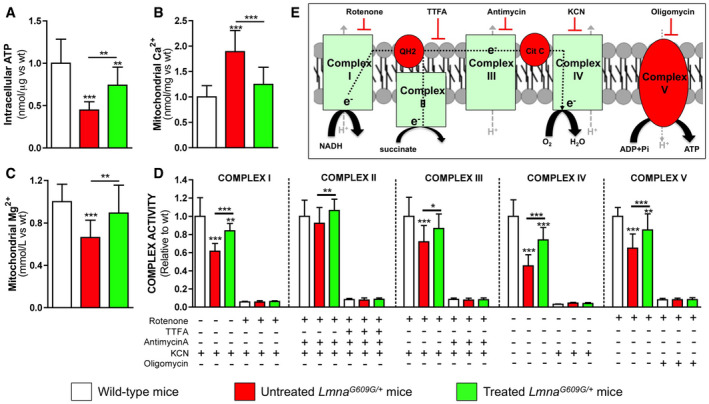
Liver homogenates from untreated Lmna G609G/+ mice showed significantly lower (55%) intracellular ATP, which was 65% higher in treated mice (Fig 5A; Appendix Table S8). Moreover, isolated mitochondria showed 89% higher calcium content in untreated Lmna G609G/+ mice relative to wild‐type mice, but this was 34% lower in treated mice (Fig 5B; Appendix Table S8). In contrast, isolated mitochondria showed 33% lower magnesium content in untreated Lmna G609G/+ mice relative to wild‐type mice, but this was 35% higher in treated mice (Fig 5C; Appendix Table S8). Moreover, the activities of complexes I, III, IV, and V were significantly lower in untreated Lmna G609G/+ than wild‐type mice, but these defects were significantly ameliorated in treated Lmna G609G/+ mice (Fig 5D and E; Appendix Table S8), Notably, the subunits of these mitochondrial complexes are encoded by mitochondrial DNA.
Figure 5. Magnesium improves mitochondrial ATP synthesis in Lmna G609G/+ mice.
-
AATP concentration in liver homogenates obtained from 34‐week-old wild‐type, untreated, or treated Lmna G609G/+ mice.
-
BMitochondrial calcium measured in liver mitochondria isolated from the indicated experimental mouse groups.
-
CMagnesium concentration in isolated mitochondria.
-
DActivities of the indicated mitochondrial complexes (I, II, III, IV, and V) in the absence or presence of rotenone (2 μM), 2‐thenoyltrifluoroacetone (TTFA; 1 mM), antimycin A (10 μM), potassium cyanide (KCN; 1 mM), or oligomycin (10 μM).
-
EThe boxed scheme shows the five mitochondrial complexes involved in the electron transport chain and their known inhibitors. Data information: Results are presented as mean ± SD (n = 16). One‐way ANOVA and Tukey's multiple comparisons post hoc test were used for statistical analysis. *P < 0.05; **P < 0.01; ***P < 0.001.
Source data are available online for this figure.
Magnesium improves mitochondrial ATP synthesis
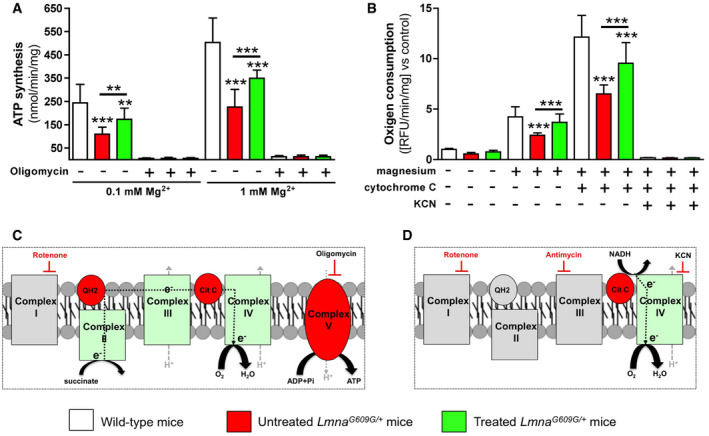
ATP synthesis in isolated mitochondria was significantly lower in untreated Lmna G609G/+ mice than in wild‐type mice, in media containing either 0.1 mM magnesium (109.9 ± 29.6 versus 244.8 ± 78.8 nmol/min/mg protein, respectively) or 1 mM magnesium (226 ± 75.1 versus 503.7 ± 104.4 nmol/min/mg protein, respectively; Fig EV4A; Appendix Table S9). In both media, ATP synthesis was significantly higher (57% and 54%, respectively) for treated Lmna G609G/+ mice than for untreated Lmna G609G/+ mice. Notably, ATP synthesis in all the experimental groups was 2‐fold higher when mitochondria were assessed in incubation media containing 1 mM magnesium compared to incubation media containing 0.1 mM magnesium, which implies that ATP synthase is simulated by magnesium independently of the effect of treatment.
Figure EV4. Magnesium increases the activity of mitochondrial ATP synthase and extramitochondrial NADH oxidation.
-
AATP synthase activity was measured in mitochondria isolated from the livers of 34-week‐old wild‐type, untreated, or treated Lmna G609G/+ mice in media containing 0.1 mM magnesium or 1 mM magnesium. The isolated mitochondria were also incubated in the absence or presence of oligomycin (10 μg/ml). The incubation media contain 5 mM succinate and 2 μM rotenone. The isolated mitochondria were also incubated in the absence or presence of oligomycin (10 μM).
-
BExtramitochondrial NADH oxidation was measured in mitochondrial isolates from the livers of wild‐type, untreated, or treated Lmna G609G/+ mice in media containing rotenone (2 μM), antimycin A (10 μM), and NADH (1 mmo/L). The isolated mitochondria were also incubated in the absence or presence of MgCl2 (5 mM), cytochrome C (10 μM), or KCN (1 mM).
-
C, DThe boxed scheme shows the five mitochondrial complexes involved in the electron transport chain and their known inhibitors used in the experiment.
Magnesium improves extramitochondrial NADH oxidation
Oxidation of exogenous NADH by mitochondria in the presence of added extramitochondrial cytochrome c has been described previously (Bodrova et al, 1998; Lemeshko, 2000). Oxidation was shown to be insensitive to rotenone, antimycin A, and was suppressed by cyanide (Bodrova et al, 1998). The external NADH‐cytochrome c reductase electron transport system of the outer membrane of mitochondria is known to have a very high activity (Lemeshko, 2000). Notably, rotenone‐insensitive oxidation of external NADH in isolated mitochondria was significantly higher in both treated (4.9‐fold) and untreated (4.4‐fold) Lmna G609G/+ and wild‐type (4.2‐fold) mice in media containing magnesium compared to media in the absence of magnesium (Fig EV4B; Appendix Table S9). This stimulation of NADH oxidation by Mg2+ ions was enhancer by addition of exogenous cytochrome c and suppressed by cyanide (Fig EV4B).
Discussion
Magnesium has been shown to effectively prevent mineralization in multiple experimental models of vascular calcification, including cultured VSMCs (Kircelli et al, 2012; Louvet et al, 2013; Bai et al, 2015; Ter Braake et al, 2018), uremic rats (Diaz‐Tocados et al, 2017), and mouse models of pseudoxanthoma elasticum (PXE; Abcc6‐null mice) (Gorgels et al, 2010) and generalized arterial calcification of infancy (GACI; Enpp1‐null mice) (Kingman et al, 2017).
Hydroxyapatite (Ca10(PO4)6(OH)2) is the main calcium phosphate crystal found in in vivo (Lee et al, 2012) and in vitro (Villa‐Bellosta et al, 2011) calcification, and its formation has been shown to be essential for VSMC transdifferentiation (Sage et al, 2011; Villa‐Bellosta et al, 2011; Villa‐Bellosta, 2018) and to induce VSMC death (Ewence et al, 2008). Although it has been suggested that the incorporation of Mg2+ into hydroxyapatite crystals, to form the mineral whitlockite (Ca9Mg(HPO4)(PO4)6), may reduce crystal pathogenicity by increasing their solubility, previous studies have exclusively identified hydroxyapatite, and not whitlockite, in deposits in calcifying VSMCs supplemented with magnesium (Louvet et al, 2015).
While the exact mechanisms whereby magnesium prevents calcification remain to be determined, our data seem to exclude a physicochemical role of magnesium in altering calcium phosphate crystal growth, as evidenced by our finding showing similar calcium deposition in fixed Lmna G609G/+ VSMCs incubated with high magnesium to those incubated in medium containing a standard concentration of magnesium (Fig 3). Thus, the beneficial role of magnesium in attenuating vascular calcification is likely to be linked to an active cellular role.
Consistent with this, a synergistic effect has been demonstrated when magnesium and ATP are used together in solution to delay the conversion of a slurry of amorphous calcium phosphate to crystalline hydroxyapatite (Blumenthal et al, 1977). Moreover, ATP has also been found to prevent vascular calcification by directly inhibiting calcium phosphate crystal formation (Villa‐Bellosta & Sorribas, 2013). In addition, extracellular ATP is the principal source of extracellular pyrophosphate, a key endogenous inhibitor of calcification (Villa‐Bellosta & O'Neill, 2018). We have shown increases in ATP availability, in both treated Lmna G609G/+ VSMCs and mice, which could be explained by increases in the synthesis of ATP in mitochondria and glycolysis.
Mg2+ is an important divalent cation in cells that stabilizes nucleic acid and protein structure, and mediates magnesium‐dependent enzymatic reactions as a cofactor, including enzymatic reactions involving ATP (Pilchova et al, 2017). The mammalian mitochondrial ATP synthase (complex V) catalyzes ATP synthesis from ADP, phosphate, and magnesium using energy generated by an electrochemical gradient of protons produced by the electron transport chain (Chen et al, 2006). The mitochondria also generate ROS as a consequence of inefficiencies in the electron transport chain (Murphy, 2009), which cause oxidative stress, DNA damage, and cellular senescence, molecular defects that are found in the premature aging syndrome HGPS (Viteri et al, 2010; Gordon et al, 2014).
Notably, HGPS fibroblasts generate higher concentrations of ROS than normal fibroblasts (Richards et al, 2011). Furthermore, the basal expression of antioxidant enzymes, which defend cells against ROS‐induced damage, is also lower in HGPS fibroblasts (Yan et al, 1999). Moreover, in HGPS fibroblasts, a marked downregulation of mitochondrial oxidative phosphorylation proteins, accompanied by severe mitochondrial dysfunction, has been observed, along with a marked reduction in COX activity (cytochrome c oxidase; mitochondrial complex IV) and a significant increase in glycolytic dependency (Rivera‐Torres et al, 2013; Aliper et al, 2015). Therefore, the higher oxidative stress in HGPS cells could be as result of greater ROS formation (see Fig 6), due to defective mitochondrial oxidative phosphorylation, as well as lower ROS‐counteracting antioxidative capacity (Kubben et al, 2016). Furthermore, emerging evidence suggests that COX dysfunction is invariably associated with greater mitochondrial ROS generation (Srinivasan & Avadhani, 2012; Kadoguchi et al, 2020). Moreover, Ca2+ accumulation can impair mitochondrial function, leading to lower ATP production and greater release of ROS (Brookes et al, 2004; Peng & Jou, 2010; Santulli et al, 2015). In addition, Mg2+ deficiency is associated with greater production of ROS and the induction of immune and inflammatory reactions (Bussière et al, 2002).
Figure 6. Proposed model showing the main alterations found in Hutchinson–Gilford progeria syndrome (HGPS).
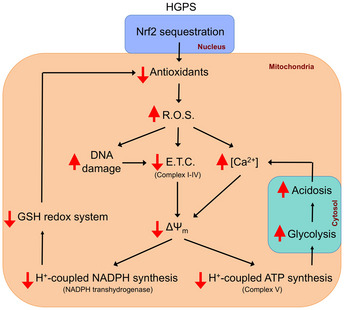
R.O.S: reactive oxygen species; E.T.C: electron transport chain. ΔΨm; mitochondrial membrane potential.
Nuclear factor‐erythroid 2 p45‐related factor 2 (Nrf2) is the primary factor responsible for the protection of cells from oxidative stress, which it does by regulating cytoprotective gene expression, including that of the antioxidant glutathione pathway (Harvey et al, 2009). Interestingly, repression of the antioxidant NRF2 pathway has been found in HGPS (Kubben et al, 2016). Consistent with this, we have shown significantly lower total glutathione synthesis and GR activity, which were not improved in the presence of a high magnesium concentration. By contrast, both the GSH:GSSG and NADPH:NAD+ ratios, which are indicative of antioxidant status, were improved by magnesium treatment.
According to the redox theory of aging, aging is associated with redox imbalance (Sohal & Orr, 2012; Go & Jones, 2017). Thus, both increases in mitochondrial ROS and a deterioration in antioxidant status stimulate aging (see Fig 6). The reductions in cytoplasmic and mitochondrial NADPH:NADP+ ratio with aging are associated with reductions in the activities of cytoplasmic and mitochondrial GRs (and thioredoxin reductases), which lead to greater oxidization of the glutathione redox couple (GSH:GSSG), resulting in lower activities of glutathione peroxidases (and thioredoxin peroxidases) (Bradshaw, 2019). This oxidation of the NADPH‐linked redox systems with aging also causes the oxidation of ascorbate (vitamin C) and tocopherols (vitamin E) (Ren et al, 2017). In the present study, we found a significant reduction in the total antioxidant capacity in both Lmna G609G/+ cells and mice, which was ameliorated by magnesium treatment.
The uptake of Ca2+ ions by mitochondria should depolarize mitochondrial membranes (ΔΨm) (Chalmers & McCarron, 2008), which is required for both H+‐coupled mitochondrial ATP synthase to generate ATP (Saraste, 1999) and NADPH transhydrogenase to generate NADPH (Rydström, 2006). Furthermore, magnesium increases the activities of mitochondrial dehydrogenases (Fig EV1E), including pyruvate dehydrogenase, isocitrate dehydrogenase, and α‐ketoglutarate dehydrogenase (Pilchova et al, 2017). Therefore, mitochondrial NADP+‐dependent isocitrate dehydrogenase could also contribute to the increase in NADPH availability. Moreover, magnesium can reverse the effects of calcium‐induced ΔΨm depolarization (Racay, 2008) and inhibit mitochondrial ROS generation (Kowaltowski et al, 1998). Furthermore, several studies (including the present study) have shown that magnesium has a stimulatory effect on the NADH‐cytochrome c reductase systems located in the outer mitochondrial membrane (Bodrova et al, 1998; Lemeshko, 2000). Therefore, magnesium treatment can also improve exogenous NADH oxidation and the coupled ΔΨm. Consistent with this, the present study has shown improvements in mitochondrial membrane potential and NADPH‐coupled glutathione redox system following magnesium treatment. In addition, we have shown that Lmna G609G/+ VSMCs and mice treated with high magnesium concentrations have lower ROS concentrations, improvements in both mitochondrial function and mitochondrial ATP synthesis, and thus greater ATP availability, which is necessary for cellular energy supply and survival.
Finally, several studies have shown the beneficial effect of dietary magnesium supplementation in several diseases, including atherosclerosis, diabetes, and heart failure. These studies support the effect of magnesium at the molecular level independently of progerin production and its interactions with nuclear membrane proteins. However, magnesium could interact with nuclear proteins, including telomerase and lamins A, B, and C, which may improve or attenuate its reported beneficial effects. These molecular mechanisms, including other metabolic pathways, signaling pathways, and enzyme activities, will be evaluated in future studies.
Conclusion
Plasma magnesium levels do not always accurately reflect total body magnesium stores. In fact, plasma magnesium levels can be normal despite depletion of the total body magnesium content. However, several studies have shown a connection between magnesium deficiency and aging. In addition, a statistically significant inverse correlation between the level of magnesium in drinking water and cardiovascular mortality has been reported in observational epidemiological studies (Rosique‐Esteban et al, 2018). Therefore, a lack of magnesium in drinking water and food may underlie the aging‐associated progressive deterioration of physiological functions, including the redox balance, senescence, and vascular calcification, while high magnesium intake may delay aging. Consistently, the current study demonstrated that addition of magnesium to drinking water significantly extended longevity in progeroid mice. Therefore, dietary magnesium supplementation may be beneficial in children with HGPS, even those who appear to be normomagnesemic (Merideth et al, 2008). Further experiments are needed to test the effect of magnesium supplement in human HGPS context and validate the results obtained in mouse HGPS model.
Materials and Methods
Animals
Male Lmna G609G/+ and wild‐type (C57/BL6) littermates were used at the indicated age. Lmna G609G/+ was designed by Carlos López‐Otín research group (Oviedo University, Spain) in close collaboration with two French teams (one lead by Nicolas Lévy and the other by Bernard Malissen). The protocol was approved by ethics committees both the FIIS‐FJD (Fundación Instituto de Investigación Sanitaria, Fundación Jiménez Díaz) and Madrid Community (PROEX177/15); and conformed to directive 2010/63EU and recommendation 2007/526/EC regarding the protection of animals used for experimental and other scientific purposes, enforced in Spanish law under RD1201/2005. Sample size for animal studies was estimated based on our previous experience and mouse availability. Animals were grouped by genotype. No blinding was performed.
Aorta isolation
Lmna G609G/+ mice were euthanized via carbon dioxide inhalation and thoracic aorta tissue was perfused with saline and removed according to previously published protocol (Villa‐Bellosta & Hamczyk, 2015).
Quantification of aortic calcification
To quantify the calcium content, mice aortas were dried, weighed, and treated with 0.6 M HCl 24 h. Then, calcium was quantified using a colorimetric QuantiChrom Calcium Assay Kit (BioAssay Systems, Hayward, CA).
Plasma magnesium levels
Blood was collected in heparin‐containing tubes and separated into plasma by centrifugation at 5,000 g for 10 min at 4°C. Mg was determined with the QuantiChrom Magnesium Assay Kit (BioAssay System) by the manufacturer's instructions.
VSMCs isolation and culture
VSMCs were obtained from three independents wild‐type or Lmna G609G/+ mice aorta pools (8–10 aortas per pool) by double digestion with collagenase method (Villa‐Bellosta & Hamczyk, 2015). VSMCs were grown in minimum essential medium Eagle (MEM) supplemented with 1 mM l‐glutamine, 100 IU/ml penicillin, 100 μg/ml streptomycin, and 10% fetal bovine serum at 37°C in a humidified atmosphere of 5% CO2. All cell culture reagents were obtained from Invitrogen (Paisley, UK). MEM containing 0.8 mM Mg2+ was supplemented with 1 mM MgCl2 (Sigma‐Aldrich; final concentration of 1.8 mM) to obtain magnesium‐enriched medium. After first trypsinization (passage 1), cells were incubated in MEM containing 0.8 or 1.8 mM Mg2+ to passage 8. Cells were grown considering 1:3 splitting during trypsinization. VSMCs were used directly from same passage (8–9), without a quiescent intermediate step. Figure 1B shows the growth rate after the 8th trypsinization (passage 8).
Cell proliferation
The replicative incorporation of 5‐bromodeoxyuridine (BrdU) was measured using BrdU Cell Proliferation ELISA Kit (Abcam, ab126556) by the manufacturer's instructions.
Cell viability
The cell viability was assessed measuring the mitochondrial activity by using tetrazolium salt which in cleavage to formazan by cellular mitochondria dehydrogenase, (WST‐1 Assay Kit, ab65475, Abcam). Water‐soluble WST‐1 was added to each well, and the absorbance was measured using a scanning multiwell microplate according to the manufacturer's protocol.
β‐Gal activity
Senescence‐associated β‐galactosidase activity was measured in cell lysates by plate reader using a fluorescent probe (β‐gal Activity Assay Kit, BioVision), according to the manufacturer's protocols. Beta‐galactosidase hydrolyzes a non‐fluorescent substrate to generate a strong fluorescent product, which was measured (Ex/Em = 480/520) in two time points (0 and 60 min).
ATP quantification
ATP was measured by a coupled luciferin/luciferase reaction with an ATP Determination Kit (Invitrogen). Cells were treated with lysis buffer (50 Tris–HCl mM, 150 NaCl mM, 1% Triton X‐100 containing inhibitor cocktail, pH 7.4). VSMCs or liver lysates (intracellular ATP) and ATP standards were measured, according to the manufacturer's instructions (Villa‐Bellosta, 2019). For mitochondrial ATP measurement, VSMCs were previously incubated with or without oligomycin (10 μM) for 15 min. Mitochondrial ATP was calculated by the subtraction of intracellular ATP levels (with oligomycin) from total ATP (without oligomycin).
Mitochondrial membrane potential (ΔΨm) measurement
The ΔΨm was assessed by plate reader using a fluorescent probe (JC‐10; ab112134, Abcam) by following the manufacturer's instruction. When mitochondria are polarized electrically, JC‐10 forms J‐aggregates that emit orange‐red fluorescence. J‐monomers, indicating depolarized mitochondria, emit green fluorescence. The ΔΨm was calculated by a ratio of red/green fluorescence, indicating mitochondria depolarization with smaller ratio.
Oxygen consumption rate
Oxygen consumption rate (OCR) by VSMCs (5 × 10⁴ cells/well; Fig 2) or isolated mitochondria (Fig EV4) was measured on standard fluorescence plate reader using the Extracellular O2 Consumption Assay (Abcam, ab197243) according to the manufacturer's protocol. OCR was measured using fluorescence microplate reader (excitation/emission wavelength of 380/650 nm).
Liver mitochondria were isolated by the standard method of homogenization followed by low (700 × g, 10 min) and high (12,000 × g, 15 min) centrifugation using the isolation medium composed of 250 mM sucrose, 2 mM EGTA, and 5 mM MOPS‐KOH (pH 7.4). Measurement buffer contained 60 mM sucrose, 0.5 mM EGTA, 5 mM MOPS‐KOH (pH 7.4), and 1 mM NADH.
ROS detection
Reactive oxygen species (ROS) were measured using the cell permeant reagent 2′,7′‐dichlorofluorescin diacetate (DCFDA) according to the manufacturer's protocol (Abcam, ab113851). DCFDA is deacetylated by cellular esterases and oxidized by ROS into a highly fluorescent compound which was measured using a fluorescence microplate reader (excitation/emission wavelength of 488/535 nm). Amplex® Red reagent (10‐acetyl‐3,7‐dihydroxyphenoxazine) was used to detect hydrogen peroxide (H2O2). In the presence of peroxidase, the Amplex® Red reagent reacts with H2O2 to produce the red‐fluorescent oxidation product, resorufin, which was measured using fluorescence microplate reader (excitation/emission wavelength of 430/590 nm), according to the manufacturer's protocol (A22188, Invitrogen). To detect production of mitochondrial superoxide radical in live cells, the Mitochondrial Superoxide Detection Kit (ab219943, Abcam) was used, according to the manufacturer's protocols. Superoxide was measured using fluorescence microplate reader (excitation/emission wavelength of 540/590 nm).
Total antioxidant capacity
Total antioxidant capacity (TAC) was determined using a commercially available assay kit (Abcam, ab65329) which utilizes the conversion of Cu2+ ions to Cu+ through endogenous protein and small molecule antioxidants, standardized to Trolox equivalents. VSMCs and liver were used for analysis of TAC according to the manufacturer's protocols. Colorimetric activity was measured by optimal density at 570 nm.
NADPH‐coupled glutathione redox system assay
Reduced/oxidized glutathione (GSH/GSSG) ratio, NADPH/NADP ratio, and glutathione reductase (GR) activity in both VSMCs and liver lysates were measured with commercials kit (Abcam, ab138881, ab176724, and ab83461, respectively), using a 96‐well plate reader, according to the manufacturer's protocols. Liver samples were measured in triplicate on the same plate, and fluorescence/colorimetric values were normalized to micrograms of protein loaded in the assay per sample. Protein was measured with the Pierce BCA Protein Assay Kit (Thermo Scientific, Rockford, USA), according to the manufacturer's protocols.
GSH and total glutathione were determined by changes in fluorescence intensity (excitation/emission wavelength of 490/520 nm). 20 mg of liver tissue or VSMCs (5 × 10⁶) were homogenized/lysed in 400/100 μl cold lysis buffer, respectively. Homogenates/lysates were centrifuged at top speed for 15 min at 4°C. Supernatants were deproteinized using Deproteinizing Sample Preparation Kit‐TCA (Abcam, ab204708) according to the manufacturer's protocol.
NADPH and total nicotinamide adenine dinucleotide phosphate (NADPH+NADP+) were determined by changes in fluorescence intensity (excitation/emission wavelength of 540/590 nm). 20 mg of liver tissue or VSMCs (5 × 10⁶) were homogenized/lysed in 400/100 μl lysis buffer, respectively. Homogenates/lysates were centrifuged at 2,500/1,500 rpm, respectively, for 5 min at RT.
GR activity was measured by optimal density at 405 nm. 20 mg of liver tissue or 1 × 10⁶ VSMCs were homogenized/lysed in 200 μl cold assay buffer and centrifuged at 10,000 × g for 15 min at 4°C. Supernatant was pre‐treated to destroy GSH before the assay, according to the manufacturer's protocol.
Mitochondrial and cytosolic ATP synthesis
Liver mitochondria were isolated by the standard procedure of differential centrifugation using the isolation medium composed of 250 mM sucrose, 2 mM EGTA, and 5 mM MOPS‐KOH (pH 7.4). Mitochondria were washed and finely suspended in the medium composed of 120 mM KCl, 20 mM MOPS, and 0.5 mM EGTA (KME medium). Mitochondria protein was measured with the Pierce BCA Protein Assay Kit (Thermo Scientific, Rockford, USA), according to the manufacturer's protocols. Mitochondria (1 mg of protein/ml) were incubated in KME medium containing 5 mM succinate, 2 μM rotenone, 10 mM NaCl, 800 pmol of A23187/mg of protein, and 5 mM phosphate (10 μCi/ml of 32Pi as radiotracer) at 37°C. After 5 min, 1.2 mM ADP was added, and the reaction was stopped 30 s later by addition of 200 μl of 30% (w/v) cold trichloroacetic acid. Orthophosphate (32Pi) was separated from ATP ([γ32P]ATP) by molybdate method, as previously described (Villa‐Bellosta, 2018, 2019). Briefly, 20 μl of sample was mixed with 400 μL of ammonium molybdate (to bind the orthophosphate) and 0.75 M sulfuric acid. Samples were then extracted with 800 μl of isobutanol/petroleum ether (4:1) to separate the phosphomolybdate from pyrophosphate and ATP. Next, 400 μl of the aqueous phase containing ATP was removed and subjected to radioactivity counting (Tri‐Carb 2810TR, PerkinElmer).
For cytosolic ATP synthesis, VSMCs (1 × 10⁶) were incubated in MEM containing 10 μM oligomycin and 10 μCi/ml of phosphate‐32 (32Pi) as radiotracer, at 37°C. The reaction was stopped by addition of 200 μl of 30% (w/v) cold trichloroacetic acid. Orthophosphate (32Pi) was separated from ATP ([γ32P]ATP) by molybdate method.
Glycolysis assay
Extracellular acidification and lactate were measured with fluorometric kits (Abcam, ab197244 and ab169557, respectively), using a 96‐well plate reader, according to the manufacturer's protocols. Extracellular acidification was determined in VSMCs (5 × 10⁵ cells/well) by changes in fluorescence intensity (excitation/emission wavelength of 380/615 nm), using a water‐soluble and cell‐impermeable pH‐sensitive reagent. L‐lactate was determined by changes in fluorescence intensity (excitation/emission wavelength of 535/587 nm). VSMCs (1 × 10⁶) were homogenized with 110 μl cold lactate assay buffer on ice and centrifuged at 14,000 g for 5 min. Supernatant was measured in duplicate on the same plate.
Mitochondrial calcium and magnesium
For calcium accumulation by mitochondria, VSMCs were incubated in MEM containing 10 μCi/ml calcium‐45 (45Ca2+) as a radiotracer. After 24 h, VSMCs were washed five times in MEM. Mitochondria were isolated from VSMCs by method of homogenization followed by low‐ and high‐speed centrifugation at 4°C. The homogenate was centrifuged at 1,000 × g for 10 min. Mitochondria were sedimented at 3,500 × g for 15 min. The pellet contains the isolated mitochondria was washed and centrifuged at 12,000 × g for 15 min. The isolation medium contained 250 mM sucrose, 0.5 mM EGTA, and 5 mM MOPS‐KOH (pH 7.4). EGTA was excluded from washing medium. Mitochondria pellets was resuspended in liquid scintillation counting (UltraGold, 6013329, PerkinElmer) and subjected to radioactivity counting (Tri‐Carb 2810TR, PerkinElmer).
Liver mitochondria were isolated by the method of homogenization followed by low (1,000 × g, 10 min)‐ and high (3,500 × g, 15 min)‐speed centrifugation at 4°C. Mitochondria were washed and finely suspended in dH2O. Mitochondria protein was measured with the Pierce BCA Protein Assay Kit (Thermo Scientific, Rockford, USA), according to the manufacturer's protocols. Calcium was measured using a colorimetric QuantiChrom Calcium Assay Kit (BioAssay System, Hayward, CA) according to the manufacturer's protocols.
Mitochondrial magnesium concentration was measured in isolated mitochondria using mag‐fura 2‐AM (Thermo Fisher) as described previously (Kolisek et al, 2003). Briefly, mitochondria were loaded with 5 μM mag‐fura 2‐AM for 40 min at 25°C and washed twice to remove excess dye. Magnesium concentration was determined by measuring the fluorescence of the probe‐loaded mitochondria with excitation at 340 and 380 nm, and emission at 510 nm. Mitochondrial magnesium was calculated from the 340/380 nm ratio according to the formula of Grynkiewicz et al (Grynkiewicz et al, 1985). The minimum (R min) and maximum (R max) ratios were obtained at the end of each experiment. R max was obtained by the addition of SDS (10% w/v) and MgCl2 (25 mM). R min was detected by addition of EDTA (50 mM, pH 8).
Calcification assay and quantification
VSMCs were used from same passage (8 or 9), considering 1:3 splitting during trypsinization. Cells were grown to confluence and used after a quiescent intermediate step (overnight in culture media containing 0.1% fetal bovine serum). Calcification assays were performed on cells incubated for 7 days in MEM supplemented with 1 mM l‐glutamine, 100 IU/ml penicillin, 100 μg/ml streptomycin, 0.1% fetal bovine serum, and 2 mM phosphate (phosphate‐calcifying medium), as described previously (Villa‐Bellosta, 2018; Villa‐Bellosta et al, 2011, p.; Villa‐Bellosta & Hamczyk, 2015). Phosphate‐calcifying medium was replaced every day. To quantify the calcium content of VSMC, wells were treated with 0.6 M HCl overnight at 4°C and analyzed using a colorimetric QuantiChrom Calcium Assay Kit (BioAssay System, Hayward, CA). Phosphate, magnesium chloride, phosphonoformic acid, and pyrophosphate were obtained from Sigma‐Aldrich. Cells were fixed as described previously (Villa‐Bellosta & Sorribas, 2009).
Mitochondrial complex I‐V activities
Mitochondria were isolated from mouse liver tissues using Mitochondria Isolation Kit for tissue (Cayman Chemical, #701010). The activities of electron transport chain complexes I, II, III, IV, and V were determined using complex I activity assay kit (Cayman Chemical, #700930), complex II activity assay kit (Cayman Chemical, #700940), complex II/III activity assay kit (Cayman Chemical, #700950), complex IV activity assay kit (Cayman Chemical, #700990), and complex V activity assay kit (Cayman Chemical, #701000), respectively, following the manufacturer's instruction. Rotenone, 2‐thenoyltrifluoroacetone (TTFA), antimycin A, potassium cyanide (KCN), and oligomycin were obtained from Sigma‐Aldrich.
Magnesium treatment
To assess the effect of supplemental magnesium on Lmna G609G/+ mice, their drinking water (containing 39 mg/l magnesium) was supplemented with 15 g/l MgCl2. Thereafter, the consumption of food (containing 0.17% magnesium) and that of both untreated and treated water was measured in the mice between 8 and 34 weeks of age. Magnesium intake was measured twice a week. Average daily food and water intake was calculated per day and by weight of the mouse in each cage.
Statistical analyses
Results are presented as means ± SD. The Kolmogorov–Smirnov test was used to assess the normality of the data. Student's t‐test or one‐way ANOVA and Tukey's multiple comparison posttest were used for statistical analysis. Asterisks near the top of the columns compare untreated or treated cells/mice with respect to control (wild type). Longevity was assessed by the Kaplan–Meier methods. All statistical analyses were performed using GraphPad Prism 5 software. Differences were considered significant at P < 0.05. Randomization or blinding was not applicable in this study.
Author contribution
RV‐B conceived and designed the study, conducted the experiments, acquired the data, analyzed and interpreted the data, provided the reagents, and wrote the manuscript.
Conflict of interest
The author declares that he has no conflict of interest.
Supporting information
Appendix
Expanded View Figures PDF
Table EV1
Source Data for Expanded View
Review Process File
Source Data for Figure 1
Source Data for Figure 2
Source Data for Figure 3
Source Data for Figure 4
Source Data for Figure 5
Acknowledgements
We thank Daniel Azpiazu, Ana Lobo, Ana de la Calle, Veronica, and Jose Luis for excellent technical assistance. We also thank the group of Prof. Carlos López‐Otín for the generous gift of the HGPS mouse model and the personnel of FIIS‐FJD Animal Facility for animals’ production and maintenance. This study was supported by grants from Progeria Research Foundation (PRF‐2016‐68) from USA and Spanish Ministerio de Economía y Competitividad (SAF‐2014‐60669‐JIN).
EMBO Mol Med (2020) 12: e12423
Data availability
All source data of this study are available in the supplementary material of the article. Other data that support the findings of this study are available from the corresponding authors upon request.
References
- Aliper AM, Csoka AB, Buzdin A, Jetka T, Roumiantsev S, Moskalev A, Zhavoronkov A (2015) Signaling pathway activation drift during aging: Hutchinson‐Gilford Progeria Syndrome fibroblasts are comparable to normal middle‐age and old‐age cells. Aging 7: 26–37 [DOI] [PMC free article] [PubMed] [Google Scholar]
- Bai Y, Zhang J, Xu J, Cui L, Zhang H, Zhang S, Feng X (2015) Magnesium prevents β‐glycerophosphate‐induced calcification in rat aortic vascular smooth muscle cells. Biomed Rep 3: 593–597 [DOI] [PMC free article] [PubMed] [Google Scholar]
- Blumenthal NC, Betts F, Posner AS (1977) Stabilization of amorphous calcium phosphate by Mg and ATP. Calcif Tissue Res 23: 245–250 [DOI] [PubMed] [Google Scholar]
- Bodrova ME, Dedukhova VI, Mokhova EN, Skulachev VP (1998) Membrane potential generation coupled to oxidation of external NADH in liver mitochondria. FEBS Lett 435: 269–274 [DOI] [PubMed] [Google Scholar]
- Bradshaw PC (2019) Cytoplasmic and mitochondrial NADPH‐coupled redox systems in the regulation of aging. Nutrients 11: 504–538 [DOI] [PMC free article] [PubMed] [Google Scholar]
- Brookes PS, Yoon Y, Robotham JL, Anders MW, Sheu S‐S (2004) Calcium, ATP, and ROS: a mitochondrial love‐hate triangle. Am J Physiol Cell Physiol 287: C817–C833 [DOI] [PubMed] [Google Scholar]
- Bussière FI, Gueux E, Rock E, Girardeau J‐P, Tridon A, Mazur A, Rayssiguier Y (2002) Increased phagocytosis and production of reactive oxygen species by neutrophils during magnesium deficiency in rats and inhibition by high magnesium concentration. Br J Nutr 87: 107–113 [DOI] [PubMed] [Google Scholar]
- Chalmers S, McCarron JG (2008) The mitochondrial membrane potential and Ca2+ oscillations in smooth muscle. J Cell Sci 121: 75–85 [DOI] [PubMed] [Google Scholar]
- Chen C, Saxena AK, Simcoke WN, Garboczi DN, Pedersen PL, Ko YH (2006) Mitochondrial ATP synthase. Crystal structure of the catalytic F1 unit in a vanadate‐induced transition‐like state and implications for mechanism. J Biol Chem 281: 13777–13783 [DOI] [PubMed] [Google Scholar]
- De Sandre‐Giovannoli A, Bernard R, Cau P, Navarro C, Amiel J, Boccaccio I, Lyonnet S, Stewart CL, Munnich A, Le Merrer M et al (2003) Lamin a truncation in Hutchinson‐Gilford progeria. Science 300: 2055 [DOI] [PubMed] [Google Scholar]
- Diaz‐Tocados JM, Peralta‐Ramirez A, Rodríguez‐Ortiz ME, Raya AI, Lopez I, Pineda C, Herencia C, Montes de Oca A, Vergara N, Steppan S et al (2017) Dietary magnesium supplementation prevents and reverses vascular and soft tissue calcifications in uremic rats. Kidney Int 92: 1084–1099 [DOI] [PubMed] [Google Scholar]
- DiNicolantonio JJ, Liu J, O'Keefe JH (2018) Magnesium for the prevention and treatment of cardiovascular disease. Open Heart 5: e000775 [DOI] [PMC free article] [PubMed] [Google Scholar]
- Eriksson M, Brown WT, Gordon LB, Glynn MW, Singer J, Scott L, Erdos MR, Robbins CM, Moses TY, Berglund P et al (2003) Recurrent de novo point mutations in lamin A cause Hutchinson‐Gilford progeria syndrome. Nature 423: 293–298 [DOI] [PMC free article] [PubMed] [Google Scholar]
- Ewence AE, Bootman M, Roderick HL, Skepper JN, McCarthy G, Epple M, Neumann M, Shanahan CM, Proudfoot D (2008) Calcium phosphate crystals induce cell death in human vascular smooth muscle cells: a potential mechanism in atherosclerotic plaque destabilization. Circ Res 103: e28–e34 [DOI] [PubMed] [Google Scholar]
- Go Y‐M, Jones DP (2017) Redox theory of aging: implications for health and disease. Clin Sci 1979(131): 1669–1688 [DOI] [PMC free article] [PubMed] [Google Scholar]
- Gordon LB, Rothman FG, López‐Otín C, Misteli T (2014) Progeria: a paradigm for translational medicine. Cell 156: 400–407 [DOI] [PMC free article] [PubMed] [Google Scholar]
- Gorgels TGMF, Waarsing JH, de Wolf A, ten Brink JB, Loves WJP, Bergen AAB (2010) Dietary magnesium, not calcium, prevents vascular calcification in a mouse model for pseudoxanthoma elasticum. J Mol Med 88: 467–475 [DOI] [PMC free article] [PubMed] [Google Scholar]
- Görlach A, Bertram K, Hudecova S, Krizanova O (2015) Calcium and ROS: a mutual interplay. Redox Biol 6: 260–271 [DOI] [PMC free article] [PubMed] [Google Scholar]
- Grynkiewicz G, Poenie M, Tsien RY (1985) A new generation of Ca2+ indicators with greatly improved fluorescence properties. J Biol Chem 260: 3440–3450 [PubMed] [Google Scholar]
- Hanumanthappa NB, Madhusudan G, Mahimarangaiah J, Manjunath CN (2011) Hutchinson‐Gilford progeria syndrome with severe calcific aortic valve stenosis. Ann Pediatr Cardiol 4: 204–206 [DOI] [PMC free article] [PubMed] [Google Scholar]
- Harvey CJ, Thimmulappa RK, Singh A, Blake DJ, Ling G, Wakabayashi N, Fujii J, Myers A, Biswal S (2009) Nrf2‐regulated glutathione recycling independent of biosynthesis is critical for cell survival during oxidative stress. Free Radic Biol Med 46: 443–453 [DOI] [PMC free article] [PubMed] [Google Scholar]
- Kadoguchi T, Shimada K, Miyazaki T, Kitamura K, Kunimoto M, Aikawa T, Sugita Y, Ouchi S, Shiozawa T, Yokoyama‐Nishitani M et al (2020) Promotion of oxidative stress is associated with mitochondrial dysfunction and muscle atrophy in aging mice. Geriatr Gerontol Int 20: 78–84 [DOI] [PubMed] [Google Scholar]
- Kingman J, Uitto J, Li Q (2017) Elevated dietary magnesium during pregnancy and postnatal life prevents ectopic mineralization in Enpp1asj mice, a model for generalized arterial calcification of infancy. Oncotarget 8: 38152–38160 [DOI] [PMC free article] [PubMed] [Google Scholar]
- Kircelli F, Peter ME, Sevinc Ok E, Celenk FG, Yilmaz M, Steppan S, Asci G, Ok E, Passlick‐Deetjen J (2012) Magnesium reduces calcification in bovine vascular smooth muscle cells in a dose‐dependent manner. Nephrol Dial Transplant 27: 514–521 [DOI] [PMC free article] [PubMed] [Google Scholar]
- Kolisek M, Zsurka G, Samaj J, Weghuber J, Schweyen RJ, Schweigel M (2003) Mrs2p is an essential component of the major electrophoretic Mg2+ influx system in mitochondria. EMBO J 22: 1235–1244 [DOI] [PMC free article] [PubMed] [Google Scholar]
- Kowaltowski AJ, Naia‐da-Silva ES, Castilho RF, Vercesi AE (1998) Ca2+‐stimulated mitochondrial reactive oxygen species generation and permeability transition are inhibited by dibucaine or Mg2+. Arch Biochem Biophys 359: 77–81 [DOI] [PubMed] [Google Scholar]
- Kubben N, Zhang W, Wang L, Voss TC, Yang J, Qu J, Liu G‐H, Misteli T (2016) Repression of the antioxidant NRF2 pathway in premature aging. Cell 165: 1361–1374 [DOI] [PMC free article] [PubMed] [Google Scholar]
- Lee JS, Morrisett JD, Tung C‐H (2012) Detection of hydroxyapatite in calcified cardiovascular tissues. Atherosclerosis 224: 340–347 [DOI] [PMC free article] [PubMed] [Google Scholar]
- Lemeshko VV (2000) Mg(2+) induces intermembrane electron transport by cytochrome c desorption in mitochondria with the ruptured outer membrane. FEBS Lett 472: 5–8 [DOI] [PubMed] [Google Scholar]
- Liu B, Wang J, Chan KM, Tjia WM, Deng W, Guan X, Huang J, Li KM, Chau PY, Chen DJ et al (2005) Genomic instability in laminopathy‐based premature aging. Nat Med 11: 780–785 [DOI] [PubMed] [Google Scholar]
- Liu Y, Rusinol A, Sinensky M, Wang Y, Zou Y (2006) DNA damage responses in progeroid syndromes arise from defective maturation of prelamin A. J Cell Sci 119: 4644–4649 [DOI] [PMC free article] [PubMed] [Google Scholar]
- Liu M, Jeong E‐M, Liu H, Xie A, So EY, Shi G, Jeong GE, Zhou A, Dudley SC (2019) Magnesium supplementation improves diabetic mitochondrial and cardiac diastolic function. JCI Insight 4: e123182 [DOI] [PMC free article] [PubMed] [Google Scholar]
- Louvet L, Büchel J, Steppan S, Passlick‐Deetjen J, Massy ZA (2013) Magnesium prevents phosphate‐induced calcification in human aortic vascular smooth muscle cells. Nephrol Dial Transplant 28: 869–878 [DOI] [PMC free article] [PubMed] [Google Scholar]
- Louvet L, Bazin D, Büchel J, Steppan S, Passlick‐Deetjen J, Massy ZA (2015) Characterisation of calcium phosphate crystals on calcified human aortic vascular smooth muscle cells and potential role of magnesium. PLoS ONE 10: e0115342 [DOI] [PMC free article] [PubMed] [Google Scholar]
- Merideth MA, Gordon LB, Clauss S, Sachdev V, Smith ACM, Perry MB, Brewer CC, Zalewski C, Kim HJ, Solomon B et al (2008) Phenotype and course of Hutchinson‐Gilford progeria syndrome. N Engl J Med 358: 592–604 [DOI] [PMC free article] [PubMed] [Google Scholar]
- Murphy MP (2009) How mitochondria produce reactive oxygen species. Biochem J 417: 1–13 [DOI] [PMC free article] [PubMed] [Google Scholar]
- Nair K, Ramachandran P, Krishnamoorthy KM, Dora S, Achuthan TJ (2004) Hutchinson‐Gilford progeria syndrome with severe calcific aortic valve stenosis and calcific mitral valve. J Heart Valve Dis 13: 866–869 [PubMed] [Google Scholar]
- Osorio FG, Navarro CL, Cadiñanos J, López‐Mejía IC, Quirós PM, Bartoli C, Rivera J, Tazi J, Guzmán G, Varela I et al (2011) Splicing‐directed therapy in a new mouse model of human accelerated aging. Sci Transl Med 3: 106ra107 [DOI] [PubMed] [Google Scholar]
- Peng T‐I, Jou M‐J (2010) Oxidative stress caused by mitochondrial calcium overload. Ann N Y Acad Sci 1201: 183–188 [DOI] [PubMed] [Google Scholar]
- Pilchova I, Klacanova K, Tatarkova Z, Kaplan P, Racay P (2017) The involvement of Mg2+ in regulation of cellular and mitochondrial functions. Oxid Med Cell Longev 2017: 6797460 [DOI] [PMC free article] [PubMed] [Google Scholar]
- Racay P (2008) Effect of magnesium on calcium‐induced depolarisation of mitochondrial transmembrane potential. Cell Biol Int 32: 136–145 [DOI] [PubMed] [Google Scholar]
- Ren X, Zou L, Zhang X, Branco V, Wang J, Carvalho C, Holmgren A, Lu J (2017) Redox signaling mediated by thioredoxin and glutathione systems in the central nervous system. Antioxid Redox Signal 27: 989–1010 [DOI] [PMC free article] [PubMed] [Google Scholar]
- Richards SA, Muter J, Ritchie P, Lattanzi G, Hutchison CJ (2011) The accumulation of un‐repairable DNA damage in laminopathy progeria fibroblasts is caused by ROS generation and is prevented by treatment with N‐acetyl cysteine. Hum Mol Genet 20: 3997–4004 [DOI] [PubMed] [Google Scholar]
- Rivera‐Torres J, Acín‐Perez R, Cabezas‐Sánchez P, Osorio FG, Gonzalez‐Gómez C, Megias D, Cámara C, López‐Otín C, Enríquez JA, Luque‐García JL et al (2013) Identification of mitochondrial dysfunction in Hutchinson‐Gilford progeria syndrome through use of stable isotope labeling with amino acids in cell culture. J Proteomics 91: 466–477 [DOI] [PubMed] [Google Scholar]
- Rosique‐Esteban N, Guasch‐Ferré M, Hernández‐Alonso P, Salas‐Salvadó J (2018) Dietary magnesium and cardiovascular disease: a review with emphasis in epidemiological studies. Nutrients 10: 168–189 [DOI] [PMC free article] [PubMed] [Google Scholar]
- Rydström J (2006) Mitochondrial NADPH, transhydrogenase and disease. Biochim Biophys Acta 1757: 721–726 [DOI] [PubMed] [Google Scholar]
- Sage AP, Lu J, Tintut Y, Demer LL (2011) Hyperphosphatemia‐induced nanocrystals upregulate the expression of bone morphogenetic protein‐2 and osteopontin genes in mouse smooth muscle cells in vitro . Kidney Int 79: 414–422 [DOI] [PMC free article] [PubMed] [Google Scholar]
- Salamat M, Dhar PK, Neagu DL, Lyon JB (2010) Aortic calcification in a patient with hutchinson‐gilford progeria syndrome. Pediatr Cardiol 31: 925–926 [DOI] [PubMed] [Google Scholar]
- Santulli G, Xie W, Reiken SR, Marks AR (2015) Mitochondrial calcium overload is a key determinant in heart failure. Proc Natl Acad Sci USA 112: 11389–11394 [DOI] [PMC free article] [PubMed] [Google Scholar]
- Saraste M (1999) Oxidative phosphorylation at the fin de siècle. Science 283: 1488–1493 [DOI] [PubMed] [Google Scholar]
- Sieprath T, Corne TDJ, Nooteboom M, Grootaert C, Rajkovic A, Buysschaert B, Robijns J, Broers JLV, Ramaekers FCS, Koopman WJH et al (2015) Sustained accumulation of prelamin A and depletion of lamin A/C both cause oxidative stress and mitochondrial dysfunction but induce different cell fates. Nucleus 6: 236–246 [DOI] [PMC free article] [PubMed] [Google Scholar]
- Sohal RS, Orr WC (2012) The redox stress hypothesis of aging. Free Radic Biol Med 52: 539–555 [DOI] [PMC free article] [PubMed] [Google Scholar]
- Srinivasan S, Avadhani NG (2012) Cytochrome c oxidase dysfunction in oxidative stress. Free Radic Biol Med 53: 1252–1263 [DOI] [PMC free article] [PubMed] [Google Scholar]
- Ter Braake AD, Tinnemans PT, Shanahan CM, Hoenderop JGJ, de Baaij JHF (2018) Magnesium prevents vascular calcification in vitro by inhibition of hydroxyapatite crystal formation. Sci Rep 8: 2069 [DOI] [PMC free article] [PubMed] [Google Scholar]
- Varela I, Cadiñanos J, Pendás AM, Gutiérrez‐Fernández A, Folgueras AR, Sánchez LM, Zhou Z, Rodríguez FJ, Stewart CL, Vega JA et al (2005) Accelerated ageing in mice deficient in Zmpste24 protease is linked to p53 signalling activation. Nature 437: 564–568 [DOI] [PubMed] [Google Scholar]
- Villa‐Bellosta R, Sorribas V (2009) Phosphonoformic acid prevents vascular smooth muscle cell calcification by inhibiting calcium‐phosphate deposition. Arterioscler Thromb Vasc Biol 29: 761–766 [DOI] [PubMed] [Google Scholar]
- Villa‐Bellosta R, Millan A, Sorribas V (2011) Role of calcium‐phosphate deposition in vascular smooth muscle cell calcification. Am J Physiol Cell Physiol 300: C210–C220 [DOI] [PubMed] [Google Scholar]
- Villa‐Bellosta R, Sorribas V (2013) Prevention of vascular calcification by polyphosphates and nucleotides‐ role of ATP. Circ J 77: 2145–2151 [DOI] [PubMed] [Google Scholar]
- Villa‐Bellosta R, Rivera‐Torres J, Osorio FG, Acín‐Pérez R, Enriquez JA, López‐Otín C, Andrés V (2013) Defective extracellular pyrophosphate metabolism promotes vascular calcification in a mouse model of Hutchinson‐Gilford progeria syndrome that is ameliorated on pyrophosphate treatment. Circulation 127: 2442–2451 [DOI] [PubMed] [Google Scholar]
- Villa‐Bellosta R, Hamczyk MR (2015) Isolation and culture of aortic smooth muscle cells and in vitro calcification assay. Methods Mol Biol 1339: 119–129 [DOI] [PubMed] [Google Scholar]
- Villa‐Bellosta R (2018) Synthesis of extracellular pyrophosphate increases in vascular smooth muscle cells during phosphate‐induced calcification. Arterioscler Thromb Vasc Biol 38: 2137–2147 [DOI] [PubMed] [Google Scholar]
- Villa‐Bellosta R, O'Neill WC (2018) Pyrophosphate deficiency in vascular calcification. Kidney Int 93: 1293–1297 [DOI] [PubMed] [Google Scholar]
- Villa‐Bellosta R (2019) ATP‐based therapy prevents vascular calcification and extends longevity in a mouse model of Hutchinson‐Gilford progeria syndrome. Proc Natl Acad Sci USA 116: 23698–23704 [DOI] [PMC free article] [PubMed] [Google Scholar]
- Viteri G, Chung YW, Stadtman ER (2010) Effect of progerin on the accumulation of oxidized proteins in fibroblasts from Hutchinson Gilford progeria patients. Mech Ageing Dev 131: 2–8 [DOI] [PMC free article] [PubMed] [Google Scholar]
- Yan T, Li S, Jiang X, Oberley LW (1999) Altered levels of primary antioxidant enzymes in progeria skin fibroblasts. Biochem Biophys Res Commun 257: 163–167 [DOI] [PubMed] [Google Scholar]
Associated Data
This section collects any data citations, data availability statements, or supplementary materials included in this article.
Supplementary Materials
Appendix
Expanded View Figures PDF
Table EV1
Source Data for Expanded View
Review Process File
Source Data for Figure 1
Source Data for Figure 2
Source Data for Figure 3
Source Data for Figure 4
Source Data for Figure 5
Data Availability Statement
All source data of this study are available in the supplementary material of the article. Other data that support the findings of this study are available from the corresponding authors upon request.