Abstract
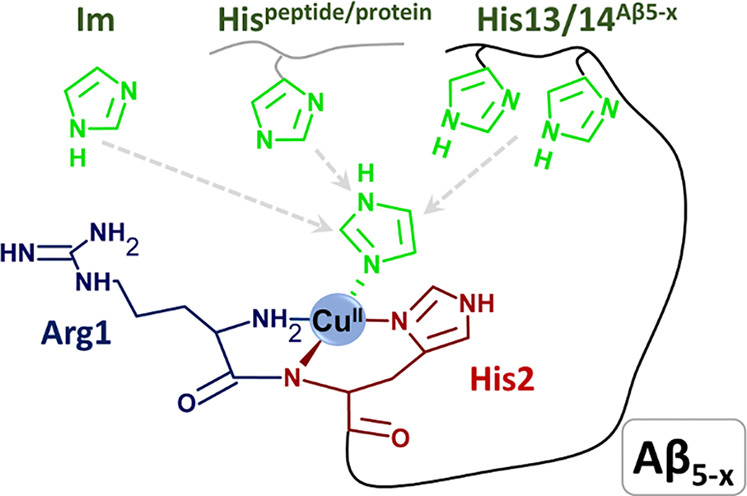
The Aβ5–x peptides (x = 38, 40, 42) are minor Aβ species in normal brains but elevated upon the application of inhibitors of Aβ processing enzymes. They are interesting from the point of view of coordination chemistry for the presence of an Arg-His metal binding sequence at their N-terminus capable of forming a 3-nitrogen (3N) three-coordinate chelate system. Similar sequences in other bioactive peptides were shown to bind Cu(II) ions in biological systems. Therefore, we investigated Cu(II) complex formation and reactivity of a series of truncated Aβ5–x peptide models comprising the metal binding site: Aβ5–9, Aβ5–12, Aβ5–12Y10F, and Aβ5–16. Using CD and UV–vis spectroscopies and potentiometry, we found that all peptides coordinated the Cu(II) ion with substantial affinities higher than 3 × 10¹² M–1 at pH 7.4 for Aβ5–9 and Aβ5–12. This affinity was elevated 3-fold in Aβ5–16 by the formation of the internal macrochelate with the fourth coordination site occupied by the imidazole nitrogen of the His13 or His14 residue. A much higher boost of affinity could be achieved in Aβ5–9 and Aβ5–12 by adding appropriate amounts of the external imidazole ligand. The 3N Cu-Aβ5–x complexes could be irreversibly reduced to Cu(I) at about −0.6 V vs Ag/AgCl and oxidized to Cu(III) at about 1.2 V vs Ag/AgCl. The internal or external imidazole coordination to the 3N core resulted in a slight destabilization of the Cu(I) state and stabilization of the Cu(III) state. Taken together these results indicate that Aβ5–x peptides, which bind Cu(II) ions much more strongly than Aβ1–x peptides and only slightly weaker than Aβ4–x peptides could interfere with Cu(II) handling by these peptides, adding to copper dyshomeostasis in Alzheimer brains.
Short abstract
Aβ5−x peptides, members of the N-truncated beta amyloid family comprising the N-terminal Xaa-His motif, exhibit high Cu(II) binding affinity, nearly 1013 M−1 at pH 7.4, which can be further elevated by formation of ternary complexes with internal or external imidazole donors. Formation of such complexes modulates both Cu(II)/Cu(I) and Cu(II)/Cu(III) electrochemical processes maintained by these peptides. Such high Cu(II) affinity and versatility make the Aβ5−x peptides potentially important players in copper (dys)homeostasis in Alzheimer brains.
Introduction
Alzheimer’s disease (AD) accounts for approximately 50–70% cases of dementia, over 50 million people worldwide.1,2 Amyloid-β (Aβ) peptides are at the center of AD pathology. They compose amyloid plaques, a historic hallmark of the disease, and were more recently demonstrated to form neurotoxic oligomers.3,4 Aβ peptides are derived from the amyloid precursor protein (APP), which undergoes alternative proteolytic cleavage pathways in amyloidogenic and nonamyloidogenic processes. In the amyloidogenic pathway APP is cleaved by β-secretase (BACE1), a membrane-anchored aspartyl protease which cleaves APP before position 1 of the Aβ domain, and γ-secretase, a membrane-bound protease complex responsible for creation of the Aβ C-terminus.5 The Aβ1–40 and Aβ1–42 peptides formed in this pathway are further processed hydrolytically to N-terminally truncated species, which represent more than 60% of all Aβ species in AD brains. Aβ4–42 is the most abundant of these peptides.6−9 Another is Aβ5–42, detected in Aβ deposits in brains of sporadic and familial AD victims and in transgenic mouse models.9−11
The origin of Aβ5–x species (x = 38, 40, 42) is unclear. They were shown to be elevated in the course of application of inhibitors of BACE1 in experimental animals.5,12 This suggests direct alternative cleavage of APP, becoming possible when the main pathway is inhibited. They can also be produced by caspases, largely cellular apoptotic proteases implicated in AD neurodegeneration.13
Aβ5–x peptides contain His in the second position (Xaa-His). Such Xaa-His arrangement creates a specific Cu(II) binding site distinct from both the dynamic ensemble of macrochelate species of Aβ1–x peptides14,15 and the rigid ATCUN/NTS chelate system of Aβ4–x peptides.16−18 The basic structure of Xaa-His-Zaa cupric complexes, derived from X-ray studies of Gly-His-Lys (GHK) and spectroscopic studies of many oligopeptides bearing various Xaa substitutions is three-coordinate, with the Xaa N-terminus, the Xaa-His peptide bond, and the His imidazole providing three nitrogen ligands arranged in a square-planar fashion around the Cu(II) ion (3N species). The fourth position can be occupied by a water molecule or other ligands, such as imidazoles or carboxylates from other peptide molecules, phosphate ions, etc.19−21 The amino acid residue directly following His (Zaa in Xaa-His-Zaa... sequences) cannot participate in the coordination for sterical reasons. The stability constants available in the literature indicate that the effective stability constants of Cu(II) complexes of Xaa-His-Zaa peptides are in the range of 1012–1013 M–1, slightly less than those of ATCUN/NTS motifs.18,21−23 We demonstrated, however, that at a sufficiently high concentration of the ternary ligand the effective stability constants of such a ternary XHZ-Cu(II)-L complex may be elevated by one or 2 orders of magnitude.20
In this work, we aimed to characterize Cu(II) coordination and electrochemical properties of resulting complexes, Aβ5–x peptides, by using Aβ5–16 as a suitable well-soluble model, analogously to Aβ1–16 and Aβ4–16 model peptides.15,16 Because of the presence of two metal binding regions in this peptide, one at the N-terminus and another at the His13-His14 couple, we also used shorter peptides, Aβ5–9 and Aβ5–12 as simplified models. For a better understanding of the role of Tyr10 in the studied processes, we also used a modified Aβ5–12Y10F (Aβ5–12F) peptide in some experiments (see Scheme 1 for sequences). Spectroscopic (UV–vis, CD, fluorescence) and potentiometric experiments were used to decipher and quantify the set of complex species formed in a broad pH range, while their redox properties were investigated using voltammetry (CV and DPV). Then, spectroscopic and electrochemical titrations of Cu(II)-Aβ5–x complexes with imidazole, a model of His residues in proteins, were employed to estimate the influence of such interactions on the stability and reactivity of studied complexes. The obtained quantitative description allowed us to assess the potential role of Aβ5–x peptides in copper physiology in the brain.
Scheme 1. Sequences of Aβ5–x Peptides Studied in This Work.

Residues whose side chains contribute to Cu(II) binding are highlighted in red (His) and blue (Tyr).
Experimental Methods
Materials
N-α-9-Fluorenylmethyloxycarbonyl (Fmoc) amino acids were purchased from Novabiochem. Trifluoroacetic acid (TFA), piperidine, and N,N,N′,N′-tetramethyl-O-(1H-benzotriazol-1-yl)uronium hexafluorophosphate (HBTU) were obtained from Merck. Triisopropylsilane (TIS), N,N-diisopropylethylamine (DIEA), 4-(2-hydroxyethyl)piperazine-1-ethanesulfonic acid (HEPES), CuCl2, Cu(NO3)2·H2O, NaOH, KOH, HCl, KNO3, HNO3, and imidazole were from Sigma. The TentaGel S RAM resin was purchased from RAPP Polymere. Diethyl ether and dichloromethane (DCM) were from Chempur. Acetonitrile and calibrated 0.1 M NaOH solution for potentiometry were from POCH, and dimethylformamide (DMF) was from Roth.
Peptide Synthesis
Aβ5–16(RHDSGYEVHHQK-NH2), Aβ5–12(RHDSGYEV-NH2), Aβ5–9(RHDSG-NH2), and Aβ5–12F (RHDSGFEV-NH2) were synthesized by solid-phase peptide synthesis using a CEM Liberty microwave peptide synthesizer (Applied Biosystems) according to a Fmoc/tBu protocol with HBTU and DIEA as coupling reagents and 20% piperidine in DMF as a Fmoc removal agent.24 TentaGel S RAM resin was used as a solid phase. The peptides were cleaved from the resin in TFA/TIS/water 95:2.5:2.5 v/v/v for 2 h. Then, the peptides were precipitated with cold diethyl ether, centrifugated, dissolved in water, and lyophilized. The crude peptides were purified by HPLC (Waters) following a detection at 220 nm/280 nm using a mix of eluting solvents A (0.1% (v/v) TFA in water) and B (0.1% (v/v) TFA in 90% (v/v) acetonitrile). The purification method was a gradient of eluents 5–45% of B within 40 min, flow 2 mL/min. The mass of the pure peptides was further verified by ESI-MS. The concentrations of initial peptide stock solutions were determined by potentiometric titrations. Concentrations of secondary and subsequent stock solutions of Aβ5–12 and Aβ5–16 were determined using an extinction coefficient ε of 1375 M–1 cm–1 at 275 nm. For Aβ5–12F and Aβ5–9 ε values of 200 M–1 cm–1 at 258 nm and ε of 9032 M–1 cm–1 at 214 nm were used.25
UV–vis, CD, and Fluorescence Spectroscopy
The UV–vis spectra were obtained on a PerkinElmer spectrophotometer over the spectral range of 200–900 nm. The circular dichroism (CD) spectra were recorded over the range of 250–800 nm on a Jasco 815 spectropolarimeter. All spectroscopic measurements were performed at 25 °C in a 1 cm path length quartz cuvette.
Titrations with NaOH (pH dependence): Samples containing 1 mM Aβ (Aβ5–9, Aβ5–12, Aβ5–12F, Aβ5–16), and 0.9 mM Cu(II) or 1 mM Aβ (Aβ5–16) and 1.8 mM Cu(II) were titrated with a small portion of concentrated NaOH in the pH range 2.5–10.
Titrations with imidazole/Aβ5–9/Aβ1–16: Samples containing 1 mM Aβ (Aβ5–9, Aβ5–12, Aβ5–12F, Aβ5–16) and 0.8 mM Cu(II) at pH 7.4 were titrated with a small portion of imidazole/Aβ5–9/Aβ1–16 stock solution. The pH of the sample was strictly controlled during the experiment and adjusted if necessary.
Kinetic Experiment
Aβ4–9 was added to the sample containing 0.9 mM Cu(II) and 1 mM Aβ5–9 in 20 mM HEPES pH 7.4 to the final Aβ4–9 concentration of 1 mM. The changes in UV–vis spectra were monitored for 24 h.
Fluorescence spectra were registered using a Cary Eclipse spectrofluorimeter (Varian) with the excitation wavelength of 275 nm and detection of emission in the range of 280–400 nm. All fluorescence measurements were performed at 25 °C in a 1 cm path length quartz cuvette. The samples of 20 μM Aβ5–12 or 20 μM Aβ5–12/19 μM CuCl2 were titrated with NaOH from pH 4.2 to 12.2.
The pK values were calculated using Hill equations eq 1 and eq 2:
(i) for a single process
| 1 |
(ii) for a two-step process
| 2 |
where F stands for spectroscopic intensity at given pH; p1 and p2 stand for spectroscopic intensity for the fully protonated or deprotonated state, respectively; px stands for the spectroscopic intensity of the first step in the two-step process; and n, n1, and n2 stand for Hill coefficients.
Potentiometry
Potentiometric titrations were performed on a Titrando 907 automatic titrator (Metrohm) using a combined glass-Ag/AgCl electrode (InLabMicro, Mettler Toledo, Switzerland). The electrode was calibrated daily by titrating nitric acid.26 The CO2-free solution of 0.1 M NaOH was used as the titrant. All experiments were performed under argon at 25 °C. Sample volumes were 1.5 mL. The samples contained 1.0 mM Aβ peptide (Aβ5–16, Aβ5–12, Aβ5–9) dissolved in 4 mM HNO3/96 mM KNO3. The Cu(II) complex formation was studied for the different peptide:metal stoichiometries (1:2, 1:1, 1:0.5) using a 5–10% excess of peptides over metal ions, over the pH range from 2.3 to 12.2. SUPERQUAD and HYPERQUAD were used to analyze the data.27,28 At least three titrations were performed separately to determined the protonation and Cu(II) stability constants of the studied compounds.
Voltammetry
The electrochemical experiments were done in a three-electrode arrangement with Ag/AgCl as the reference, platinum wire as the counter, and glassy carbon electrode (GCE, BASi, 3 mm diameter) as the working electrode. The reference electrode was separated from the working solution by an electrolytic bridge filled with 4 mM HNO3/96 mM KNO3 solution. The GC electrode was sequentially mechanically polished with 1.0 and 0.3 μm alumina powder on a Buehler polishing cloth to a mirror-like surface. In order to remove the remaining powder, the electrode was sonicated for 1 min in deionized water. All electrochemical measurements were carried out in 96 mM KNO3 solutions containing 4 mM HNO3 solution at pH 7.4. The pH was adjusted by adding small volumes of concentrated KOH or HNO3 solutions; the concentrations of peptides were 0.5 mM and the ligand-to-Cu(II) ratio was 1:0.8 in all cases (a small Cu(II) deficiency was applied to avoid the interference from uncomplexed Cu(II) cations). In ternary complex investigations imidazole was added to the Cu(II)–peptide complex up to 10 mM concentration. The pH was closely controlled before, during, and at the end of each voltammetric measurement. Oxygen was removed from the sample solution by passing argon for 5–10 min before all measurements, and an argon blanket was maintained over the solution during the experiments carried out at 25 °C.
Cyclic (CV) and differential pulse voltammetry (DPV) experiments were performed using the CHI 1030 potentiostat (CH Instrument, Austin, USA). For all presented CV curves, the scan rate (v) was 100 mV/s. The following parameters were used in DPV: pulse amplitude 50 mV, pulse time 100 ms.
Results and Discussion
Aβ5–9 Complexes
We first performed a set of pH-metric titrations of the studied peptides in the absence and presence of Cu(II) ions. The protonation constants calculated from these experiments are presented in Table 1. The assignments of proton exchanging groups mainly contributing to given protonation constants are based on previous studies of analogous peptides.16,29,30 The pKa values are typical for the respective groups and sufficiently well separated to make these assignments unambiguous.31
Table 1. Protonation Constants (log βa and pKa Values) of Aβ5–9, Aβ5–12, and Aβ5–16 (L) at I = 0.1 M (KNO3), Determined by Potentiometry at 25 °Cb16,29,30.
| Species | Log βa | pKa | Assignment |
|---|---|---|---|
| Aβ5–9 | |||
| HL | 7.37(1) | 7.37 | Arg5 N-term. |
| H2L | 13.51(1) | 6.13 | His6 |
| H3L | 16.67(1) | 3.17 | Asp7 |
| Aβ5–12 | |||
| HL | 10.08(1) | 10.08 | Tyr10 |
| H2L | 17.60(1) | 7.52 | Arg5 N-term. |
| H3L | 23.84(1) | 6.25 | His6 |
| H4L | 28.21(1) | 4.37 | Glu11 |
| H5L | 30.94(1) | 2.73 | Asp7 |
| Aβ5–16 | |||
| HL | 10.39(1) | 10.39 | Tyr10/Lys16 |
| H2L | 20.35(1) | 9.96 | |
| H3L | 27.94(1) | 7.60 | Arg5 N-term. |
| H4L | 34.61(1) | 6.67 | His6/13/14 |
| H5L | 40.92(1) | 6.31 | |
| H6L | 46.43(1) | 5.50 | |
| H7L | 50.35(1) | 3.92 | Glu11 |
| H8L | 52.83(1) | 2.48 | Asp7 |
β(HnL) = [HnL]/([L][H+])n.
Standard deviations on the last digits provided by HYPERQUAD,28 given in parentheses, represent statistical errors of constant determinations. Assignments are based on literature values.
The potentiometric titrations performed at various Cu(II)/peptide ratios for Aβ5–9 indicated the formation of complexes having solely a 1:1 copper-to-peptide stoichiometry and differing by the number of bound/released hydrogen ions (Table 2). The CD and UV–vis spectra of Cu(II)-Aβ5–9 complexes are presented in Figures 1 and S1, respectively. Figure 2 demonstrates the potentiometric species distribution compared to parameters derived from these spectra. The quantitative agreement of these results allowed us to calculate the spectroscopic parameters for individual complexes, as given in Table 3. The first complex formed is a 3N species with spectroscopic parameters analogous to those recorded earlier for GHK, WHWSKNR-NH2, and GHTD-NH2 peptides,19−23 with the fourth equatorial site occupied by a water molecule. It contains two spectroscopic forms, CuL and CuH–1L, differing by deprotonation of the Asp7 side chain carboxyl function. This event, recorded by potentiometry with the pKa of 3.82, does not affect the spectroscopic parameters (Tables 2 and 3). It is not surprising, as the coordination of the Asp7 carboxylate to the Cu(II) ion bound in the 3N core provided by Arg5 and His6 is excluded by the complete geometry. The elevation of Asp7 pKa by 0.65 pH units can be explained by lowering the overall molecular charge by Cu(II) coordination by one, compared to the unbound peptide.
Table 2. Stability Constants (log βa and pKa Values) of Cu(II) Complexes of Aβ5–9, Aβ5–12, and Aβ5–16 (L) at I = 0.1 M (KNO3), Determined by Potentiometry at 25 °Cb.
| Species | Log βa | pKa | Assignment | Coordination Mode |
|---|---|---|---|---|
| Aβ5–9 | ||||
| CuL | 9.48(1) | 3N+H2O | ||
| CuH–1L | 5.66(1) | 3.82 | Asp7 | 3N+H2O |
| CuH–2L | –3.69(1) | 9.35 | Equatorial H2O | 3N+OH– |
| Total 3N+H2O | 3.61 | 3N+H2O | ||
| Aβ5–12 | ||||
| CuH2L | 23.72(3) | 3N+H2O | ||
| CuHL | 20.44(1) | 3.23 | Asp7 | 3N+H2O |
| CuL | 15.76(1) | 4.69 | Glu11 | 3N+H2O |
| CuH–1L | 6.29(2) | 9.47 | Tyr10/H2O | 3N/Tyr10 and 3N+OH– |
| CuH–2L | –3.76(2) | 10.05 | H2O/Tyr10 | 3N+OH– |
| Total 3N+H2O | 3.66 | |||
| Aβ5–16 | ||||
| CuH5L | 46.00(2) | 3N+H2O | ||
| CuH4L | 42.79(1) | 3.212 | Asp7 | 3N+H2O |
| CuH3L | 38.62(1) | 4.169 | Glu11 | 3N+H2O |
| CuH2L | 33.46(1) | 5.159 | His13/14 | 3N+N |
| CuHL | 26.11(2) | 7.35 | His13/14 | 3N+N |
| CuL | 16.43(3) | 9.68 | Equatorial H2O/Tyr10/Lys16 | 3N+N/3N+OH– |
| CuH–1L | 6.56(3) | 9.87 | ||
| CuH–2L | –3.38(2) | 9.94 | ||
| Cu2HL | 31.50(1) | |||
| Cu2L | 25.37(1) | 6.134 | His13/14 N– | 3N+H2O + 2N |
| Cu2H–1L | 19.08(1) | 6.29 | 3N+H2O + 3N | |
| Cu2H–2L | 10.15(1) | 8.93 | Val12/Glu11 N– | 3N+H2O + 4N |
| Cu2H–3L | 1.05(1) | 9.1 | Equatorial H2O | 3N/OH- + 4N |
| Cu2H–4L | –9.4(1) | 10.45 | Lys16/Tyr10 | 3N/OH- + 4N |
| Cu2H–5L | –19.94(9) | 10.54 | 3N/OH- + 4N | |
| Total 3N+H2O | 3.62 |
β(CumHnL) = [MmHnL]/([M]m[L][H+]n).
Figure 1.
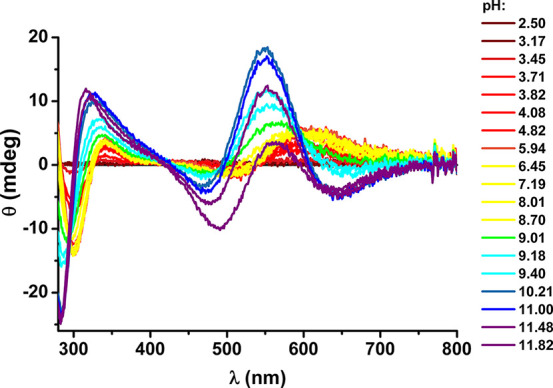
pH dependence of CD spectra recorded at 25 °C for 0.9 mM Cu(II) and 1.0 mM Aβ5–9, at pH values color coded on the graphs.
Figure 2.
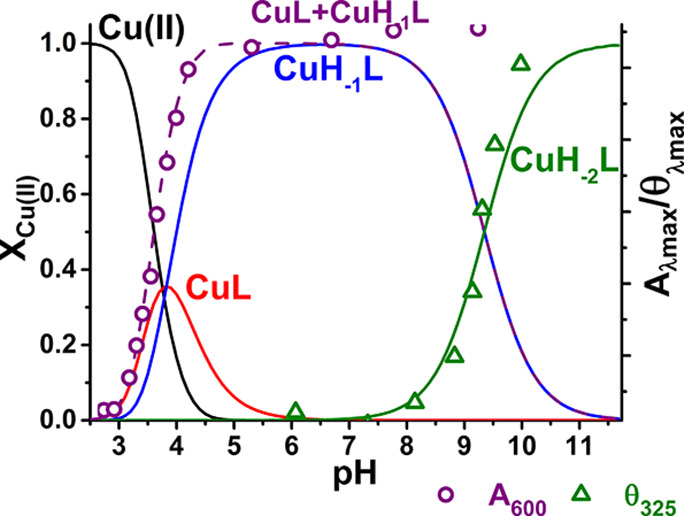
Species distribution calculated for 0.9 mM Cu(II) and 1.0 mM Aβ5–9, on the basis of constants presented in Tables 1 and 2, with selected spectroscopic parameters overlaid.
Table 3. Spectroscopic Parameters for Cu(II) Mono-complexes of Aβ5–x Peptides at 25 °C.
| UV–vis | CD | ||
|---|---|---|---|
| Complex | Mode (species) | λmax/nm (ε/M–1 cm–1) | λext/nm (Δε/M–1 cm–1) |
| Cu(II)-Aβ5–9 | 3N+H2O (CuL + CuH–1L) | 600 (47)a | 600 (+0.17)a |
| 505 (−0.05)a | |||
| 341 (+0.12)b | |||
| 300 (−0.46)c | |||
| 267 (+0.53)d | |||
| 3N+OH– (CuH–2L) | 555 (63)a | 650 (−0.1)a | |
| 546 (+0.61)a | |||
| 470 (−0.11)a | |||
| 325 (+0.38)b,c | |||
| 285 (−0.76)d | |||
| Cu(II)-Aβ5–12 | 3N+H2O (CuH2L+CuHL+CuL) | 600 (60)a | 600 (+0.14)a |
| 503 (−0.05)a | |||
| 341 (+0.09)b | |||
| 301 (−0.37)c | |||
| 3N/Tyr10 and 3N+OH– (CuH–1L) | 560 (89)a | 650 (−0.09)a | |
| 400sh (82)e | 548 (+0.29)a | ||
| 470 (−0.09)a | |||
| 400 (+0.09)e | |||
| 325 (+0.25)b | |||
| Cu(II)-Aβ5–12F | 3N+H2O | 600 (60)a | 605 (+0.16)a |
| 513 (−0.05)a | |||
| 341 (+0.08)b | |||
| 301 (−0.39)c | |||
| 3N+OH– | 555 (85)a | 650 (−0.08)a | |
| 553 (+0.44)a | |||
| 470 (−0.09)a | |||
| 323 (+0.28)b,c | |||
| 283 (−0.64)d | |||
| Cu(II)-Aβ5–16 | 3N+H2O (CuH5L+CuH4L+CuH3L) | 600 (58)a | 605 (+0.19)a |
| 506 (−0.05)a | |||
| 341 (+0.11)b | |||
| 301 (−0.47)c | |||
| 3N+N (CuH2L+ CuHL) | 565 (66)a | 640 (−0.05)a | |
| 553 (+0.16)a | |||
| 478 (−0.09)a | |||
| 336 (+0.12)b | |||
| 300 (−0.35)c | |||
| 3N+OH– (CuL+CuH-1L+CuH–2L) | 560 (73)a | 640 (−0.07)a | |
| 553 (+0.20)a | |||
| 478 (−0.10)a | |||
| 336 (+0.17)b,c |
d–d transition.
Nim–CuII charge transfer (CT).
N––CuII CT.
Nam–CuII CT.
Tyr O––CuII CT.
The next recorded deprotonation occurred with the pKa of 9.35 and was associated by a significant blue shift of the d–d band maximum, the change of its symmetry in CD, and concomitant alterations in charge transfer bands (Figure 1, Table 3). These changes are due to the deprotonation of the coordinated water molecule.20,21 The additional split in the d–d band, not observed in titrations of WHWSKNR-NH2 and GHTD-NH2 complexes,19,20 is indicative of an additional interaction involving the coordinated hydroxyl anion, most likely with the cationic Arg side chain.
At still higher pH above 10 a further set of changes appeared in the CD spectra, with a characteristic strong negative feature at 500 nm. According to the literature, they are due to the replacement of the hydroxyl group by the deprotonated Nτ of the imidazole ring, possibly resulting in imidazole-bridged oligomers.21,32,33
The potentiometric titrations did not provide evidence for the presence of a CuL2-type complex. Such complexes were reported previously for simpler XHZ peptides by potentiometry, but with little support by independent direct techniques in solution.17,19,23,32−35 No such complex was detected for WHWSKNR-NH2. It was also invisible for potentiometry in the study of GHTD-NH2 complexes, due to insufficient stability at submillimolar peptide concentrations, but a spectroscopic titration with the peptide excess demonstrated its existence at pH 7.4.21 Here we used the same approach to detect it, as shown in Figure 3. The associated spectral changes were very similar to those observed for GHTD-NH2, indicating the formation of a 3 + 1N complex, with the water molecule replaced by an imidazole nitrogen of the second peptide molecule. The conditional stability constant derived from this titration is provided in Table 4, and the spectral parameters of this complex are given in Table 5, along with the parameters of ternary complexes with imidazole.
Figure 3.
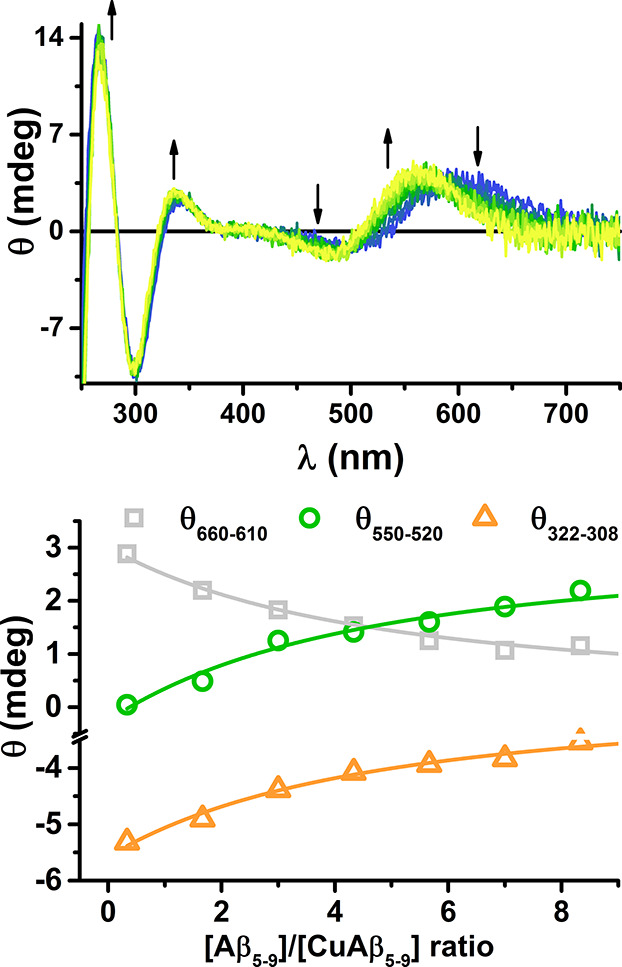
Top: the titration of 0.8 mM Cu(II) and 1.0 mM Aβ5–9 at 25 °C and pH 7.4 with the excess of Aβ5–9, up to 15 mM, monitored by CD. Arrows mark the direction of changes. Bottom: the fit of the conditional stability constant of the CuL2 complex at spectral areas of maximum change: 635 nm (gray), 535 nm (green), and 315 nm (orange).
Table 4. Conditional Stability Constants (M–1) for Binary (CK7.4) and Ternary (TK7.4) for Cu(II) Complexes of Aβ5–x Peptides at pH 7.4a.
|
TK7.4 |
||||
|---|---|---|---|---|
| Peptide | CK7.4 | imidazole | Aβ5–9 | Aβ1–16 |
| Aβ5–9 | 5.75 × 10¹² | 870 ± 69 | 283 ± 50 | 5200 ± 200 |
| Aβ5–12 | 5.13 × 10¹² | 557 ± 36 | n.a. | n.a. |
| Aβ5–16 | 9.55 × 10¹² | 98 ± 27 | n.a. | n.a. |
CK7.4 values were calculated from potentiometric data using the CI approach. Competitivity index (CI) was calculated for Cu(II), peptide, and ligand (Z) concentrations of 0.001 M. CI is the value of log KCuZ such as the condition ∑ijk([CuiHjLk]) = [CuZ] is fulfilled, where Z is a theoretical competitor.39 n. a. stands for not analyzed. TK7.4 were calculated directly from spectroscopic titrations using eq 1.
Table 5. Spectroscopic Parameters of Ternary Complexes of Cu(II)-Aβ5–x with Imidazole (Im) or Aβ5–x at 25 °C.
| UV–vis | CD | ||
|---|---|---|---|
| Ternary complex | Mode | λmax/nm (ε/M–1 cm–1) | λext/nm (Δε/M–1 cm–1) |
| Cu(II)-Aβ5–9+ Aβ5–9 | 3N+NAβ(5–9) | 566 (79)a | 560 (+0.20)a |
| 478 (−0.08)a | |||
| 335 (+0.15)b | |||
| 300 (−0.37)c | |||
| 267 (+0.51)d | |||
| Cu(II)-Aβ5–9+ Aβ1–16 | 3N+NAβ(1–16) | 575 (76)a | 564 (+0.22)a |
| 482 (−0.07)a | |||
| 337 (+0.17)b | |||
| 298 (−0.37)c | |||
| Cu(II)-Aβ5–9+ Im | 3N+NIm | 566 (75)a | 645 (−0.11)a |
| 551 (+0.17)a | |||
| 478 (−0.08)a | |||
| 332 (+0.11)b | |||
| 296 (−0.35)c | |||
| 265 (+0.54)d | |||
| Cu(II)-Aβ5–12+ Im | 3N+NIm | 562 (81)a | 644 (−0.11)a |
| 550 (+0.17)a | |||
| 478 (−0.11)a | |||
| 333 (+0.13)b | |||
| 297 (−0.40)c | |||
| Cu(II)-Aβ5–16+ Im | 3N+NIm | 564 (70)a | 645 (−0.08)a |
| 553 (+0.19)a | |||
| 478 (−0.06)a | |||
| 330 (+0.12)b | |||
| 297 (−0.35)c |
d–d transition.
Nim–CuII charge transfer (CT).
N––CuII CT.
Nam–CuII CT.
Aβ5–12 and Aβ5–12F Complexes
The extension of the sequence by residues 10–12, YEV, added two proton-exchanging side chains, Tyr10 and Glu11 in Aβ5–12. Their characteristic pKa values about 10 and 4, respectively, together with the data for Aβ5–9, allowed us to directly assign the respective protonation events to individual groups, as provided in Table 1 and presented in Figure 4.
Figure 4.
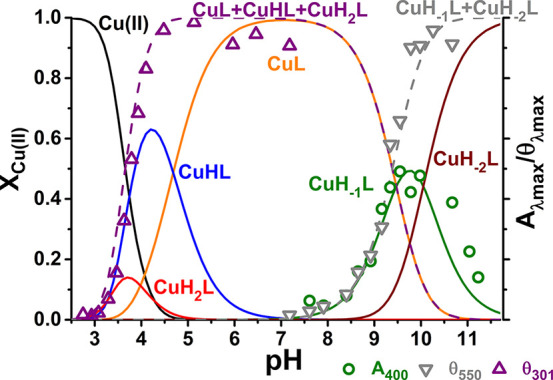
Species distribution calculated for 0.9 mM Cu(II) and 1.0 mM Aβ5–12, on the basis of constants presented in Tables 1 and 2, with selected spectroscopic parameters of Aβ5–12 overlaid.
Accordingly, the lowest-pH complex of Aβ5–12 has the CuH2L stoichiometry, but the same 3N coordination as the CuL complex of Aβ5–9, as seen in CD and UV–vis spectra, presented in Figures 5A and S2, respectively. The next two deprotonations under pH 5 did not affect the spectra and can be assigned to Asp7 and Glu11 carboxyl deprotonations. The spectra became more complicated above pH 8, where two overlapping deprotonations took place. In order to facilitate the analysis, we performed spectroscopic titrations of Cu(II)-Aβ5–12F, the analog having Tyr replaced with Phe. The respective CD and UV–vis results are presented in Figures 5B and S3.
Figure 5.
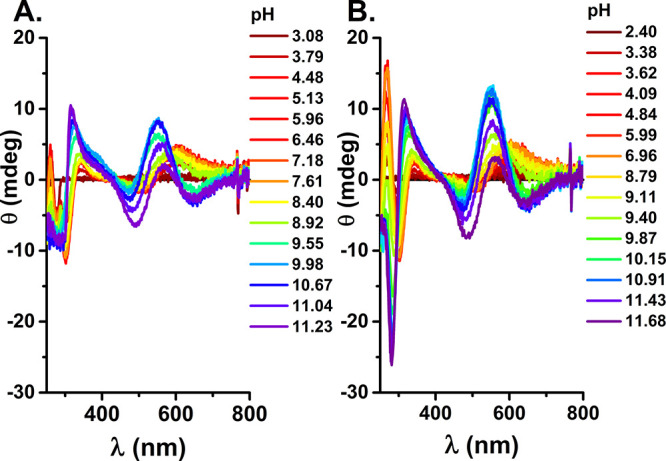
CD spectra recorded at 25 °C for 0.9 mM Cu(II) and 1.0 mM Aβ5–12 (A) or 0.9 mM Cu(II) and 1.0 mM Aβ5–12F (B) at pH values color coded on the graphs.
The pKa values for the 3N complex formation obtained from CD titrations were 3.77(1) and 3.51(2) for the formation of 3N complexes of Aβ5–12 and Aβ5–12F, respectively. The former value is in a good agreement with the potentiometry-derived value of 3.66. Based on the characteristic CT band at 400 nm, seen particularly clearly in UV–vis spectra of Cu(II)-Aβ5–12 contrasted with Cu(II)-Aβ5–12F in the pH range 7–10 (Figure 6A) and CD titrations monitored at 370–380 nm (Figure 6B), we can assign the deprotonation event about pH 9 (8.89(3) from CD, 8.95(7) from UV–vis) to deprotonation and equatorial Cu(II) coordination of Tyr10 phenolate oxygen.36,37 This band disappears gradually above pH 9.5, in accord with another deprotonation, which can thus be assigned to the replacement of Tyr O– by the solution-derived OH– group, with pKa = 9.92(5). At very high pH an imidazole bridged species is formed as in Cu(II)-Aβ5–9.
Figure 6.
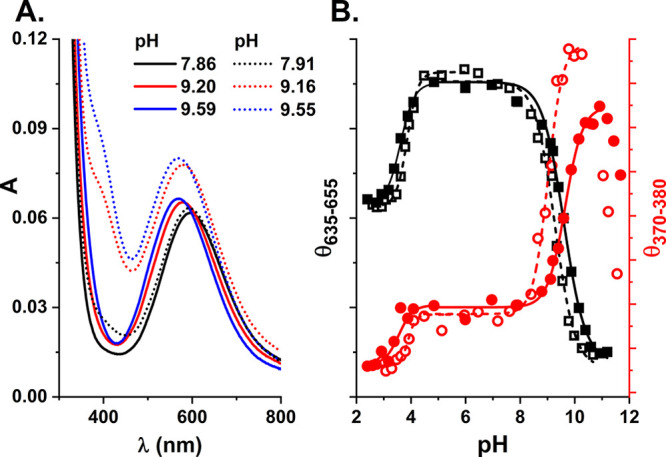
(A) Comparison of UV–vis spectra of Cu(II) complexes of spectra recorded at 25 °C for 0.9 mM Cu(II) and 1.0 mM Aβ5–12F (solid lines) or Aβ5–12 (dotted lines) at pH values indicated on the graph. (B) pH dependence of CD signals at 370–380 nm (red circles) or 635–655 nm (black squares) derived from CD spectra shown in Figure 5 for 0.9 mM Cu(II) and 1.0 mM Aβ5–12F (full symbols) or Aβ5–12 (open symbols).
The comparison of pKa values for uncoordinated Tyr, 10.08, coordinated Tyr, 8.89, and deprotonated water in Cu(II)-Aβ5–12, 9.92 vs 9.3 for Cu(II)-Aβ5–9 (average of potentiometric and spectroscopy calculations) and 9.62(3) in Aβ5–12F (from spectroscopy), allowed us to estimate the ratio of Cu(II) affinities of Tyr phenolate vs the hydroxyl group at pH 9 as ca. 8.3. The physiological relevance of this interaction is limited, however, as the Cu(II) occupancy by Tyr phenolate at pH 7.4 is 3% or less, estimated from potentiometric data compared to fluorescence titrations of Aβ5–12 and Cu(II)-Aβ5–12 (Figure S4).
Aβ5–16 Complexes
A further C-terminal peptide sequence extension by residues 13–16, VHHQK, added three proton-exchanging side chains, compared to Aβ5–12, His13, His14, and Lys16. As a result, the separation of contributions to potentiometric macroconstants of Tyr10 and Lys16 on one hand and of His6, His13, and His14 on another was not possible, due to overlapping protonation processes. The differences between the respective pKa values, presented in Table 1, are close to statistical values for two and three equivalent groups, 0.6 and 0.48 pH units, respectively.31 All these values remain in their typical ranges.
Due to the presence of two distinct Cu(II) binding sites in Aβ5–16, the spectroscopic and potentiometric experiments were performed at the 1.8:1 Cu(II):peptide ratio, in addition to the 0.9:1 ratio used for shorter analogs. The CD titration for the 0.9:1 ratio is presented in Figure 7, the UV–vis titration in Figure S5, and the species distribution plots in Figure 8. The respective data for the 1.8:1 ratio are presented in Figures S6, S7, and S8.
Figure 7.
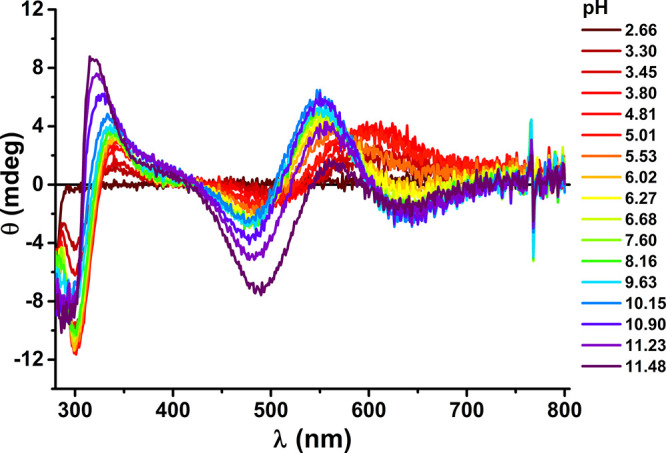
PH dependence of CD spectra recorded at 25 °C for 0.9 mM Cu(II) and 1.0 mM Aβ5–16, at pH values color coded on the graph.
Figure 8.
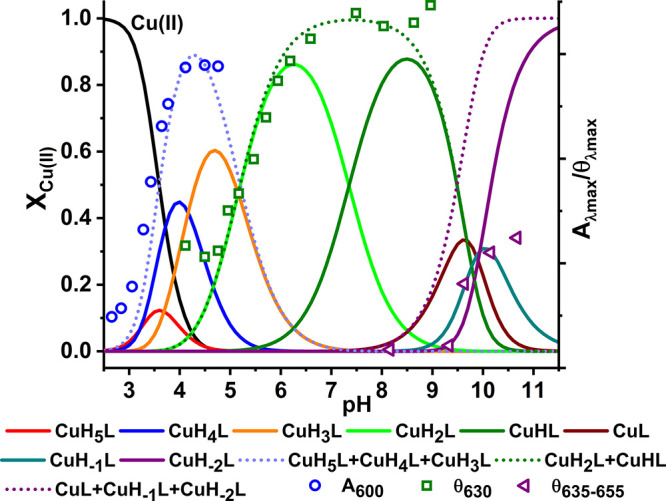
Species distribution calculated for 0.9 mM Cu(II) and 1.0 mM Aβ5–16, on the basis of constants presented in Tables 1 and 2, with selected spectroscopic parameters of Aβ5–16 overlaid.
At the 0.9:1 ratio the CuH5L and CuH4L and CuH3L complexes present at low pH correspond to the 3N complex. Its spectroscopic parameters with d–d bands at 600 nm at the UV–vis spectrum as well as at 506 and 605 nm at the CD spectrum are very similar to those observed for the 3N complexes of Aβ5–9 and Aβ5–12. The pKa of formation of this complex calculated from spectroscopic and potentiometric data is 3.4–3.6. This spectroscopic species is superseded with another, comprising the CuH2L and CuHL stoichiometries, which exhibited a 35 nm blue shift of the d–d band in the UV–vis spectra and significant changes in the CD pattern (see Table 3, Figure 7, and Figure S5). The pKa of this process derived from spectroscopy is 5.55. The only residues that can release a proton in this pH range are His13 and His14. These residues are essentially equivalent in the apopeptide, but their pKa values in the complex are 5.16 and 7.35. These features clearly indicate that His13 or His14 replaces the water molecule in the fourth equatorial coordination site. This observation is further supported by the lack of Tyr phenolate coordination (the absence of a 400 nm band) above pH 8 in Cu(II)-Aβ5–16. As a result the Cu(II)-independent Tyr10 and Lys16 deprotonations occur at pH 9.5–10, along with the third proton release, which must originate from the replacement of Nim by OH– in the fourth site. This replacement induces a small change in CD spectra as shown in Figure 8, indicating that the pKa for this process is ca. 9.65, about 0.3 log units higher than in Cu(II)-Aβ5–9. As for all other Aβ5–x peptides a major spectral change above pH 11 was noted, tentatively assigned to the formation of the imidazole bridged tetramer. The protonic equivalence of His13 and His14 and their similar distancing to the N-terminally coordinated Cu(II) ion suggests that the 3 + 1N complex is actually a mixture of His13 and His14 coordinated species, perhaps with a slight distance-wise preference for His13.
The experiments performed at the Cu(II) excess indicate that the 3N complex is formed in a fashion similar to that at the 1:1 ratio, but it is followed by the additive formation of a novel spectral band (∼579 nm) with the pKa of 5.90. This complex is analogous to that observed before for Cu(II)-Aβ4–16 and corresponds to an independent formation of the second Cu(II) ion at the His13 and His14 residues.16 As expected, the binding of the second Cu(II) ion at His13/His14 prevented the entry of His13/His14 Nim to the coordination sphere of the N-terminal 3N complex.
Ternary Complexes
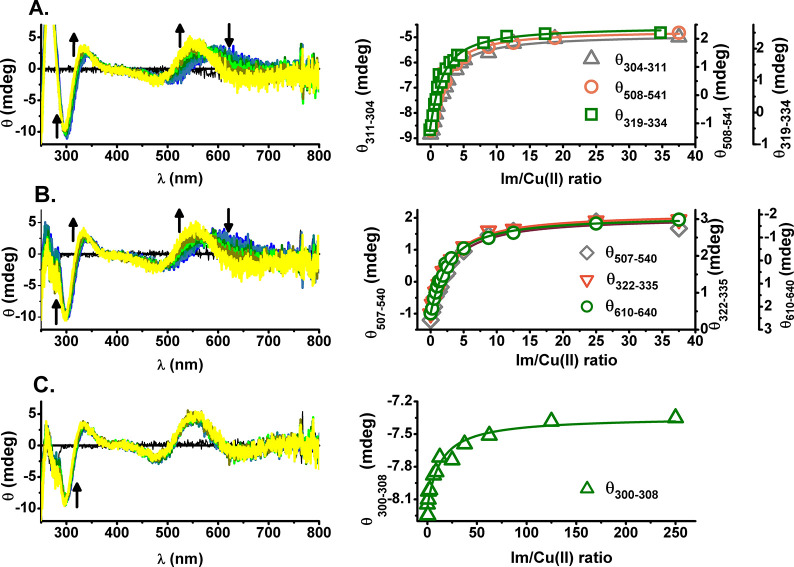
To further investigate the role of the fourth equatorial site in Cu(II) coordination of Aβ5–x peptides, we performed CD titrations of Cu(II)-Aβ5–9/Aβ5–12/Aβ5–16 complexes with imidazole (Im). The respective CD spectra and titration curves are provided in Figure 9.
Figure 9.
CD titrations and resulting titration curves for Cu(II) complexes of Aβ5–9 (A), Aβ5–12 (B), and Aβ5–16 (C) with imidazole (Im) for 1 mM Aβ5–x and 0.8 mM Cu(II) at pH 7.4. The increasing Im concentrations are color-coded from blue to yellow. The directions of changes are marked by arrows. The titration curves were generated by averaging spectral intensities over the given wavelength ranges for better signal-to-noise ratios. There were no spectral changes in the d–d range for Aβ5–16.
The addition of Im resulted in a blue-shift of d-d bands of Cu(II)-Aβ5–9/Aβ5–12 from 600 to 550 nm as shown in Figure 9A and 9B, respectively. These changes were accompanied by a 10 nm blue-shift and an increase of intensity of CT bands at 340 and 300 nm. No changes in the d–d bands and only a slight effect in CT signals were noticed during the analogous titration of Cu(II)-Aβ5–16 (see Figure 9C), even at the final 250-fold excess of Im over Cu(II).
The effects seen for Cu(II)-Aβ5–9/Aβ5–12 complexes were analogous to those seen previously for Im titrations of all Xaa-His peptides studied by us recently, including WHWSKNR-NH2, GHTD-NH2, and GHK20,21,38 and are consistent with the replacement of the equatorially coordinated water molecule in the3N coordination mode (Nam, Nim, N–) dominant at pH 7.4, with the Im nitrogen, forming the ternary 3N+1N (Nam, NimHis6, N–+ NIm) complex. The same effects were observed for titrations of 3N complexes with the excess of the parent peptide for GHTD-NH2 and GHK21,38 and Aβ5–9 in this work. The much less pronounced response of Cu(II)-Aβ5–16 to Im can be readily explained by the intramolecular 3 + 1N coordination in this complex, employing His13/His14 residues. Nevertheless, a slight change of intensity of the CT band at 304 nm, along with the absence of changes in d–d bands can be ascribed to the forced replacement of the intramolecular ligand by external Im. The conditional stability constants (KT) for Im binding to Cu(II)-Aβ5–x complexes were obtained by global fitting of multiple titration curves according to eq 3:
| 3 |
where L is the Aβ5–x peptide from the initial binary Cu(II) complex.
The KT values are provided in Table 4. The strongest ternary complex was formed for Cu(II)-Aβ5–9 followed by Cu(II)-Aβ5–12. The lower KT for the latter could be caused by steric hindrance from additional residues in the Aβ5–12 sequence. Such effect is evident in the 3-fold lower KT for the second Aβ5–9 molecule, compared to Im. A further 5-fold lowering of KT for Cu(II)-Aβ5–16 compared to Cu(II)-Aβ5–12 is apparently a combination of additional hindrance and the competition from the intramolecular His13/His14 binding. The comparison of CK values presented in Table 4 indicates that this interaction increases the overall Cu(II) affinity of Aβ5–16 by 1.8 times. This value is in excellent agreement with that derived from the 0.33 pH units shift of OH– coordination (Aβ5–9 vs Aβ5–16, 2.1 times). Therefore, the lowering of Im affinity to Cu(II)-Aβ5–16 is a combination of competition between Im and His13/His14 and the increased hampering of Im access to the Cu(II) binding site.
Additionally, we performed a titration of Cu(II)-Aβ5–9 with Aβ1–16 (SI, Figure S9). Partial precipitation of the ternary complex limited the accuracy of the TK7.4 determination, which was estimated as 5200 M–1 (Table 4). This high stability compared to other ternary complexes of Cu(II)-Aβ5–x can be attributed in part to the presence of three His imidazole ligands in Aβ1–16 available for the binding, and in part to intermolecular interactions between the Cu(II)-Aβ5–9 peptides. We also attempted the study of the Cu(II)-Aβ5–16 + Aβ1–16 system, but it was precluded by poor solubility of the ternary complex and the apparently weak interaction.
Voltammetry
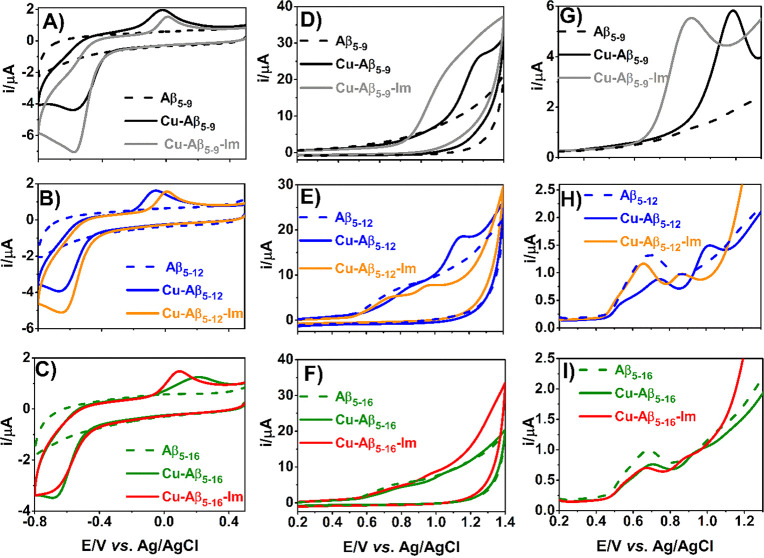
For further characterization of Aβ5–x peptides, their binary Cu(II) complexes, and ternary complexes with Im, we performed a series of electrochemical experiments using cyclic voltammetry (CV) and differential pulse voltammetry (DPV). The CV results for Aβ5–9, Aβ5–12, and Aβ5–16 are presented in Figure 10, with auxiliary CV results for Aβ5–12F provided in Figure S10. All apo-peptides were electrochemically inactive in the studied range of potentials (initially scanning from 0.5 V toward the negative direction, Figure 10A–C, black, blue, green, dashed lines; gray dashed line in Figure S10A), except for broad peaks observed at 0.6–0.9 V for Aβ5–12 and Aβ5–16 (Figure 10E–F, H–I, blue and green dashed lines) assigned to the Tyr10 phenol ring oxidation to a thermodynamically unstable tyrosyl radical subsequently converted into orthoquinone.40−42 Aβ5–9 and Aβ5–12F were redox silent in this range, as expected (Figure 10D, G; Figure S10B).
Figure 10.
CV (A–F) and DPV (G–I) curves of 0.5 mM Aβ5–9 (A, D, G), Aβ5–12 (B, E, H), and Aβ5–16 (C, F, I) recorded in the absence (dashed line) or the presence of 0.40 mM Cu(II) and 5.0 mM imidazole, pH 7.4.
The 3N Cu(II)-Aβ5–x complexes yielded irreversible reduction peaks in voltammograms recorded from +0.5 V to −0.8 V (Figure 10A–C, Figure S11, black, blue, and green solid lines and Figure S10A, gray solid line, see Table 6 for CV and DPV-derived potentials). A significant separation between the cathodic and anodic peaks suggests a slow electron transfer and/or a reorganization of the complex structure upon Cu(II) reduction. This can be explained by the incompatibility of the planar 3N chelate of Aβ5–x peptides with geometrical preferences of Cu(I) ions, as pointed out previously by Hureau et al. in their Cu(II)-GHK study.19 The cathodic peak of Cu(II)-Aβ5–16 had an altered shape, appeared at the most negative potential, and had the lowest peak current (Figure 10C green solid line, Table 6). These effects are compatible with the formation of the 3 + 1N coordination structure supplanted by the His-13/His-14 imidazole nitrogen.
Table 6. Properties of Redox Processes from CV and DPV Curves of Aβ5–x Binary and Ternary Complexesa.
| Cu(II)/Cu(I) |
Cu(II)/Cu(III) |
||||||
|---|---|---|---|---|---|---|---|
| Complex | ECVRED | ECVOX | EDPV | IDPV (μA) | ECVOX | EDPV | IDPV (μA) |
| Cu(II)-Aβ5–9 | –0.579(5) | –0.025(1) | –0.453(5) | –1.318(4) | 1.297(2) | 1.184(4) | 2.77(5) |
| Cu(II)-Aβ5–9-Im | –0.576(1) | 0.011(4) | –0.492(1) | –1.490(7) | 1.094(5) | 1.024(2) | 2.918(9) |
| Cu(II)-Aβ5–12F | –0.633(5) | 0.054(3) | –0.540(1) | –1.473(6) | 1.269(5) | 1.158(2) | 3.02(5) |
| Cu(II)-Aβ5–12 | –0.669(1) | –0.062(2) | –0.523(2) | –1.037(5) | 1.159(2) | 1.018(2) | 0.469(5) |
| Cu(II)-Aβ5–12-Im | –0.647(3) | 0.008(3) | –0.516(1) | –1.000(6) | 0.955(4) | 0.863(2) | 0.145(1) |
| Cu(II)-Aβ5–16 | –0.680(4) | 0.200(5) | –0.557(2) | –0.434(5) | 1.058(4) | 0.938(3) | 0.065(4) |
| Cu(II)-Aβ5–16-Im | –0.688(2) | 0.093(2) | –0.560(6) | –0.383(7) | 0.973(1) | 0.876(6) | 0.052(2) |
E values are given in V vs Ag/AgCl.
The Cu(II)-Aβ5–x complexes can generate a Cu(II)/Cu(III) redox couple at potentials around 1 V and higher (Figure 10D–I (black, blue, and green solid lines) and Figure S10B (solid gray line)). For binary Cu(II)-Aβ5–x complexes with Tyr-containing peptides, the Cu(II)/Cu(III) redox signal was preceded by Tyr10 oxidation peaks of decreased intensity and shifted to more positive potentials relative to apopeptides, in agreement with the literature.41 The lack of Cu(III)/Cu(II) reduction peaks in the studied complexes may be attributed to the catalytic oxidation of peptide ligands via the electrogenerated (highly oxidizing) Cu(III) species according to an EC (electrochemical-chemical) mechanism. In addition to the Tyr phenolic ring, His imidazoles in Cu(II)-Aβ5–16 can also be oxidized by Cu(III) at such potentials, (Eox ∼ 1.25 V for l-His42 and ∼1.0 V for His in Aβ42/Aβ1643). The use of faster scan rates (0.5–5 V/s) did not improve the reversibility of the studied process (data not shown). The EC mechanism explains the irreversibility of these Cu(II)/Cu(III) couples, in contrast to the reversible Cu(II)/Cu(III) process in Aβ4–8 and Aβ4–10F complexes.44 The potentials of Cu(II)/Cu(III) peaks for Aβ5–x complexes appeared in the following decreasing order: Cu(II)-Aβ5–16 > Cu(II)-Aβ5–12 > Cu(II)-Aβ5–12F > Cu(II)-Aβ5–9 (see Table 6 for values). Additionally, the intensity of the oxidation current increased in the same sequence.
Finally, electrochemical measurements for ternary Im complexes of Cu(II)-Aβ5–x were done (Figure 10A–I, gray, orange, and red solid lines). A 12.5-fold Im excess over Cu(II) excess was used to ensure full saturation of Cu(II) with Im for Cu(II)-Aβ5–9 and Cu(II)-Aβ5–12 and 50% saturation for Aβ5–16, according to equilibrium titrations. No significant changes in the voltammetric signature were noticed in the range of negative potentials (Figure 10A–C, Figure S11), but according to CV and DPV curves registered in the 0.2–1.3 V potential range (Figure 10D–I), the Im addition shifted both the Cu(II)/Cu(III) and Tyr10 oxidation toward less positive potentials. This is in accord with the presence of the 3 + 1N coordination of Cu(II) in the ternary complex, which stabilizes Cu(III) better.45 The largest shifts in electrochemical responses occurred for Cu(II)-Aβ5–9-Im and Cu(II)-Aβ5–12-Im in relation to the binary complexes. In contrast, a weaker interaction between Cu(II)-Aβ5–16 and imidazole due to the presence of the autoternary complex resulted in a smaller change in redox activity of this chelate. Still, the potentials of formation of Cu(III) species are probably too high to have a biological relevance.
Cu(II) Exchange and Biological Relevance
The stability of a complex is a key property in considering its biological relevance, as biological fluids are teeming with small molecules and proteins ready to compete for copper. Aβ peptides are essentially extracellular, and their toxicity is exerted mostly in synapses. Not much is known quantitatively about the fast-changing composition of synaptic cleft fluid. Therefore, we are forced to make educated guesses regarding Cu(II) complexation by Aβ peptides. The Aβ1–x family peptides bind the Cu(II) ion with log CK7.4 = 10.04 (x = 16) and 10.43 (x = 40).46 Much higher Cu(II) affinities were determined for Aβ4–x family peptides,8 log CK7.4 = 13.53 (x = 16),16 and 14.18 (x = 9).47 The affinities of binary Cu(II)-Aβ5–x peptides are closer to Cu(II)-Aβ4–x, log CK7.4 = 12.76 (x = 9), and 12.98 (x = 16). However, unlike Aβ4–x, the Aβ5–x peptides can elevate their Cu(II) binding capability via ternary complexes, which is a feature shared with other Xaa-His peptides.17,20,21,37Figure 11 presents the evolution of log CK7.4 of ternary Im and Aβ1–16 complexes of Cu(II)-Aβ5–9 and Cu(II)-Aβ5–16 calculated using the data presented in Tables 1, 2, and 4.
Figure 11.
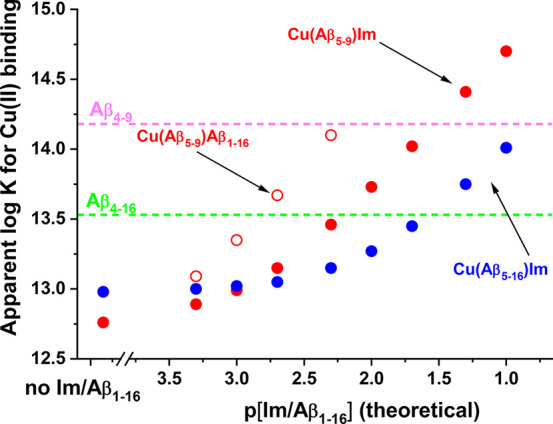
Theoretical evolution of log CK7.4 of ternary complexes Cu(II)-Aβ5–9/Im, Cu(II)-Aβ5–16/Im, and Cu(II)-Aβ5–9/Aβ1–16 calculated using the data presented in Tables 1, 2, and 4.
This simulation clearly shows that in the presence of a ∼1 mM amount of external imidazole-bearing ligands Aβ5–9 can become a stronger Cu(II) chelator than the longer Aβ5–x species. Furthermore, at ca. 30 mM Im the Cu(II) binding ability of Aβ5–16 equals that of Aβ4–16, and that of Aβ5–9 matches Aβ4–9. While the actual role of Aβ4–x peptides in brain copper metabolism remains speculative, we postulate that the longer species serve to mop up the excess of Cu(II) ions from the synaptic cleft,18 and Aβ4–9, as product of Aβ4–40 cleavage by neprilysin may participate in the export of copper across the blood–brain barrier.48,49 Aβ5–x peptides are normally only very minor contributors to the overall β-amyloid pool but our results indicate that these peptides, when multiplicated as a result of therapeutic intervention, may interfere with the synaptic and extrasynaptic Cu(II) handling. The affinity of the Cu(II)-Aβ5–9/Aβ1–16 complex, much higher than that of imidazole, points at a possibility of strong, specific interactions with larger ligands that can be recruited from the Aβ family or other synaptic proteins. Despite the similar overall affinity, Cu(II)-Xaa-His and Cu(II)-Xaa-Zaa-His (ATCUN) complexes differ in the Cu(II) exchange kinetics, with Cu(II)-Xaa-His complexes reported as much more labile.50 They could thus interfere with proper Cu(II) delivery. In particular, Aβ5–9 which most likely could be generated by neprilysin analogously to Aβ4–9, could theoretically intercept Cu(II) ions faster than the ATCUN peptides and release them off target, e.g. intracellularly, causing oxidative stress in brain cells.49
In order to directly find out how Aβ5–x and Aβ4–x peptides could compete for Cu(II) ions, we contacted them directly, by forming the Cu(II)-Aβ5–9 complex at pH 7.4 and then contacting it with equimolar Aβ4–9. The reaction was then followed for 24 h, as presented in Figure 12.
Figure 12.
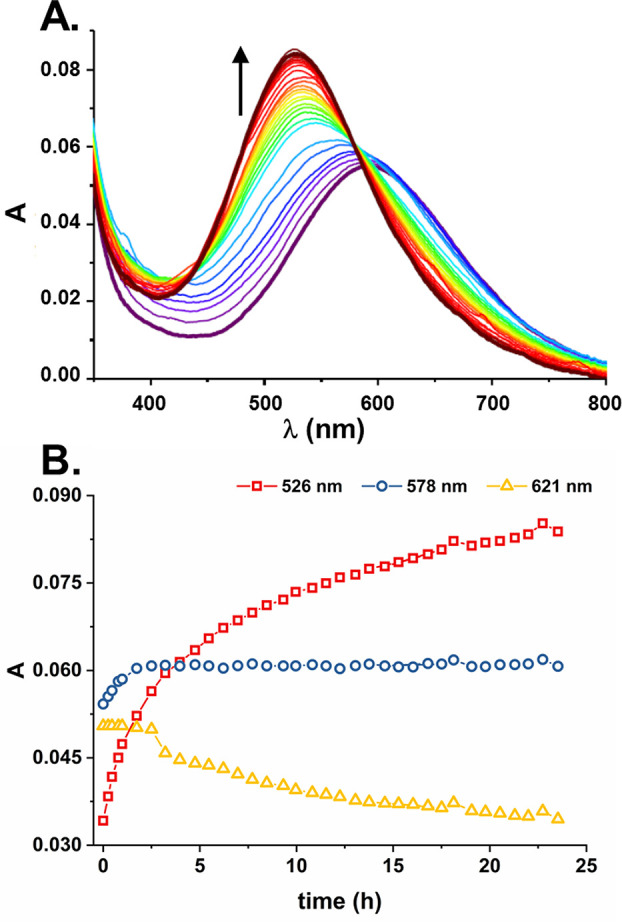
Course of reaction of 1 mM Cu(II)-Aβ5–9 with 1 mM Aβ4–9 at pH 7.4 (20 mM HEPES) at 25 °C: (A) evolution of d–d bands; (B) reaction traces at 526, 578, and 621 nm.
By comparing its course with the spectra presented above and with those published previously by Bossak-Ahmad et al.47 one can clearly see that the process of Cu(II) transfer from Aβ5–x to Aβ4–x, along the gradient of affinities, is mediated by the formation of the ternary 3N+NAβ(4–9) complex. Interestingly, however, the overall process, measured at the maximum of Cu(II)-Aβ4–x absorption, was very slow, taking more than 24 h to complete. Even more interestingly, the reaction had not one, but two slow steps. The first one, taking the first 2.5 h of incubation and characterized by an isosbestic point at 621 nm, was apparently the formation of the ternary complex, which then re-equilibrated into the final 4N Cu(II)-Aβ4–9 species with the isosbestic point at 578 nm. This experiment shows that the formation of ternary complexes can stabilize the Cu(II)-Aβ5–x complexes not just thermodynamically, but also kinetically. Taking into account the milliseconds to seconds to minutes time scale of chemical processes in the synapses, such slow equilibrations between Aβ5–x and Aβ4–x indicate that ternary Cu(II)-Aβ5–x complexes with external ligands, including other Aβ peptides, may indeed interfere with copper brain physiology.
Electrochemical properties of Cu(II)-Aβ5–x complexes may further contribute to the impairment of brain copper metabolism by enabling the Cu(II)/Cu(I) cycle in the high-affinity Cu(II) pool, not accessible to much weaker Cu(II)-Aβ1–x complexes. In this fashion the overproduction of Aβ5–x peptides could also enhance the oxidative stress and reactive oxygen species (ROS) generation, normally ascribed to Cu(II)-Aβ1–x species.51−53 On the other hand, the oxidation of Cu(II) ions in Aβ5–x complexes to Cu(III) is even less likely than in Aβ4–x complexes, but the presence of imidazole shifted the oxidation potential of the Cu(II)/Cu(III) couple toward less positive potential values, thus slightly increasing the probability of this reaction in vivo. Taken together, our results indicate that Aβ5–x peptides, which bind Cu(II) ions much more strongly than Aβ1–x peptides46 and only slightly more weakly than Aβ4–x peptides,16,47 could interfere with Cu(II) handling by these peptides, adding to copper dyshomeostasis in Alzheimer brains, especially in the presence of auxiliary imidazole ligands, such as His side chains in other peptides and proteins.
Acknowledgments
This work was supported by National Science Center (Poland) OPUS project no. 2014/15/B/ST5/05229 and by Warsaw University of Technology under the program Excellence Initiative: Research University (ID-UB), BIOTECHMED-1 project no. PSP 504/04496/1020/45.010407. The contribution of Aleksandra Tobolska was financially supported and implemented as a part of the Operational Program Knowledge Education Development 2014–2020 (Project No POWR.03.02.00-00-1007/16-00) cofinanced by the European Social Fund.
Supporting Information Available
The Supporting Information is available free of charge at https://pubs.acs.org/doi/10.1021/acs.inorgchem.0c01773.
pH dependence of UV–vis spectra for Cu(II)-Aβ5–x samples, fluorescence titrations of Aβ5–12 and Cu(II)-Aβ5–12, spectroscopic results and species distribution for 1 mM Aβ5–16 and 1.8 mM Cu(II), spectroscopic titration of Cu(II)-Aβ5–9 with Aβ1–16, CV for Aβ5–12F/Cu(II)-Aβ5–12F, and DPV for Aβ5–x/Cu(II)/Im over 0.2 to −0.8 V potential range (PDF)
The authors declare no competing financial interest.
Supplementary Material
References
- Alzheimer’s Disease International. World Alzheimer Report 2019. Attitudes to dementia. www.alz.co.uk/research/WorldAlzheimerReport2019.pdf.
- Haaksma M. L.; Vilela L. R.; Marengoni A.; Calderón-Larrañaga A.; Leoutsakos J.-M. S.; Olde Rikkert M. G. M.; Melis R. J. F. Comorbidity and Progression of Late Onset Alzheimer’s Disease: A Systematic Review. PLoS One 2017, 12 (5), e0177044 10.1371/journal.pone.0177044. [DOI] [PMC free article] [PubMed] [Google Scholar]
- He Y.; Wei M.; Wu Y.; Qin H.; Li W.; Ma X.; Cheng J.; Ren J.; Shen Y.; Chen Z.; Sun B.; Huang F. D.; Shen Y.; Zhou Y. D. Amyloid β oligomers suppress excitatory transmitter release via presynaptic depletion of phosphatidylinositol-4,5-bisphosphate. Nat. Commun. 2019, 10, 1193. 10.1038/s41467-019-09114-z. [DOI] [PMC free article] [PubMed] [Google Scholar]
- Zott B.; Simon M. M.; Hong W.; Unger F.; Chen-Engerer H.-J.; Frosch M. P.; Sakmann B.; Walsh D. M.; Konnerth A. A vicious cycle of amyloid β-dependent neuronal hyperactivation. Science 2019, 365, 559–565. 10.1126/science.aay0198. [DOI] [PMC free article] [PubMed] [Google Scholar]
- Mattsson N.; Rajendran L.; Zetterberg H.; Gustavsson M.; Andreasson U.; Olsson M.; Brinkmalm G.; Lundkvist J.; Jacobson L. H.; Perrot L.; Neumann U.; Borghys H.; Mercken M.; Dhuyvetter D.; Jeppsson F.; Blennow K.; Portelius E. BACE1 inhibition induces a specific cerebrospinal fluid β-amyloid pattern that identifies drug effects in the central nervous system. PLoS One 2012, 7 (2), e31084 10.1371/journal.pone.0031084. [DOI] [PMC free article] [PubMed] [Google Scholar]
- Lewis H.; Beher D.; Cookson N.; Oakley A.; Piggott M.; Morris C. M.; Jaros E.; Perry R.; Ince P.; Kenny R. A.; Ballard C. G.; Shearman M. S.; Kalaria R. N. Quantification of Alzheimer pathology in ageing and dementia: Age-related accumulation of amyloid-beta(42) peptide in vascular dementia. Neuropathol. Appl. Neurobiol. 2006, 32, 103–118. 10.1111/j.1365-2990.2006.00696.x. [DOI] [PubMed] [Google Scholar]
- Murayama K. S.; Kametani F.; Tabira T.; Araki W. A novel monoclonal antibody specific for the amino-truncated beta-amyloid Abeta5–40/42 produced from caspase-cleaved amyloid precursor protein. J. Neurosci. Methods 2007, 161, 244–249. 10.1016/j.jneumeth.2006.11.010. [DOI] [PubMed] [Google Scholar]
- Portelius E.; Bogdanovic N.; Gustavsson M. K.; Volkmann I.; Brinkmalm G.; Zetterberg H.; Winblad B.; Blennow K. Mass spectrometric characterization of brain amyloid beta isoform signatures in familial and sporadic Alzheimer’s disease. Acta Neuropathol. 2010, 120, 185–193. 10.1007/s00401-010-0690-1. [DOI] [PMC free article] [PubMed] [Google Scholar]
- Wirths O.; Zampar S.; Weggen S. In N-Terminally Truncated Aβ Peptide Variants in Alzheimer’s Disease in Alzheimer’s Disease; Wisniewski T., Ed.; Codon Publications: Brisbane, Australia, 2019; pp 107–122, ISBN: 978-0-6468096-8-7, 10.15586/alzheimersdisease. [DOI] [PubMed] [Google Scholar]
- Gkanatsiou E.; Portelius E.; Toomey C. E.; Blennow K.; Zetterberg H.; Lashley T.; Brinkmalm G. A distinct brain beta amyloid signature in cerebral amyloid angiopathy compared to Alzheimer’s disease. Neurosci. Lett. 2019, 701, 125–131. 10.1016/j.neulet.2019.02.033. [DOI] [PubMed] [Google Scholar]
- Reinert J.; Richard B. C.; Klafki H. W.; Friedrich B.; Bayer T. A.; Wiltfang J.; Kovacs G. G.; Ingelsson M.; Lannfelt L.; Paetau A.; Bergquist J.; Wirths O. Deposition of C-terminally truncated Aβ species Aβ37 and Aβ39 in Alzheimer’s disease and transgenic mouse models. Acta Neuropathol. Comm. 2016, 4, 24. 10.1186/s40478-016-0294-7. [DOI] [PMC free article] [PubMed] [Google Scholar]
- Portelius E.; Olsson M.; Brinkmalm G.; Ruetschi U.; Mattsson N.; Andreasson U.; Gobom J.; Brinkmalm A.; Holtta M.; Blennow K. Mass spectrometric characterization of amyloid-β species in the 7PA2 cell model of Alzheimer’s disease. J. Alzheimer's Dis. 2012, 33, 85–93. 10.3233/JAD-2012-120994. [DOI] [PubMed] [Google Scholar]
- Takeda K.; Araki W.; Akiyama H.; Tabira T. Amino-truncated amyloid beta-peptide (Abeta5–40/42) produced from caspase-cleaved amyloid precursor protein is deposited in Alzheimer’s disease brain. FASEB J. 2004, 18 (14), 1755–7. 10.1096/fj.03-1070fje. [DOI] [PubMed] [Google Scholar]
- Drew S. C.; Barnham K. J. The Heterogeneous Nature of Cu2+ interactions with Alzheimer’s Amyloid-β Peptide. Acc. Chem. Res. 2011, 44 (11), 1146–1155. 10.1021/ar200014u. [DOI] [PubMed] [Google Scholar]
- Atrián-Blasco E.; Gonzalez P.; Santoro A.; Alies B.; Faller P.; Hureau C. Cu and Zn Coordination to Amyloid Peptides: From Fascinating Chemistry to Debated Pathological Relevance. Coord. Chem. Rev. 2018, 371, 38–55. 10.1016/j.ccr.2018.04.007. [DOI] [PMC free article] [PubMed] [Google Scholar]
- Mital M.; Wezynfeld N. E.; Fra̧czyk T.; Wiloch M. Z.; Wawrzyniak U. E.; Bonna A.; Tumpach C.; Barnham K. J.; Haigh C. L.; Bal W.; Drew S. C. A Functional Role for Aβ in Metal Homeostasis? N-Truncation and High-Affinity Copper Binding. Angew. Chem., Int. Ed. 2015, 54, 10460–10464. 10.1002/anie.201502644. [DOI] [PubMed] [Google Scholar]
- Gonzalez P.; Bossak K.; Stefaniak E.; Hureau C.; Raibaut L.; Bal W.; Faller P. N-terminal Cu Binding Motifs Xxx-Zzz-His (ATCUN) and Xxx-His and their derivatives: Chemistry, Biology and Medicinal Applications. Chem. - Eur. J. 2018, 24, 8029–8041. 10.1002/chem.201705398. [DOI] [PMC free article] [PubMed] [Google Scholar]
- Stefaniak E.; Bal W. CuII binding properties of N-truncated Aβ peptides: in search of biological function. Inorg. Chem. 2019, 58, 13561–13577. 10.1021/acs.inorgchem.9b01399. [DOI] [PubMed] [Google Scholar]
- Hureau C.; Eury H.; Guillot R.; Bijani C.; Sayen S.; Solari P. L.; Guillon E.; Faller P.; Dorlet P. X-ray and solution structures of Cu(II) GHK and Cu(II) DAHK complexes: influence on their redox properties. Chem. - Eur. J. 2011, 17, 10151–10160. 10.1002/chem.201100751. [DOI] [PubMed] [Google Scholar]
- Bossak K.; Mital M.; Poznański J.; Bonna A.; Drew S.; Bal W. Interactions of α-factor-1, a yeast pheromone, and its analog with copper(II) ions and low molecular weight ligands yield very stable complexes. Inorg. Chem. 2016, 55, 7829–7831. 10.1021/acs.inorgchem.6b01441. [DOI] [PubMed] [Google Scholar]
- Kotuniak R.; Fra̧czyk T.; Skrobecki P.; Płonka D.; Bal W. GHTD-amide, an insulin activating peptide from human pancreas is a strong Cu(II) chelator. Inorg. Chem. 2018, 57, 15507–15516. 10.1021/acs.inorgchem.8b02841. [DOI] [PubMed] [Google Scholar]
- Trapaidze A.; Hureau C.; Bal W.; Winterhalter M.; Faller P. Thermodynamic study of Cu2+ binding to the DAHK and GHK peptides by Isothermal Titration Calorimetry (ITC). JBIC, J. Biol. Inorg. Chem. 2012, 17, 37–47. 10.1007/s00775-011-0824-5. [DOI] [PubMed] [Google Scholar]
- Conato C.; Gavioli R.; Guerrini R.; Kolzowski H.; Mlynarz P.; Pasti C.; Pulidori F.; Remelli M. Copper complexes of glycylhistidyl-lysine and two of its synthetic analogues: chemical behavior and biological activity. Biochim. Biophys. Acta, Gen. Subj. 2001, 1526, 199–210. 10.1016/S0304-4165(01)00127-1. [DOI] [PubMed] [Google Scholar]
- Chan W. C.; White P. D. In Fmoc Solid Phase Peptide Synthesis, A Practical Approach; Chan W. C., White P. D., Eds.; Oxford University Press: New York, 2000; pp 41–76. [Google Scholar]
- Kuipers B. J. H.; Gruppen H. Prediction of Molar Extinction Coefficients of Proteins and Peptides Using UV Absorption of the Constituent Amino Acids at 214 nm To Enable Quantitative Reverse Phase High-Performance Liquid Chromatography-Mass Spectrometry Analysis. J. Agric. Food Chem. 2007, 55, 5445–5451. 10.1021/jf070337l. [DOI] [PubMed] [Google Scholar]
- Irving H. M.; Miles M. G.; Pettit L. D. A study of some problems in determining the stoicheiometric proton dissociation constants of complexes by potentiometric titrations using a glass electrode. Anal. Chim. Acta 1967, 38, 475–488. 10.1016/S0003-2670(01)80616-4. [DOI] [Google Scholar]
- Gans P.; Sabatini A.; Vacca A. SUPERQUAD: an improved general program for computation of formation constants from potentiometric data. J. Chem. Soc., Dalton Trans. 1985, 1195–1199. 10.1039/dt9850001195. [DOI] [Google Scholar]
- Gans P.; Sabatini A.; Vacca A. Investigation of equilibria in solution. Determination of equilibrium constants with the HYPER-QUAD suite of programs. Talanta 1996, 43, 1739–1753. 10.1016/0039-9140(96)01958-3. [DOI] [PubMed] [Google Scholar]
- Kowalik-Jankowska T.; Ruta M.; Wiśniewska K.; Lankiewicz L. Coordination Abilities of the 1–16 and 1–28 Fragments of Beta-Amyloid Peptide towards Copper(II) Ions: A Combined Potentiometric and Spectroscopic Study. J. Inorg. Biochem. 2003, 95 (4), 270–282. 10.1016/S0162-0134(03)00128-4. [DOI] [PubMed] [Google Scholar]
- Damante C. A.; Ösz K.; Nagy Z.; Pappalardo G.; Grasso G.; Impellizzeri G.; Rizzarelli E.; Sóvágó I. The Metal Loading Ability of β-Amyloid N-Terminus: A Combined Potentiometric and Spectroscopic Study of Copper(II) Complexes with β-Amyloid(1–16), Its Short or Mutated Peptide Fragments, and Its Polyethylene Glycol (PEG)-ylated Analogue. Inorg. Chem. 2008, 47, 9669–9683. 10.1021/ic8006052. [DOI] [PubMed] [Google Scholar]
- Szakács Z.; Kraszni M.; Noszál B. Determination of microscopic acid–base parameters from NMR–pH titrations. Anal. Bioanal. Chem. 2004, 378, 1428–1448. 10.1007/s00216-003-2390-3. [DOI] [PubMed] [Google Scholar]
- Daniele P.; Zerbinati O.; Zelano V.; Ostacoli G. Thermodynamic and spectroscopic study of copper(II)-glycyl-L-histidylglycine complexes in aqueous solution. J. Chem. Soc., Dalton Trans. 1991, 2711–2715. 10.1039/DT9910002711. [DOI] [Google Scholar]
- Farkas E.; Sóvágó I.; Kiss T.; Gergely A. Studies on transition-metal-peptide complexes. Part 9. Copper(II) complexes of tripeptides containing histidine. J. Chem. Soc., Dalton Trans. 1984, 611–614. 10.1039/DT9840000611. [DOI] [Google Scholar]
- Brookes G.; Pettit L. Thermodynamics of formation of complexes of copper(II) and nickel(II) ions with glycylhistidine, β-alanylhistidine, and histidylglycine. J. Chem. Soc., Dalton Trans. 1975, 2106–2112. 10.1039/dt9750002106. [DOI] [Google Scholar]
- Arena G.; Cucinotta V.; Musumeci S.; Purrello R.; Rizzarelli E. Formation and stability of simple and mixed complexes of glycyl-L-histidine in aqueous solution. Ann. Chim. (Rome) 1984, 74, 399–402. [Google Scholar]
- Pettit L. D.; Steel I.; Kowalik T.; Kozlowski H.; Bataille M. Specific binding of the tyrosine residue in copper(II) complexes of Tyr-Pro-Gly-Tyr and Tyr-Gly-Pro-Tyr. J. Chem. Soc., Dalton Trans. 1985, 1201–1205. 10.1039/dt9850001201. [DOI] [Google Scholar]
- Livera C.; Pettit L. D.; Bataille M.; Krembel J.; Bal W.; Kozlowski H. Copper(II) complexes with some tetrapeptides containing the ‘break-point’ prolyl residue in the third position. J. Chem. Soc., Dalton Trans. 1988, 1357–1360. 10.1039/DT9880001357. [DOI] [Google Scholar]
- Bossak-Ahmad K.; Wiśniewska M. D.; Bal W.; Drew S. C.; Fra̧czyk T.. Ternary Cu(II) complex with GHK peptide and cis-urocanic acid as a potential physiologically functional copper chelate. Int. J. Mol. Sci. 2020, 21, 6190. 10.3390/ijms21176190. [DOI] [PMC free article] [PubMed] [Google Scholar]
- Krȩżel A.; Wójcik J.; Maciejczyk M.; Bal W. May GSH and l-His contribute to intracellular binding of zinc? Thermodynamic and solution structural study of a ternary complex. Chem. Commun. 2003, 704–705. 10.1039/b300632h. [DOI] [PubMed] [Google Scholar]
- Enache T. A.; Oliveira-Brett A. M. Phenol and para-substituted phenols electrochemical oxidation pathways. J. Electroanal. Chem. 2011, 655, 9–16. 10.1016/j.jelechem.2011.02.022. [DOI] [Google Scholar]
- Suprun E. V.; Zaryanov N. V.; Radko S. P.; Kulikova A. A.; Kozin S. A.; Makarov A. A.; Archakov A. I.; Shumyantseva V. V. Tyrosine Based Electrochemical Analysis of Amyloid-β Fragment (1–16) Binding to Metal(II) Ions. Electrochim. Acta 2015, 179, 93–99. 10.1016/j.electacta.2015.01.066. [DOI] [Google Scholar]
- Enache T. A.; Oliveira-Brett A. M. Peptide methionine sulfoxide reductase A (MsrA): direct electrochemical oxidation on carbon electrodes. Bioelectrochemistry 2013, 89, 11–18. 10.1016/j.bioelechem.2012.08.004. [DOI] [PubMed] [Google Scholar]
- Suprun E. V.; Khmeleva S. A.; Radko S. P.; Kozin S. A.; Archakov A. I.; Shumyantseva V. V. Direct electrochemical oxidation of amyloid-β peptides via tyrosine, histidine, and methionine residues. Electrochem. Commun. 2016, 65, 53–56. 10.1016/j.elecom.2016.02.004. [DOI] [Google Scholar]
- Wiloch M. Z.; Wawrzyniak U. E.; Ufnalska I.; Bonna A.; Bal W.; Drew S. C.; Wroblewski W. Tuning the Redox Properties of Copper(II) Complexes with Amyloid-Beta Peptides. J. Electrochem. Soc. 2016, 163 (13), G196–G199. 10.1149/2.0641613jes. [DOI] [Google Scholar]
- Ufnalska I.; Warzyniak U. E.; Bossak-Ahmad K.; Bal W.; Wróblewski W. Electrochemical studies of binary and ternary copper(II) complexes with α-factor analogues. J. Electroanal. Chem. 2020, 862, 114003. 10.1016/j.jelechem.2020.114003. [DOI] [Google Scholar]
- Alies B.; Renaglia E.; Rózga M.; Bal W.; Faller P.; Hureau C. Cu(II) affinity for the Alzheimer’s peptide: Tyrosine fluorescence studies revisited. Anal. Chem. 2013, 85, 1501–1508. 10.1021/ac302629u. [DOI] [PubMed] [Google Scholar]
- Bossak-Ahmad K.; Mital M.; Płonka D.; Drew S. C.; Bal W. Oligopeptides Generated by Neprilysin Degradation of β-Amyloid Have the Highest Cu(II) Affinity in the Whole Aβ Family. Inorg. Chem. 2019, 58 (1), 932–943. 10.1021/acs.inorgchem.8b03051. [DOI] [PubMed] [Google Scholar]
- Mital M.; Bal W.; Fra̧czyk T.; Drew S. C. Interplay between copper, neprilysin and N-truncation of β-amyloid. Inorg. Chem. 2018, 57, 6193–6197. 10.1021/acs.inorgchem.8b00391. [DOI] [PubMed] [Google Scholar]
- Stefaniak E.; Płonka D.; Szczerba P.; Wezynfeld N. E.; Bal W. Copper transporters? Glutathione reactivity of products of Cu-Aβ digestion by neprilysin. Inorg. Chem. 2020, 59, 4186–4190. 10.1021/acs.inorgchem.0c00427. [DOI] [PMC free article] [PubMed] [Google Scholar]
- Beuning C. K.; Mestre-Voegtlé B.; Faller P.; Hureau C.; Crans D. C. Measurement of Interpeptidic Cu(II) Exchange Rate Constants by Static Fluorescence Quenching of Tryptophan. Inorg. Chem. 2018, 57, 4791–4794. 10.1021/acs.inorgchem.8b00182. [DOI] [PubMed] [Google Scholar]
- Cheignon C.; Jones M.; Atrian-Blasco E.; Kieffer I.; Faller P.; Collin F.; Hureau C. Identification of key structural features of the elusive Cu-Ab complex that generates ROS in Alzheimer’s disease. Chem. Sci. 2017, 8, 5107–5118. 10.1039/C7SC00809K. [DOI] [PMC free article] [PubMed] [Google Scholar]
- Atrian-Blasco E.; Del Barrio M.; Faller P.; Hureau C. ´ Ascorbate Oxidation by Cu(Amyloid-β) Complexes: Determination of the Intrinsic Rate as a Function of Alterations in the Peptide Sequence Revealing Key Residues for Reactive Oxygen Species Production. Anal. Chem. 2018, 90 (9), 5909–5915. 10.1021/acs.analchem.8b00740. [DOI] [PMC free article] [PubMed] [Google Scholar]
- Cheignon C.; Tomas M.; Bonnefont-Rousselot D.; Faller P.; Hureau C.; Collin F. Oxidative Stress and the Amyloid Beta Peptide in Alzheimer’s Disease. Redox Biol. 2018, 14, 450–464. 10.1016/j.redox.2017.10.014. [DOI] [PMC free article] [PubMed] [Google Scholar]
Associated Data
This section collects any data citations, data availability statements, or supplementary materials included in this article.


