Abstract
Bone metastasis frequently occurs in advanced-stage prostate cancer (PCa) patients. Understanding the mechanisms that promote PCa-mediated bone destruction is important for the identification of therapeutic targets against this lethal disease. We found that forkhead box A2 (FOXA2) is expressed in a subset of PCa bone metastasis specimens. To determine the functional role of FOXA2 in PCa metastasis, we knocked down the expression of FOXA2 in PCa PC3 cells, which can grow in bones and elicit an osteolytic reaction. The PC3/FOXA2-knockdown cells generated fewer bone lesions following intra-tibial injection compared to control cells. Further, we found that FOXA2 knockdown decreased the expression of PTHLH, which encodes PTHrP, a well-established factor that regulates bone remodeling. These results indicate that FOXA2 is involved in PCa bone metastasis.
Keywords: FOXA2, PTHrP, prostate cancer, bone
Introduction
Micro/macro bone metastasis occurs in approximately 90% of advanced PCa patients, resulting in significantly increased likelihood of morbidity and mortality [1-4]. Studies have shown that 20-30% of heavily treated PCa progresses to neuroendocrine prostate cancer (NEPCa) [5], the most aggressive form of this common disease. NEPCa does not express androgen receptor (AR) and is therefore unresponsive to endocrine therapy. Identifying the genes that control the behavior of NEPCa in the bone microenvironment can help increase our understanding of NEPCa establishment in the bone, leading to the identification of new targets and the development of new therapeutic approaches to treat bone metastases.
FOXA2 is a forkhead transcription factor that is expressed in NEPCa [6]. The FOXA transcription factors were initially identified in liver tissues, where they control liver-specific gene expression [7]. In the prostate, FOXA2 is expressed at embryonic stages [8]. Its expression diminishes after birth, but it is re-expressed in both human and mouse NEPCa [6,9]. In addition, it has been shown that FOXA2, in cooperation with HIF-1α, promotes the neuroendocrine differentiation of PCa [10]. However, the functional role of FOXA2 in NEPCa metastasis has yet to be elucidated.
Unlike prostate adenocarcinomas, which stimulate new bone formation, NEPCa cells generate predominantly osteolytic or mixed bone lesions. Previous studies have well established that Parathyroid Hormone-related Protein (PTHrP) is a major player in mediating cancer-induced osteoclastic bone resorption [11]. It has been shown that several types of cancer including neuroendocrine tumors produce high levels of PTHrP, which binds to receptors expressed on the osteoblasts and osteoclasts in the bone microenvironment, resulting in increased bone resorption and cancer growth [12,13].
In this study, we investigated the involvement of FOXA2 in PCa bone metastases. We used PC3 cells that express high levels of FOXA2 [9] and PTHrP [9,14], exhibit some features of NEPCa [15], and can grow in bone [16]. We established FOXA2 knockdown-PC3 cells and assessed how reduced FOXA2 expression influences the establishment of PCa-mediated bone lesions. We also examined FOXA2’s regulation of PTHrP. This study provides the first evidence of the role of FOXA2 in regulating PTHrP expression and promoting NEPCa bone metastases.
Material and methods
Human specimens
Research using human specimens was conducted following protocols approved by the Institutional Review Boards at the University of Washington, Vanderbilt University, and LSU Health Shreveport. A tissue microarray (UWTMA22) consisting of de-identified human metastatic castrate-resistant PCa (CRPCa) specimens was constructed using tissue samples collected from 24 CRPCa patients who succumbed to disease. In total, the TMA consisted of 128 metastatic sites with two 1 mm cores for each site sampled.
Immunohistochemistry
Immunohistochemistry was conducted as described previously [17]. Antigen retrieval was carried by using microwave for 20 min in antigen-unmasking solution (Vector Laboratories, Burlingame, CA). Antibodies against FOXA2 (ab108422, 1:1000) were obtained from Abcam, Cambridge, MA and synaptophysin (SYP, a biomarker of NEPCa) (BD 611880, 1:500) from BD Biosciences, San Jose, CA. Both the percentage of cells stained and the intensity of nuclear FOXA2 or cytoplasmic SYP staining were evaluated. The intensity of expression was assessed on a scale of 0-3. The percentage of expression was assessed on a 0-10 scale such that 0 represented no staining and 10 represented staining of 100% of tumor cells. An overall expression score (OES) was calculated as the product of the intensity and percentage of stained cells. OES was grouped as 0, 1-2 and ≥3. Statistical analysis was performed by using the Spearman correlation test and Cochran-Armitage Trend Test. P-value of <0.05 was considered statistically significant.
Bioinformatics analysis
The expression levels of FOXA2 were extracted from a RNAseq dataset containing 46 LuCaP patient-derived PCa xenograft samples, including 35 AR+/NE-, 1 ARlow/NE-, 8 AR-/NE+, 1 AR+/NE+, and 1 AR-/NE- PDXs. Chi-Square test was conducted to analyze the differential expression of FOXA2 in different tumor groups.
Cell culture of prostate cancer cell lines and establishment of PC3 FOXA2 knockdown cells
PC3 cells (authenticated by ATCC) were cultured in RPMI 1640 supplemented with 10% heat-inactivated fetal bovine serum (Atlanta Biologicals, Flowery Branch, GA) and 1% penicillin-streptomycin (Thermo Fisher Scientific, Waltham, MA). To generate FOXA2 knockdown cells, PC3 cells were infected with control or shFOXA2 lentiviral particles (Sigma, St. Louis, MO) and then cultured in media containing 10 μg/mL puromycin. Stable knockdown cells were maintained in 2.5 μg/mL puromycin-containing media. Because FOXA2 knockdown efficiency gradually decreased over long-term cell culture, monoclonal lines were generated from PC3/shFOXA2 cells. NeoTag1/FOXA2 overexpression cells were established as previously described [17].
RNA isolation and real-time PCR
RNA was extracted using Purelink RNA Mini Kit following manufacturer’s protocol (Ambion, Life Technologies, Waltham, MA). For reverse transcription, 1 μg of total RNA was used for cDNA synthesis. Quantitative (q)-PCR was conducted to assess mRNA transcript levels of FOXA2 (Forward: 5’-TGCCATGCACTCGGCTTCCA-3’ and Reverse: 5’-CCCAGGCCGGCGTTCATGTT-3’), human PTHrP (Forward: 5’-ATCAACTTTCCGGAAGCAACCAGC-3’ and Reverse: 5’-CCTTGTCATGGAGGAGCTGATGTT-3’), and mouse PTHrP (Forward: 5’-AATGCATTGGGATCAAACTGTCT-3’ and Reverse: 5’-GCCTTGGCAAAAGGGAAAA-3’). Gene expression was normalized by GAPDH.
Western blot analysis
Cells were lysed in passive lysis buffer (Promega, Madison, WI) and sonicated. Twenty micrograms of total protein were used for Western blot analyses. All antibodies were used at a 1:1000 dilution. Chemiluminescence signals were detected using x-ray film or processed in a Chemidoc Imaging System (Bio-Rad, Hercules, CA). β-actin was used for normalization.
Cell proliferation assay
IncuCyte ZOOM live cell imaging system (Essen BioScience, Ann Arbor, MI) was used to assess the cell proliferation. PC3/Control or PC3/FOXA2-KD cells were seeded into 96-well plate, 500 cells/well. Images were taken every four hours. Cell culture media were refreshed every two days. All images were analyzed on the Incucyte ZOOM Software with an appropriate mask applied. Total area for each time point was quantified; mean ± standard deviation is shown.
Chemotaxis assays
The IncuCyte Zoom live cell imaging system (Essen BioScience, Ann Arbor, MI) was used to monitor and quantify the number of migrating cells. PC3/Control or PC3/FOXA2-KD cells (1·103) were seeded in media containing 0.5% FBS on collagen I (50 μg/mL)-coated ClearView migration plate (Essen BioScience). The bottom reservoirs contained cell culture media with 10% FBS. Live cell images of the bottom of the chamber were taken every 2 hr. After 48 hours, cell migration was quantified.
Animal maintenance, intratibial & subcutaneous injections
All the animal experiments were conducted following protocols approved by the IACUC of Vanderbilt University or LSU Health Shreveport in accordance with the NIH guidelines. Pooled PC3/Control or PC3/FOXA2-KD cells (1·106 cells per graft) were injected into tibiae of SCID intact male mice using an insulin syringe. Tumor growth was monitored by weekly radiographs for 5 weeks. For subcutaneous injection experiment, PC3/Control or PC3/FOXA2-KD cells (1·104 cells per graft) were mixed with Matrigel (Corning Inc, Corning, NY) and injected into mice subcutaneously. Tumor size was measured 7 days post inoculation, three times per week for 3 weeks.
Chromatin immunoprecipitation assays
Chromatin immunoprecipitation was conducted using the EDM Millipore Magna ChIP kit (Burlington, MA) following the manufacturer’s protocol. DNA was sheared using Bioruptor (Diagenode, Denville, NJ) for 40 cycles on high, producing approximately 200 bp length fragments. Following reverse-crosslink of protein-DNA complexes, and treatment with proteinase K and RNase, DNA was purified by using Quick DNA Isolation Kit (Qiagen, Germantown, MD). Purified DNA was subjected to SYBR Green qPCR. Primers for ChIP-PCR were designed based on the ChIP-seq results available on the Integrative Genome Browser [18]. There are two FOXA2 binding sites in the regulatory region of the PTHLH gene, designated as A2BS1 and A2BS2. Primers were designed to cover both FOXA2 binding sites. Primer sequences are A2BS1 (Forward: 5’-CTTGGAATCCGGTGGCATCT-3’ and Reverse: 5’-CTGCGATCGCCAACTGTAAC-3’) and A2BS2 (Forward: 5’-AGCCACTTGTAGCGAAACCC-3’ and Reverse: 5’-ACGACACACGCACTTGAAAC-3’). FOXA2 enrichment was normalized to IgG.
Statistical analysis
Statistical significance in the tumor formation rate was compared using Chi-Square test. Gene expression level and ChIP enrichment were evaluated using a two-sided Student’s t test and a p-value of 0.05 was considered statistically significant.
Results
FOXA2 is expressed in metastatic castrate-resistant PCa and is correlated with synaptophysin expression
Expression of FOXA2 was examined using a set of TMAs consisting of castrate-resistant PCa metastases from 24 patients. Out of the total 128 metastatic sites, 124 sites had sufficient tissue for FOXA2 analysis. FOXA2 expression was detected in 28 sites, including 6/29 lymph node, 3/5 lung, 7/14 liver, 1/1 periaortic, and 11/75 bone metastases (Table 1). Out of the 128 sites, 104 samples had sufficient tissue for both FOXA2 and synaptophysin (SYP) staining and were used to evaluate the association of FOXA2 with SYP, a well-established marker of NEPCa. FOXA2 and SYP were co-expressed in 14/104 samples (13.46%), while FOXA2 expression alone was detected in 10/104 (9.62%) and SYP in 16/104 (15.38%) samples (Table 2). Statistical analysis showed that FOXA2 expression was significantly correlated with SYP expression (Spearman Correlation Coefficient is 0.398, P<0.001). Examples of the staining were shown in Figure 1.
Table 1.
Tissue distribution of PCa metastases and FOXA2 expression in UMTMA22
| FOXA2 negative | FOXA2 positive | Subtotal | |
|---|---|---|---|
| Bone | 64 | 11 | 75 |
| Lymph Node | 23 | 6 | 29 |
| Lung | 2 | 3 | 5 |
| Liver | 7 | 7 | 14 |
| Periaortic Mass | 0 | 1 | 1 |
| Total | 124 | ||
Table 2.
The expression of FOXA2 and synaptophysin (SYP) in UWTMA22
| Frequency | Percent | |
|---|---|---|
| FOXA2- SYP- | 64 | 61.54 |
| FOXA2- SYP+ | 16 | 15.38 |
| FOXA2+ SYP- | 10 | 9.62 |
| FOXA2+ SYP+ | 14 | 13.46 |
| Total | 104 | 100 |
Figure 1.
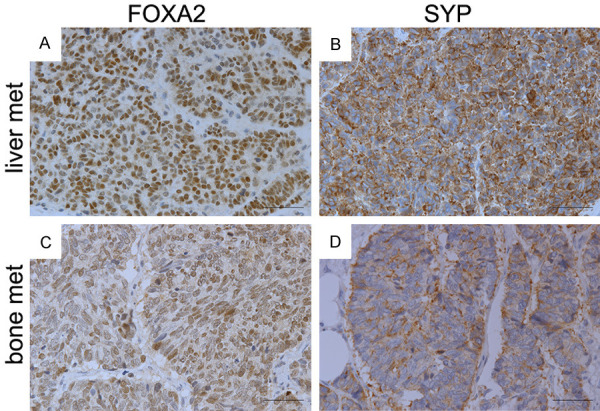
FOXA2 expression in metastatic PCa tissues. IHC staining of FOXA2 and synaptophysin was conducted on serial sections (A & B, C & D) derived from tissue microarray (UWTMA22). (A and B) PCa metastases in liver. (C and D) PCa metastases in bone. FOXA2 expression was detected in 28 sites, including 6/29 lymph node, 3/5 lung, 7/14 liver, 1/1 periaortic, and 11/75 bone metastases. Statistical analysis (Spearman Correlation test) indicates that FOXA2 expression has a significant positive correlation with SYP expression.
To further validate the association of FOXA2 expression with neuroendocrine differentiation in PCa, we analyzed the expression of FOXA2 in a previously published RNAseq dataset that consists of 46 LuCaP PCa patient-derived xenografts (PDXs) [19]. FOXA2 was detected in 6/8 AR-/NE+ LuCaP PDXs, but not in the double positive LuCaP 77CR PDX (AR+/NE+). Among the NE- PDXs, FOXA2 was expressed in the double negative LuCaP 173.2 (AR-/NE-) and in 6/35 AR+/NE- PDXs albeit at lower levels, but not in the ARlow/NE- LuCaP 176 PDX. Statistical analysis indicates that FOXA2 expression is increased in AR-/NE+ LuCaP PDXs, Chi-Square test, P<0.01.
Effects of FOXA2 knockdown on cell proliferation and chemotaxis
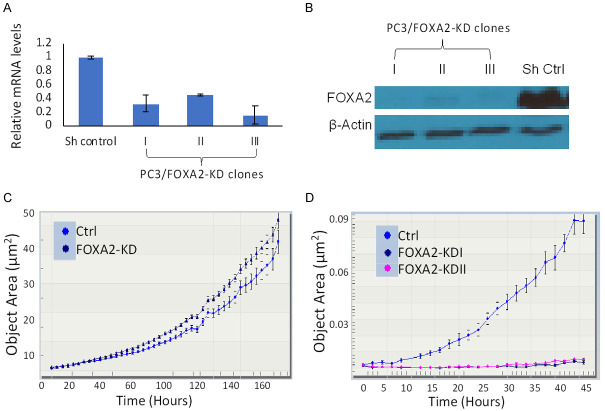
To study the functional involvement of FOXA2 in PCa, we knocked down FOXA2 expression in PC3 cells that express high levels of endogenous FOXA2 [9]. Three single clones were selected and designated as PC3/FOXA2-KD I, -II, and -III. While the knockdown resulted in decreased expression of FOXA2 at both the mRNA and protein levels (Figure 2A and 2B), we did not observe significant effects on PC3 cell proliferation (Figure 2C). However, FOXA2 knockdown inhibited PC3 cells invasion on collagen I matrix (Figure 2D). Taken together, these results indicate that FOXA2 is not likely involved in the regulation of proliferation but regulates the invasion of PCa cells.
Figure 2.
FOXA2 knockdown inhibits PC3 cell migration but not proliferation. A. RT-qPCR analyses were conducted to assess the expression levels of FOXA2 in PC3/Control and PC3/FOXA2-KD cells. The PC3/FOXA2-KD cells demonstrated reduced mRNA levels compared to the PC3/Control cells. B. Western blot analysis confirmed decreased FOXA2 expression in PC3/FOXA2-KD cells. β-actin served as the loading control. C. Cell proliferation assays were conducted using the IncuCyte zoom method. Pooled FOXA2 knockdown cells were used in this experiment. FOXA2 knockdown did not decrease the proliferation of PC3 cells. D. Chemotaxis assays. PC3/Control and PC3/FOXA2-KD cells were seeded on collagen I-coated transwell inserts with 0.5% FBS-containing media in the top chamber and 10% FBS-containing media in the bottom wells. The bottoms of the collagen-coated inserts were imaged every two hours to visualize the cells that had traversed. PC3/Control cells gradually migrated through the collagen I matrix into the bottom wells, whereas PC3/FOXA2-KD cells could not do so. Error bars reported as standard deviation.
FOXA2 knockdown decreases PCa-mediated bone lesions
To evaluate the role of FOXA2 in the establishment and growth of PCa cells in bones, PC3/Control and PC3/FOXA2-KD cells were injected into tibiae of SCID mice. Inoculation of PC3/Control cells (n=5 tibiae) resulted in profound osteolytic lesions in all the tibiae, whereas injection of PC3/FOXA2-KD cells (n=5 tibiae) resulted in visible osteolytic bone lesions in only one tibia (Figure 3). H&E and immunohistochemical staining analyses showed the presence of PCa cells in PC3/Control tibiae (Figure 4A-C) as well as the PC3/FOXA2-KD tibia that demonstrated bone destruction (Figure 4D-F), but not in the other PC3/FOXA2-KD tibiae that did not have visible bone lesions (Figure 4G-I). In the PC3/FOXA2-KD tibia that exhibited bone lesions, the tumor cells in the bone retained high FOXA2 expression (Figure 4E). Consistent with the increased lytic bone lesions, tartrate-resistant acid phosphatase (TRAP) staining revealed the existence of active osteoclasts at the surface of the bone lesions in both PC3/Control and PC3/FOXA2-KD tibiae that showed bone destruction (Figure 5). In a repeated experiment, bone lesions were detected in 8/8 PC3/Control tibiae compared to only in 3/14 tibiae injected with PC3/FOXA2-KD (data not shown). Statistical analysis indicated that FOXA2 KD significantly reduced the tumor incidence in bones (Chi-Square test, P<0.001).
Figure 3.
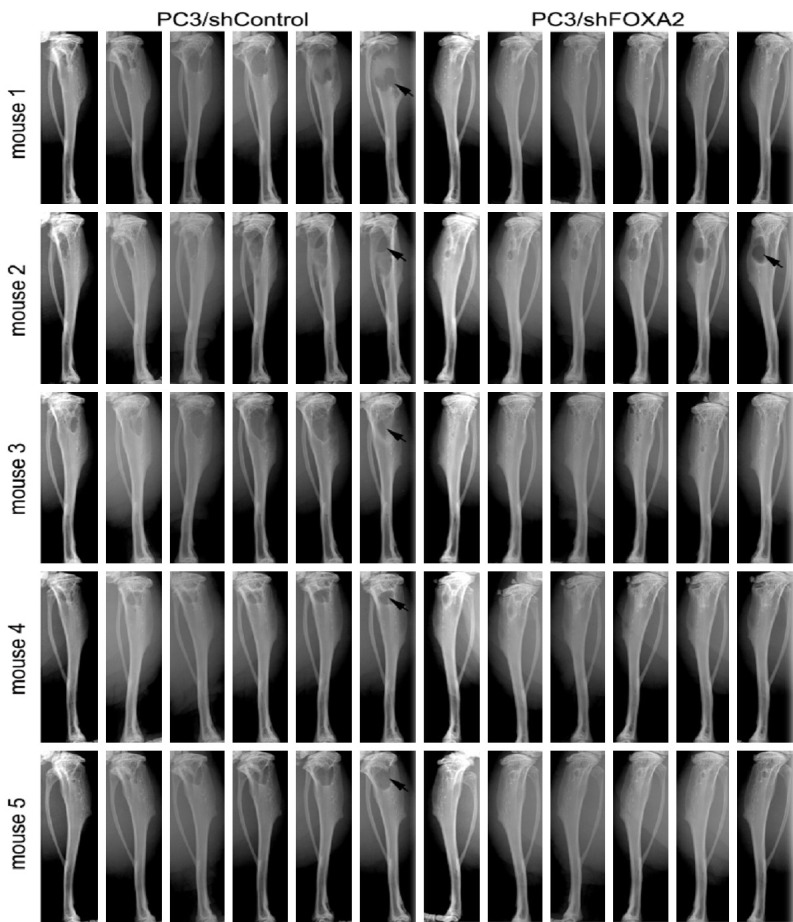
FOXA2 knockdown decreases PC3 cells’ ability to grow in bone. PC3/Control (n=5) and PC3/FOXA2-KD (n=5) cells were injected into the tibiae of SCID mice. Animals were x-ray imaged weekly for 5 weeks and tumor progression with bone destruction was monitored. PC3/Control cells grew in all the bones injected and generated lytic bone lesions, whereas PC3/FOXA2-KD cells caused bone destruction in fewer tibia (Chi-Square test, P<0.001).
Figure 4.
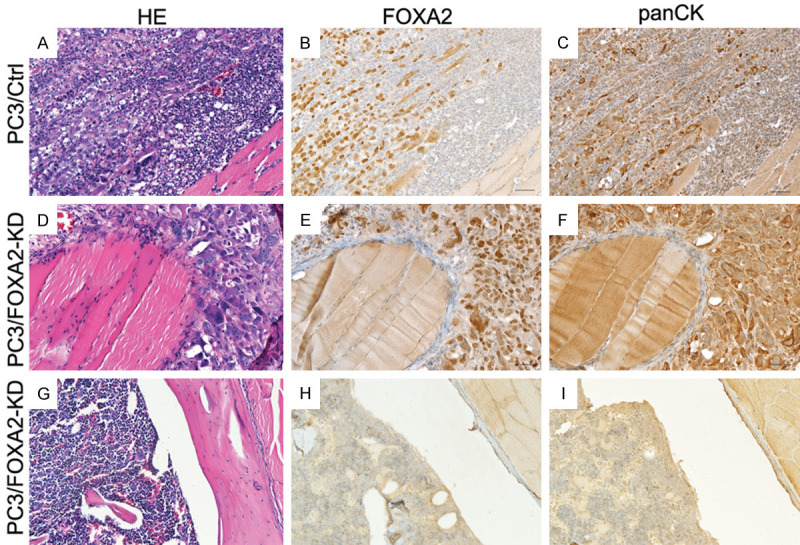
H&E and immunohistochemical staining of FOXA2 and pan-cytokeratin. (A-C) are serial sections derived from a tibia injected with PC3/Control cells. (D-F) are serial sections derived from a tibia that was injected with PC3/FOXA2-KD cells but demonstrated bone destruction. (G-I) are serial sections derived from a tibia that was injected with PC3/FOXA2-KD cells and did not generate bone destruction.
Figure 5.
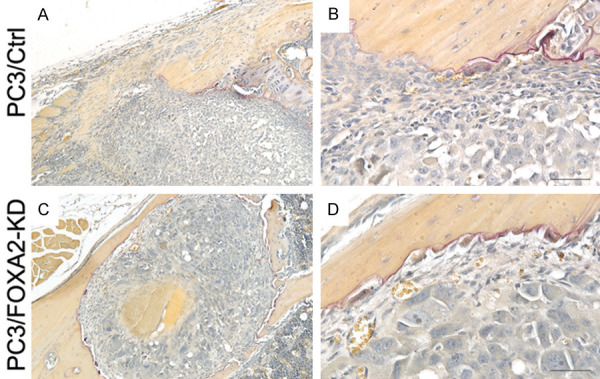
TRAP staining. (A and B) are images of a tibia injected with PC3/Control cells and (C and D) are images of a tibia injected with PC3/FOXA2-KD cells exhibiting bone lesions. (B and D) are higher magnification pictures of (A and C), respectively. Positive TRAP staining was detected at the tumor/bone interface of the tibiae that showed bone destruction in both PC3/Control and PC3/FOXA2 KD grafts.
Lastly, to determine whether FOXA2-mediated change in tumor growth is a general or a bone-specific mechanism, we also injected PC3/Control and PC3/FOXA2 KD cells subcutaneously. In a 26-day time course, we observed no significant growth differences between PC3/Control and PC3/FOXA2-KD cells (Supplementary Figure 1). This suggests that FOXA2-promoted tumor growth is bone specific.
FOXA2 regulates the gene expression of PTHLH
To explore the mechanisms by which FOXA2 knockdown affects PCa establishment in the bone, we analyzed the expression of a set of genes that are involved in cancer metastasis and its interaction with tumor microenvironment. Among the genes whose expression was altered in the PC3/FOXA2-KD cells was PTHLH, which encodes PTHrP, a well-established factor involved in regulating bone remodeling [20]. RT-qPCR confirmed the decreased mRNA levels of PTHLH in the FOXA2-KD cells (Figure 6A). To further determine FOXA2’s function in regulating the expression of PTHLH, we evaluated its level in previously established NeoTag1/Foxa2 overexpression cells [17]. We found that ectopic expression of FOXA2 induced PTHLH mRNA levels (Figure 6B).
Figure 6.
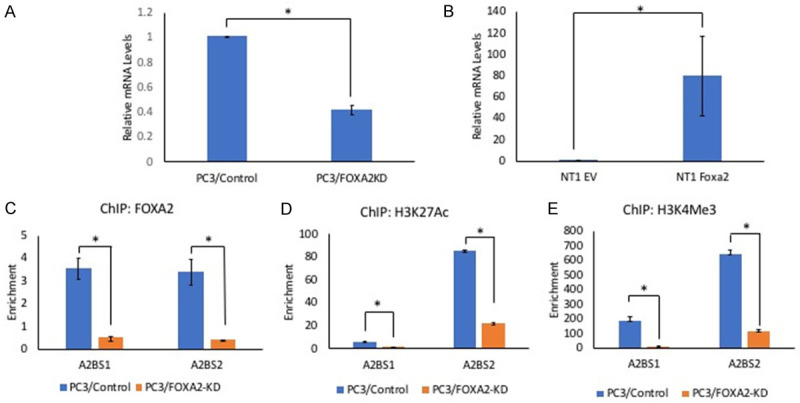
FOXA2 regulates the expression of PTHLH. A. RT-qPCR to assess the expression of PTHLH. The mRNA levels of PTHLH is lower in PC3/FOXA2 knockdown cells. *P<0.01, t-test. Error bars reported as standard deviation. B. RT-qPCR to assess the expression of PTHLH. FOXA2 over expression in mouse prostate prostatic epithelial cells caused an increase in the mRNA levels of PTHLH. *P<0.05, t-test. Error bars reported as standard deviation. C-E. Chromatin Immunoprecipitation analysis. ChIP assays were conducted by using PC3/Control and PC3/FOXA2-KD cells. FOXA2 bound to both FOXA2 binding sites (A2BS1 & A2BS2) in the regulatory region of the PTHLH gene. Additionally, H3K4me3 (histone mark of active promoters) and H3K27Ac3 (histone mark of active enhancers) were enriched in the PTHLH regulatory regions. (*P<0.01, t-test).
FOXA2 is a pioneer transcription factor; therefore, we evaluated whether FOXA2 is recruited to the regulatory regions of PTHLH. The results revealed enrichment of FOXA2 at both FOXA2-binding sites (identified from publicly available ChIP-Seq datasets) on the PTHLH regulatory region in PC3/Control cells, but FOXA2 occupancy was significantly decreased in PC3/FOXA2-KD cells (Figure 6C, P<0.01, t-test). Concurrent with the reduced FOXA2 binding, binding of H3K27ac3, a histone mark for active enhancers and promoters, and H3K4me3, a mark for active promoters, were also significantly decreased (Figure 6D, 6E, P<0.01, t-test). Together, these results indicate that FOXA2 directly regulates PTHLH expression in PC3 cells.
Discussion
Bone metastasis is the most critical complication of advanced PCa [1-4]. In this study, we identified a previously undefined role of FOXA2 in PCa growth in bone. We found that FOXA2 knockdown caused a significant decrease in PCa PC3-mediated bone destruction in vivo following intra-tibial injection. However, FOXA2 knockdown did not significantly affect the growth of PC3 tumors when the cells were injected subcutaneously, suggesting that reduced tumor growth following FOXA2 knockdown is bone-specific. To explore the mechanisms through which FOXA2 promotes cancer-mediated bone lesions, we assessed the expression of bone remodeling-related genes and found that the mRNA levels of PTHLH decreased following FOXA2 knockdown. Additionally, we found that over-expression of Foxa2 in mouse prostate epithelial cells resulted in increased PTHLH mRNA levels. Furthermore, ChIP assays indicate that FOXA2 occupies the regulatory region of PTHLH. These data suggest that FOXA2 directly regulates the transcription of this gene. PTHrP is a well-established factor that regulates the turnover of bone tissue in both normal physiology and cancer metastases. FOXA2’s regulation of PTHLH expression could provide a mechanism to promote PCa cells’ interaction with the bone microenvironment and facilitate PCa bone colonization.
The formation of metastatic lesions is an active process involving reciprocal communication between PCa cells and resident cellular elements (mainly osteoclasts and osteoblasts) in the bone matrix [21]. PCa cells secrete factors that stimulate bone resorption mediated by osteoclasts [22,23]. As osteoclasts resorb bone matrix, they liberate growth factors to support PCa growth and also stimulate osteoblasts to form new bone [24]. This results in a ‘vicious cycle’ of bone destruction, tumor growth, and new bone formation. This process is important for creating a ‘fertile’ environment to support metastatic PCa cell survival. While several studies have found that the majority of PCa bone metastases are osteoblastic, it is now recognized that osteoclast activity is also critical for creating a “fertile” environment to allow PCa cells to escape apoptosis and to optimize their survival, even in the case of osteoblastic lesions [1,25]. Furthermore, while prostate adenocarcinomas mostly generate osteoblastic lesions, NEPCa cells predominantly cause lytic bone destruction. Our discovery of FOXA2’s regulation of PTHLH provides a mechanism through which NEPCa cells stimulate bone resorption, promoting successful bone colonization. Additionally, our chemotaxis data indicate that PC3/FOXA-KD cells have reduced ability to migrate through collagen I, a major component of the bone extracellular matrix [26]. This could also contribute to the interactions between PCa cells and the bone microenvironment.
Our research reveals a pro-metastatic function of FOXA2 in PCa. However, FOXA2 involvement in cancer appears to be organ-specific. FOXA2 expression is associated with relapse in breast cancer [27], but FOXA2 has been shown to have anti-cancer and anti-metastatic properties in cancers arising from foregut derivatives (lung, stomach, pancreas, and liver), where FOXA2 is involved in regulating cellular differentiation [28-32]. In PCa, FOXA2 is a biomarker of NEPCa and has been shown to promote NE differentiation [10] and sustain AR responsive promoters in SV40 T-antigen-driven prostatic tumor cells after androgen deprivation [17]. However, it has not been investigated previously whether FOXA2 has a functional role in NEPCa metastasis. Our work provides evidence supporting FOXA2’s role in regulating PTHLH expression and promoting NEPCa growth in the bone.
FOXA2 is a well-established marker of NEPCa [6,9]. Our finding that the expression of FOXA2 correlates with that of SYP is consistent with previous reports [6,9]. Furthermore, analysis of the NEPCa-Beltran RNAseq dataset [33] indicates that FOXA2 expression is associated with a NE phenotype [34]. Finally, analysis of the GSE3325 microarray data demonstrates that FOXA2 is absent in all benign and localized prostate tissues but is detectable in 4 of 6 NEPCa tissues [34]. Taken together, these data indicate that the expression of FOXA2 correlates with NE phenotype in PCa.
Finally, we found that approximately 15% of PCa bone metastases express FOXA2 (Table 2). This agrees with a previous report that approximately 14% of PCa bone metastases are NEPCa [35].
One limitation of this study is the use of a single cell line. However, among the commonly used PCa cell lines, PC3 is the only one that highly expresses FOXA2. 22Rv1 cells express low levels of FOXA2, which makes it difficult to assess the effects of FOXA2 knockdown. Our conclusion of FOXA2’s involvement in the establishment of bone metastasis is supported by our results demonstrating the expression of FOXA2 in clinical specimens.
In conclusion, we found that FOXA2 is expressed in a subset of PCa bone metastases, regulates the expression of PTHLH and promotes PCa colonization in the bone.
Acknowledgements
We would like to thank Dr. Robert Matusik at Vanderbilt University Medical Center and Dr. Michael Cher at Wayne State University for advice on the research. We thank the patients and their families, Celestia Higano, Evan Yu, Elahe Mostaghel, Heather Cheng, Bruce Montgomery, Paul Lange, Robert Vessella, Martine Roudier, Lawrence True, and the rapid autopsy teams for their contributions to the University of Washington Medical Center Prostate Cancer Donor Rapid Autopsy Program. This research is supported by the Department of Defense grant W81XWH-12-1-0212 and Prostate Cancer Biorepository Network grant W81XWH-14-2-0183, NIH R03 CA212567, U54 GM104940, the PNW Prostate Cancer SPORE P50 CA097186, P01 CA163227, LSUHSC FWCC and Office of Research funding to XY, and Carroll Feist Pre-doctoral Fellowship to ZC.
Disclosure of conflict of interest
None.
Supporting Information
References
- 1.Vessella RL, Corey E. Targeting factors involved in bone remodeling as treatment strategies in prostate cancer bone metastasis. Clin Cancer Res. 2006;12:6285s–6290s. doi: 10.1158/1078-0432.CCR-06-0813. [DOI] [PubMed] [Google Scholar]
- 2.Bubendorf L, Schopfer A, Wagner U, Sauter G, Moch H, Willi N, Gasser TC, Mihatsch MJ. Metastatic patterns of prostate cancer: an autopsy study of 1,589 patients. Hum Pathol. 2000;31:578–583. doi: 10.1053/hp.2000.6698. [DOI] [PubMed] [Google Scholar]
- 3.Gandaglia G, Abdollah F, Schiffmann J, Trudeau V, Shariat SF, Kim SP, Perrotte P, Montorsi F, Briganti A, Trinh QD, Karakiewicz PI, Sun M. Distribution of metastatic sites in patients with prostate cancer: a population-based analysis. Prostate. 2014;74:210–216. doi: 10.1002/pros.22742. [DOI] [PubMed] [Google Scholar]
- 4.Sottnik JL, Keller ET. Understanding and targeting osteoclastic activity in prostate cancer bone metastases. Curr Mol Med. 2013;13:626–639. doi: 10.2174/1566524011313040012. [DOI] [PMC free article] [PubMed] [Google Scholar]
- 5.Epstein JI, Amin MB, Beltran H, Lotan TL, Mosquera JM, Reuter VE, Robinson BD, Troncoso P, Rubin MA. Proposed morphologic classification of prostate cancer with neuroendocrine differentiation. Am J Surg Pathol. 2014;38:756–767. doi: 10.1097/PAS.0000000000000208. [DOI] [PMC free article] [PubMed] [Google Scholar]
- 6.Park JW, Lee JK, Witte ON, Huang J. FOXA2 is a sensitive and specific marker for small cell neuroendocrine carcinoma of the prostate. Mod Pathol. 2017;30:1262–1272. doi: 10.1038/modpathol.2017.44. [DOI] [PMC free article] [PubMed] [Google Scholar]
- 7.Jackson DA, Rowader KE, Stevens K, Jiang C, Milos P, Zaret KS. Modulation of liver-specific transcription by interactions between hepatocyte nuclear factor 3 and nuclear factor 1 binding DNA in close apposition. Mol Cell Biol. 1993;13:2401–2410. doi: 10.1128/mcb.13.4.2401. [DOI] [PMC free article] [PubMed] [Google Scholar]
- 8.Mirosevich J, Gao N, Matusik RJ. Expression of Foxa transcription factors in the developing and adult murine prostate. Prostate. 2005;62:339–352. doi: 10.1002/pros.20131. [DOI] [PubMed] [Google Scholar]
- 9.Mirosevich J, Gao N, Gupta A, Shappell SB, Jove R, Matusik RJ. Expression and role of Foxa proteins in prostate cancer. Prostate. 2006;66:1013–1028. doi: 10.1002/pros.20299. [DOI] [PubMed] [Google Scholar]
- 10.Qi J, Nakayama K, Cardiff RD, Borowsky AD, Kaul K, Williams R, Krajewski S, Mercola D, Carpenter PM, Bowtell D, Ronai ZA. Siah2-dependent concerted activity of HIF and FoxA2 regulates formation of neuroendocrine phenotype and neuroendocrine prostate tumors. Cancer Cell. 2010;18:23–38. doi: 10.1016/j.ccr.2010.05.024. [DOI] [PMC free article] [PubMed] [Google Scholar]
- 11.Martin TJ, Johnson RW. Multiple actions of PTHrP in breast cancer bone metastasis. Br J Pharmacol. 2019 doi: 10.1111/bph.14709. [Epub ahead of print] [DOI] [PMC free article] [PubMed] [Google Scholar]
- 12.Sterling JA, Edwards JR, Martin TJ, Mundy GR. Advances in the biology of bone metastasis: how the skeleton affects tumor behavior. Bone. 2011;48:6–15. doi: 10.1016/j.bone.2010.07.015. [DOI] [PubMed] [Google Scholar]
- 13.Kamp K, Feelders RA, van Adrichem RC, de Rijke YB, van Nederveen FH, Kwekkeboom DJ, de Herder WW. Parathyroid hormone-related peptide (PTHrP) secretion by gastroenteropancreatic neuroendocrine tumors (GEP-NETs): clinical features, diagnosis, management, and follow-up. J Clin Endocrinol Metab. 2014;99:3060–3069. doi: 10.1210/jc.2014-1315. [DOI] [PubMed] [Google Scholar]
- 14.Wu G, Iwamura M, di Sant’Agnese PA, Deftos LJ, Cockett AT, Gershagen S. Characterization of the cell-specific expression of parathyroid hormone-related protein in normal and neoplastic prostate tissue. Urology. 1998;51:110–120. doi: 10.1016/s0090-4295(98)00077-6. [DOI] [PubMed] [Google Scholar]
- 15.Tai S, Sun Y, Squires JM, Zhang H, Oh WK, Liang CZ, Huang J. PC3 is a cell line characteristic of prostatic small cell carcinoma. Prostate. 2011;71:1668–1679. doi: 10.1002/pros.21383. [DOI] [PMC free article] [PubMed] [Google Scholar]
- 16.Corey E, Quinn JE, Bladou F, Brown LG, Roudier MP, Brown JM, Buhler KR, Vessella RL. Establishment and characterization of osseous prostate cancer models: intra-tibial injection of human prostate cancer cells. Prostate. 2002;52:20–33. doi: 10.1002/pros.10091. [DOI] [PubMed] [Google Scholar]
- 17.Connelly ZM, Yang S, Chen F, Yeh Y, Khater N, Jin R, Matusik R, Yu X. Foxa2 activates the transcription of androgen receptor target genes in castrate resistant prostatic tumors. Am J Clin Exp Urol. 2018;6:172–181. [PMC free article] [PubMed] [Google Scholar]
- 18.Freese NH, Norris DC, Loraine AE. Integrated genome browser: visual analytics platform for genomics. Bioinformatics. 2016;32:2089–2095. doi: 10.1093/bioinformatics/btw069. [DOI] [PMC free article] [PubMed] [Google Scholar]
- 19.Cheng S, Prieto-Dominguez N, Yang S, Connelly ZM, StPierre S, Rushing B, Watkins A, Shi L, Lakey M, Baiamonte LB, Fazili T, Lurie A, Corey E, Shi R, Yeh Y, Yu X. The expression of YAP1 is increased in high-grade prostatic adenocarcinoma but is reduced in neuroendocrine prostate cancer. Prostate Cancer Prostatic Dis. 2020 doi: 10.1038/s41391-020-0229-z. [Epub ahead of print] [DOI] [PMC free article] [PubMed] [Google Scholar]
- 20.Southby J, Kissin MW, Danks JA, Hayman JA, Moseley JM, Henderson MA, Bennett RC, Martin TJ. Immunohistochemical localization of parathyroid hormone-related protein in human breast cancer. Cancer Res. 1990;50:7710–7716. [PubMed] [Google Scholar]
- 21.Roodman GD. Mechanisms of bone metastasis. N Engl J Med. 2004;350:1655–1664. doi: 10.1056/NEJMra030831. [DOI] [PubMed] [Google Scholar]
- 22.Chu GC, Zhau HE, Wang R, Rogatko A, Feng X, Zayzafoon M, Liu Y, Farach-Carson MC, You S, Kim J, Freeman MR, Chung LW. RANK- and c-Met-mediated signal network promotes prostate cancer metastatic colonization. Endocr Relat Cancer. 2014;21:311–326. doi: 10.1530/ERC-13-0548. [DOI] [PMC free article] [PubMed] [Google Scholar]
- 23.Morrissey C, Lai JS, Brown LG, Wang YC, Roudier MP, Coleman IM, Gulati R, Vakar-Lopez F, True LD, Eva C, Nelson PS, Vessella RL. The expression of osteoclastogenesis-associated factors and osteoblast response to osteolytic prostate cancer cells. Prostate. 2010;70:412–424. doi: 10.1002/pros.21075. [DOI] [PMC free article] [PubMed] [Google Scholar]
- 24.Lind M. Growth factor stimulation of bone healing. Effects on osteoblasts, osteomies, and implants fixation. Acta Orthop Scand Suppl. 1998;283:2–37. [PubMed] [Google Scholar]
- 25.Cher ML. Mechanisms governing bone metastasis in prostate cancer. Curr Opin Urol. 2001;11:483–488. doi: 10.1097/00042307-200109000-00006. [DOI] [PubMed] [Google Scholar]
- 26.Hall CL, Dubyk CW, Riesenberger TA, Shein D, Keller ET, van Golen KL. Type I collagen receptor (alpha2beta1) signaling promotes prostate cancer invasion through RhoC GTPase. Neoplasia. 2008;10:797–803. doi: 10.1593/neo.08380. [DOI] [PMC free article] [PubMed] [Google Scholar]
- 27.Perez-Balaguer A, Ortiz-Martinez F, Garcia-Martinez A, Pomares-Navarro C, Lerma E, Peiro G. FOXA2 mRNA expression is associated with relapse in patients with triple-negative/basal-like breast carcinoma. Breast Cancer Res Treat. 2015;153:465–474. doi: 10.1007/s10549-015-3553-6. [DOI] [PubMed] [Google Scholar]
- 28.Vorvis C, Hatziapostolou M, Mahurkar-Joshi S, Koutsioumpa M, Williams J, Donahue TR, Poultsides GA, Eibl G, Iliopoulos D. Transcriptomic and CRISPR/Cas9 technologies reveal FOXA2 as a tumor suppressor gene in pancreatic cancer. Am J Physiol Gastrointest Liver Physiol. 2016;310:G1124–1137. doi: 10.1152/ajpgi.00035.2016. [DOI] [PMC free article] [PubMed] [Google Scholar]
- 29.Chand V, Pandey A, Kopanja D, Guzman G, Raychaudhuri P. Opposing roles of the fork-head box genes FoxM1 and FoxA2 in liver cancer. Mol Cancer Res. 2019;17:1063–1074. doi: 10.1158/1541-7786.MCR-18-0968. [DOI] [PMC free article] [PubMed] [Google Scholar]
- 30.Wang J, Zhu CP, Hu PF, Qian H, Ning BF, Zhang Q, Chen F, Liu J, Shi B, Zhang X, Xie WF. FOXA2 suppresses the metastasis of hepatocellular carcinoma partially through matrix metalloproteinase-9 inhibition. Carcinogenesis. 2014;35:2576–2583. doi: 10.1093/carcin/bgu180. [DOI] [PubMed] [Google Scholar]
- 31.Li CM, Gocheva V, Oudin MJ, Bhutkar A, Wang SY, Date SR, Ng SR, Whittaker CA, Bronson RT, Snyder EL, Gertler FB, Jacks T. Foxa2 and Cdx2 cooperate with Nkx2-1 to inhibit lung adenocarcinoma metastasis. Genes Dev. 2015;29:1850–1862. doi: 10.1101/gad.267393.115. [DOI] [PMC free article] [PubMed] [Google Scholar]
- 32.Li C, Lu S, Shi Y. MicroRNA-187 promotes growth and metastasis of gastric cancer by inhibiting FOXA2. Oncol Rep. 2017;37:1747–1755. doi: 10.3892/or.2017.5370. [DOI] [PubMed] [Google Scholar]
- 33.Beltran H, Prandi D, Mosquera JM, Benelli M, Puca L, Cyrta J, Marotz C, Giannopoulou E, Chakravarthi BV, Varambally S, Tomlins SA, Nanus DM, Tagawa ST, Van Allen EM, Elemento O, Sboner A, Garraway LA, Rubin MA, Demichelis F. Divergent clonal evolution of castration-resistant neuroendocrine prostate cancer. Nat Med. 2016;22:298–305. doi: 10.1038/nm.4045. [DOI] [PMC free article] [PubMed] [Google Scholar]
- 34.Cheng S, Yu X. Bioinformatics analyses of publicly available NEPCa datasets. Am J Clin Exp Urol. 2019;7:327–340. [PMC free article] [PubMed] [Google Scholar]
- 35.Aggarwal R, Huang J, Alumkal JJ, Zhang L, Feng FY, Thomas GV, Weinstein AS, Friedl V, Zhang C, Witte ON, Lloyd P, Gleave M, Evans CP, Youngren J, Beer TM, Rettig M, Wong CK, True L, Foye A, Playdle D, Ryan CJ, Lara P, Chi KN, Uzunangelov V, Sokolov A, Newton Y, Beltran H, Demichelis F, Rubin MA, Stuart JM, Small EJ. Clinical and genomic characterization of treatment-emergent small-cell neuroendocrine prostate cancer: a multi-institutional prospective study. J. Clin. Oncol. 2018;36:2492–2503. doi: 10.1200/JCO.2017.77.6880. [DOI] [PMC free article] [PubMed] [Google Scholar]
Associated Data
This section collects any data citations, data availability statements, or supplementary materials included in this article.


