

Abstract
CpG methylation by the de novo DNA methyltransferases (DNMTs) 3A and 3B is essential for mammalian development and differentiation and is frequently dysregulated in cancer1. These two DNMTs preferentially bind to nucleosomes yet cannot methylate the DNA wrapped around the nucleosome core2, and favor the methylation of linker DNA at positioned nucleosomes3,4. Here we present the cryo-EM structure of a ternary complex of catalytically competent DNMT3A2, the catalytically inactive accessory subunit DNMT3B3, and a nucleosome core particle flanked by linker DNA. The catalytic-like domain of the accessory DNMT3B3 binds the acidic patch of the nucleosome core, which orients the binding of DNMT3A2 to the linker DNA. The steric constraints of this arrangement suggest that nucleosomal DNA must be moved relative to the nucleosome core for de novo methylation to occur.
The methylation of DNA in a chromatin context is far more complex than in solution, particularly because DNA wrapped around a nucleosome is refractory to cytosine modification by either prokaryotic or mammalian enzymes3,4. Also, most of the de novo DNMT3s bound to nucleosomes are not actively engaged in catalysis. De novo DNMT3A is expressed as two splice variants, DNMT3A1 and DNMT3A2, and relies on two catalytically inactive paralogs, DNMT3L or DNMT3B3, (Fig. 1a) for DNA methylation5,6. We focused on determining the interaction of DNMT3A2 and DNMT3B3 with a nucleosome core particle (NCP), because these are the two predominant forms expressed in human cancers (Fig. 1b). Our knowledge of the structural basis for the role of accessory proteins in de novo methylation relies heavily on the seminal work of the Cheng lab, which used crystallography to demonstrate the formation of a tetrameric complex of two molecules each of DNMT3A2 and DNMT3L7,8.
Fig. 1. Cryo-EM structure of the human DNMT3A2/DNMT3B3/NCP complex.
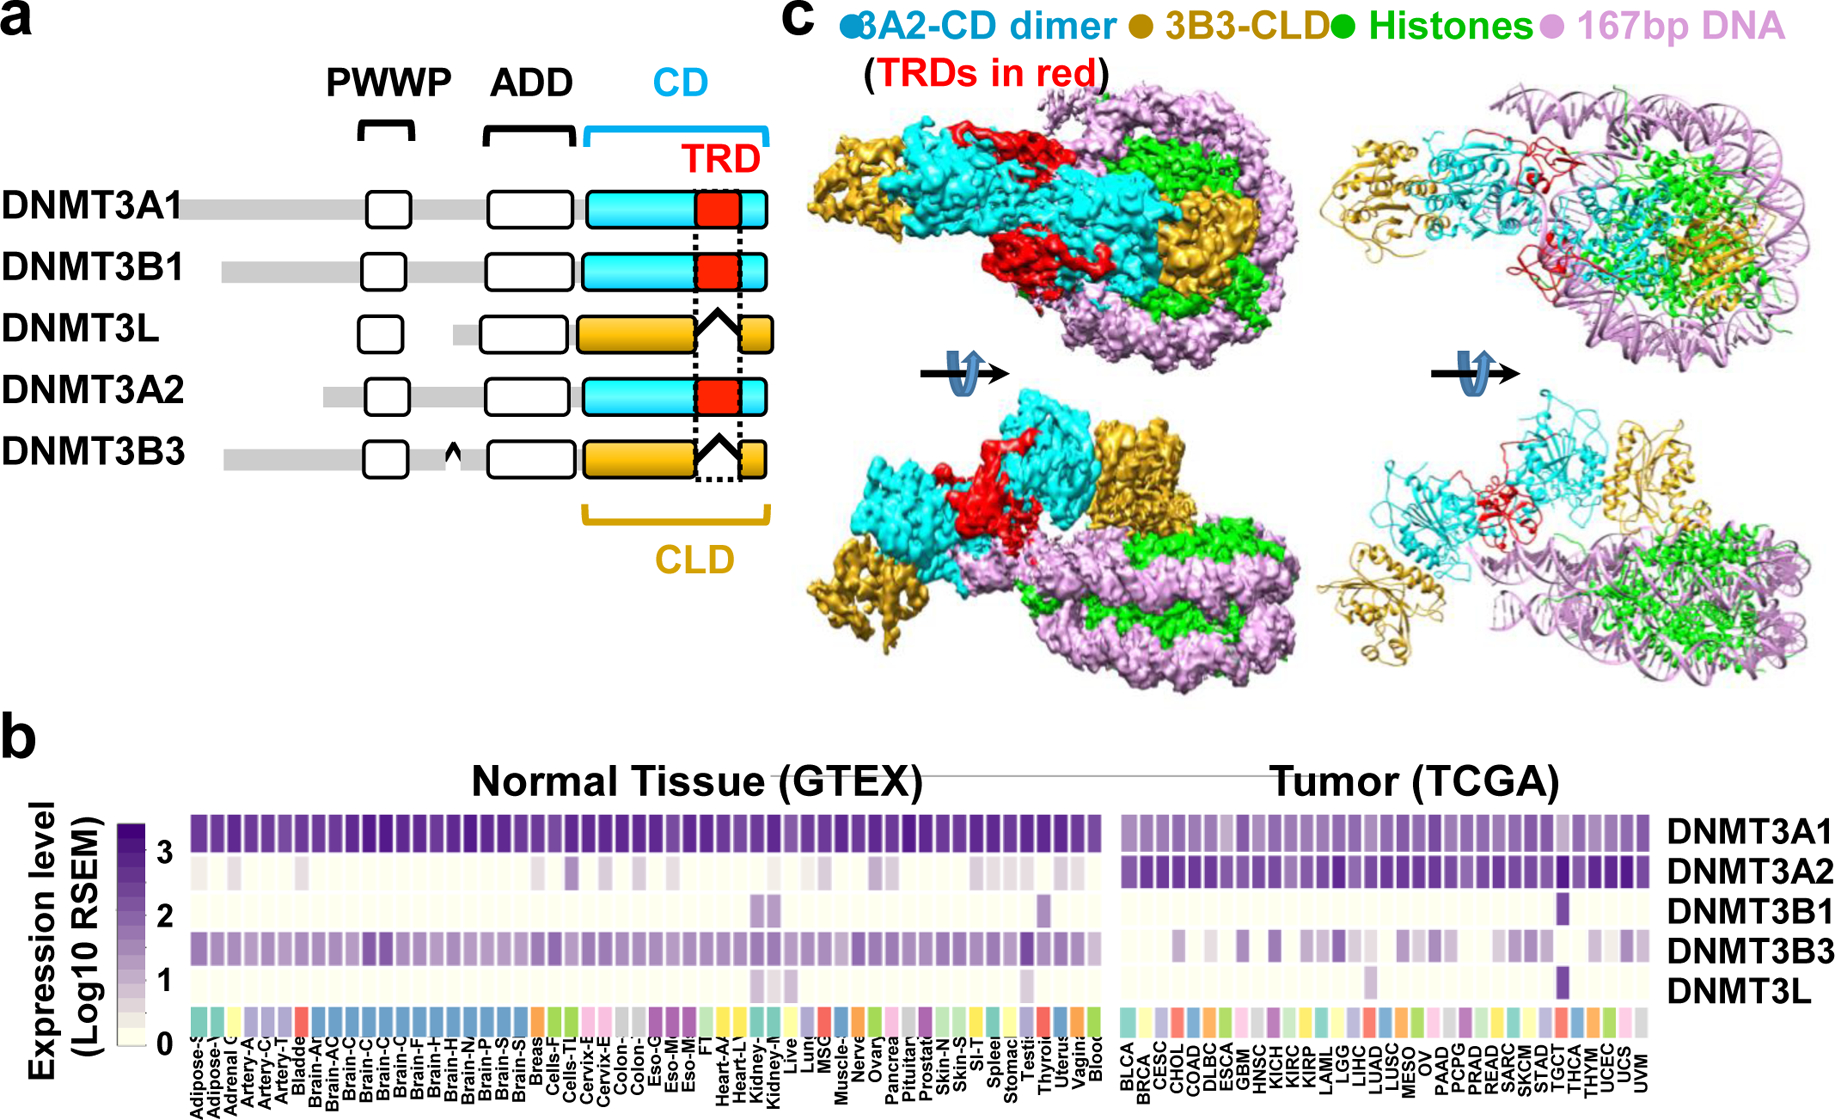
a, Color-coded domain architecture of human DNMT3 family isoforms. CD: catalytic domain; CLD: catalytic-like domain; NCP: nucleosome core particle; TRD: target recognition domain. b, DNMT3 isoform expression levels in normal tissues (left, GTEX data) and in tumors (right, TCGA data). c, Cryo-EM density map (left) and molecular model of the complex (right).
Active and inactive paralogs of DNMT3s share N-terminal Pro-Trp-Trp-Pro (PWWP) domains (with the exception of DNMT3L), central ATRX-DNMT3-DNMT3L (ADD) domains, and either a catalytic (CD) or catalytic-like (CLD) C-terminal domain (Fig. 1a). Previous crystallographic work7–10 has defined the architecture of the DNMT3A/3L (ADD)-CD/CLD7,9 domain complex and its interactions with an H3 peptide8,9 or naked DNA10. However, because of its limitations, this approach could not show how DNMT3A and accessory proteins such as DNMT3B3 bind to nucleosomes, which are their natural targets in living cells. We used the power of cryo-EM to solve this important structure given that somatic DNMT3A mutations are very common in apparently normal and malignant blood cells11, and germline mutations are implicated in microcephalic dwarfism and gigantism12–14.
NCP assembly
We assembled NCPs containing the 147-bp “Widom 601” nucleosome positioning sequence15 flanked on each side by 10 bp linker DNA with full length DNMT3A2 and DNMT3B3 (Extended Data Fig. 1). Assembly was confirmed by AlphaScreen and gel mobility shift assays, and the catalytic activity of the DNMT3/NCP complex was confirmed by methylation assay (Extended Data Fig. 2 and 3). We determined the structure of this complex by cryo-EM at a global resolution of about 3 Å, with resolution of the NCP at 2.8 Å and resolution of the DNMTs at 3.4 Å (Fig. 1c, Extended Data Figs. 4–6, and Supplementary Video 1).
DNMT3 binds nucleosome core and linker DNA
The overall complex structure shows a well-resolved nucleosome with flanking DNA and clear density for secondary structure elements and many side chains of the two DNMT3A2 catalytic domains, and, to a lesser degree, the two DNMT3B3 catalytic-like domains (Fig. 1c and Extended Data Fig. 7). Weak partial density was observed for the ADD domains, which allowed their positioning relative to the catalytic domains and NCP (Extended Data Figs. 4 and 7). Structural studies by Guo et al.9 showed that the DNMT3A2 ADDs are in equilibrium between active and autoinhibitory conformations. Binding to an unmodified histone H3 N-terminus releases the autoinhibition of the catalytic domain of the DNMT9. The position of the ADD in our structure seems similar to that of the autoinhibited state (Extended Data Fig 4b), even though the H3 N-terminus of the NCP was unmodified. However, the actual activity state of the ADD is not conclusive due to the weak and incomplete density of the ADD and invisible H3 N-terminus. Because their densities were insufficient to allow accurate model building, we omitted the ADD domains from the final model. No reliable densities could be identified for the PWWP domains or the histone tails extending beyond the nucleosomal DNA, indicating their highly dynamic nature in the intact complex.
The structure shows a heterotetrameric 3B3–3A2–3A2–3B3 complex very similar to that formed by the isolated catalytic domains and catalytic-like domains of DNMT3A and DNMT3L7,10. This complex interacts asymmetrically with the NCP, with one of the two DNMT3B3 catalytic-like domains anchored to the acidic patch region of the nucleosome core. Central to this interaction are the DNMT3B3 arginine residues R740 and R743, whose side chains have electrostatic/polar interactions with the H2A residues E56, E61, D90, and E92, and with the H2B residue Q44 in the acidic patch surface groove (Fig. 2a–d). This acidic patch is a key structural element that also has crucial interactions with many other NCP-binding proteins. The two DNMT3A2 catalytic domains and the second DNMT3B3 catalytic-like domain do not contact the core nucleosome but rather follow the path of the linker DNA. In this arrangement, DNA binding is limited to interaction of the NCP-distal DNMT3A2 with the linker DNA, mainly through insertion of the target recognition domain (TRD) loop of DNMT3A2 into the major groove of the DNA and of the catalytic loop into the minor groove (Fig. 2e,f and Fig. 3a) as shown previously for naked DNA-bound DNMT3A2/3L10. The nucleosome-proximal DNMT3A2 is positioned directly at the exit site from the nucleosome core, restricting its ability to access its target site (Fig. 2f). The interactions greatly constrain the conformation of the linker DNA that is bound to DNMT3A2 and the conformation of the DNMT3B3 that is bound to the nucleosome core (Fig. 2 and Extended Data Fig. 7).
Fig. 2. Details of the acidic patch and DNA-catalytic domain (CD) interactions.
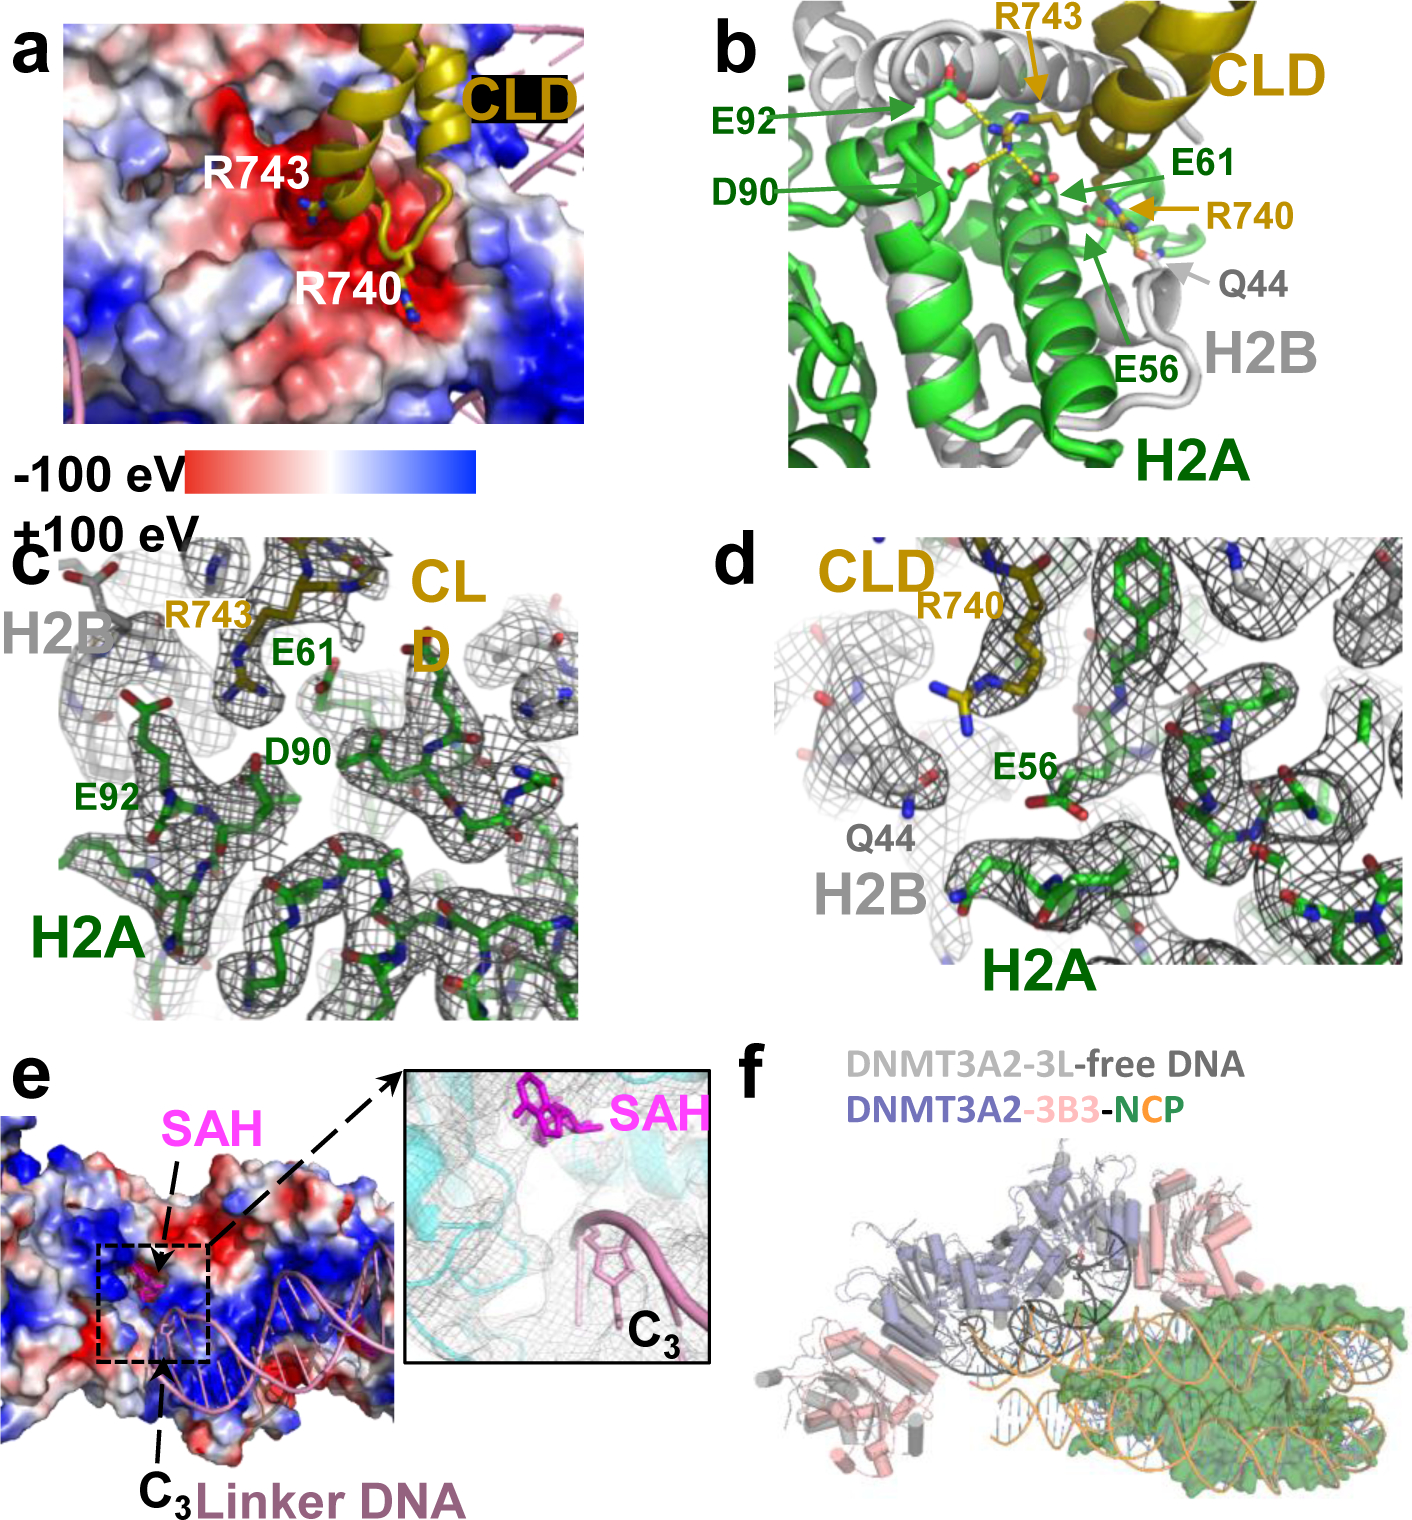
a, Two positively charged Arg fingers insert into negatively charged pockets of the acidic patch. The histone octamer in the acidic patch region is shown as charge potential map, nucleosomal DNA and the catalytic-like domain (CLD) loop as cartoon model with the two Arg fingers in stick representation. b, Close-up of the acidic patch interaction. Dashed lines indicate hydrogen-bonding interactions. c,d, Map density of DNMT3B3 R743 (c) and R740 (d) and their interacting residues in the acidic patch generated in PyMOL and contoured at 8 σ. e, Binding of linker DNA to the CD of DNMT3A2. CD: surface charge potential map; linker DNA: cartoon model; SAH and cytosine C3 of the CpG site near the catalytic center: stick presentation. Insert: close-up of catalytic center with cryo-EM density visualized in PyMOL and contoured at 8 σ. f, Structural overlay of NCP-bound DNMT3A2/3B3 with the crystal structure of free DNA-bound DNMT3A2/3L (5YX2).
Fig. 3. The TRD mediates DNA binding but prevents NCP core binding.
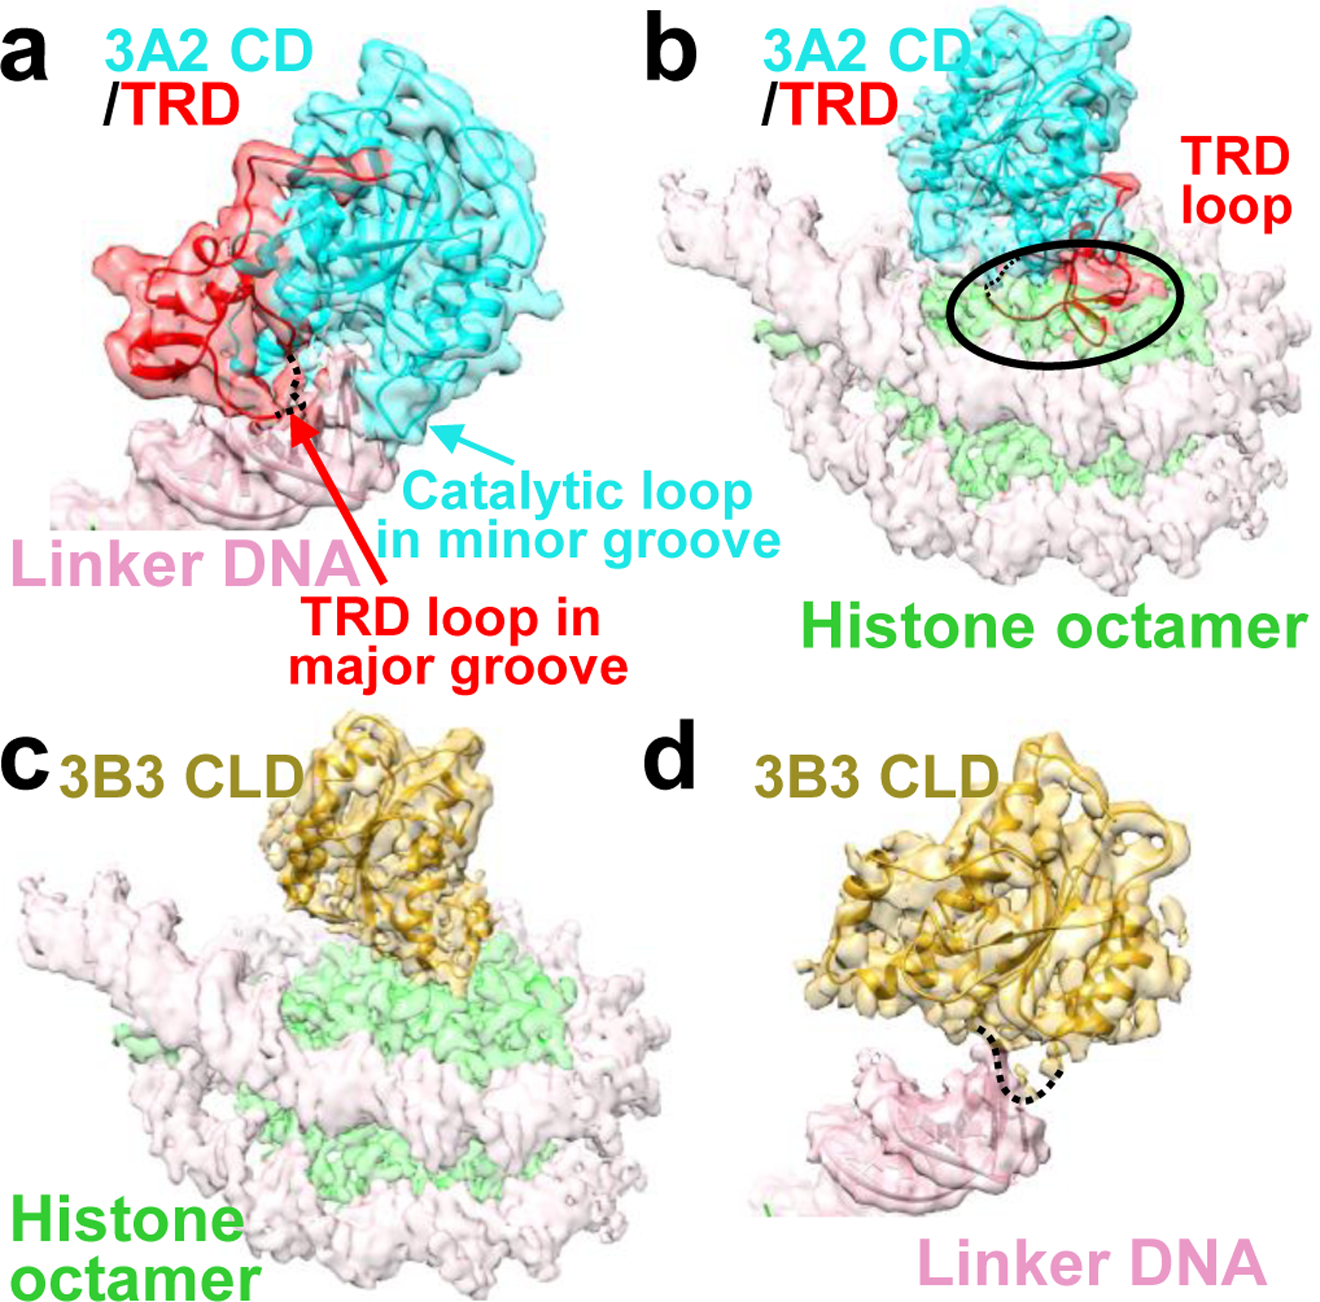
a, Binding of the DNMT3A2 catalytic domain (3A2 CD) to linker DNA. b, Structural alignment model in which the DNMT3B3 catalytic-like domain (3B3 CLD) bound to the histone octamer is replaced by the 3A2 CD. Note that the TRD clashes with the position of the histone octamer (indicated by the black oval), preventing NCP core binding. Dashed line: part of the TRD loop with weak density that has been deleted from the final model (see Ext. Data Fig. 4d). c, Binding of the DNMT3B3 catalytic-like domain (3B3 CLD) to the histone core. d, Model in which 3A2 CD bound to linker DNA is replaced by 3B3 CLD. Without the TRD, the 3B3 CLD only weakly interacts with linker DNA. Dashed line indicates the position of the catalytic loop. Transparent cryo-EM density generated in UCSF Chimera at 0.013 contour level overlaid with solid cartoon model.
TRD directs histone versus DNA binding
Structural alignment of DNA-bound DNMT3A2 and nucleosome core-bound DNMT3B3 revealed a switch function for the TRD. The TRD, found in all catalytically active DNMT3A and 3B isoforms, makes key contributions to DNA binding and homodimerization10, yet sterically blocks the binding of the catalytic domains to the nucleosomal core (Fig. 3b). However, the TRD is missing in the catalytic-like domains of the accessory subunits DNMT3L and DNMT3B3 (Fig. 1a and Supplementary Figure S1). Consequently, the catalytic-like domains from accessory subunits only weakly interact with DNA and weakly homo-oligomerize7,16, but they allow the anchoring of the DNMT3A2/DNMT3B3 complex to the nucleosome core (Fig. 3c,d).
R740/R743 are important for nucleosome binding
We purified mutant DNMT3B3 to test the importance of the acidic patch interaction for nucleosome recruitment in vitro (Fig. 4a). We established four charge-reversal mutations (K745E/D, R749E, R740E, and R743E) and four same-charge mutations (K745R, R749K, R740K, and R743K) near or at the main acidic patch–binding residues of DNMT3B3 (see Fig. 2a,b and Supplementary Figure S1). Of the charge-reversal mutations, K745E and R749E near the acidic patch had little influence, while R740E and R743E at the acidic patch strongly reduced the ability of the DNMT3A2/DNMT3B3 heterotetramer to bind the NCP (Fig. 4a). As expected, the four same-charge mutations showed no significant changes in binding ability (Fig. 4a). This data suggests that R740 and R743 play significant roles in mediating the acidic patch–catalytic-like domain interaction.
Fig. 4. The DNMT3B3-acidic patch interaction is required for chromatin recruitment.
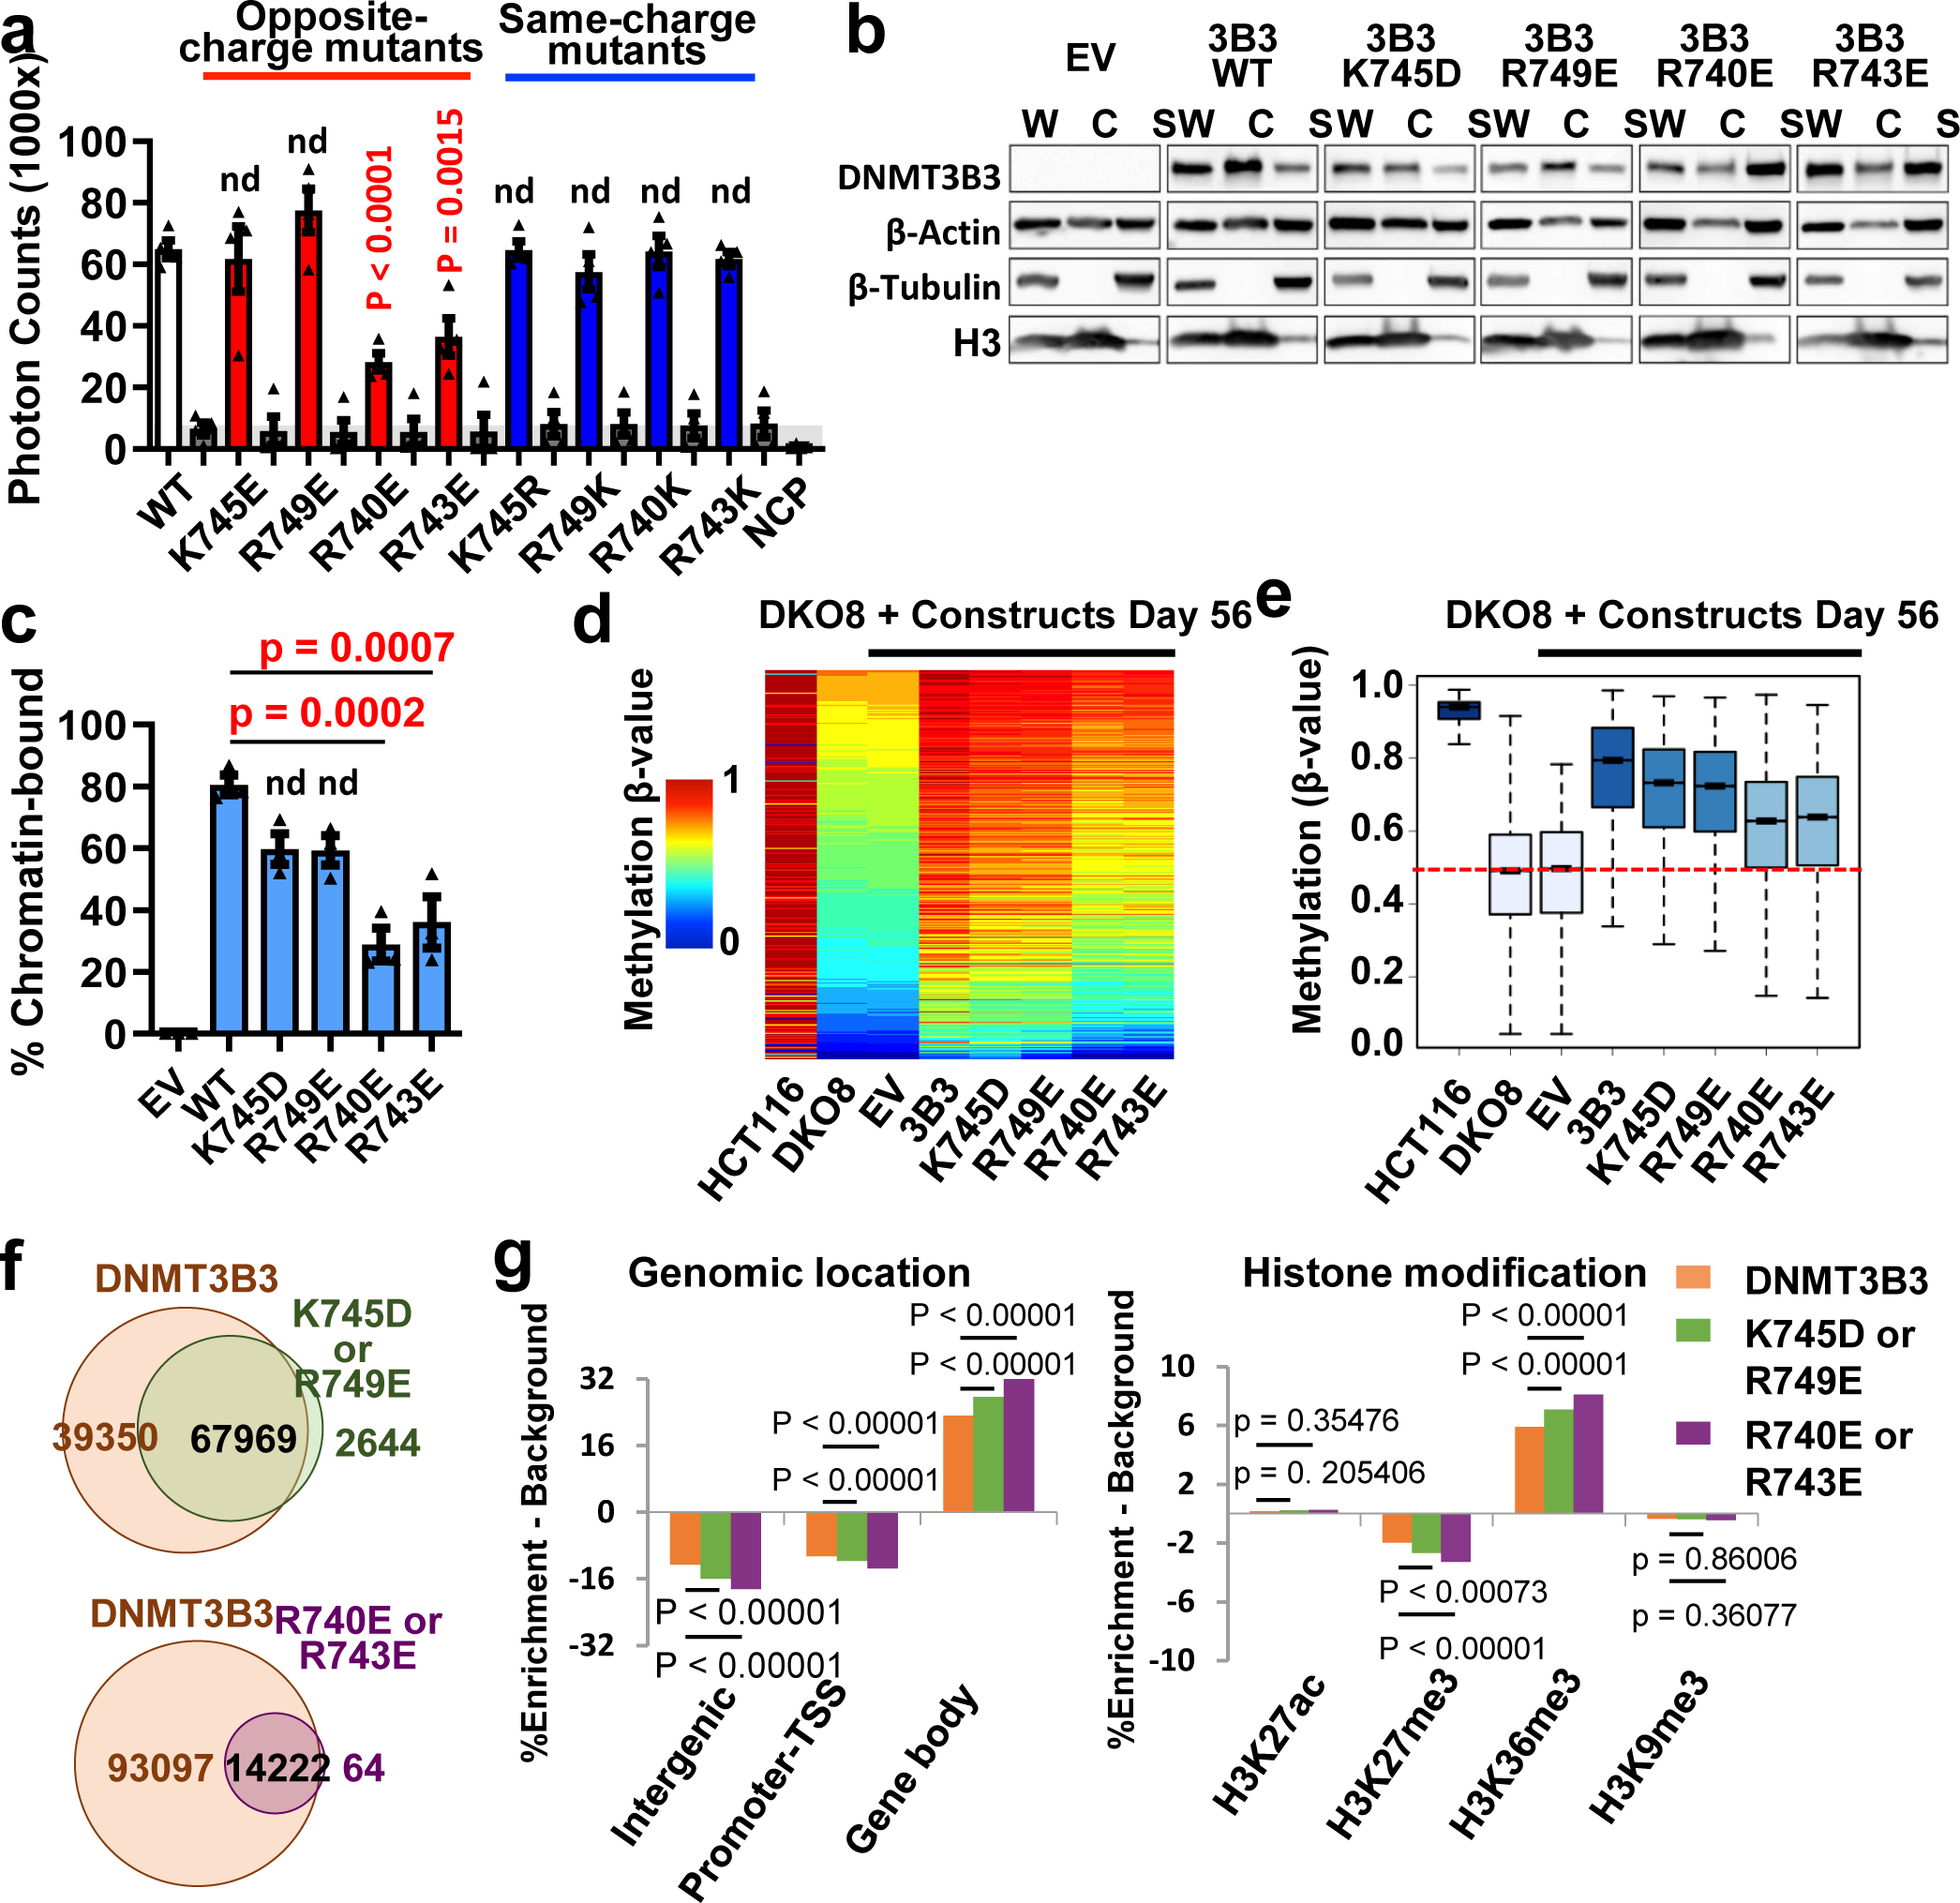
a, AlphaScreen interaction assay between His-tagged wildtype and CLD mutant DNMT3A2/DNMT3B3 complexes and biotinylated NCP. Opposite-charge mutants (red); same-charge mutants (blue); “DNMT only” and “NCP only” controls (grey). Data are mean ± sem, n = 4. b,c One representative western blot (b) and graphical representation from 3 independent biological replicates (c) of DNMT3 chromatin association. Chromatin was fractionated from DKO8 cells with introduced wildtype and mutant MYC-tagged DNMT3B3. The presence of DNMT3B3 in chromatin and soluble fractions was determined by immunoblotting. W: whole protein; C: chromatin fractions; S: soluble fractions. Data are mean ± sem, n = 3. d, Methylation heatmap of CpG sites in HCT116 wildtype and DKO8 cells expressing the indicated DNMT3B3 WT or CLD mutants. Methylation levels in HCT116 and DKO8 cells from two independent experiments are represented by color scale β-value (0–1, 0–100% methylated), where every row represents one CpG. e, Box plot of 109,998 probes, showing the distribution of DNA methylation levels for each indicated cell line. Median and interquartile range are represented by the bar and blue box; outliers outside the 5th to 95th percentiles are not shown. Dashed red line: median β-value in DKO8 cells. f, Venn diagrams showing total number of target methylation sites in DNMT3B3 wildtype and mutant cells. g, DNMT3B3 histone core-interaction mutations make methylation targeting more dependent on DNMT3-histone tail binding. Same 109,998 probes were used as in e. For DNMT3B3, n= 107319; for 745D/749E, n=70613; for 740E/743E, n=14286. Methylation becomes enriched at gene bodies, marked by PWWP-binding H3K36me3/me2 modifications, and decreased at transcription start sites (TSS), whose interactions are excluded by ADD interactions. p values: one-way ANOVA with Dunnett post-test (normality confirmed by Shapiro-Wilk test) (a and c) or two-sided z-test (g). For gel source data, see Supplementary Figure S2.
We further confirmed the role of the acidic patch–interacting residues in living cells. Using the approach described earlier6, DKO8 cells with genetic knockout of DNMT3B and low levels of DNMT117,18 were infected with lentivirus constructs of the wildtype and the four charge-reversal mutant DNMT3B isoforms fused with an N-terminal MYC-tag. Western blots show that the majority of wildtype DNMT3B3, as well as the K745D and R749E mutant proteins, were bound to chromatin (Fig. 4b,c). In contrast, mutations of the acidic patch–interacting residues R740 and R743 resulted in significantly decreased (p < 0.001) binding to chromatin and increased soluble protein relative to wildtype DNMT3B3 (Fig. 4b,c). This result is consistent with the proposed structure by highlighting the need for intact DNMT3B3 and the acidic patch–interacting R740/R743 residues in anchoring DNMT3B3 to nucleosomes in vitro.
R740/R743 are important for DNA methylation
To test whether the acidic patch interaction is important for reestablishing DNA methylation patterns in vivo, we analyzed DNA methylation patterns in DKO8 cells expressing wildtype and mutant DNMT3B3 using a DNA methylation array (Infinium MethylationEPIC BeadChip) at 56 days after infection. As we reported earlier6, the presence of DNMT3B3 restored DNA methylation at loci that had lost methylation in DKO8 cells relative to the parental HCT116 cells (Fig. 4d). The charge-reversal mutations at K745 and R749, which were predicted to not interact with the acidic patch, were almost as effective as the wildtype DNMT3B3 in restoring the methylation pattern after 56 days (Fig. 4d,e). In contrast, the R740E and R743E mutations, which significantly decreased binding to chromatin (Fig. 4b,c), were much less efficient (Fig. 4d,e). As an additional control, we analyzed methylation of the same nucleosomal DNA in the absence of histones (naked DNA). As shown in Extended Data Fig. 3a, the mutant DNMT complexes did not compromise methylation of the naked DNA, indicating that defects in chromatin association and CpG methylation are due to NCP targeting defects, not to defects in DNA binding or catalysis.
The decreased restoration of DNA methylation was mainly due to a failure to methylate specific targets (Fig. 4f). Although the number of loci targeted by these mutants was decreased, they were more enriched in gene bodies and H3K36me3-marked regions (Fig. 4g), suggesting that the binding of the DNMT3A2/DNMT3B3 complex to nucleosomes not only depends on the acidic patch–catalytic-like domain interaction but also on binding to histone tails, especially through the unmodified H3 N-terminus8,9 and H3K36me2/H3K36me319–22. This result emphasizes the importance of the interaction of the catalytic-like domain of DNMT3B3 with the acidic patch for nucleosome recruitment and DNA methylation, in addition to the roles of the PWWP and ADD domains23–26.
DNMT3A2/3B3–linker DNA interaction
In contrast to previous structures of free DNA-bound methyltransferases10,27,28, an adenine two base pairs upstream of a CpG cytosine in the artificial sequence we used was positioned at the active site of the distal DNMT3A2, and the base was not flipped out of the double helix to accommodate the catalytic cleft (Fig. 2e). We believe this is likely due to the rigid geometry of the structure, which precludes flipping unless the CpG is precisely aligned with the active site. This indicated that DNMT3 binding to nucleosome substrates does not require a correctly positioned CpG in the catalytic center.
The free end of the 10 bp linker DNA is positioned at the center of the distal DNMT3A catalytic domain, which could be the reason for the distinct enzyme-substrate association of DNMT3A seen in our structure. To test whether the structure is also compatible with a longer linker, we generated a model in which the DNA is extended by an additional six bp. The model shows that the longer DNA snugly fits in the groove of the catalytic domain when the ADD shifts to the active state position shown in the structure by Guo et al.9 (PDB: 4U7T) (Extended Data Fig. 7d,e). We further measured the binding strengths of the complex for NCPs containing differing lengths of linker DNAs (Extended Data Fig 3b). While NCPs with no linker DNA (147 bp total length) formed stable complexes, underlining the importance of the acidic patch interactions, longer linkers of 10, 12, 24, or 77 bp on each side of the NCP increased the binding only mildly. Importantly, the level of binding was not significantly changed by lengthening the linker by more than 10 bp, confirming that the region close to the NCP was most crucial for interaction.
Next, we used a technique developed in the Henikoff laboratory29 to map the binding of proteins to nucleosomes using limited micrococcal nuclease (MNase) digestion. NCPs with 77 bp of linker DNA on each side of the Widom 147 sequence were incubated with MNase in the presence or absence of the DNMT complex. The DNA products were sequenced to determine whether there were “shoulders” next to the NCP positioning sequence indicative of protection from digestion (Extended Data Fig. 8). The data clearly show strong increases in protection from nuclease digestion about 10 bp on either side of the NCP in the presence of the DNMT complex (Extended Data Fig. 8b). Importantly, sequence read clustering revealed that individual DNMT3A2/3B3 complexes are predominantly bound to one side of the nucleosome at a time (Extended Data Fig. 8b). These data strongly support the validity of the structure and the concept that the DNMT complex binds to DNA without a CpG positioned at the active site of the enzyme. Also, although the DNMT complex is predicted to bind to the acidic patch on either side of the NCP, it favors one side over the other by at least a factor of 2 and does not bind to both sides at once.
Structural support for chromatin remodelling
Nucleosomal DNA is overall enriched in CpG methylation, consistent with the function of nucleosomes in DNMT3 recruitment30. Yet CpG methylation and nucleosome occupancy are anticorrelated at positioned nucleosomes4,31, especially around the highly constitutively positioned nucleosomes at CTCF sites4. While most nucleosomes are not constitutively positioned, CpG methylation becomes globally enriched in inter-nucleosomal linker DNA upon genetic inactivation of the chromatin remodeler Lsh132. Together, this suggests that de novo methylation of nucleosomal DNA requires nucleosome movement or remodeling, and it may explain why active DNA replication33 or the presence of the nucleosomal remodeler Lsh132,34 is required for DNA methylation in mouse and human cells.
In summary, our structure and functional analyses have revealed an unexpected core nucleosome-targeting function for catalytically inactive DNMT3B3 that is important for DNA methylation on a genome-wide scale.
Methods
DNA cloning and protein expression
Xenopus laevis wildtype or mutant core histone coding sequences were cloned into a polycistronic expression plasmid derived from plasmid pET29a-YS14 (kind gift of Dr. Jung-Hyun Min, Washington State University) for high-yield histone octamer formation without denaturation/renaturation steps. The resulting plasmid contains two T7 promoter-driven cassettes: one for expression of a His6-Sumo-histone H3– and histone H4–encoding mRNA and one for a His6-Sumo-histone H2A– and histone H2B–encoding mRNA, with ribosome binding sites proceeding each coding sequence. The plasmid was transformed into E. coli BL21(DE3) pLysS cells. For large-scale (2 L) purification, one colony was inoculated into 100 mL of LB medium containing ampicillin (50 mg/mL) and chloramphenicol (25 mg/mL) and cultured overnight at 37 °C at 170 rpm. Subsequently, the culture was amplified into 2 L of LB medium and was grown for 2–3 h at 37 °C. Histone protein expression was induced at an OD600 of ~0.6 with 0.5 mM isopropyl β-D-1-thiogalactopyranoside (IPTG). The culture was further shaken at 170 rpm and 37 °C for another 4–5 h. Cells were harvested by centrifugation at 4,000 × g for 20 min at 4 °C. Cell pellets were processed immediately or stored at –80 °C for future purification.
Cell pellets were resuspended in 150 mL of histone lysis buffer (20 mM Tris-HCl pH 8.0, 2.0 M NaCl, 25 mM imidazole, 10% glycerol, 1 mM phenylmethanesulfonyl fluoride (PMSF), and 0.5 mM tris(2-carboxyethyl)phosphine [TCEP]). Resuspended cells were lysed in a high-pressure homogenizer (APV) and clarified by centrifugation at 38,700 × g at 4 °C for 1 h. The supernatant was collected and loaded onto a 5-mL HisTrap FF column (GE Healthcare) pre-equilibrated with histone Ni-buffer A (20 mM Tris-HCl pH 8.0, 2.0 M NaCl, 25 mM imidazole, 10% glycerol, and 0.5 mM TCEP) and washed with 10 column volumes (CVs) histone Ni-washing buffer (20 mM Tris-HCl pH 8.0, 2.0 M NaCl, 50 mM imidazole, 10% glycerol, and 0.5 mM TCEP). Bound proteins were eluted with histone Ni-elution buffer (20 mM Tris-HCl pH 8.0, 2.0 M NaCl, 250 mM imidazole, 10% glycerol, and 0.5 mM TCEP). His6-Sumo tags were cleaved by incubation with purified ULP1 Sumo protease at a 1:1000 ratio at 4 °C for about 4 h. Protein purity and cleavage completion were analyzed by SDS-PAGE (Extended Data Fig. 1a) and subsequently loaded onto a Superdex 200 16/600 column (GE Healthcare) pre-equilibrated with histone size-exclusion buffer (10 mM Tris-HCl pH 8.0, 2.0 M NaCl, 1 mM EDTA, and 0.5 mM TCEP) (Extended Data Fig. 1b). The histone octamer was eluted at a volume of 72 mL. The peak fractions were pooled and concentrated up to 18 mg/mL, and fresh-frozen in aliquots in the presence of 50% glycerol for long-term storage.
Since the PWWP domains of DNMT3’s interact with histone H3 K36me2/me3, we have also generated a histone octamer in which histone H3 was modified with a K36me3 analog following published procedures35,36. We introduced H3 C110A and K36C mutations by site-directed mutagenesis and co-expressed and purified histone octamer under the same conditions as wild-type octamer. The cysteine at K36C was alkylated in 1.0 M HEPES, pH 7.8, 10 mM D/L-methionine, and 4.0 M guanidinium chloride for 1 h at 37 °C. Then, 100 mg/mL (2-bromoethyl) trimethyl ammonium bromide was added and heated to 50 °C and mixed approximately every 30 min until completely dissolved. DTT (1.0 M, 10 μL/mL) was added and the reaction incubated for another 150 min. The reaction was stopped by adding 2-mercaptoethanol. Following dialysis and cleavage with ULP1 Sumo protease overnight, protein was further purified by Superdex 200 16/600 (GE Healthcare) size exclusion chromatography. Formation of the H3 K36me3 analog was validated by western blotting using antibody against H3K36Me3 (Abcam ab9050) (Extended Data Fig. 9a). However, NCPs assembled with the modified H3 did not bind DNMT3A2/3B3 more strongly than the unmodified NCP and did not improve EM data quality or changed the conformation of the complex (Extended Data Fig. 9b–d).
Nucleosome DNA template preparation
All nucleosomal DNA template designs are based on the 147 bp Widom 601 nucleosomal positioning sequence15 (5’CTGGAGAATCCCGGTGCCGAGGCCGCTCAATTGGTCGTAGACAGCTCTAGCACCGCTTAAACGCACGTACGCGCTGTCCCCCGCGTTTTAACCGCCAAGGGGATTACTCCCTAGTCTCCAGGCACGTGTCAGATATATACATCCTGT3’). We added a 10 bp extra-nucleosomal linker DNA (5’ATCGGCCGCC3’) at the entry and exit sites to generate the Widom 601–167 sequence for the cryo-EM study, and a 301-bp DNA template37 for the MNase footprinting study.
Twelve EcoRV-flanked copies of the Widom-167 insert were cloned into pUC19 vector and transformed into OmniMAX 2 T1R cells (Invitrogen). The cells were then grown overnight in 1 L of LB medium at 37 °C and harvested by centrifugation at 4,000 × g for 20 min. Cell pellets were resuspended in 20 mL of solution I (25 mM Tris-HCl, pH 8.0, 10 mM EDTA, 100 μg/mL RNase) and alkaline-lysed by adding an equal volume of solution II (0.2 M NaOH, 1% SDS). The solution was neutralized and the cell debris, chromosomal DNA, and protein was precipitated by addition of an equal volume of solution III (3 M potassium acetate, 2 M glacial acetic acid). After 0.5 h incubation on ice, the precipitate was pelleted by centrifugation at 38,700 × g at 4 °C for 0.5 h. The supernatant was filtered and loaded onto a 5-ml HiTrap Q column pre-equilibrated with Q-buffer A (20 mM Tris pH 5.0–6.0, 200 mM NaCl). RNA and unbound protein were washed out by 10 CVs of Q-washing buffer (20 mM Tris-HCl, pH 5.0–6.0, 600 mM NaCl). The plasmid was eluted by a linear NaCl gradient from 600 mM to 1 M over 5 CVs. Each fraction was analyzed by 1% (w/v) TAE agarose gel electrophoresis. DNA from plasmid-containing fractions was precipitated by addition of 2.5 volumes 100% cold ethanol, air-dried, and dissolved in 3 mL TE buffer (10 mM Tris-HCl pH 8.0, 1 mM EDTA). The inserts were excised with EcoRV overnight and complete digestion confirmed by 6% PAGE analysis. Excised fragments were separated from linearized plasmid by PEG precipitation as described38.
All other length DNA templates for cryo-EM study were generated and purified in the same way and all other biotinylated DNA templates for AlphaScreen assay were generated by PCR using the Widom 601–147 fragment as template and primers shown in Supplementary Table 1.
The complex with 10 bp linker DNA on each side of the Widom sequence yielded the best cryo-EM data.
Nucleosome reconstitution
Nucleosome reconstitution was performed essentially as described38,39 with some modifications. Briefly, the histone octamer and DNA template were mixed at a molar ratio of octamer:DNA of 1:1.1 in 2 M KCl on ice for 0.5 h and transferred to a 0.1 mL Slide-A-Lyzer™ MINI Dialysis device (Thermo Scientific). The dialysis unit was placed inside a dialysis bag containing 17 mL of nucleosome high salt buffer (10 mM Tris-HCl, pH 8.0, 2.0 M KCl, 1 mM EDTA, and 1 mM DTT) and then dialyzed overnight against nucleosome low salt buffer (10 mM Tris-HCl, pH 8.0, 50 mM KCl, 1 mM EDTA, and 1 mM DTT). The dialysis unit was removed from the dialysis bag and dialyzed for another 4 h against the nucleosome low salt buffer to complete nucleosome reconstitution. Reconstituted nucleosomes were recovered, analyzed by 6% PAGE (Extended Data Fig. 1c) and negative stain EM, and quantified based on the DNA content.
DNMT protein expression
DNAs encoding full-length human DNMT3A and DNMT3L were purchased from DNASU (HsCD00620811, HsCD00077165) and together with PCR-isolated DNMT3A2 (DNMT3A residues 224–912) were cloned into pFastBac (ThermoFisher). Human DNMT3B1 and DNMT3B3 coding sequences were cloned into a modified pFastBac vector for expression with an N-terminal 8×His tag followed by a super-folder green fluorescence protein (GFP) tag and a tobacco etch virus (TEV) protease cleavage site. Purified plasmids were transfected into DH10Bac cells to generate bacmid recombinant viral DNA. Bacmids were prepared from positive clones using blue/white selection and isopropanol precipitation. P0 and P1 virus were generated using the Bac-to-Bac system (ThermoFisher). 200 mL Sf9 insect cells grown in ESF-921 medium (Expression Systems) to 2×10⁶/mL were infected with 1 mL of each P1 virus and shaken at 110 rpm, 27 °C for 48 h for protein expression. Cells were harvested by centrifugation (500 g, 4 °C, 30 min) and processed immediately or stored at –80 °C for future purification.
The insect cell pellets were resuspended in 70 mL of DNMT Ni-buffer A (20 mM Tris-HCl pH 8.0, 300 mM NaCl, 25 mM imidazole, 50 μM ZnSO4, 10% glycerol, and 0.03% 2-mercaptoethanol supplemented with 1 mM PMSF and 1x EDTA-free protease inhibitor cocktail [Roche]), and then were lysed by Dounce homogenization. The lysate was centrifuged at 150,000 × g at 4 °C for 1 h. The supernatant was collected and loaded onto a 5-mL HisTrap FF column (GE Healthcare) pre-equilibrated with DNMT Ni-buffer A. The column was washed with 10 CVs of DNMT high salt buffer (20 mM Tris-HCl pH 8.0, 1000 mM NaCl, 50 mM imidazole, 50 μM ZnSO4, 10% glycerol, and 0.03% 2-mercaptoethanol) followed by 5 CVs of DNMT low salt buffer (20 mM Tris-HCl pH 8.0, 300 mM NaCl, 50 mM Imidazole, 50 μM ZnSO4, 10% glycerol, and 0.03% 2-mercaptoethanol). The bound proteins were eluted with DNMT elution buffer (20 mM Tris-HCl pH 8.0, 300 mM NaCl, 250 mM imidazole, 50 μM ZnSO4, 10% glycerol, and 0.03% 2-mercaptoethanol). Eluted protein was verified by 12.5% SDS-PAGE (Extended Data Fig. 1e * lane) and loaded onto a HiLoad 16/600 Superdex 200 pg column pre-equilibrated with DNMT size exclusion buffer (20 mM HEPES pH 8.0, 300 mM NaCl, 50 μM ZnSO4, 10% glycerol, and 3 mM DTT (Extended Data Fig. 1d, blue) or digested with purified TEV protease at a 1:500 ratio overnight at 4 °C. The digestion was confirmed by SDS-PAGE (Extended Data Fig. 1e, & lane). The TEV-digested DNMT complex was then loaded onto a HiLoad 16/600 Superdex 200 pg column pre-equilibrated with DNMT size-exclusion buffer (Extended Data Fig. 1d, red). The purified DNMT complex peak fractions were collected and concentrated up to 15 mg/mL and frozen in aliquots for long-term storage.
Different DNMT isoform complexes (DNMT3A1/3L, DNMT3A1/3B3, DNMT3A2/3L, DNMT3A2/3B3, DNMT3B1/3L, DNMT3B1/3B3) were screened for expression and stability, which identified the DNMT3A2/DNMT3B3 as the best-behaved complex.
Site-directed mutagenesis
All site-directed mutagenesis was carried out using the QuikChange method (Agilent). All constructs were confirmed by DNA sequencing.
DNMT-nucleosome binding assay
In vitro interactions between biotinylated nucleosomes and His-GFP tagged DNMT proteins were assessed by luminescence proximity AlphaScreen assay (PerkinElmer) as described40. Briefly, 100 nM biotinylated nucleosomes and 100 nM His-tagged proteins were incubated with 5 μg/mL streptavidin-coated donor beads and 5 μg/mL nickel-chelated acceptor beads (PerkinElmer) in 100 μL total volume of AlphaScreen buffer (50 mM MOPS, pH7.4, 50 mM NaF, 50 mM CHAPS, and 0.1 mg/ml BSA) for 1.5 h in the dark at room temperature. Photon counts were determined in 384 plates using an Envision-Alpha Reader (PerkinElmer) (Extended Data Fig. 2a). Each experiment was repeated at least four times. Data were validated for normality by Shapiro-Wilk and Kolmogorov-Smirnov tests and analyzed by one-way ANOVA using GraphPad Prism.
Electrophoretic mobility shift assays
Purified DNMTs were incubated with 1 μM Widom 601–167 nucleosomes for 30 min on ice in binding buffer (20 mM HEPES pH7.4, 30 mM NaCl, 5% glycerol, 1 mM MgCl2, 1 mM DTT, and 0.1% bovine serum albumin (BSA), supplemented with 100 μM S-adenosyl-L-methionine [SAM]). Final concentrations of DNMTs were as indicated in Extended Data Fig. 2b. Equilibrated samples were analyzed by 6% native PAGE in 1x TAE buffer.
Cell culture
DKO8, an HCT116 derivative cell line with genetic disruption of DNMT1 and DNMT3B, was obtained from Dr. Stephen Baylin’s laboratory (Johns Hopkins University) and cultured in McCoy’s 5A medium (Gibco) containing 10% fetal bovine serum (FBS) and 1% penicillin/streptomycin. HEK293T cells were obtained from the American Type Culture Collection and cultured in Dulbecco modified Eagle medium (Gibco) supplemented with 10% FBS and 1% penicillin/streptomycin. All cells were maintained in a 37°C incubator with 5% CO2 and verified to be free of Mycoplasma contamination.
Lentivirus generation and infection
Human DNMT3B isoform 3B3 and its mutants were cloned with N-terminal MYC-tag into pLJM1 lentiviral vector following the manufacturer’s protocol. The production of lentivirus and cell infection was performed as previously described6. Briefly, the lentiviral plasmid and packaging plasmids pMD2.G and psPAX2 (Addgene plasmid #12259 and #12260) were transfected into HEK-293T cells with transfection reagent (Lipofectamine LTX, Thermo Fisher Scientific) and OPTI-MEM media (Invitrogen). The lentiviruses were harvested twice at day 3 and day 5. Viruses were passed through 0.45 μm filters and stored at –80 °C. The lentiviral infection of DKO8 cells was performed in culture media with 8 μg/mL polybrene (Sigma H9268). Forty-eight hours after infection, cells were selected with 2 μg/mL puromycin until harvesting.
Chromatin association assay
DKO8 cells carrying DNMT3B3 and mutant constructs were harvested at 14 d after infection. Chromatin and associated proteins were fractionated as previously described41,42. Briefly, the cells were trypsinized and washed with phosphate-buffered saline. The cells were then resuspended in ice-cold RSB buffer (10 mM Tris-HCl pH 7.4, 10 mM NaCl, 3 mM MgCl2, 0.34 M sucrose, and 1X protease inhibitor cocktail [Roche]), and then lysed in the presence of 0.3% NP-40 on ice. The nuclei were separated from the supernatant after microcentrifugation and washed with 0.3 M NaCl buffer (10 mM Tris-HCl pH 7.4, 300 mM NaCl, 1 mM EDTA, 0.34 M sucrose, and 1X protease inhibitor cocktail [Roche]). Chromatin and associated proteins were harvested as pellets after microcentrifugation and the supernatants during all the steps were collected as soluble fractions. All samples were dissolved in SDS-loading buffer and subjected to western blotting.
Western blot analyses
Protein concentration was measured using Pierce BCA Protein Assay Kit (Thermo Fisher Scientific). 4 μg protein from each sample was resolved on a 4–15% gradient SDS-PAGE gel (BioRad) and transferred to polyvinylidene difluoride membrane (BioRad). Blots were blocked with 5% milk in TBST (120 mM Tris-HCl pH 7.4, 150 mM NaCl, and 0.05% Tween 20) and incubated overnight at 4 °C with antibodies against the MYC-epitope tag (Millipore, 05–724), DNMT3A (Novusbio, NB120–13888), β-actin (Sigma, A2228), β-tubulin (Cell Signaling Technology, CST86298), and histone H3 (Abcam, ab12079). The membranes were then washed 3 times with TBST and incubated with an HRP-conjugated secondary antibody. Proteins were visualized using ECL western blotting detection reagent (Thermo Scientific) and ChemiDoc system (BioRad).
Illumina Infinium methylation EPIC array and data analysis
Genomic DNA of DKO8 cells was extracted at 56 d after infection with lentivirus carrying DNMT3B3 and mutant constructs. DNA methylation was assessed using Illumina Infinium HumanMethylationEPIC BeadChip array and was performed by the VAI Genomics core according to the manufacturer’s specifications. Quality control, preprocessing and normalization process were performed using R package SeSAMe on Bioconductor43, and the methylation status of individual CpG site was reported as a β-value, ranging from 0 (unmethylated) to 1 (fully methylated). Changes of 0.2 (20%) β-value compared to mock control (empty vector) were considered target sites for DNMT3B3 and mutants. Statistical enrichment was performed using a z-test comparing the targeted CpG sites for DNMT3B3 and mutants to the overall distribution of probes in the EPIC array43.
MNase footprinting assay
DNMT3A2/3B3 (2 pmol) was bound to 2 pmol NCP301 by 5-min incubation at 37 °C in 100 μL binding buffer (20 mM HEPES pH7.4, 50 mM NaCl, 5% glycerol, 1 mM MgCl2, 1 μM ZnSO4, 1 mM DTT, and 0.1% BSA). NCP301 alone or the NCP301/DNMT complex were crosslinked by 10-min incubation with 0.1% formaldehyde at room temperature. Reactions were terminated by addition of 12.5 mM glycine, followed by buffer exchange using Zeba spin desalting columns (7 kDa MWCO, Thermo Scientific). The cross-linked sample was then incubated with 0.1 unit of micrococcal nuclease (MNase; Worthington Biochemical Corporation) in 50 mM Tris-HCl pH 7.9, 5% glycerol, and 5 mM CaCl2 at 37 °C for 5 min. Protein was removed with proteinase K and the DNA was purified by phenol/chloroform extraction and analyzed by next generation sequencing (Genewiz Amplicon-EZ service). Sequencing data were analyzed using Burrows-Wheeler Aligner and SAMtools and alignments were generated by Integrative Genomics Viewer.
DNA methylation assay and bisulfite sequencing
DNMT activity was assessed by the incorporation of methyl groups from SAM into 301 bp DNA. DNA (50 nM) was methylated in the presence of 500 nM purified DNMT in binding buffer. The reactions were incubated at 37 °C for 3.5 h. The DNA was immobilized on Agencourt AMPure XP Beads (Beckman Coulter), washed two times with 80% ethanol, eluted with water and subjected to bisulfite sequencing. DNA (100 ng) was bisulfite converted using the EZ DNA Methylation Kit (Zymo Research) according to the manufacturer’s instructions. Bisulfite converted DNA was then amplified by PCR using the following primers: forward, 5’-GATAGATAGTTGTTGAATTAATGGGATT-3’, and reverse, 5’-CTTCATCTTACCAACCAATTAAACAA-3’. PCR conditions were as follows: 95 °C for 3 min, followed by 15 cycles of 95 °C for 10 s, 60 °C for 30 s and 72 °C for 1 min. A final incubation was done at 72 °C for 5 min. PCR products were then send for next generation sequencing (Genewiz) using Amplicon-EZ service. Sequencing data were analyzed using BISCUIT software (https://huishenlab.github.io/biscuit/).
Gradient Fixation (GraFix)
For cryo-EM studies, 1.5 μM DNMTs were incubated with 1 μM NCP for 30 min on ice in GraFix buffer (20 mM HEPES pH 8.0, 30 mM NaCl, 1 mM MgCl2, 1 mM DTT) supplemented with 100 μM S-adenosyl homocysteine (SAH) and then loaded onto a 12-mL linear 10%−25% (v/v) glycerol gradient in GraFix buffer supplemented with 0%−0.15% EM-grade glutaraldehyde44,45. Glutaraldehyde crosslinking was essential for maintaining the integrity of the DNMT-NCP complex. After centrifugation at 4 °C for 17 h at 40,000 rpm in an SW41 rotor (Beckman Coulter), the sample was fractionated from the bottom to top using an ÄKTA start chromatography system (GE Healthcare Life Sciences). Peak fractions were analyzed by SDS-PAGE and protein complex-containing fractions were pooled and loaded onto a PD-10 desalting column (GE Healthcare Life Sciences) pre-equilibrated with GraFix buffer to remove the glycerol and concentrated to approximately 0.2 mg/mL.
Sample preparation and cryo-EM data collection
A droplet (about 3.0 μL) of GraFix-treated DNMT-NCP complex at a concentration of about 0.2 mg/mL was applied to a glow-discharged holey carbon grid (Quantifoil R1.2/1.3, Au 300 mesh), and subsequently blotted for 3 s and vitrified by plunging into liquid ethane with a Vitrobot Mark IV (FEI Company) operated at 8 °C and 100% humidity. Each grid was first screened using a Talos Arctica transmission electron microscope (TEM) at 200 keV. Cryo-EM data were collected on a Titan Krios TEM operated at 300 keV and equipped with a K2 summit direct detector (Gatan) positioned post a GIF quantum energy filter, with a slit width of 20 eV. Automated data acquisition was carried out using Serial EM46 in super-resolution mode at a magnified pixel size of 0.5145 Å, with defocus values ranging from −1.0 to −2.5 μm. The total exposure time was set to 8 s with 40 frames, resulting in an accumulated dose of about 65 e– per Å2. A total of 12,410 image stacks were collected.
Image processing and model building
Movie stacks were corrected for drift and beam-induced motion by MotionCor247 with 2× binning (1.029 Å/pixel), which generated drift-corrected summed images with and without electron-dose weighting. Each micrograph was manually inspected to remove images that contained contaminated crystalline ice, other forms of visible contamination, or that were taken from broken holes. CTF parameters were estimated by CTFFIND448 using non-dose-weighted images. After sorting, micrographs with estimated maximum resolution beyond 5 Å were discarded, and good motion-corrected sums with dose-weighting were used for all other image processing in RELION 3.049 and cryoSPARC50. Global and local resolution estimates were calculated in RELION using the gold-standard Fourier shell correlation (FSC = 0.143) criterion51. The whole dataset was divided into 5 sub-datasets to perform auto picking and particle extraction. Particles extracted from each sub-dataset were four-fold downscaled and subjected to reference-free 2D classification. Uninterpretable, sparsely populated, or poorly defined classes were discarded leaving behind approximately 1,118,420 particles. The selected particles were re-centered and re-extracted for further 3D processing. The initial model was generated in cryoSPARC (Extended Data Fig. 5). The same particles were 3D classified with 10 classes in RELION 3.0 with 60 Å low pass filter of the initial model. Four good classes (about 63%) were selected for another round of 3D classification. A final set of 599,344 homogeneous DNMT-NCP complex particles was selected to perform a final 3D refinement in RELION (Extended Data Fig. 5). The final model was refined to an overall resolution of 2.94 Å (Extended Data Figs. 4–7). The map was sharpened with a B-factor of −91 Å2. Local resolution estimates were determined by ResMap software52 (Extended Data Fig. 4a and 4c). For the DNMT and nucleosome focused refinement, the nucleosome signal or the DNMT signal were subtracted from the 599,344 homogeneous DNMT-NCP complex particles to generate DNMT signal particles and nucleosome signal particles (Extended Data Fig. 6).
Model building and refinement
We used the combined map densities from focused refinements based on consensus refinement model to have better density for DNMT3A/3B catalytic domains. Due to a wide range of resolution limits for the various DNMT regions, we combined homologous structure modeling, and rigid docking of components with known structures to generate a near-atomic model. Briefly, the 1.9 Å X-ray structure of the nucleosome containing 147 bp DNA template (PDB code: 1KX5) was fitted into the nucleosome density map using CHIMERA53. The DNA fragment was replaced by that of a mono nucleosome from the H1-bound 6-nucleosome array (PDB code: 6HKT) with manually mutated linker region nucleotides. Both directions of the DNA were analyzed and the better fitting one was used for further refinement. The crystal structure of the DNMT3A2-ADD-CD domain dimer (PDB code 4U7P) was fitted into the catalytic center density map by CHIMERA. The DNMT3B3 model was generated by online homology model building tool54. All models were docked into the EM density map, followed by iterative manual adjustment in COOT55, and real space refinement using Phenix programs56. The model statistics were validated using the comprehensive validation program Molprobity in PHENIX program packege56. Structural figures were prepared in Chimera and PyMOL (https://pymol.org/2/). The final refinement statistics are provided in Extended Data Table 1. The extent of any model overfitting during refinement was measured by refining the final model against one of the half-maps and by comparing the resulting map versus model FSC curves with the two half-maps and the full model.
Extended Data
Extended Data Fig. 1. Protein expression and nucleosome reconstitution.
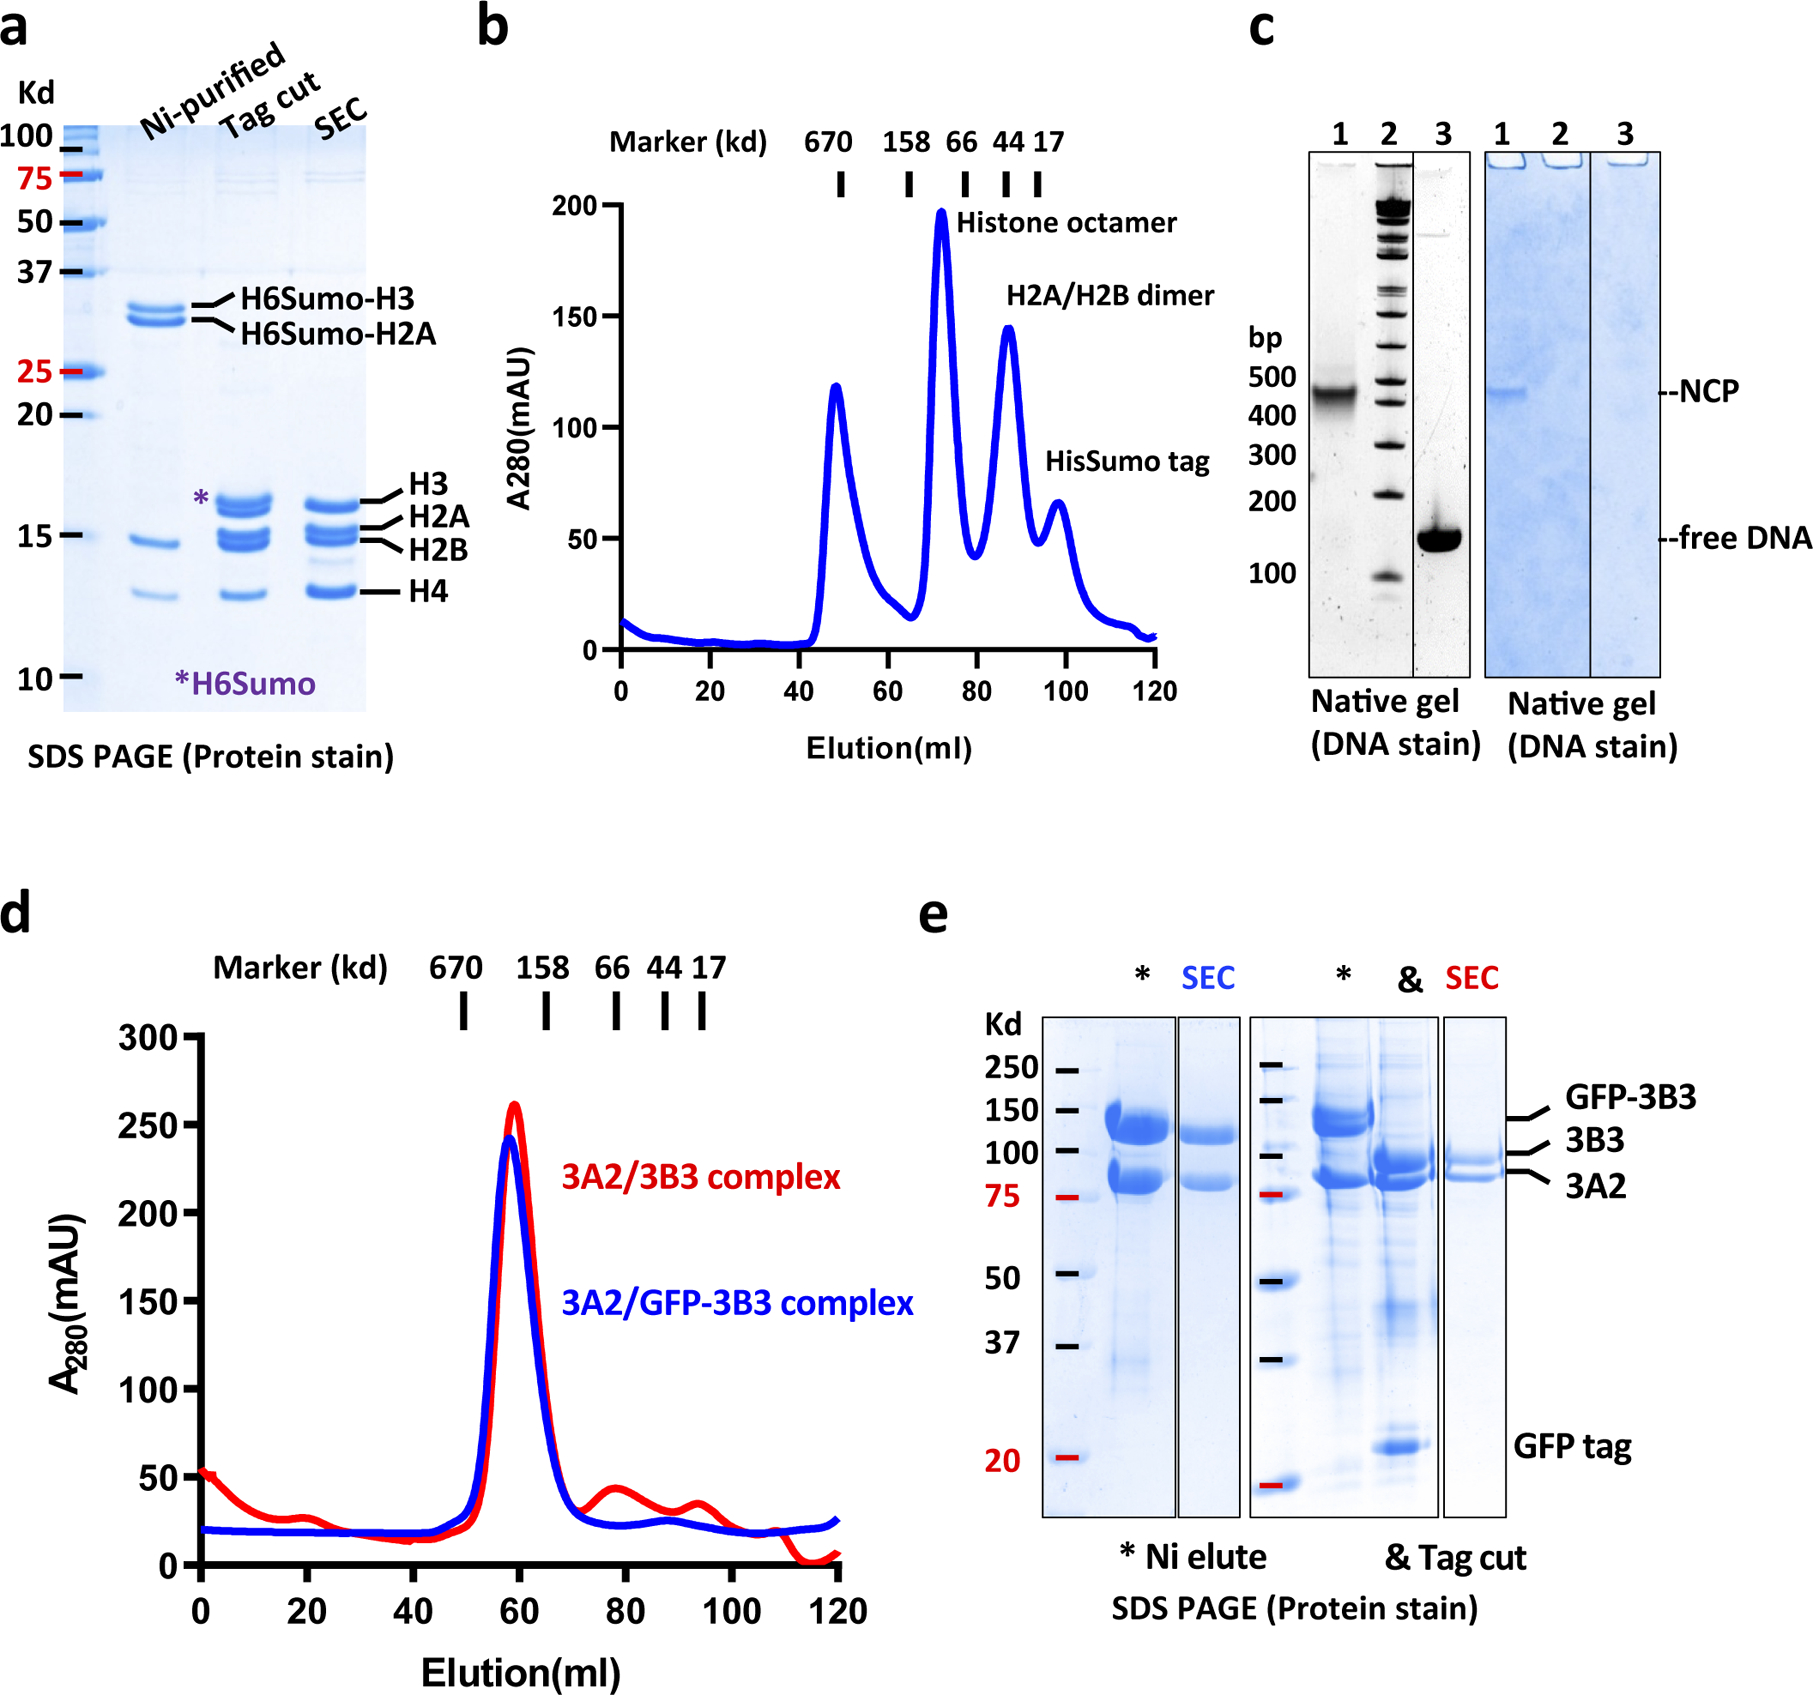
a, Histone octamer expression and purification. Histones H3, H4, and His6Sumo-tagged H2A and H3 were coexpressed from a polycistronic expression vector. The octamer was first purified by native Ni-affinity chromatography and cleavage of the His6-Sumo tags with ULP1 Sumo protease followed by size exclusion chromatography (SEC). The SDS PAGE gel shows analysis of histone octamer purification steps. b, SEC profile of histone octamer with indicated size standards. c, Native gel analysis of NCP reconstitution. NCPs reconstituted by double dialysis were separated by native gel electrophoresis (lane 1) together with a size standard (lane 2) and free nucleosomal DNA (lane 3). The gel was stained for both DNA (left) and protein (right). d, SEC profile of cleaved (red) and non-cleaved (blue) DNMT3 complex. e, SDS PAGE analysis of GFP tagged DNMT and untagged DNMT purification steps. The GFP tag allowed easy DNMT3B3 visualization in DNMT/NCP complexes. For gel source data, see Supplementary Figure S3.
Extended Data Fig. 2. DNMT3A2, DNMT3B3, and NCP form a stable complex.
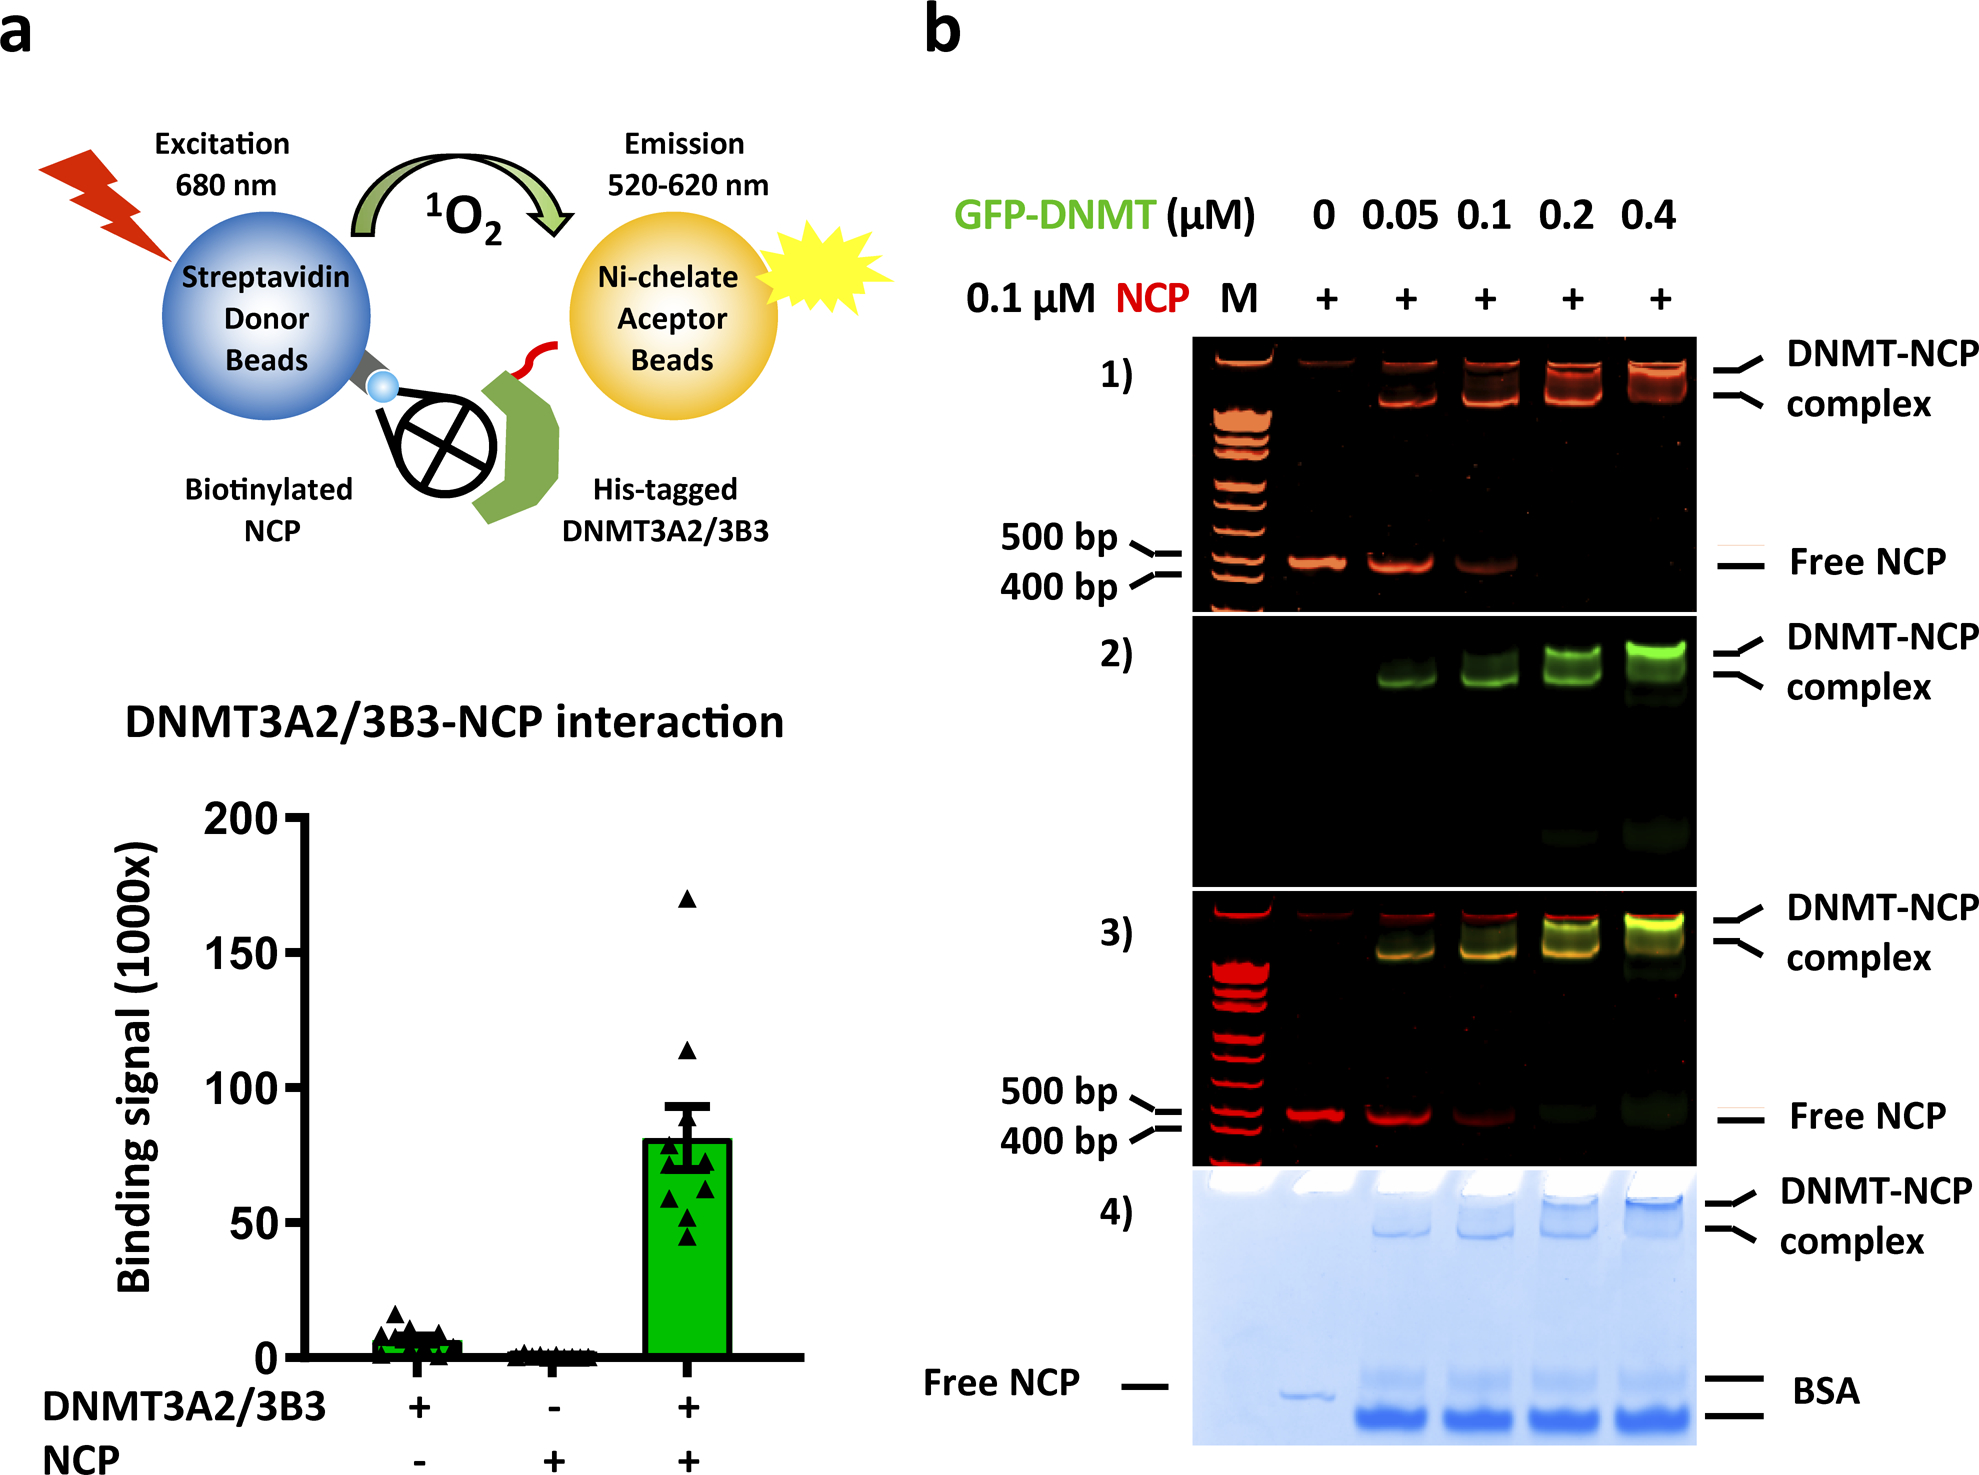
a, DNMT3 and NCP stably interact in an AlphaScreen luminescence proximity assay. Top panel, cartoon of AlphaScreen assay; bottom panel, AlphaScreen interaction data. The nucleosomal DNA of the NCP is biotinylated for immobilization on AlphaScreen streptavidin donor beads, and DNMT3B3 is His8-GFP-tagged for immobilization of Ni-chelating AlphaScreen acceptor beads. Donor beads contain a photosensitizer that upon activation at 680 nm converts ambient oxygen to singlet oxygen. If donor and acceptor beads are brought into close proximity by DNMT/NCP interaction, energy is transferred from singlet oxygen to thioxene derivatives in the acceptor beads resulting in light emission at 520–620 nm. Data are mean ± sem, n = 10. b, Increasing concentrations of GFP-tagged DNMT3A2/DNMT3B3 complex supershift the NCP band. M = DNA size marker. Panels 1–4: Native gel with indicated binding reactions in 1) the ethidium bromide channel to visualize the DNA of the NCP; 2) the fluorescence channel to visualize the GFP-tagged DNMT3A2/DNMT3B3 complex; 3) Merged image of the two channels (yellow bands indicates presence of both DNMT complex and NCP; and 4) stained with Coomassie Blue. For gel source data, see Supplementary Figure S4.
Extended Data Fig. 3. DNMT3A2/DNMT3B3 methylation activity and nucleosome interaction.
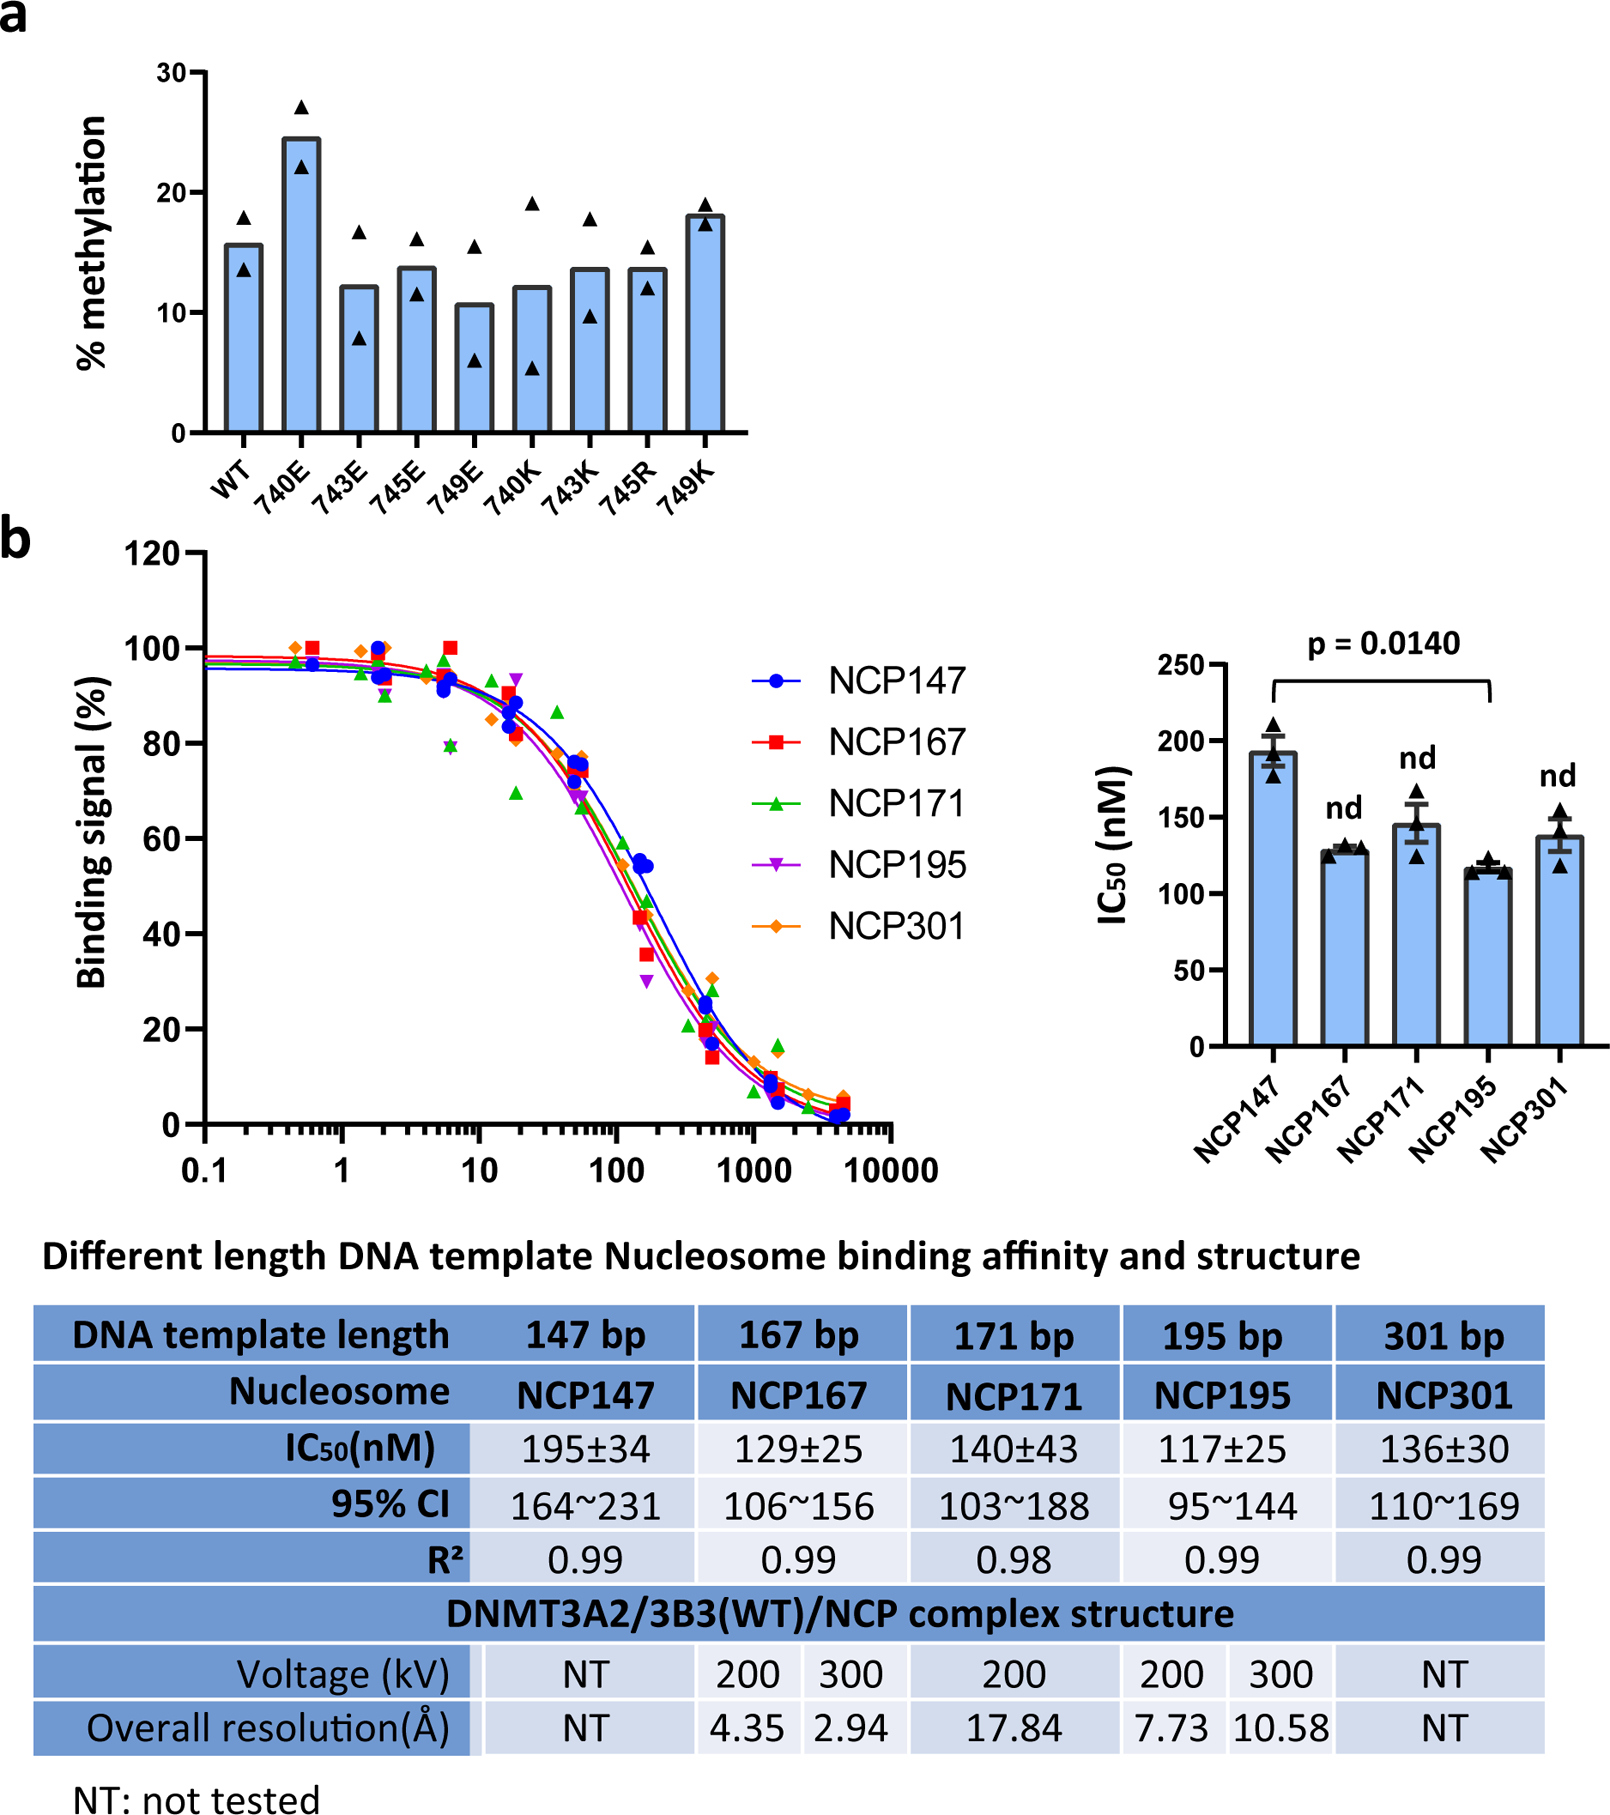
a, Free DNA methylation activity of acidic patch-interacting and control mutant DNMT3B3 proteins. Histone-free (naked) 301 bp nucleosomal DNA was incubated with the indicated DNMT3A2/3B3 complexes containing wildtype or mutant DNMT3B3. Shown is the percentage methylenation. Data are mean with individual values, n = 2. The total number of CpGs in the DNA is 24, of which a subset was preferentially methylated. b, Binding strength and structure resolution of DNMT3A2/3B3/NCP complexes with varying linker DNA lengths. Left: Competition binding curves. AlphaScreen interaction between biotin-NCPs and His6-tagged DNMT3A2/3B3 in the presence of increasing concentrations of untagged DNMT3A2/3B3. Data were generated from 3 independent experiments (n=3) and normalized in each group with highest data point as 100%. Right: IC50 calculated in each experiment and represented in bar graphs. Data are mean ± sem, n = 3, P values determined by non-parametric test with Dunn’s multiple comparisons test. The table below compares binding strengths (IC50) and cryo-EM resolution of DNMT3A2/3B3 complexes with NCPs containing different length DNAs. The 200-kV data were collected on a Talos Arctica microscope with a Falcon 3 detector, and 300 kV data on a Titan Krios microscope with a K2 detector.
Extended Data Fig. 4. Overall structure of DNMT bound to the nucleosome.
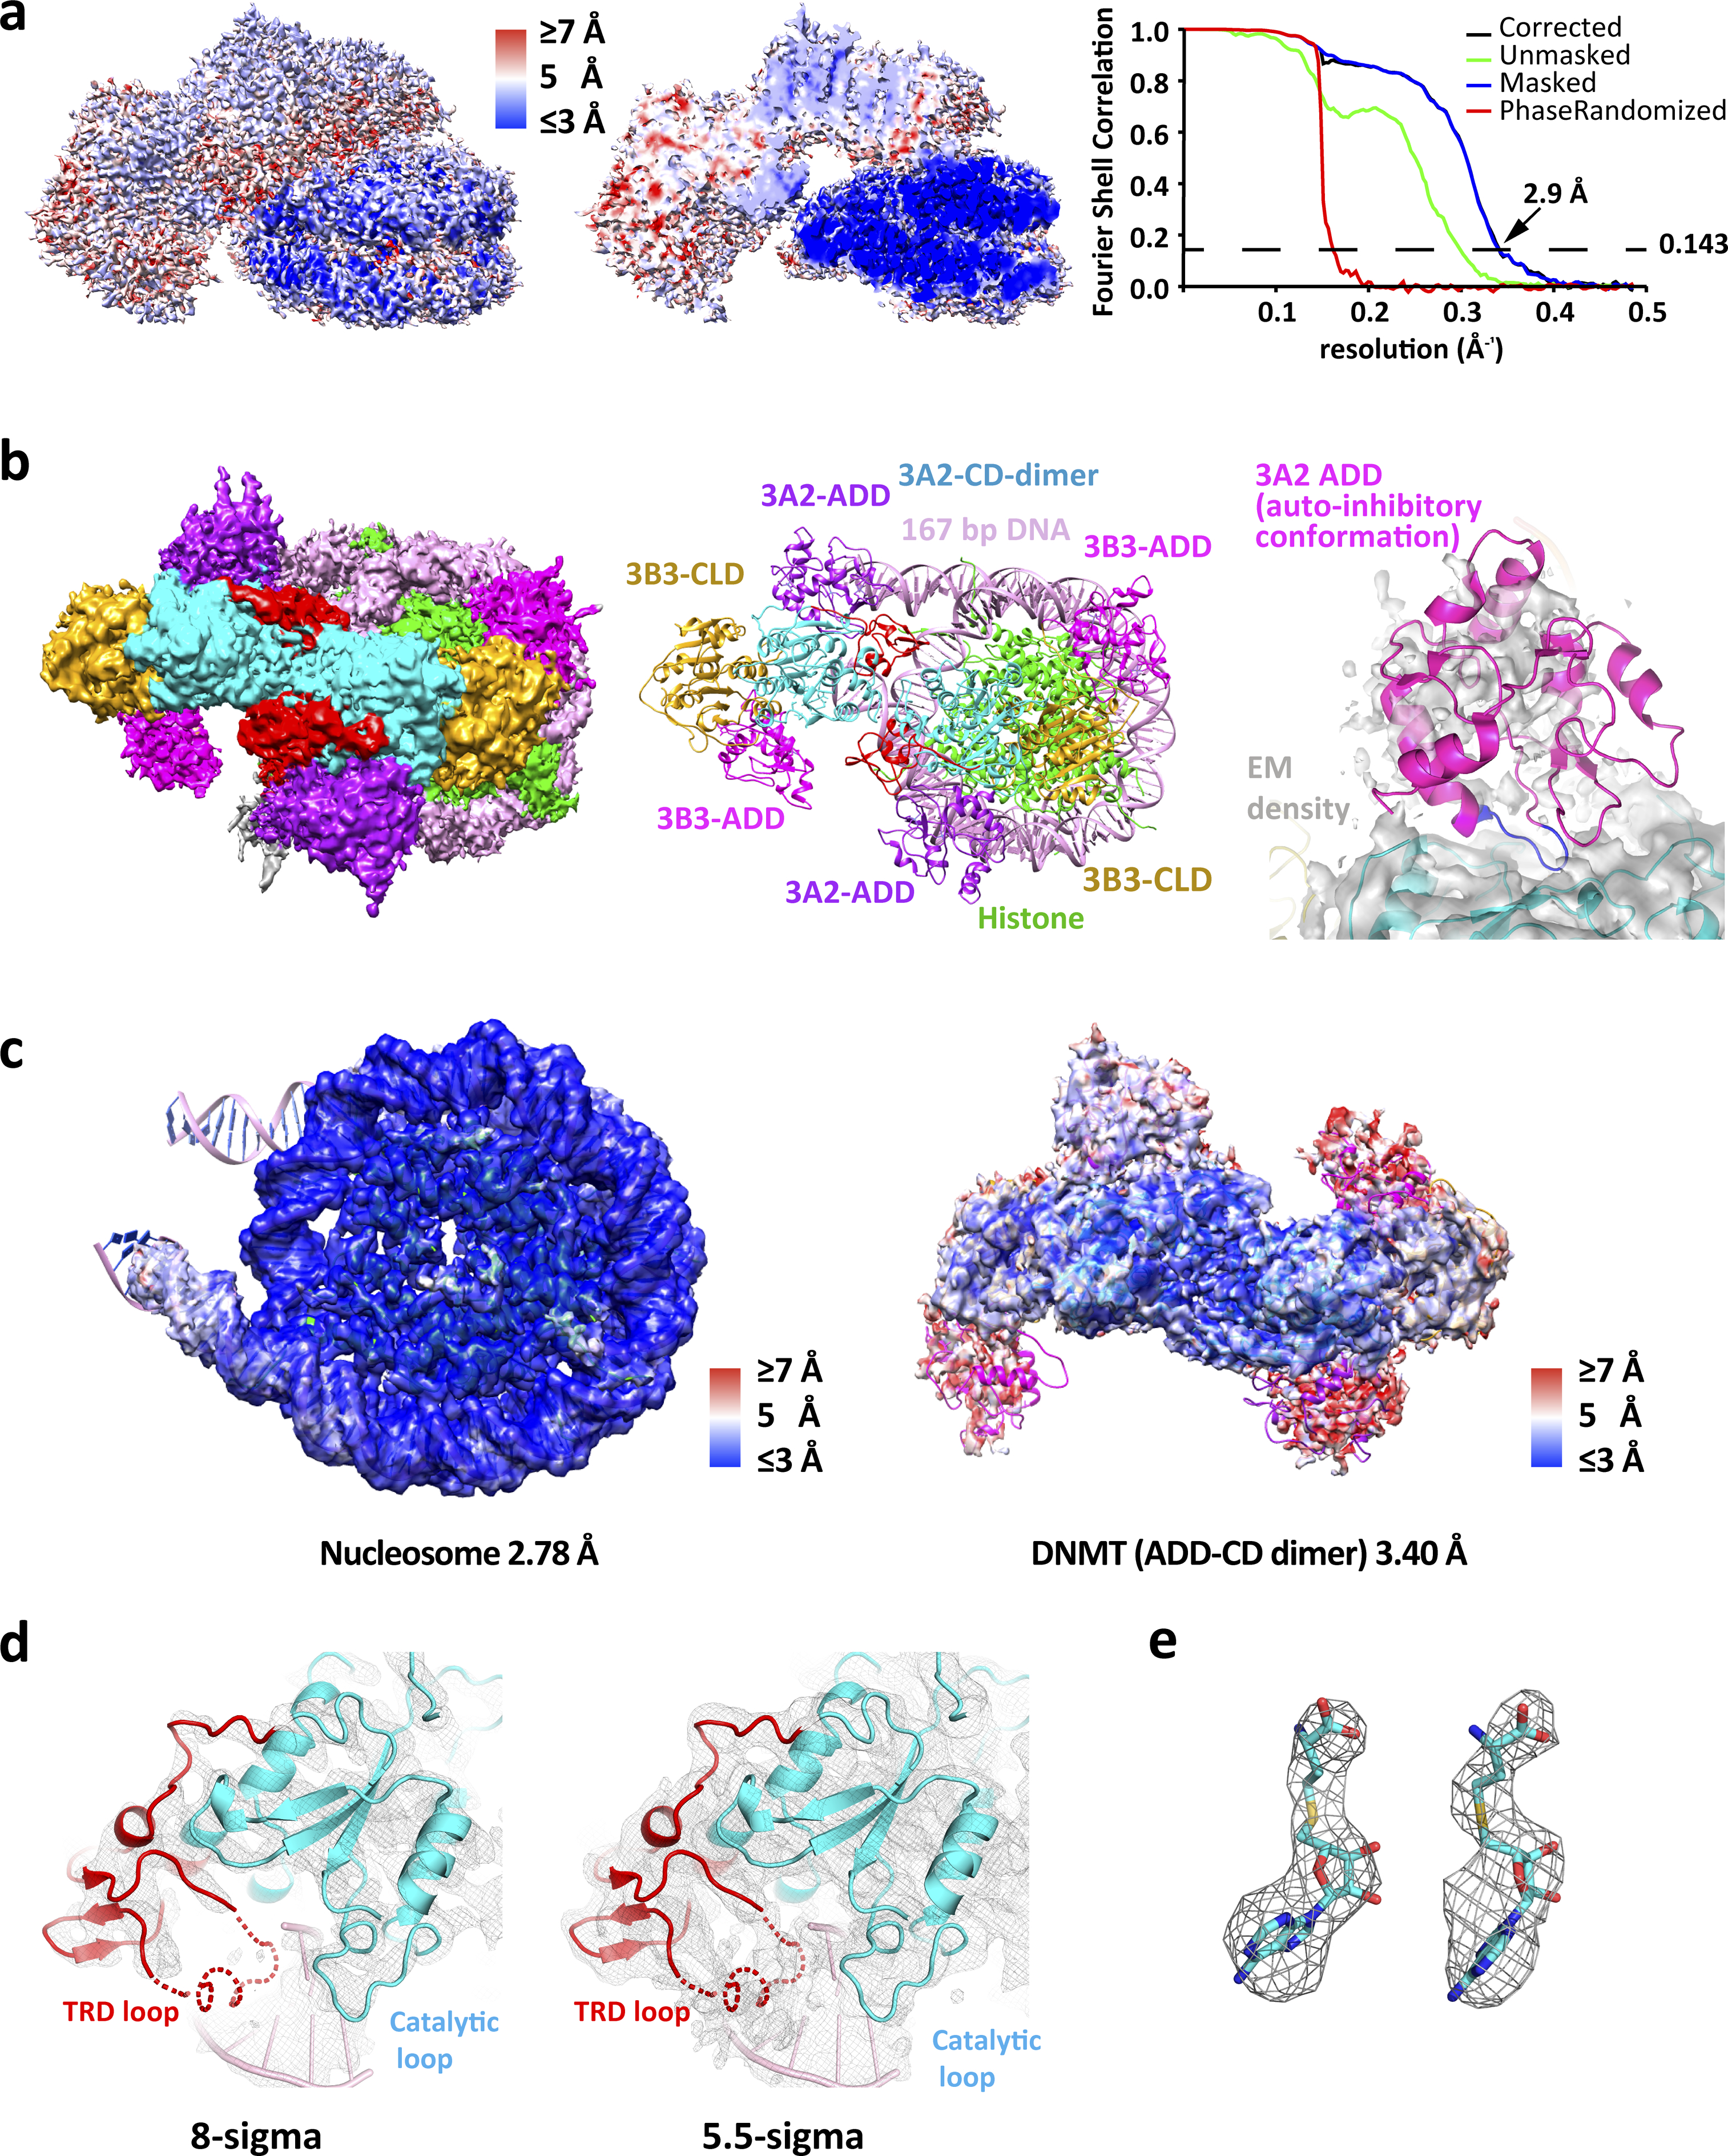
a, Local resolution map of DNMT-nucleosome core complex (global resolution of 2.94 Å) (left) and cut away view (middle). Corrected Fourier shell correlation (FSC) curves of the 3D reconstruction (right). b, Overview of DNMT-nucleosome complex with ADD domains (left) and cartoon representation (middle). Overlay of distal ADD EM density with aligned ADD in the auto-inhibitory conformation from PDB 4U7P. The inhibitory ADD loop 526–533 is highlighted in blue (right). c, Overall map fitting of the nucleosome, DNMT ADD-CD/CLD dimer and DNMT CD/CLD dimer with local resolution color code. The resolutions were determined using the 0.143 FSC criterion. d, Density map of the CD-DNA interaction region generated in PyMOL and contoured at 8 σ (left) and 5.5 σ (right). The dashed line indicates the position of the TRD loop that is only visible at the lower σ level and that we have omitted in the final model. e, Density maps of the two SAH ligands generated in PyMOL and contoured at 8 σ.
Extended Data Fig. 5. Cryo-EM 3D reconstruction and refinement.
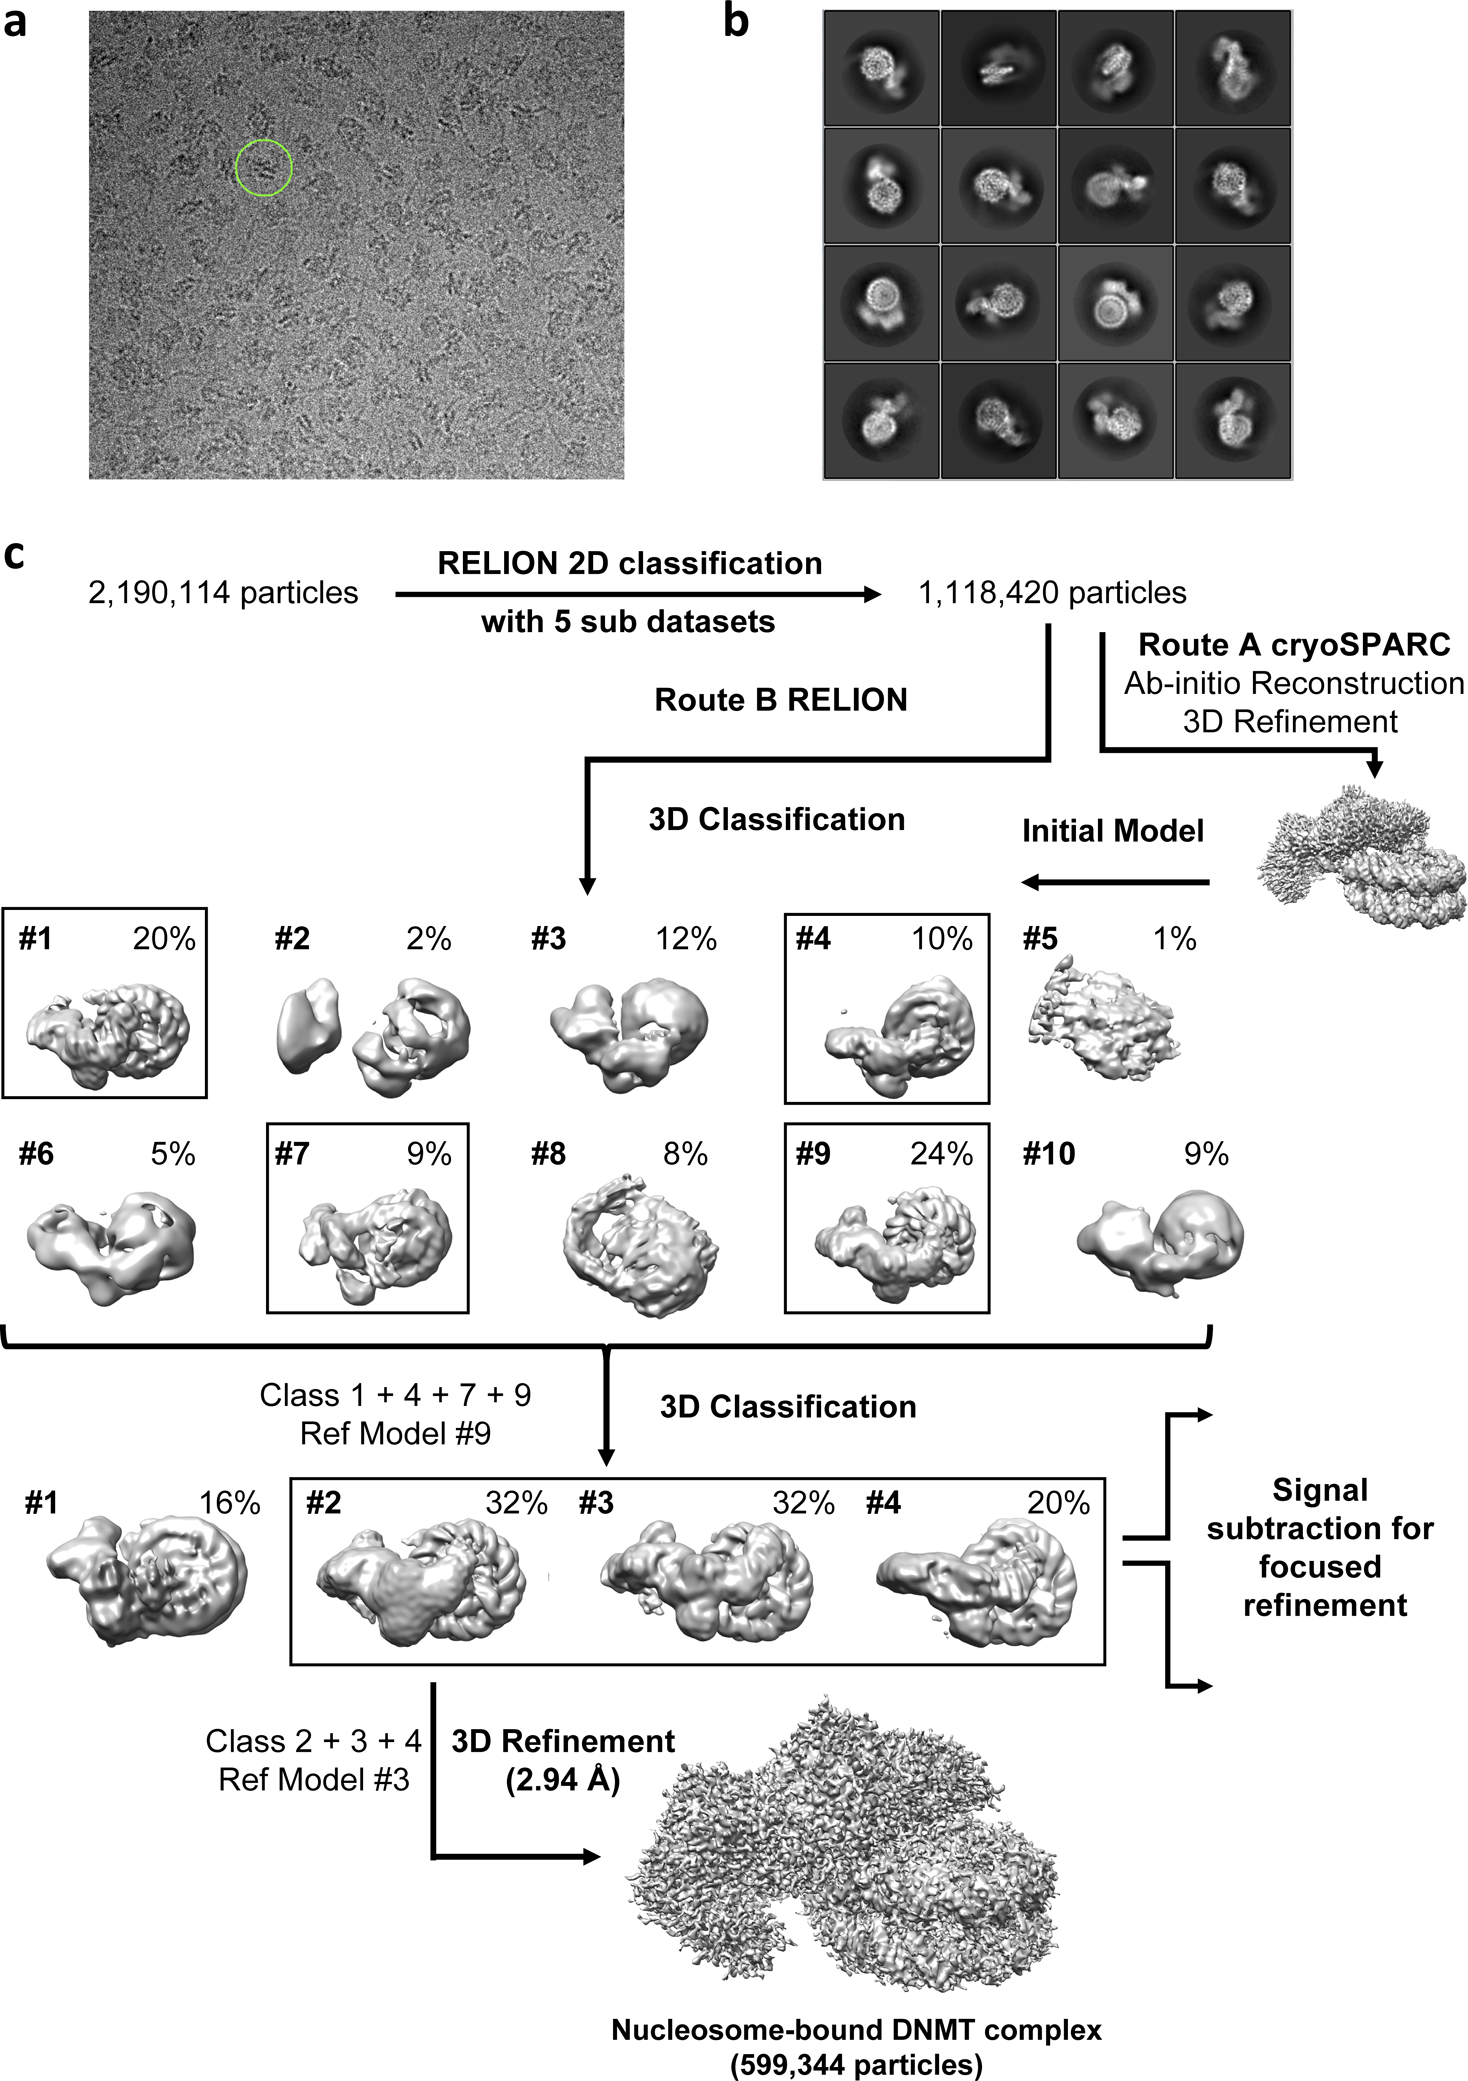
a, Representative micrographs with one particle highlighted in a green circle of 250 Å diameter. b, Representative 2D class-averages. c, Cryo-electron microscopy data processing workflow by cryoSPARC and RELION3.0. Boxed 3D classes were selected for further processing. The final global nominal resolution for the DNMT-NCP complex was 2.94 Å.
Extended Data Fig. 6. Focused refinement of DNMT and NCP.
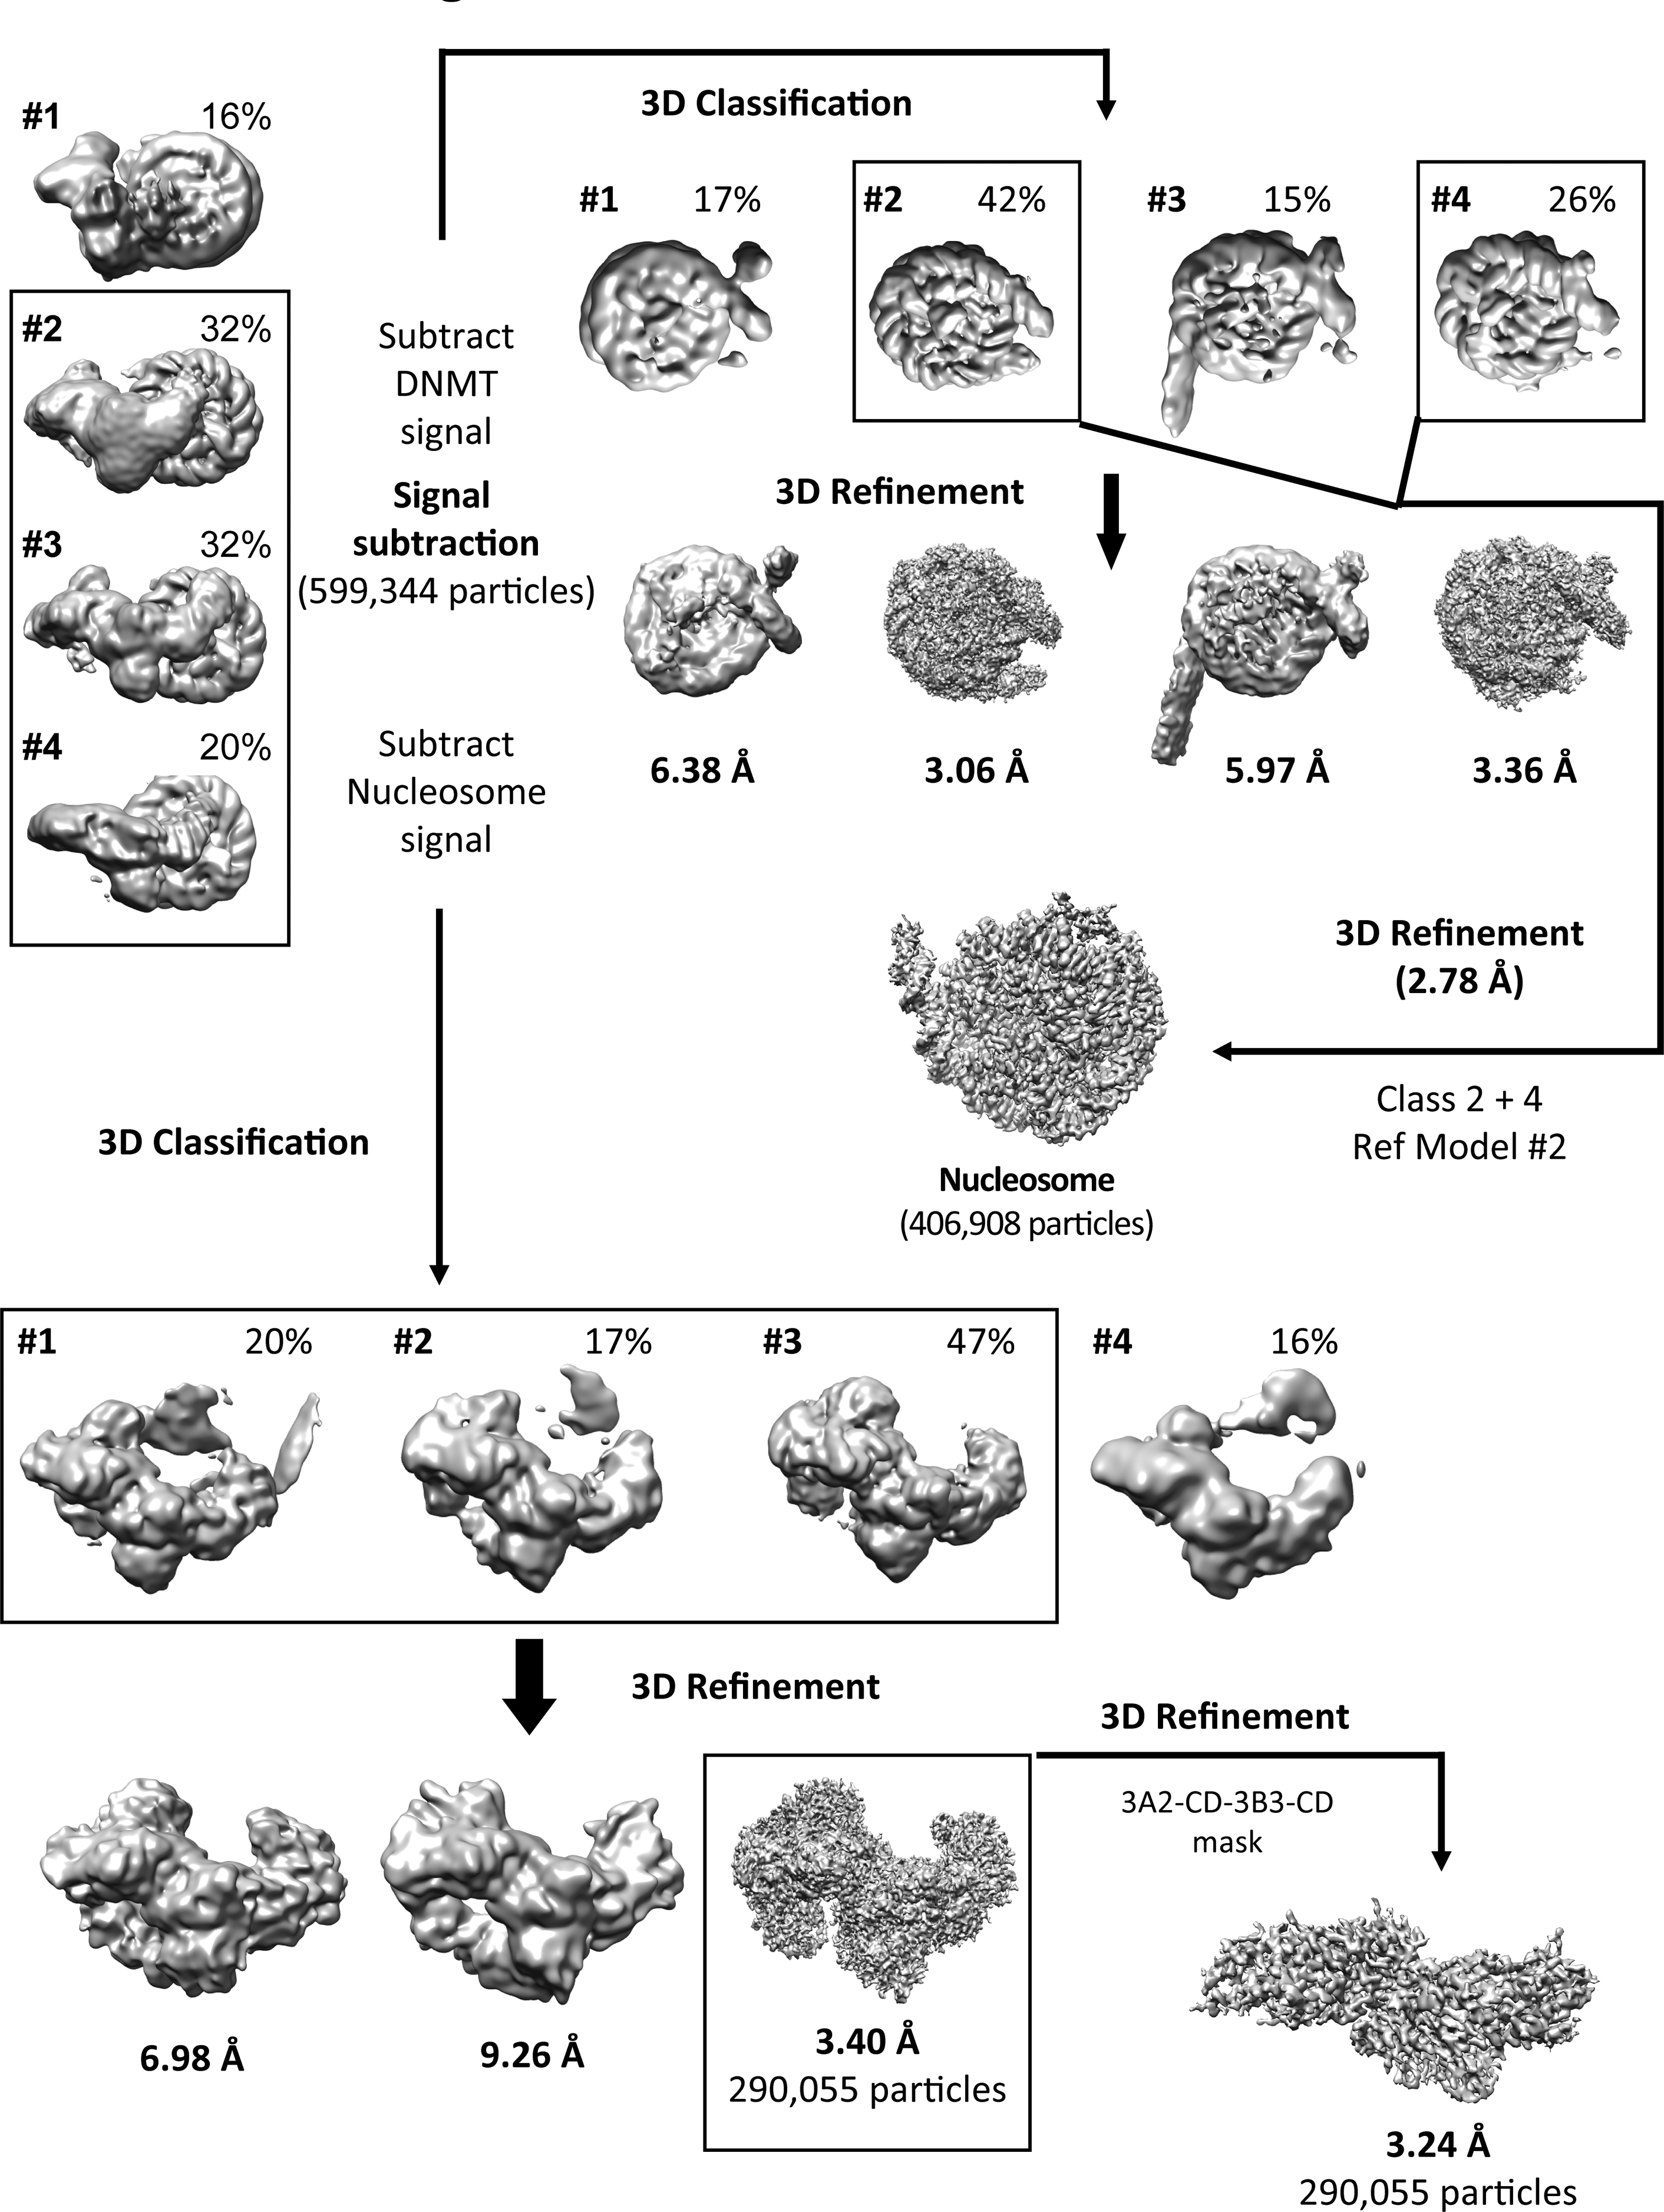
About 559,000 good particles were selected from 3D reconstructions for further focused refinement. The final resolution for the DNMT3A2/3B3 complex including the ADD domains was 3.40 Å, for the DNMT3A2 CD/DNMT3B3 CLD complex was 3.24 Å, and for the NCP was 2.78 Å.
Extended Data Fig. 7. Conformation and density asymmetry of linker DNA (CD-bound versus free) and CLD (NCP-bound versus free).
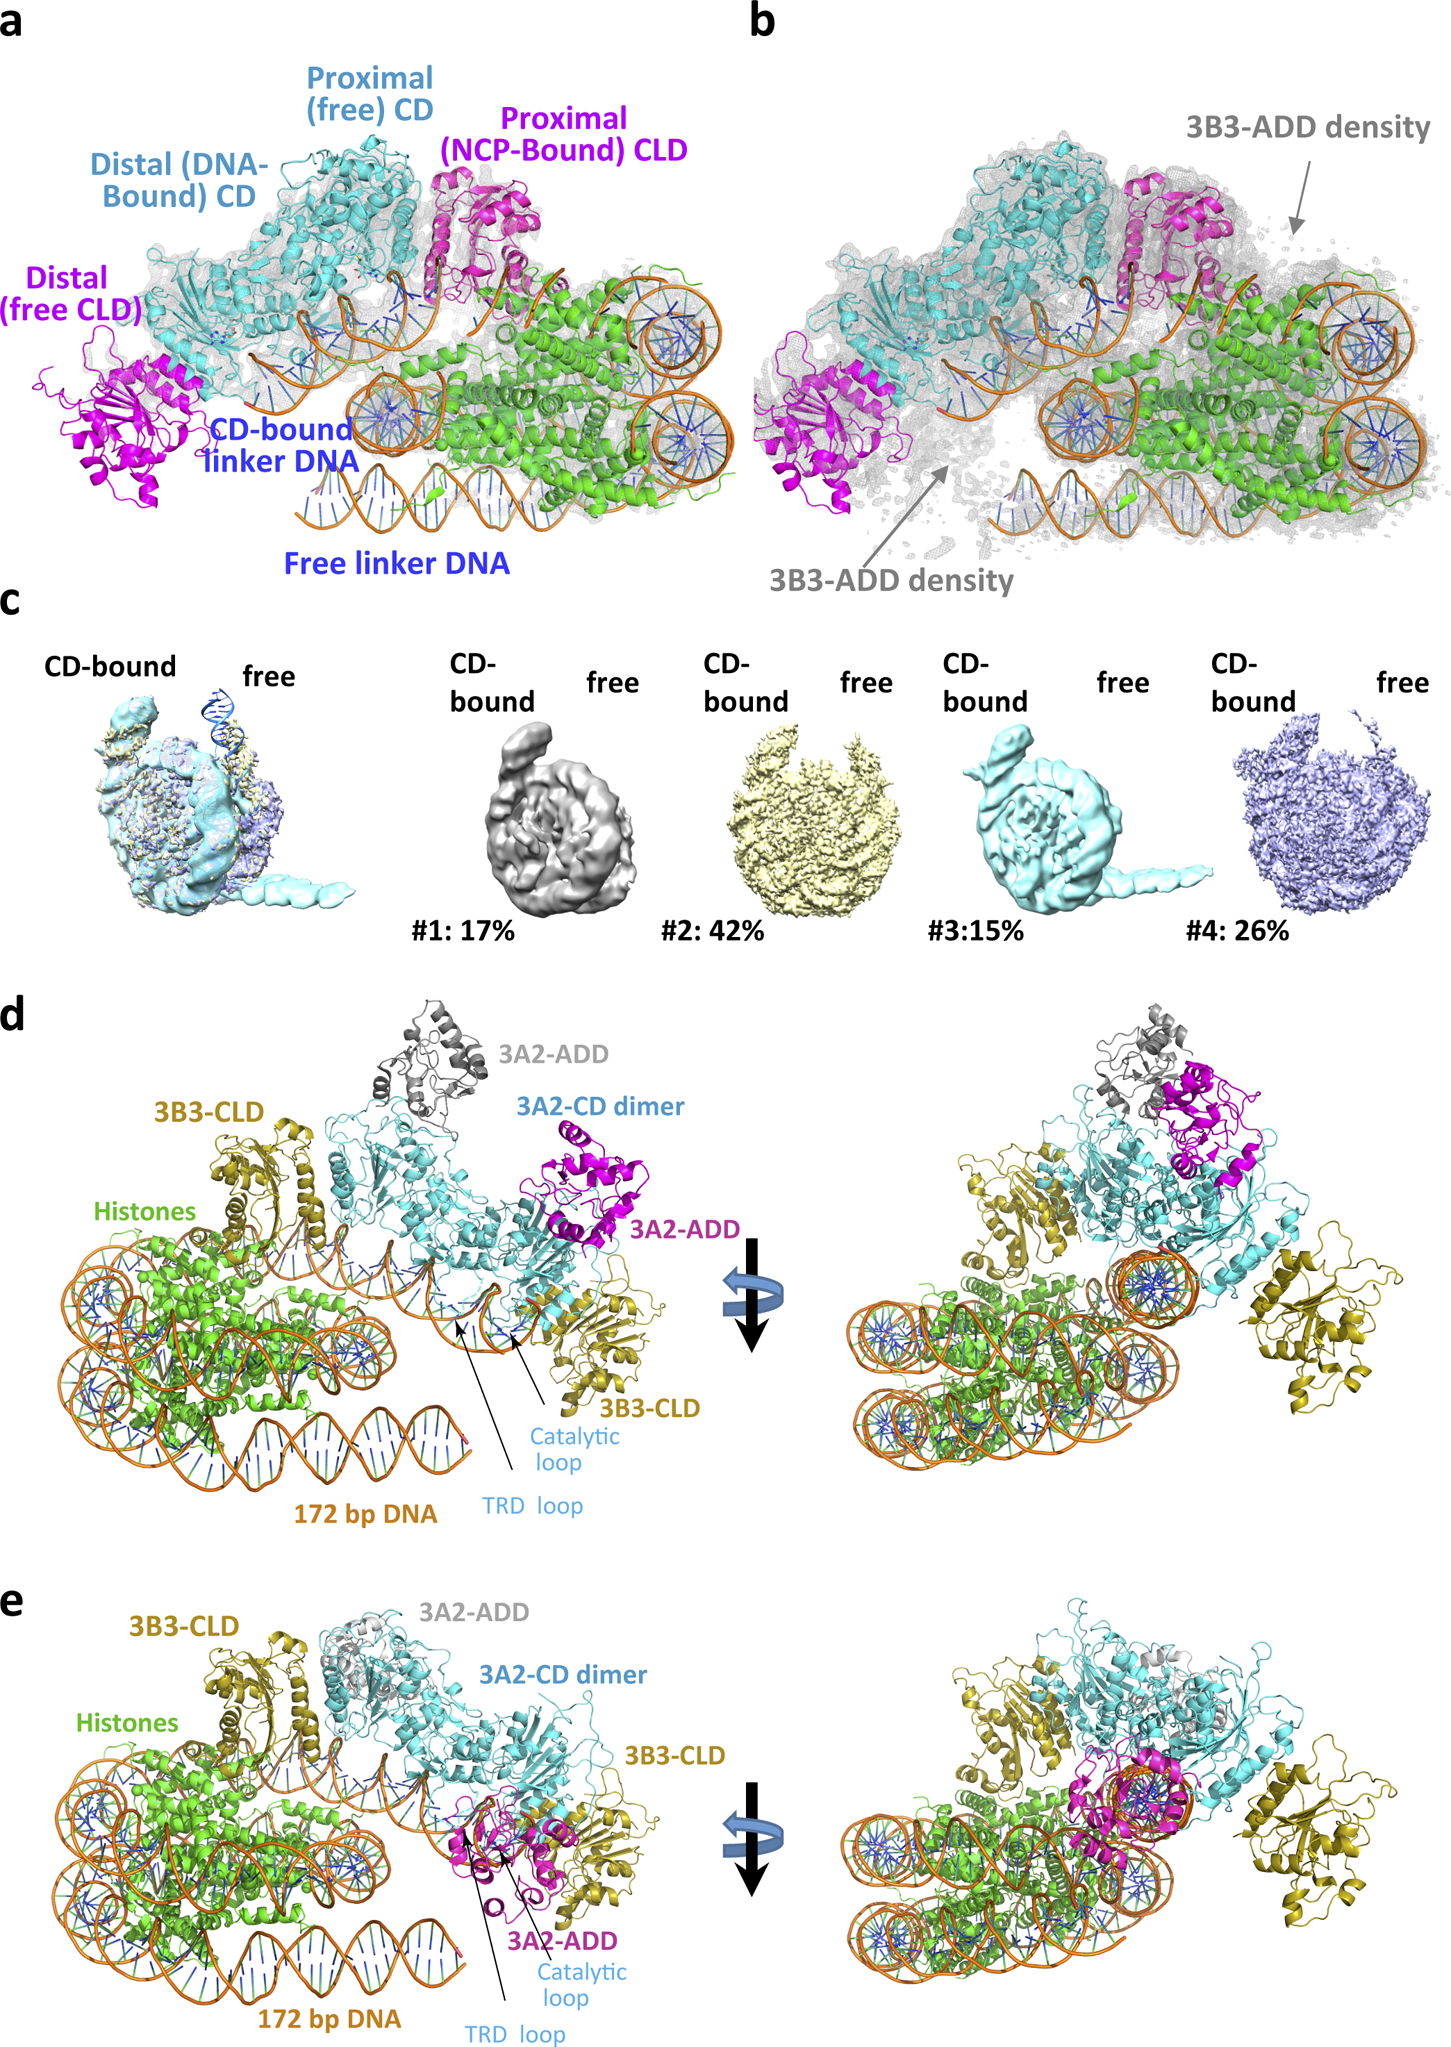
a,b, Structure model overlaid with density maps (grey mesh) generated in PyMOL and contoured at 8 σ (a) and 6 σ (b). Note that at 8 σ contoured level complete density is only visible for the CD-bound linker DNA and the histone octamer-bound CLD. c, While the CD-bound linker DNA adopts a single conformation, the unbound linker DNA adopts four distinguishable conformations. Left: composite model; right: four different conformations shown as cryo-EM densities with their relative frequencies. d, Model of the DNMT3A2/3B3 complex with extended linker DNA and 3A2 ADD domain in its active conformation. The ADD has been modeled by structural alignment with PDB 4U7T. The structure model is fully compatible with the extended linker DNA. e, Model of the DNMT3A2/3B3 complex with extended linker DNA and 3A2 ADD domain in the autoinhibitory conformation. The ADD has been modeled by structural alignment with PDB 4U7P. This conformation is not compatible with the extended linker DNA.
Extended Data Fig. 8. MNase footprinting assay.
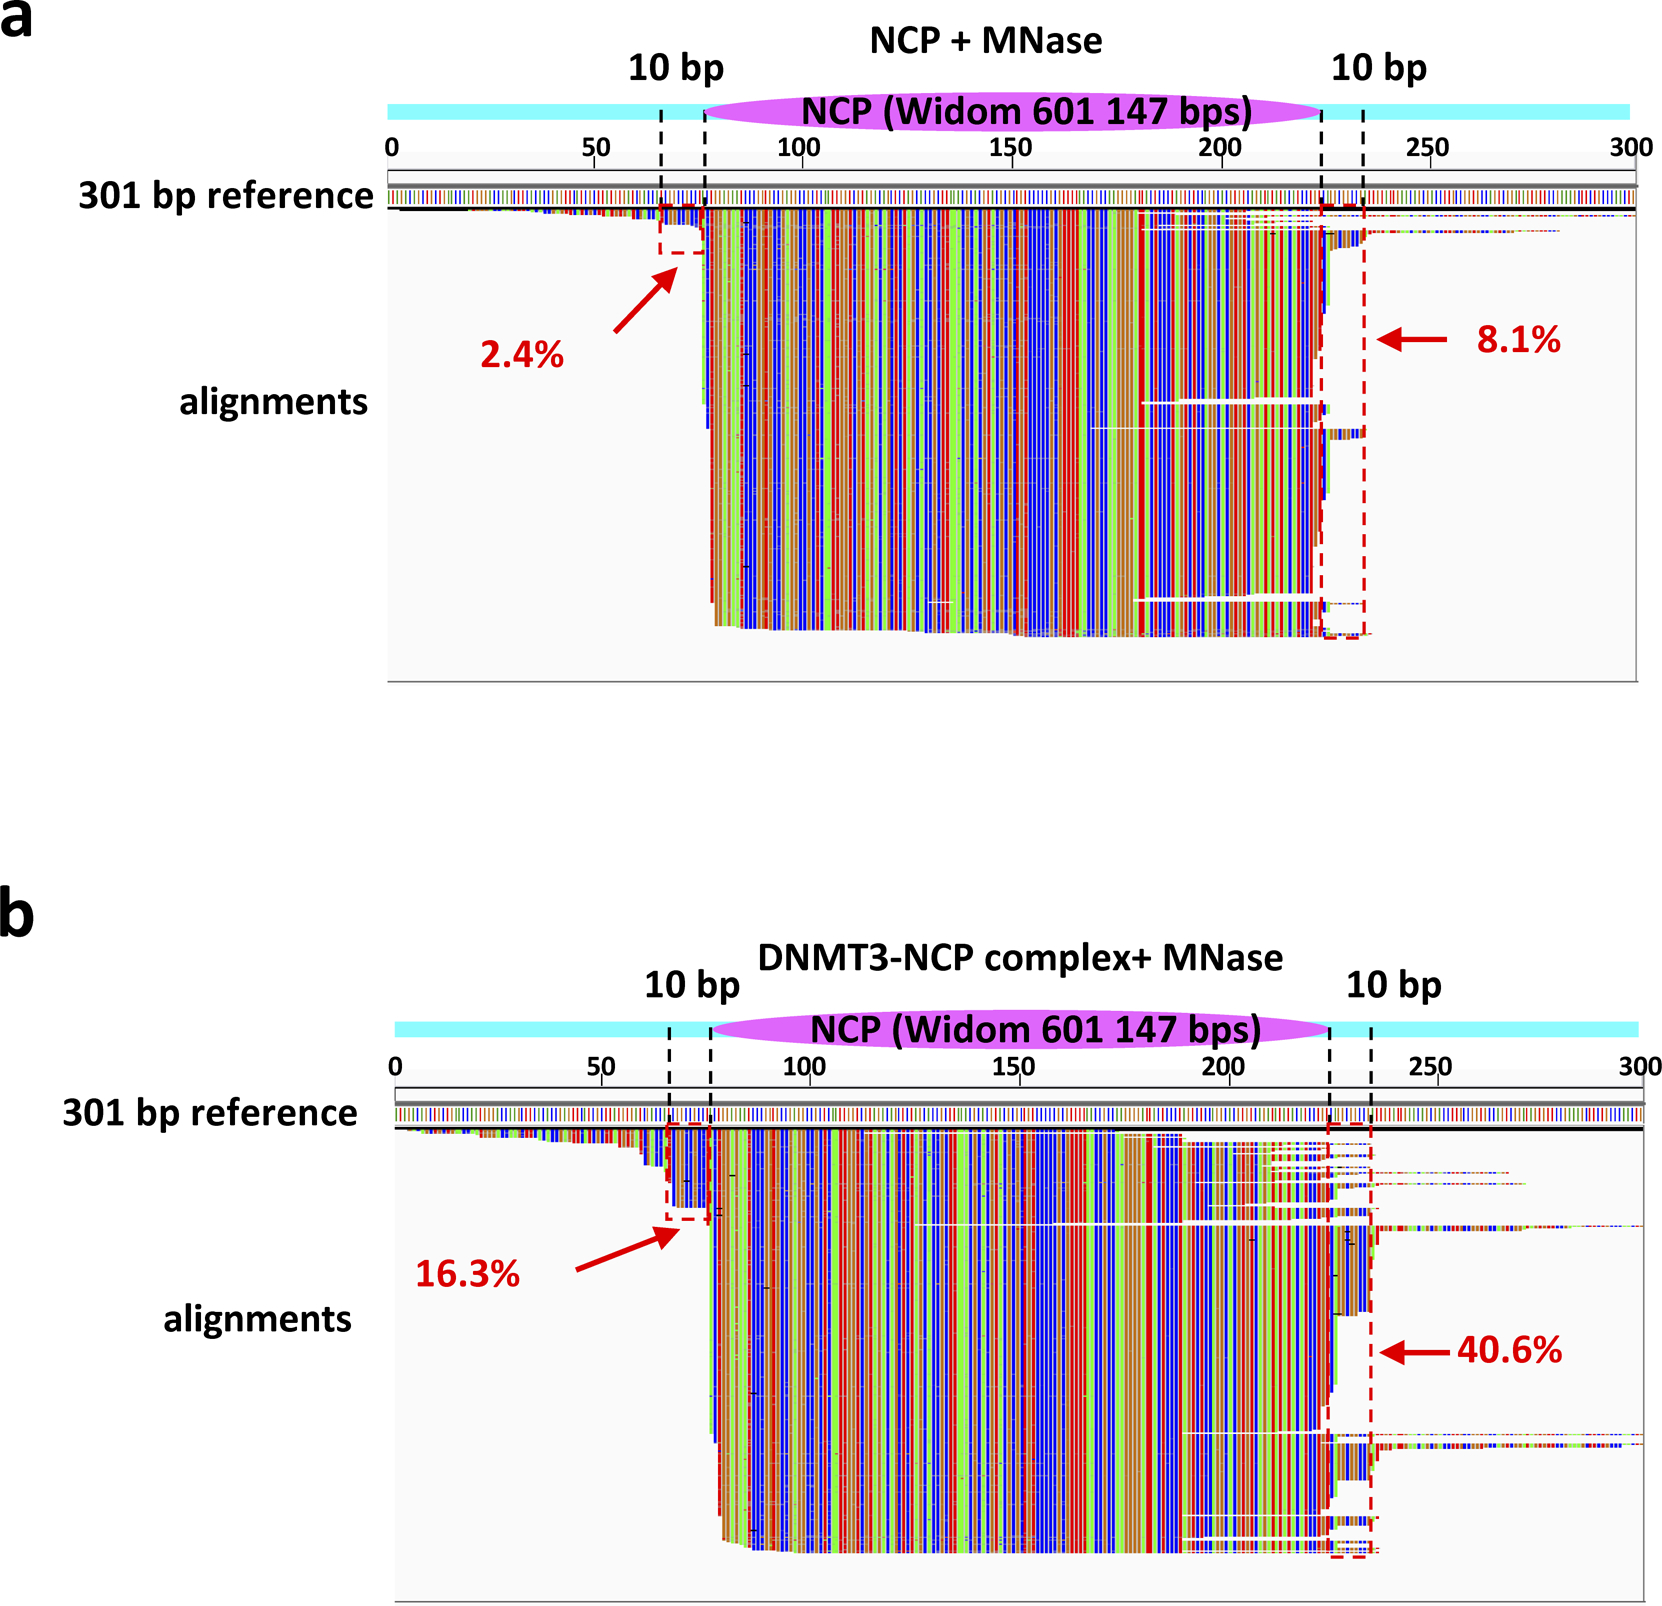
a, NCP301 alone or b, in complex with DNMT3A2/3B3 were subjected to MNase footprinting followed by DNA isolation and sequencing. Sequence reads shown by IGV viewer were aligned to the 301 bp reference to reveal the position of DNMT3A2/3B3 on individual nucleosomal DNA molecules (green = A, red = T, blue = C, brown = G). Magenta oval: position of the histone octamer (Widom 601 147 bp nucleosomal sequence); cyan bars: flexible linker region. Dashed lines demarcate the 10 bp linker regions of NCP167, and red dashed boxes represent the main DNMT protection region (protection of the DNMT/NCP complex relative to the DNMT-free NCP). The percentages of reads covering the DNMT protection regions are shown in red.
Extended Data Fig. 9. Histone H3 K36cMe3 did not improve the stability of ADD domains.
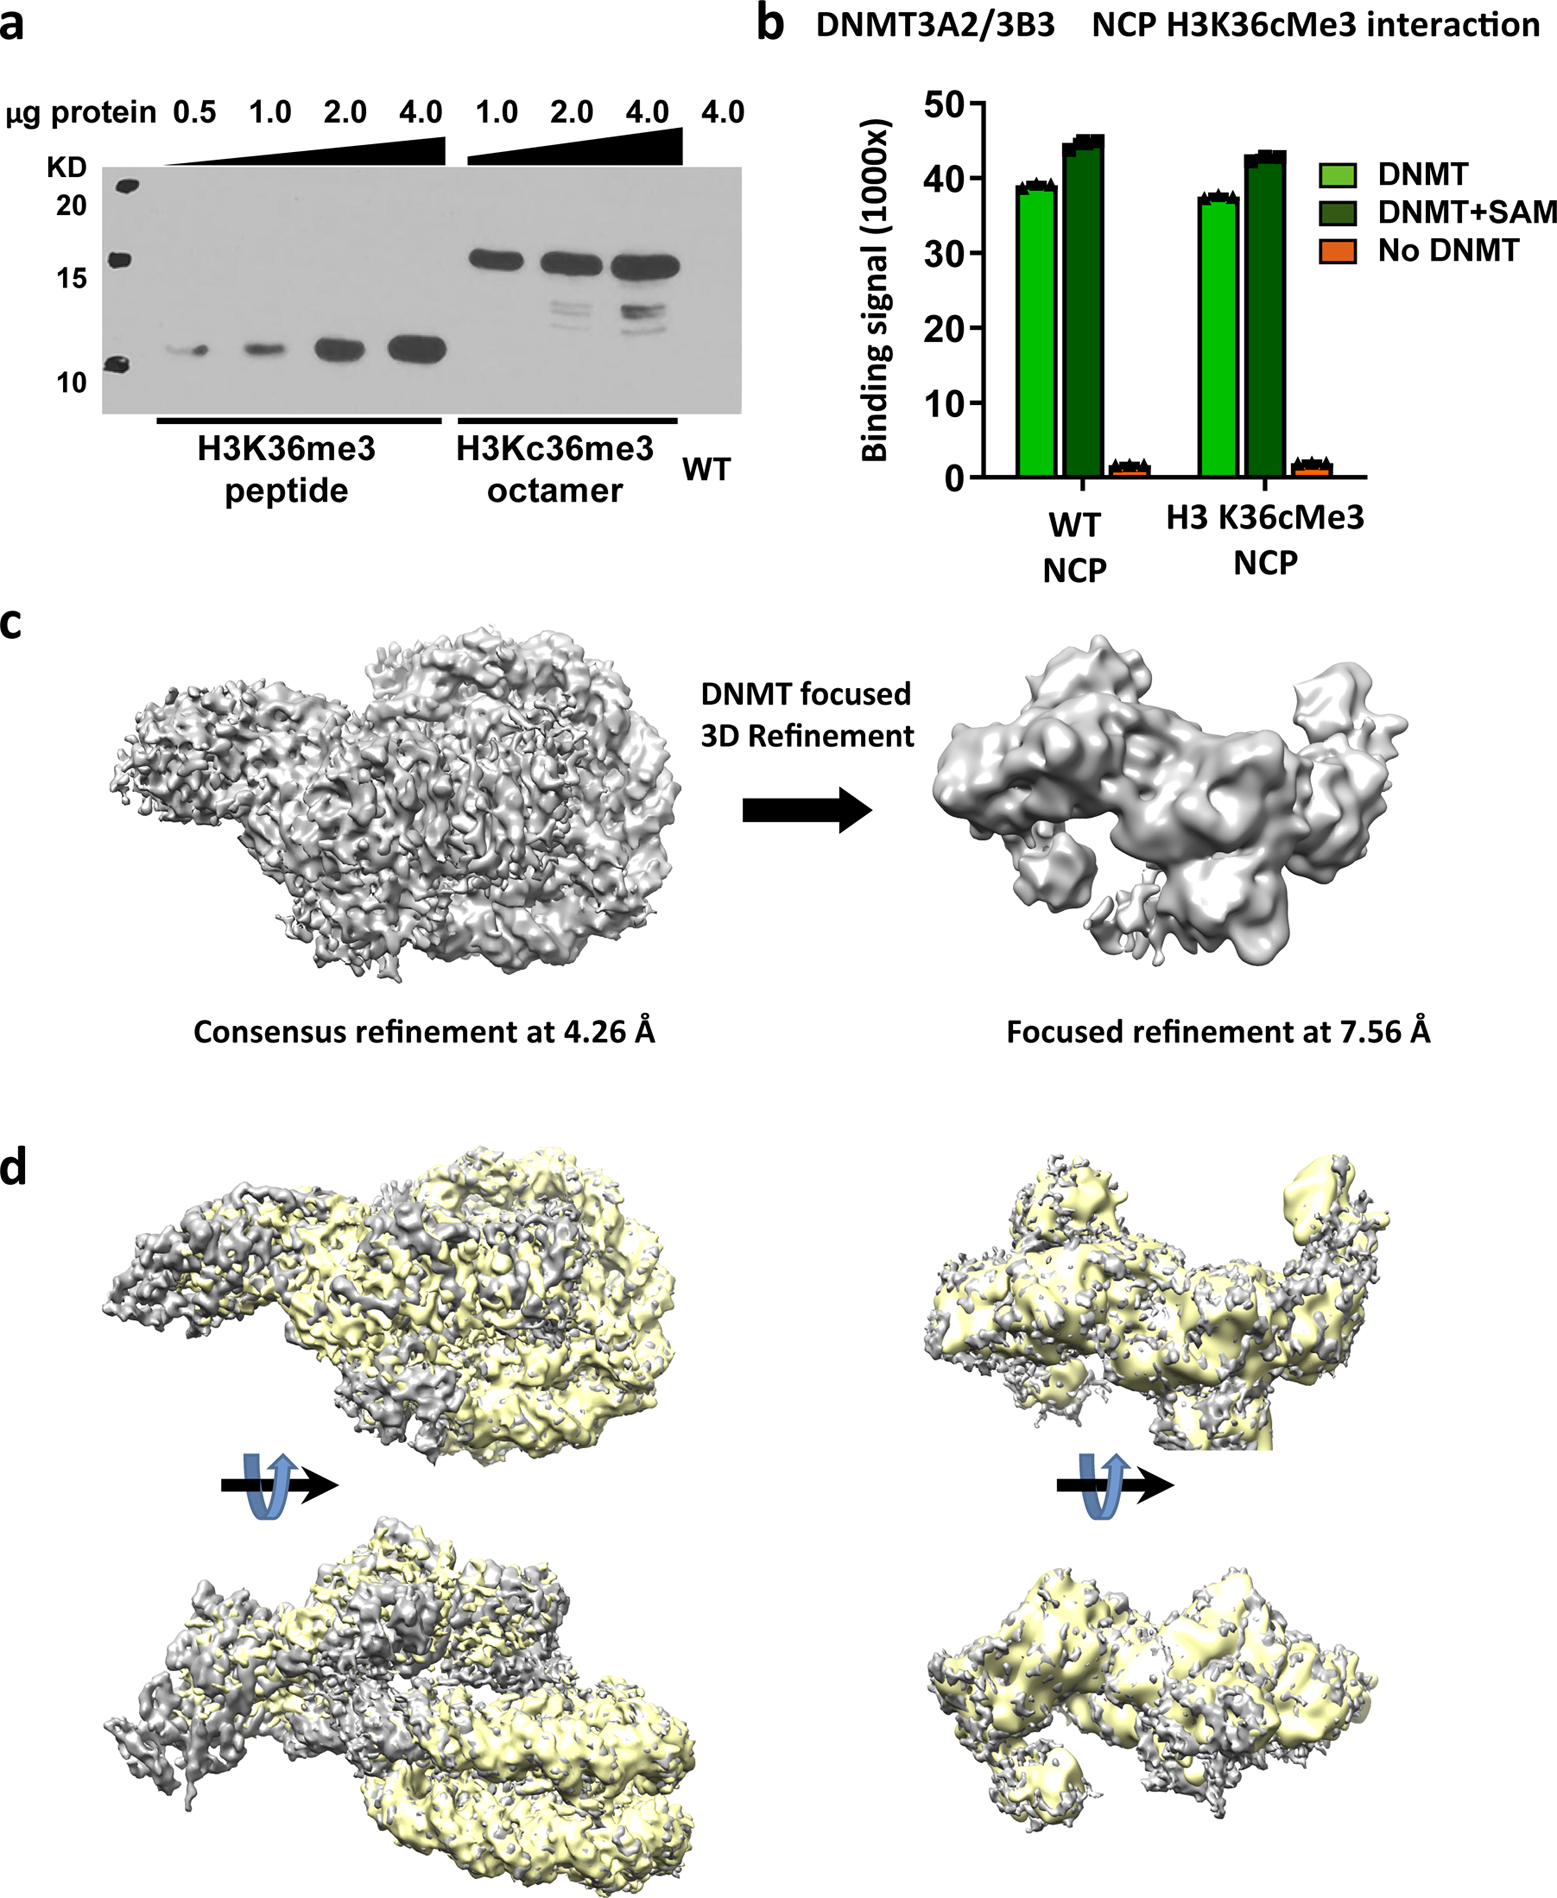
a, H3K36cMe3 methyl-lysine analog (MLA) peptide and H2A/H2B/H3K36cMe3 MLA/H4 histone octamer, but not wildtype (WT) octamer, are recognized by anti-H3K36Me3 antibody. Four titrations (H3K36me3 peptide) or 3 titrations (H3Kc36me3 octamer) with different amounts of proteins were performed. b, AlphaScreen interaction assay between His-tagged DNMT3A2/DNMT3B3 complexes and biotinylated NCPs. The histone H3 K36cMe3 methyl analog does not increase DNMT3A2/3B-NCP binding in the reconstituted system. Data are mean ± sem, n = 3. c, Cryo-EM structure of the DNMT3A2/3B/H3K36cMe3 MLA NCP. The structure shows no additional density relative to that of the WT NCP complex. The ADD density is still poor and no reliable PWWP density is observed. d, DNMT-NCP (WT, grey) density map and DNMT-NCP (K36cMe3, yellow) density map structural alignment shows their similar overall architecture. For gel source data, see Supplementary Figure S5.
Extended Data Table 1.
Cryo-EM data collection, refinement and validation statistics,
| #1 DNMT-NCP167 | #2 NCP167 focused (-DNMT) | #3 DNMT focused (-NCP167) | #4 DNMT-CD-NCP combined map* (EMD-20281) (PDB 6PA7) | #5 DNMT-NCP (K36cMe3) | #6 DNMT (K36cMe3) focused (-NCP) |
#7 DNMT-NCP (K36cMe3) combined map* (EMD-21689) | |
|---|---|---|---|---|---|---|---|
| Data collection and processing | |||||||
| Magnification | 130000 | 130000 | 130000 | 130000 | 130000 | 130000 | 130000 |
| Voltage (kV) | 300 | 300 | 300 | 300 | 300 | 300 | 300 |
| Electron exposure (e−/Å2) | 65 | 65 | 65 | 65 | 65 | 65 | 65 |
| Defocus range (μm) | −1.0 ~ −2.5 | −1.0 ~ −2.5 | −1.0 ~ −2.5 | −1.0 ~ −2.5 | −1.0 ~ −2.5 | −1.0 ~ −2.5 | −1.0 ~ −2.5 |
| Pixel size (Å) | 1.029 | 1.029 | 1.029 | 1.029 | 1.029 | 1.029 | 1.029 |
| Symmetry imposed | C1 | C1 | C1 | C1 | C1 | C1 | C1 |
| Initial particle images (no.) | 2190114 | 180264 | |||||
| Final particle images (no.) | 599344 | 406908 | 290055 | 42997 | 42997 | ||
| Map resolution (Å) | 2.94 | 2.78 | 3.4 | 4.26 | 7.56 | ||
| FSC threshold | 0.143 | 0.143 | 0.143 | 0.143 | 0.143 | ||
| Map resolution range (Å) | 7.0 ~ 2.94 | 5.0 ~ 2.78 | 7.0 ~ 3.40 | ||||
| Refinement | |||||||
| Initial model used (PDB code) | 1KX5, 4U7P, 4QLC | ||||||
| Model resolution (Å) | |||||||
| FSC threshold | |||||||
| Model resolution range (Å) | 40–2.78 | ||||||
| Map sharpening B factor (Å2) | −91 | −81 | −107 | −120 | −300 | ||
| Model composition | |||||||
| Non-hydrogen atoms | 21026 | ||||||
| Protein residues | 1770 | ||||||
| DNA base pairs | 332 | ||||||
| Ligands | 2 | ||||||
| C1 atoms | 3 | ||||||
| B factors (Å2) | |||||||
| Protein | 93.3 | ||||||
| Ligand | 55.5 | ||||||
| R.m.s. deviations | |||||||
| Bond lengths (Å) | 0.005 | ||||||
| Bond angles (°) | 0.99 | ||||||
| Validation | |||||||
| MolProbity score | 1.44 | ||||||
| Clashscore | 4.23 | ||||||
| Poor rotamers (%) | |||||||
| Ramachandran plot | |||||||
| Favored (%) | 96.77 | ||||||
| Allowed (%) | 3.23 | ||||||
| Disallowed (%) | 0 |
Combined map from focused refinement of NCP and DNMT.
Supplementary Material
Acknowledgements
Cryo-EM data was collected at the David Van Andel Advanced Cryo-Electron Microscopy Suite at the Van Andel Institute (VAI). We are grateful to Dr. Xing Meng for cryo-EM data collection and EM technical support, the HPC team at VAI for computational support, David Nadziejka for language editing of the manuscript, and the VAI genomics core for performing Illumina Infinium methylation EPIC array. We thank Dr. Jung-Hyun Min (Washington State University) and Dr. Stephen Baylin (John Hopkins University) for the indicated plasmids. This work was supported by VAI (H.E.X., K.M., P.A.J.) and grant R35CA209859 from the National Cancer Institute (NCI) to G.L, K.M., and P.A.J. This work was also supported by NIH NCI R50CA243878 to Minmin Liu.
Footnotes
Competing interests
The authors declare no competing interests.
Data availability
Density maps and structure coordinates have been deposited to the electron Microscopy Database with accession number EMD-20281, EMD-21689 and the Protein Data Bank with accession number PDB ID 6PA7. The DNA methylation and MNase data data have been deposited in GEO database with accession number GSE152640. No restrictions are placed on data availability.
Supplementary Information is available for this paper.
References
- 1.Jones PA & Baylin SB The fundamental role of epigenetic events in cancer. Nat Rev Genet 3, 415–428, doi: 10.1038/nrg816 (2002). [DOI] [PubMed] [Google Scholar]
- 2.Jones PA & Liang G Rethinking how DNA methylation patterns are maintained. Nat Rev Genet 10, 805–811, doi: 10.1038/nrg2651 (2009). [DOI] [PMC free article] [PubMed] [Google Scholar]
- 3.Takeshima H, Suetake I & Tajima S Mouse Dnmt3a preferentially methylates linker DNA and is inhibited by histone H1. J Mol Biol 383, 810–821, doi: 10.1016/j.jmb.2008.03.001 (2008). [DOI] [PubMed] [Google Scholar]
- 4.Kelly TK et al. Genome-wide mapping of nucleosome positioning and DNA methylation within individual DNA molecules. Genome Res 22, 2497–2506, doi: 10.1101/gr.143008.112 (2012). [DOI] [PMC free article] [PubMed] [Google Scholar]
- 5.Bourc’his D, Xu GL, Lin CS, Bollman B & Bestor TH Dnmt3L and the establishment of maternal genomic imprints. Science 294, 2536–2539, doi: 10.1126/science.1065848 (2001). [DOI] [PubMed] [Google Scholar]
- 6.Duymich CE, Charlet J, Yang X, Jones PA & Liang G DNMT3B isoforms without catalytic activity stimulate gene body methylation as accessory proteins in somatic cells. Nat Commun 7, 11453, doi: 10.1038/ncomms11453 (2016). [DOI] [PMC free article] [PubMed] [Google Scholar]
- 7.Jia D, Jurkowska RZ, Zhang X, Jeltsch A & Cheng X Structure of Dnmt3a bound to Dnmt3L suggests a model for de novo DNA methylation. Nature 449, 248–251, doi: 10.1038/nature06146 (2007). [DOI] [PMC free article] [PubMed] [Google Scholar]
- 8.Ooi SK et al. DNMT3L connects unmethylated lysine 4 of histone H3 to de novo methylation of DNA. Nature 448, 714–717, doi: 10.1038/nature05987 (2007). [DOI] [PMC free article] [PubMed] [Google Scholar]
- 9.Guo X et al. Structural insight into autoinhibition and histone H3-induced activation of DNMT3A. Nature 517, 640–644, doi: 10.1038/nature13899 (2015). [DOI] [PubMed] [Google Scholar]
- 10.Zhang ZM et al. Structural basis for DNMT3A-mediated de novo DNA methylation. Nature 554, 387–391, doi: 10.1038/nature25477 (2018). [DOI] [PMC free article] [PubMed] [Google Scholar]
- 11.Bowman RL, Busque L & Levine RL Clonal Hematopoiesis and Evolution to Hematopoietic Malignancies. Cell Stem Cell 22, 157–170, doi: 10.1016/j.stem.2018.01.011 (2018). [DOI] [PMC free article] [PubMed] [Google Scholar]
- 12.Heyn P et al. Gain-of-function DNMT3A mutations cause microcephalic dwarfism and hypermethylation of Polycomb-regulated regions. Nat Genet 51, 96–105, doi: 10.1038/s41588-018-0274-x (2019). [DOI] [PMC free article] [PubMed] [Google Scholar]
- 13.Sendzikaite G, Hanna CW, Stewart-Morgan KR, Ivanova E & Kelsey G A DNMT3A PWWP mutation leads to methylation of bivalent chromatin and growth retardation in mice. Nat Commun 10, 1884, doi: 10.1038/s41467-019-09713-w (2019). [DOI] [PMC free article] [PubMed] [Google Scholar]
- 14.Tatton-Brown K et al. Mutations in the DNA methyltransferase gene DNMT3A cause an overgrowth syndrome with intellectual disability. Nat Genet 46, 385–388, doi: 10.1038/ng.2917 (2014). [DOI] [PMC free article] [PubMed] [Google Scholar]
- 15.Lowary PT & Widom J New DNA sequence rules for high affinity binding to histone octamer and sequence-directed nucleosome positioning. J Mol Biol 276, 19–42, doi: 10.1006/jmbi.1997.1494 (1998). [DOI] [PubMed] [Google Scholar]
- 16.Kareta MS, Botello ZM, Ennis JJ, Chou C & Chedin F Reconstitution and mechanism of the stimulation of de novo methylation by human DNMT3L. The Journal of biological chemistry 281, 25893–25902, doi: 10.1074/jbc.M603140200 (2006). [DOI] [PubMed] [Google Scholar]
- 17.Rhee I et al. DNMT1 and DNMT3b cooperate to silence genes in human cancer cells. Nature 416, 552–556, doi: 10.1038/416552a (2002). [DOI] [PubMed] [Google Scholar]
- 18.Egger G et al. Identification of DNMT1 (DNA methyltransferase 1) hypomorphs in somatic knockouts suggests an essential role for DNMT1 in cell survival. Proc Natl Acad Sci U S A 103, 14080–14085, doi: 10.1073/pnas.0604602103 (2006). [DOI] [PMC free article] [PubMed] [Google Scholar]
- 19.Yang X et al. Gene body methylation can alter gene expression and is a therapeutic target in cancer. Cancer Cell 26, 577–590, doi: 10.1016/j.ccr.2014.07.028 (2014). [DOI] [PMC free article] [PubMed] [Google Scholar]
- 20.Rondelet G, Dal Maso T, Willems L & Wouters J Structural basis for recognition of histone H3K36me3 nucleosome by human de novo DNA methyltransferases 3A and 3B. J Struct Biol 194, 357–367, doi: 10.1016/j.jsb.2016.03.013 (2016). [DOI] [PubMed] [Google Scholar]
- 21.Dukatz M et al. H3K36me2/3 Binding and DNA Binding of the DNA Methyltransferase DNMT3A PWWP Domain Both Contribute to its Chromatin Interaction. J Mol Biol 431, 5063–5074, doi: 10.1016/j.jmb.2019.09.006 (2019). [DOI] [PubMed] [Google Scholar]
- 22.Weinberg DN et al. The histone mark H3K36me2 recruits DNMT3A and shapes the intergenic DNA methylation landscape. Nature 573, 281–286, doi: 10.1038/s41586-019-1534-3 (2019). [DOI] [PMC free article] [PubMed] [Google Scholar]
- 23.Qiu C, Sawada K, Zhang X & Cheng X The PWWP domain of mammalian DNA methyltransferase Dnmt3b defines a new family of DNA-binding folds. Nat Struct Biol 9, 217–224, doi: 10.1038/nsb759 (2002). [DOI] [PMC free article] [PubMed] [Google Scholar]
- 24.Chen T, Tsujimoto N & Li E The PWWP domain of Dnmt3a and Dnmt3b is required for directing DNA methylation to the major satellite repeats at pericentric heterochromatin. Mol Cell Biol 24, 9048–9058, doi: 10.1128/MCB.24.20.9048-9058.2004 (2004). [DOI] [PMC free article] [PubMed] [Google Scholar]
- 25.Ge YZ et al. Chromatin targeting of de novo DNA methyltransferases by the PWWP domain. The Journal of biological chemistry 279, 25447–25454, doi: 10.1074/jbc.M312296200 (2004). [DOI] [PubMed] [Google Scholar]
- 26.Zhang Y et al. Chromatin methylation activity of Dnmt3a and Dnmt3a/3L is guided by interaction of the ADD domain with the histone H3 tail. Nucleic Acids Res 38, 4246–4253, doi: 10.1093/nar/gkq147 (2010). [DOI] [PMC free article] [PubMed] [Google Scholar]
- 27.Klimasauskas S, Kumar S, Roberts RJ & Cheng X Hhal methyltransferase flips its target base out of the DNA helix. Cell 76, 357–369, doi: 10.1016/0092-8674(94)90342-5 (1994). [DOI] [PubMed] [Google Scholar]
- 28.Song J, Rechkoblit O, Bestor TH & Patel DJ Structure of DNMT1-DNA complex reveals a role for autoinhibition in maintenance DNA methylation. Science 331, 1036–1040, doi: 10.1126/science.1195380 (2011). [DOI] [PMC free article] [PubMed] [Google Scholar]
- 29.Henikoff JG, Belsky JA, Krassovsky K, MacAlpine DM & Henikoff S Epigenome characterization at single base-pair resolution. Proc Natl Acad Sci U S A 108, 18318–18323, doi: 10.1073/pnas.1110731108 (2011). [DOI] [PMC free article] [PubMed] [Google Scholar]
- 30.Chodavarapu RK et al. Relationship between nucleosome positioning and DNA methylation. Nature 466, 388–392, doi: 10.1038/nature09147 (2010). [DOI] [PMC free article] [PubMed] [Google Scholar]
- 31.Barisic D, Stadler MB, Iurlaro M & Schubeler D Mammalian ISWI and SWI/SNF selectively mediate binding of distinct transcription factors. Nature 569, 136–140, doi: 10.1038/s41586-019-1115-5 (2019). [DOI] [PMC free article] [PubMed] [Google Scholar]
- 32.Lyons DB & Zilberman D DDM1 and Lsh remodelers allow methylation of DNA wrapped in nucleosomes. Elife 6, doi: 10.7554/eLife.30674 (2017). [DOI] [PMC free article] [PubMed] [Google Scholar]
- 33.Goll MG & Bestor TH Eukaryotic cytosine methyltransferases. Annu Rev Biochem 74, 481–514, doi: 10.1146/annurev.biochem.74.010904.153721 (2005). [DOI] [PubMed] [Google Scholar]
- 34.Yu W et al. Genome-wide DNA methylation patterns in LSH mutant reveals de-repression of repeat elements and redundant epigenetic silencing pathways. Genome Res 24, 1613–1623, doi: 10.1101/gr.172015.114 (2014). [DOI] [PMC free article] [PubMed] [Google Scholar]
- 35.Simon MD & Shokat KM in Methods in Enzymology Vol. Volume 512 (eds Carl Wu & David Allis C) 57–69 (Academic Press, 2012). [DOI] [PubMed] [Google Scholar]
- 36.Simon MD et al. The site-specific installation of methyl-lysine analogs into recombinant histones. Cell 128, 1003–1012, doi: 10.1016/j.cell.2006.12.041 (2007). [DOI] [PMC free article] [PubMed] [Google Scholar]
- 37.Bouazoune K, Miranda TB, Jones PA & Kingston RE Analysis of individual remodeled nucleosomes reveals decreased histone-DNA contacts created by hSWI/SNF. Nucleic Acids Res 37, 5279–5294, doi: 10.1093/nar/gkp524 (2009). [DOI] [PMC free article] [PubMed] [Google Scholar]
- 38.Dyer PN et al. Reconstitution of nucleosome core particles from recombinant histones and DNA. Method Enzymol 375, 23–44, doi: 10.1016/s0076-6879(03)75002-2 (2004). [DOI] [PubMed] [Google Scholar]
- 39.Luger K, Rechsteiner TJ & Richmond TJ Preparation of nucleosome core particle from recombinant histones. Method Enzymol 304, 3–19, doi: 10.1016/s0076-6879(99)04003-3 (1999). [DOI] [PubMed] [Google Scholar]
- 40.Ma H et al. A D53 repression motif induces oligomerization of TOPLESS corepressors and promotes assembly of a corepressor-nucleosome complex. Sci Adv 3, e1601217, doi: 10.1126/sciadv.1601217 (2017). [DOI] [PMC free article] [PubMed] [Google Scholar]
- 41.Jeong S et al. Selective anchoring of DNA methyltransferases 3A and 3B to nucleosomes containing methylated DNA. Mol Cell Biol 29, 5366–5376, doi: 10.1128/MCB.00484-09 (2009). [DOI] [PMC free article] [PubMed] [Google Scholar]
- 42.Sharma S, De Carvalho DD, Jeong S, Jones PA & Liang G Nucleosomes containing methylated DNA stabilize DNA methyltransferases 3A/3B and ensure faithful epigenetic inheritance. PLoS Genet 7, e1001286, doi: 10.1371/journal.pgen.1001286 (2011). [DOI] [PMC free article] [PubMed] [Google Scholar]
- 43.Zhou W, Triche TJ Jr., Laird PW & Shen H SeSAMe: reducing artifactual detection of DNA methylation by Infinium BeadChips in genomic deletions. Nucleic Acids Res 46, e123, doi: 10.1093/nar/gky691 (2018). [DOI] [PMC free article] [PubMed] [Google Scholar]
- 44.Kastner B et al. GraFix: sample preparation for single-particle electron cryomicroscopy. Nat Methods 5, 53–55, doi: 10.1038/nmeth1139 (2008). [DOI] [PubMed] [Google Scholar]
- 45.Stark H GraFix: stabilization of fragile macromolecular complexes for single particle cryo-EM. Method Enzymol 481, 109–126, doi: 10.1016/S0076-6879(10)81005-5 (2010). [DOI] [PubMed] [Google Scholar]
- 46.Mastronarde DN Automated electron microscope tomography using robust prediction of specimen movements. J Struct Biol 152, 36–51, doi: 10.1016/j.jsb.2005.07.007 (2005). [DOI] [PubMed] [Google Scholar]
- 47.Zheng SQ et al. MotionCor2: anisotropic correction of beam-induced motion for improved cryo-electron microscopy. Nat Methods 14, 331–332, doi: 10.1038/nmeth.4193 (2017). [DOI] [PMC free article] [PubMed] [Google Scholar]
- 48.Rohou A & Grigorieff N CTFFIND4: Fast and accurate defocus estimation from electron micrographs. J Struct Biol 192, 216–221, doi: 10.1016/j.jsb.2015.08.008 (2015). [DOI] [PMC free article] [PubMed] [Google Scholar]
- 49.Zivanov J et al. New tools for automated high-resolution cryo-EM structure determination in RELION-3. Elife 7, doi: 10.7554/eLife.42166 (2018). [DOI] [PMC free article] [PubMed] [Google Scholar]
- 50.Punjani A, Rubinstein JL, Fleet DJ & Brubaker MA cryoSPARC: algorithms for rapid unsupervised cryo-EM structure determination. Nat Methods 14, 290–296, doi: 10.1038/nmeth.4169 (2017). [DOI] [PubMed] [Google Scholar]
- 51.Rosenthal PB & Henderson R Optimal determination of particle orientation, absolute hand, and contrast loss in single-particle electron cryomicroscopy. J Mol Biol 333, 721–745, doi: 10.1016/j.jmb.2003.07.013 (2003). [DOI] [PubMed] [Google Scholar]
- 52.Kucukelbir A, Sigworth FJ & Tagare HD Quantifying the local resolution of cryo-EM density maps. Nat Methods 11, 63–65, doi: 10.1038/nmeth.2727 (2014). [DOI] [PMC free article] [PubMed] [Google Scholar]
- 53.Pettersen EF et al. UCSF Chimera--a visualization system for exploratory research and analysis. J Comput Chem 25, 1605–1612, doi: 10.1002/jcc.20084 (2004). [DOI] [PubMed] [Google Scholar]
- 54.Kelley LA, Mezulis S, Yates CM, Wass MN & Sternberg MJ The Phyre2 web portal for protein modeling, prediction and analysis. Nat Protoc 10, 845–858, doi: 10.1038/nprot.2015.053 (2015). [DOI] [PMC free article] [PubMed] [Google Scholar]
- 55.Emsley P & Cowtan K Coot: model-building tools for molecular graphics. Acta Crystallogr D Biol Crystallogr 60, 2126–2132, doi: 10.1107/S0907444904019158 (2004). [DOI] [PubMed] [Google Scholar]
- 56.Adams PD et al. PHENIX: a comprehensive Python-based system for macromolecular structure solution. Acta Crystallogr D Biol Crystallogr 66, 213–221, doi: 10.1107/S0907444909052925 (2010). [DOI] [PMC free article] [PubMed] [Google Scholar]
Associated Data
This section collects any data citations, data availability statements, or supplementary materials included in this article.