

Abstract
Humans have the longest post-reproductive lifespans and lowest rates of actuarial ageing among primates. Understanding the links between slow actuarial ageing and physiological change is critical for improving the human ‘healthspan’. Physiological dysregulation may be a key feature of ageing in industrialized populations with high burdens of chronic ‘diseases of civilization’, but little is known about age trajectories of physiological condition in subsistence populations with limited access to public health infrastructure. To better characterize human physiological dysregulation, we examined age trajectories of 40 biomarkers spanning the immune (n = 13 biomarkers), cardiometabolic (n = 14), musculoskeletal (n = 6) and other (n = 7) systems among Tsimane forager-horticulturalists of the Bolivian Amazon using mixed cross-sectional and longitudinal data (n = 22 115 observations). We characterized age-related changes using a multi-system statistical index of physiological dysregulation (Mahalanobis distance; Dm) that increases with age in both humans and other primates. Although individual biomarkers showed varied age profiles, we found a robust increase in age-related dysregulation for Tsimane (β = 0.17–0.18) that was marginally faster than that reported for an industrialized Western sample (β = 0.14–0.16), but slower than that of other non-human primates. We found minimal sex differences in the pace or average level of dysregulation for Tsimane. Our findings highlight some conserved patterns of physiological dysregulation in humans, consistent with the notion that somatic ageing exhibits species-typical patterns, despite cross-cultural variation in environmental exposures, lifestyles and mortality.
This article is part of the theme issue ‘Evolution of the primate ageing process'.
Keywords: ageing, physiological dysregulation, subsistence, Tsimane, longevity
1. Introduction
Primates exhibit exceptional longevity for their body size compared to most mammals [1]. Slow primate ageing is linked with reduced ‘extrinsic’ mortality [2] and is correlated with increased brain size. Humans are outliers even among primates, with comparatively large brains, a long juvenile period, intergenerational resource transfers and long post-reproductive lifespan [3–5]. To date, most research on primate ageing has investigated demographic or actuarial ageing, i.e. age-related declines in survival or reproduction [6]. Yet, ageing reflects the time-dependent deterioration of physiological function, an intrinsic age-related loss of viability, increasing susceptibility to certain diseases and vulnerability to death. Little is known about proximate physiological changes in the physical systems underlying age-related declines in survivorship and fertility [7]. A focus on physiological function and ageing from a comparative perspective illuminates the extent to which human ageing profiles may be phylogenetically conserved and moderated by variability in ecology and lifestyle.
Robust differences in adult mortality rates suggest that physiological ageing might proceed differently in humans compared to other species [5,8]. Longer-lived species may have more efficient mechanisms for maintenance and repair [9–11]. For example, humans maintain higher levels of circulating antioxidants than other primates [12] and show greater DNA repair in response to UV damage than other mammals [13]. Humans also exhibit reduced rates of telomere attrition [5] and have higher levels than chimpanzees of the steroid hormone dehydroepiandrosterone sulfate (DHEAS), which promotes somatic maintenance [14].
Slower physiological ageing in humans is likely a product of natural selection. Post-reproductive adults play an important fitness-enhancing role in traditional human societies through the provision of child care, surplus resource production and transfers, and the transmission of skills and knowledge [8,15]. The indirect ‘reproductive value’ of humans and other social animals may, therefore, not decline with age as steeply as for other organisms, which might explain why human somatic ageing is uniquely decoupled from reproductive senescence [16].
Previous comparative analyses of human physiological ageing are complicated by several factors. First, although it is recognized that ageing rates vary, much of what is known is restricted to industrialized populations with access to healthcare and a high burden of non-communicable ‘diseases of civilization’ [17–19]. It is poorly understood how infection, subsistence activity and recent mortality reductions affect the pace of physiological ageing (see electronic supplementary material, §1). One possibility is that physiological condition may be similar across ecological contexts, but modernization improves survivorship of those in a compromised condition. Alternatively, condition may improve at all ages in sync with reductions in age-specific mortality. Given the goal of improving ‘healthspan’ and not just lifespan [20], a better understanding of the relationship between physiological and actuarial ageing across diverse contexts is needed [21].
Second, physiological ageing involves a dynamic interplay between complex biological systems and environmental stressors experienced throughout life [22–24]. Studies of single biomarkers are limited in scope, more susceptible to sampling biases (particularly cross-sectional studies) and sometimes produce inconsistent results [25]. More comprehensive, robust measures are needed to quantify physiological changes associated with ageing [25]. Ideal metrics would not only be predictive of functional decline and demographic outcomes, but also reflect aetiological aspects of biological ageing.
This paper has two goals. The first is to assess age-related physiological changes in Tsimane forager-horticulturalists using a longitudinal dataset of 40 biomarkers and a multivariate statistical index of dysregulation (Mahalanobis distance; Dm [26,27]). The second is to address three questions regarding dysregulation: (i) How do Tsimane age-trends in Dm compare with trends in non-human primates? (ii) How do Tsimane age trends compare with trends from contemporary industrialized populations? (iii) Do Tsimane Dm age trajectories differ by sex?
(a). Physiological ageing and dysregulation
Multivariate measures of physiological ageing present a more holistic snapshot of physiological state than any single biomarker [28], and have been used to capture theoretical concepts, such as ‘allostatic load’, where chronic stressors induce cumulative biological burdens that disrupt homeostatic processes [29,30]. Since individual biomarkers are embedded in complex regulatory networks, a growing consensus suggests that increasing and irreversible dysregulation may be a fundamental feature of physiological ageing [28,31,32].
Dysregulation embodies the inability of complex regulatory networks to maintain homeostasis due to impaired physiological processes [31]. It is assumed that organisms have a healthy baseline of physiological condition and evolved tolerance limits that help maintain optimized functionality under typical conditions. Beyond these limits, survival is maintained but under a compromised state of dysregulation, which increases vulnerability to illness and death. Systems dysregulation is thus a hypothesis about the ageing process that complements the notion of trade-offs [9] and other mechanistic theories of ageing such as damage accumulation and ‘inflamm-aging’ [33,34].
Cohen et al. [27] advocate the use of Mahalanobis distance (Dm) [26] to detect physiological dysregulation using multiple biomarkers. Dm is a statistical measure of the distance between current state in multivariate trait space and a ‘healthy’ baseline centroid. It considers differences in multiple trait values simultaneously, and the covariances between these traits. Thus, aberrations from baseline means and unusual combinations of biomarker values both contribute to high Dm [31], suggesting greater physiological dysregulation. Dm is largely robust to choice of biomarkers [35], has been validated as a measure of physiological dysregulation in multiple human populations [18] and non-human animals [17,36], and is strongly correlated with frailty and mortality [18,27,37–39] (electronic supplementary material, §3).
(i). Species-level differences: does dysregulation occur in humans at the same rate as other primates?
Given the slower actuarial ageing of humans relative to other primates, age trajectories of dysregulation in Tsimane should be slower than those of non-human primates. Previous work on a comparative sample of 10 primate species found that all species showed increasing Dm with age and that standardized rates of dysregulation were generally lower in industrialized humans compared to other primates [17]. Dm was also similar when using data from each species to define its own healthy baseline reference, versus using a different species, suggesting a conserved signal of homeostatic state that decreases with increasing phylogenetic distance [17]. Using a comparable measure of Dm for the Tsimane, we assess how age slopes compare to those of other primate species, testing the prediction that slopes in humans should be shallower if they capture species differences in mortality profiles.
(ii). Population-level differences: do rates of physiological dysregulation vary cross-culturally?
Previous work showing similar rates of dysregulation across populations [18] intimates that dysregulation trajectories may be similar between Tsimane and industrialized populations. But relative to Western industrial populations in which physiological dysregulation has been most heavily studied, the Tsimane environment is comparatively harsh, with higher mortality and fertility, and a subsistence economy placing sustained strenuous mechanical demands on the body. Greater lifetime exposure to inflammation from infection is also expected to take its cumulative toll on the body [40,41]. It is therefore possible that dysregulation trajectories will be faster among Tsimane than industrialized societies. On the other hand, some aspects of lifestyle (e.g. high physical activity) may have protective health effects, and a low prevalence of heart disease, diabetes and other chronic diseases that indicate robust late-life health could suggest lower physiological dysregulation among Tsimane.
(iii). Sex differences: do Tsimane men and women differ in rates of physiological dysregulation?
It has long been predicted that the sex experiencing greater intensity of intra-sexual reproductive competition (and hence higher mortality) should undergo more rapid senescence [42]. There is a rich tradition of research testing Williams' prediction and documenting sex differences in longevity and the senescence rates of fitness-relevant traits across animal taxa, including humans [43,44]. In industrialized countries, male mortality rates increase with age faster than females, and females have higher life expectancy due to lower mortality rates at virtually all ages [43]. Sex differences in US life expectancy increased primarily in the twentieth century after infectious mortality declined, and cardiovascular disease and cancer contributed excess deaths [45]. Yet, women generally exhibit higher rates of physical illness and disability than men across all ages (the ‘mortality–morbidity’ paradox) [46,47].
Numerous hypotheses about sex differences have been tested using targeted biomarker analyses. For instance, women may live longer because of upregulated immune systems [43] or due to protective effects of oestrogen [48]. But system-wide differences in rates of physiological dysregulation can also be compared between the sexes to investigate how the decline of whole systems are linked to morbidity and mortality [37,49].
Tsimane show minimal sex differences in life expectancy [50], suggesting that actuarial ageing may proceed at a similar pace in men and women. Among Tsimane, both sexes participate in many of the same subsistence activities (e.g. horticulture, fishing) and experience similar environmental exposures, indicating that physiological dysregulation could also proceed at similar rates. However, closer examination of sex differences in age-specific mortality hazards suggests a male advantage in childhood and early adulthood, and a female advantage at older ages. Additionally, high fertility rates—which are typical of non-Western subsistence societies—are associated with certain physiological costs unique to women, such as uterine prolapse and reduced bone mineral density (BMD) [51,52]. Taken together, it is not clear whether physiological dysregulation trajectories should be higher for Tsimane males or females.
2. Methods
(a). Study population
The Tsimane are forager-horticulturalists in lowland Bolivia. Approximately 16 000 Tsimane live in more than 90 villages. Primary subsistence practices include swidden horticulture, fishing, hunting and gathering. Tsimane in most villages are relatively isolated from broader Bolivian society, although the construction of roads, resource-extraction (i.e. logging) and development projects have brought rapid changes in market integration and technology to some areas. For expanded descriptions of the Tsimane socio-ecological context, see Gurven et al. [53].
Throughout life, Tsimane frequently experience diverse infections (parasitic, viral, bacterial and fungal) [54]. Few modern health services are reliably available in their remote villages. The nearest hospital with medical specialists is located in the distant city of Trinidad. Despite relatively limited access to modern medicine, Tsimane mortality rates have declined over time, while fertility has remained high (total fertility rate = 9 births/post-reproductive woman), resulting in rapid annual population growth (3.9%) [50].
(b). Sampling design
Biomarker data were collected by the Tsimane Health and Life History Project (THLHP), a longitudinal study of health and ageing that began in 2002. A mobile team of medical personnel and bilingual (Spanish-Tsimane) research assistants travel annually or biannually to study communities conducting clinical health assessments and collecting demographic, socioeconomic, dietary and anthropometric data (see [53] for details). Sample sizes vary by biomarker and over time for several reasons (see electronic supplementary material; table 1). Overall, coverage usually ranges from 80 to 95% of those present in the village, resulting in a population-representative sample [55].
Table 1.
Biomarkers used in the calculation of Dm organized by body system. Numbers in parentheses indicate number of person-observations.
| cardiometabolic | immune | musculoskeletal | other |
|---|---|---|---|
| apolipoprotein B-100 (1213) | C-reactive protein (2259) | calcaneal broadband ultrasound attenuation (661) | body temperature (17,694) |
| BMI (19,461) | eosinophils (8552) | calcaneal speed of sound (661) | cortisol (1939) |
| body fat (18,571) | erythrocyte sedimentation rate (9139) | hand strength (6581) | forced expiratory volume (5027) |
| creatinine (2278) | IgE (1025) | radial speed of sound (1183) | isoprostanes (1976) |
| diastolic BP (17,073) | IgG (1041) | tibial speed of sound (1173) | peak expiratory flow (4821) |
| fasting glucose (2977) | interleukin 2 (1679) | vertebral bone mineral density (483) | respiratory rate (17,270) |
| hemoglobin (10,540) | interleukin 5 (1683) | 8-hydroxy-2'-deoxyguanosine (8-OH-dG) (1820) | |
| HDL (2558) | interleukin 6 (1397) | ||
| LDL (2524) | interleukin 10 (1677) | ||
| oxidized LDL (1213) | leukocytes (10,461) | ||
| RMR (1568) | lymphocytes (8538) | ||
| systolic BP (17,080) | neutrophils (8514) | ||
| triglycerides (2898) | tumour necrosis factor alpha (554) | ||
| VO2 max (959) |
(c). Biomarker collection and analysis
We compiled data on 40 biomarkers deriving from the cardiometabolic (n = 14 biomarkers), immune (n = 13), musculoskeletal (n = 6) and other (n = 7) systems (table 1). Most biomarkers were measured by physicians or assistants directly at the time of a medical exam, either in Tsimane villages or at the THLHP clinic in the nearby market town of San Borja. This includes anthropometrics and relatively portable tests (e.g. blood pressure, bone sonometry). Blood samples were collected from consenting individuals and analysed using point-of-care devices or transported to laboratories in Bolivia or the USA for analysis (see electronic supplementary material and table S1 for further details).
Comparative biomarker data on non-human primate species and industrialized human populations derive from Dansereau et al. [17]. See electronic supplementary material, §§2.5 and 2.6 for details.
(d). Data analysis
Data were restricted to adults greater than or equal to 15 years old. The original dataset includes 22 115 patient observations including collection of at least 2 of the biomarkers in table 1 (5658 unique individuals; 49.9% male). Due to our large sample size and extensive number of biomarkers, it would have been cost- and time-prohibitive to measure all biomarkers on everyone. The dataset, therefore, has many missing values.
Our analysis included 40 biomarkers collected between 2002 and 2018 (table 1), many of which showed nonlinear associations with age (electronic supplementary material, figure S1). Variable amounts of data were obtained at the individual level (mean biomarkers per observation = 9.9, range = 2–32). Longitudinal estimates based on sampling 3+ timepoints existed for 3212 individuals (mean observations per person: 6.3, median = 6, range = 1–16), with an average time depth of 7.8 years (max = 15.7 years).
(i). Physiological dysregulation (Dm)
Physiological dysregulation based on the Mahalanobis distance [26] reflects both changing trait values across multiple biomarkers and their correlated structure. Dm is calculated as
where x is a multivariate observation, µ is a vector of population reference means and S is a population covariance matrix of traits (T indicates matrix transpose). We applied a variety of transformations (log, square-root and box-cox) to normalize biomarker values when necessary (electronic supplementary material, table S1), and biomarker values were then standardized by subtracting the mean and dividing by standard deviation. We calculated Dm using all biomarkers.
We set the reference values (μ) as the median of all observations for individuals between the ages of 20 and 45 years old, under the assumption that values for this relatively young age class represent a ‘normal’ or healthy baseline. Similar to previous studies [56], we generated separate baselines for males and females to account for potential sex differences. For further details on the calculation of Dm, see electronic supplementary material, §2.4.
We analysed population-level trends in Dm by fitting multilevel models with a Gaussian error distribution as a function of age, sex and their interaction, adjusting for the number of biomarkers measured and individual effects (random intercept for ID). To investigate within-individual trajectories of physiological dysregulation over time, we restricted the dataset to individuals sampled at 3+ timepoints and refit multilevel models with the inclusion of an additional random slope effect for age.
All analyses were conducted in R v. 3.6.1 [57].
3. Results
(a). Tsimane physiological dysregulation
Dm increased significantly with age at the population level, with a positive quadratic term indicating an increasing rate of change with age (table 2 and figure 1a). Variance does not increase appreciably with age. The quadratic model fitted better than the linear alternative, especially at the oldest ages (figure 1a; electronic supplementary material, figure S3). There is relatively high variance in individual estimates such that some individuals in their 20s have higher Dm than those aged 60+.
Table 2.
Linear mixed-effects models of Dm, with and without quadratic age terms. Values represent coefficients (s.e.). Models include a random intercept for individual to account for subjects with multiple observations. Models were weighted by the number of biomarkers measured for each observation. * = 0.05, ** = 0.01, *** = 0.001.
| model 1 | model 2 | |
|---|---|---|
| age (standardized) | 0.130*** | 0.175*** |
| (0.011) | (0.009) | |
| age2 (standardized) | 0.051*** | |
| (0.007) | ||
| sex (ref = female) | 0.006 | 0.032* |
| (0.017) | (0.014) | |
| number of biomarkers | 0.026*** | 0.024*** |
| (0.001) | (0.001) | |
| age × sex | –0.034* | −0.005 |
| (0.016) | (0.013) | |
| age2 × sex | 0.035** | |
| (0.011) | ||
| intercept | −0.302*** | −0.229*** |
| (0.018) | (0.015) | |
| AICc | 57 566 | 57 697 |
| number of observations | 22 115 | |
Figure 1.
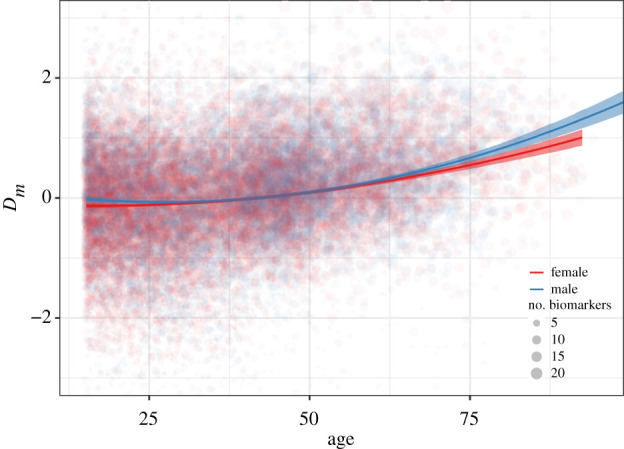
Physiological dysregulation (Dm) as a function of age and sex. Trend lines and confidence intervals are from Model 1 in table 2. Dm was natural log-transformed and standardized. Point size denotes the number of biomarkers measured. The y-axis range is constricted to improve view of the main trends. (Online version in colour.)
The inspection of age profiles for each of the 40 biomarkers revealed heterogeneity in the mean age-related changes. Some biomarkers showed clear age trends (e.g. VO2max, RMR, BMD, neutrophils, C-reactive protein), whereas the majority showed only modest or no age trend (electronic supplementary material, figure S1).
Overall, no single biomarker was highly correlated with Dm. Biomarkers with |r| > 0.2 span across physiological systems: musculoskeletal (radial speed of sound (SOS), calcaneal SOS, vertebral BMD), cardiometabolic (fasting glucose, systolic blood pressure) and immune function (immunoglobulin-G) (electronic supplementary material, figures S4–S6).
In our longitudinal subset, individual age trajectories of Dm were similar to those at the population level (figure 2). In a multilevel model including a random age slope of Dm within-individual, all estimated slopes were positive, indicating increasing Dm with age (figure 2). The variability but not magnitude of individual slopes increased with age (electronic supplementary material, figure S7).
Figure 2.

Individual age trajectories of physiological dysregulation. (a) Predicted values of Dm as a function of age in the longitudinal subset of individuals sampled at 3+ timepoints (n = 3212). Each line represents an individual, with values calculated from a multilevel model with a random slope term for age by individual. (b) Scaled density plot of age slopes for males (mean = 0.195, s.d. = 0.020) and females (mean = 0.182, s.d. = 0.018). No estimated slopes were less than 0. (Online version in colour.)
(b). Physiological dysregulation in humans and other primates
Standardized Tsimane age slopes for Dm (0.17–0.18 Dm s.d. yr−1) were generally lower than for other primates (N = 10) but fell within confidence intervals of primate means (figure 3; [17]). Only chimpanzee males (β = 0.09), orangutan females (β ≤ 0.01) and common marmoset females (β = 0.10) showed lower age slopes than Tsimane. However, most non-human primates had limited sample sizes and relatively wide confidence intervals encompassing Tsimane age trajectories.
Figure 3.

Estimated effects of age on Dm, standardized (a) and unstandardized (b). Non-human primate and industrialized human estimates from Dansereau et al. [17], modified to include Tsimane and an unstandardized scale (b). Points (error bars) represent means (95% CIs). See electronic supplementary material, §2.5 for details. (Online version in colour.)
Unstandardized Tsimane age slopes (Dm yr−1) were substantially lower than all other non-human primates except for male chimpanzees and female orangutans (figure 3). Non-human primate age slopes were approximately 2–12× and 4–12× higher than Tsimane age slopes for females and males, respectively.
(c). Tsimane Mahalanobis distance compared to industrialized populations
Tsimane age slopes were higher than slopes from the Baltimore Longitudinal Study of Aging (BLSA; USA) and from the Invecchiare in Chianti cohort study (InChianti; Italy) for both females (β = 0.18, 95% CI: [0.10, 0.19]) and males (β = 0.17, 95% CI: [0.10, 0.23]) (Set 1 in [17]). Tsimane point estimates of Dm age slopes were 25% and 6% greater, respectively, than females and males in the combined industrialized sample (North American and Italian), although values fell within overlapping 95% confidence intervals. Given no significant interactions between sex and age in either sample, this corresponds with a 15% greater slope for Tsimane (pooled sexes). Similar results were also reported from the Women's Health and Aging Study (WHAS) [18], although non-standardized measures preclude direct comparison.1
(d). Sex differences in physiological dysregulation
Dm was slightly higher for males, but the relationship between age and Dm did not vary by sex in non-quadratic models (figure 1 and table 2). There were minor but significant differences in the pattern of increase with age between the sexes in quadratic models, with male Dm increasing slightly slower than female Dm at younger ages, and then increasing faster than females at older ages (figure 1).
4. Discussion
Our study of physiological dysregulation in a forager-horticulturalist population revealed four key patterns. First, despite variable age trajectories for individual biomarkers, a widely applied composite measure of physiological dysregulation (Dm) increased with age at both the population and individual levels (figures 1 and 2). Second, Dm trajectories in humans, including Tsimane, are slower than those of non-human primates (figure 3). Third, age-related increase in Dm is slightly faster in Tsimane than industrialized populations. Finally, Dm trajectories are roughly similar between Tsimane men and women.
As found elsewhere [38], the increasing age trajectory of Tsimane Dm is nonlinear, accelerating around ages 40–50 years (figure 1). This age profile of physiological dysregulation is consistent with age-related exponential (Gompertz) increases in mortality. Although Dm appears to capture some fundamental aspects of ageing, it is unclear whether Dm is a cause or consequence, or both, of ageing. Dm is not strongly correlated with any individual biomarker (electronic supplementary material, figures S4–S6), suggesting that Dm captures higher order regulatory processes that increasingly depart from a healthy baseline with age. This is consistent with a growing body of literature which identifies Dm as providing a strong signal of systemic physiological dysregulation [17,27,31,36,58].
(a). Physiological dysregulation of humans compared to other primates
A recent analysis of captive primates found that Dm increased with age in all species except for common marmosets [17]. While the standardized (change per s.d. year) Dm age slope for Tsimane was smaller than 16/19 species-by-sex slopes for other primates (figure 3a), Tsimane values were within the range of variation for many non-human primates. Unstandardized estimates (change per year), however, demonstrate that humans experience slower annual increases in Dm with age than other primates (figure 3b). For example, rhesus macaques experience an average increase of 0.064 Dm yr−1, compared to 0.012 for Tsimane. A slower annual Dm increase for humans suggests that Dm age trajectories mirror differences in species-specific lifespan and that increased human lifespan is perhaps facilitated by greater maintenance of regulatory processes with age.
Comparisons of Dm age trajectories with non-human primates are limited by small sample sizes and reflect captive conditions, including controlled feeding and veterinary access [17]. Such benign environments may underestimate age-related changes in Dm. However, Dm age slopes could also be overestimated if mortality selection is relaxed in captivity. Comparable studies in wild primates are needed to assess how controlled conditions affect Dm age trajectories.
(b). Physiological dysregulation across human populations
Standardized age slopes for Dm are slightly higher for Tsimane than Western industrialized populations, but these slopes are more similar to each other than to other primates. These results support the general conclusion that patterns of age-related changes in dysregulation are largely conserved in humans. This result is striking, given the different biomarkers analysed across studies and the divergent ecological and genetic backgrounds of the study populations. Similarities in standardized Dm age profiles across diverse human populations correspond to similar rates of mortality doubling time across populations [59,60].
Our results provide partial support for the hypothesis of an accelerated rate of dysregulation from exposure to relatively harsh environmental conditions, conceptualized here as the combination of high infectious burden and immune activation, minimal access to health infrastructure and habitual strenuous physical labour. This hypothesis was motivated by the notion that cumulative assaults throughout the life course, manifesting as higher mortality at all ages, impair the body's ability to maintain homeostasis [61]. Our findings may, therefore, seem inconsistent with a previous study showing slower rates of intrinsic epigenetic ageing in Tsimane than Americans [62]. However, our focus on Dm measured relative to a younger adult Tsimane baseline, rather than absolute levels of dysregulation, may obscure some population differences. While older Tsimane may be more likely to show aberrant biomarker levels than younger Tsimane, absolute levels might still be ‘healthy’ compared to Western populations where biomarker levels at later ages are more likely to reflect pathophysiological alterations (e.g. insulin resistance, dyslipidaemia, hypertension [63]). Future studies that combine data from multiple populations and compare shared versus population-specific baselines (i.e. [17]) will help illuminate variation in absolute rates of physiological dysregulation.
(c). Sex differences
In principle, sex differences in physiological functioning may arise due to behavioural variability, genetic and other biological differences, or sex-specific environmental exposures. Studies of the mortality–morbidity paradox, i.e. where women are more prone to a variety of illnesses and frailty despite experiencing greater survivorship [46,47], also suggest that physiological dysregulation might differ in level or pace between sexes [32,62,64]. Unlike previous studies which found no difference in Dm trajectories between sexes [17,56] (but see [37]), rates of increase in Dm were slightly higher in Tsimane men compared to women (figure 1 and table 2). A steeper acceleration of Dm in males concords with higher survivorship among Tsimane women at late ages, but the small magnitude of the effect reflects the similar overall trajectories of actuarial ageing and mortality in both sexes [50].
In contrast with previous reports of higher mean Dm in men [56], dysregulation levels did not differ between Tsimane men and women. Sex differences in the mean dysregulation among Tsimane may be minimal because of the high reproductive burden experienced by women (rapid and high fertility coupled with prolonged on-demand breastfeeding). Yet high fertility in other populations (e.g. Utah Mormons) does not appear to reverse the mortality–morbidity paradox [65]. While costs of reproduction may exert effects on specific biomarkers [e.g. 66,67], they may have little bearing on human mortality or physiological dysregulation [52], especially given the propensity for humans to cooperate in raising offspring. Nevertheless, our findings are consistent with the idea that greater sex differences in adult mortality and life expectancy emerge once infectious disease is no longer the main source of mortality, as in high-income countries [45]. Future studies are needed to better interpret the significance of individual heterogeneity in dysregulation trajectories with respect to fertility, morbidity and mortality outcomes.
(d). Study limitations
Direct comparison between studies is complicated because many of the available biomarkers used here differ from those used in previous research on Dm [28]. However, past work indicates that Dm calculations are robust to the choice of biomarkers, especially when using greater than 10–15 biomarkers [27,35]. Indeed, assessing the Dm age slope with our longitudinal subset and with a reduced set of biomarkers produced similar results (not shown).
Another limitation is that we cannot compare absolute levels of dysregulation between populations or species because Dm was measured here relative to population- or species-specific baselines. The use of a common baseline reference in Dm calculations would permit such comparisons. The choice of reference population has been explored in other studies of Dm [17,35] and is a promising avenue for future research.
(e). Conclusions
Although Williams [42] strongly objected to what he deemed ‘the fallacy of identifying senescence with mechanical wear’ (p. 398), few would argue that ageing researchers have nothing to learn from the study of physiological changes with age. Complex systems approaches focusing on meta-processes like physiological dysregulation add to prior studies of changing biomarker levels and cumulative deficits with age. Identifying the casual factors that explain variation in physiological indicators at the organismal level is of primary importance to geroscience and related fields aiming to mitigate chronic disease progression by better understanding the drivers of biological ageing itself rather than those of particular diseases.
Advancing the evolutionary study of ageing will require better integration of theoretical models that address system-wide processes, regulatory feedbacks and adaptive function, and the use of multivariate measures like Dm that consider simultaneous age-related changes in physiological biomarkers. Whether dysregulation represents malfunction due to chronic stressors, or reflects an adaptive compromise in the light of changing physiological needs, conditions, or other aspects of the ageing process itself, remains to be determined [31]. Future research can refine our understanding of the ageing process by disentangling the: (i) direct and additive effects of cellular and tissue ageing; (ii) specific dysregulatory processes, as exemplified by diabetes-related insulin resistance and β-cell dysfunction; and (iii) emergent effects due to the interaction of linked components of physiological systems.
Supplementary Material
Acknowledgements
We thank Tsimane for their generous hospitality and cooperation, and THLHP personnel for years of hard work and dedication.
Endnote
Ethics
Research was approved by institutional review boards at UC Santa Barbara and University of New Mexico, and permissions were obtained from the Gran Consejo Tsimane, community leaders and study participants.
Data accessibility
Individual-level data on biomarkers are not publicly available due to human subjects restrictions. However, composite values of Dm and other variables necessary to recreate the analyses in this paper are available from the Dryad Digital Repository: https://doi.org/10.25349/D9NS4W. Individual-level biomarker data can be shared upon reasonable request.
Authors' contributions
T.S.K. and M.G. conceived the study. T.S.K. wrote the paper, M.G. contributed text and M.G. and J.S. made major revisions. T.S.K. conducted the analyses. H.K., B.C.T., A.R.G., J.S. and M.G. collected the data. B.C.T. and A.R.G. conducted laboratory analyses. All authors contributed ideas and gave final approval for publication.
Competing interests
The authors declare that they have no competing interests.
Funding
This research was supported by NIH/NIA (grant nos RF1AG054442; R01AG024119), NSF (grant nos BCS0136274, BCS0422690). J.S. acknowledges IAST funding from the French National Research Agency (ANR) under the Investments for the Future (Investissements d'Avenir) program, grant no. ANR-17-EURE-0010.
References
- 1.Austad S, Fischer KE. 1992. Primate longevity: its place in the mammalian scheme. Am. J. Primatol. 28, 251–261. ( 10.1002/ajp.1350280403) [DOI] [PubMed] [Google Scholar]
- 2.Charnov E, Berrigan D. 1993. Why do female primates have such long lifespans and so few babies? Or life in the slow lane. Evol. Anthropol. 1, 191–194. ( 10.1002/evan.1360010604) [DOI] [Google Scholar]
- 3.Kaplan HS, Hill K, Lancaster J, Hurtado AM. 2000. A theory of human life history evolution: diet, intelligence, and longevity. Evol. Anthropol. 9, 156–185. ( 10.1002/1520-6505(2000)9:4<156::AID-EVAN5>3.0.CO;2-7) [DOI] [Google Scholar]
- 4.Schuppli C, Graber SM, Isler K, van Schaik CP. 2016. Life history, cognition and the evolution of complex foraging niches. J. Hum. Evol. 92, 91–100. ( 10.1016/j.jhevol.2015.11.007) [DOI] [PubMed] [Google Scholar]
- 5.Hawkes K, Coxworth JE. 2013. Grandmothers and the evolution of human longevity: a review of findings and future directions. Evol. Anthropol. Issues News Rev. 22, 294–302. ( 10.1002/evan.21382) [DOI] [PubMed] [Google Scholar]
- 6.Bronikowski AM, et al. 2011. Aging in the natural world: comparative data reveal similar mortality patterns across primates. Science 331, 1325–1328. ( 10.1126/science.1201571) [DOI] [PMC free article] [PubMed] [Google Scholar]
- 7.Ricklefs RE, Wikelski M. 2002. The physiology/life-history nexus. Trends Ecol. Evol. 17, 462–468. ( 10.1016/S0169-5347(02)02578-8) [DOI] [Google Scholar]
- 8.Hawkes K. 2003. Grandmothers and the evolution of human longevity. Am. J. Hum. Biol. 15, 380–400. ( 10.1002/ajhb.10156) [DOI] [PubMed] [Google Scholar]
- 9.Holliday R. 2004. The multiple and irreversible causes of aging. J. Gerontol. Biol. Sci. 59A, 568–572. ( 10.1093/gerona/59.6.B568) [DOI] [PubMed] [Google Scholar]
- 10.Barja G, Herrero A. 2000. Oxidative damage to mitochondrial DNA is inversely related to maximum life span in the heart and brain of mammals. FASEB J. 14, 312–318. ( 10.1096/fasebj.14.2.312) [DOI] [PubMed] [Google Scholar]
- 11.Hayflick L. 2007. Biological aging is no longer an unsolved problem. Ann. N. Y. Acad. Sci. 1100, 1–13. ( 10.1196/annals.1395.001) [DOI] [PubMed] [Google Scholar]
- 12.Tolmasoff JM, Ono T, Cutler RG. 1980. Superoxide dismutase: correlation with life-span and specific metabolic rate in primate species. Proc. Natl Acad. Sci. USA 77, 2777–2781. ( 10.1073/pnas.77.5.2777) [DOI] [PMC free article] [PubMed] [Google Scholar]
- 13.Hart RW, Setlow RB. 1974. Correlation between deoxyribonucleic acid excision repair and life span in a number of mammalian species. Proc. Natl Acad. Sci. USA 71, 2169–2173. ( 10.1073/pnas.71.6.2169) [DOI] [PMC free article] [PubMed] [Google Scholar]
- 14.Blevins JK, Coxworth JE, Herndon JG, Hawkes K. 2013. Adrenal androgens and aging: female chimpanzees (Pan troglodytes) compared with women. Am. J. Phys. Anthropol. 151, 643–648. ( 10.1002/ajpa.22300) [DOI] [PMC free article] [PubMed] [Google Scholar]
- 15.Gurven MD, Stieglitz J, Hooper PL, Gomes C, Kaplan HS. 2012. From the womb to the tomb: the role of transfers in shaping the evolved human life history. Exp. Gerontol. 47, 807–813. ( 10.1016/j.exger.2012.05.006) [DOI] [PMC free article] [PubMed] [Google Scholar]
- 16.Kaplan HS, Gurven MD, Winking J, Hooper PL, Stieglitz J. 2010. Learning, menopause, and the human adaptive complex. Ann. N. Y. Acad. Sci. 1204, 30–42. ( 10.1111/j.1749-6632.2010.05528.x) [DOI] [PubMed] [Google Scholar]
- 17.Dansereau G, Wey TW, Legault V, Brunet MA, Kemnitz JW, Ferrucci L, Cohen AA. 2019. Conservation of physiological dysregulation signatures of aging across primates. Aging Cell 18, e12925 ( 10.1111/acel.12925) [DOI] [PMC free article] [PubMed] [Google Scholar]
- 18.Cohen AA, Milot E, Li Q, Legault V, Fried LP, Ferrucci L. 2014. Cross-population validation of statistical distance as a measure of physiological dysregulation during aging. Exp. Gerontol. 57, 203–210. ( 10.1016/j.exger.2014.04.016) [DOI] [PMC free article] [PubMed] [Google Scholar]
- 19.Eaton SB, Konner MJ, Shostak M. 1988. Stone agers in the fast lane: chronic degenerative diseases in evolutionary perspective. Am. J. Med. 84, 739–749. ( 10.1016/0002-9343(88)90113-1) [DOI] [PubMed] [Google Scholar]
- 20.Kaeberlein M, Rabinovitch PS, Martin GM. 2015. Healthy aging: the ultimate preventative medicine. Science 350, 1191–1193. ( 10.1126/science.aad3267) [DOI] [PMC free article] [PubMed] [Google Scholar]
- 21.Gaillard JM, Lemaître JF. 2019. An aging phenotype in the wild. Science 365, 1244–1245. ( 10.1126/science.aay9493) [DOI] [PubMed] [Google Scholar]
- 22.Cohen AA, Martin LB, Wingfield JC, McWilliams SR, Dunne JA. 2012. Physiological regulatory networks: ecological roles and evolutionary constraints. Trends Ecol. Evol. 27, 428–435. ( 10.1016/j.tree.2012.04.008) [DOI] [PubMed] [Google Scholar]
- 23.Lipsitz LA. 2004. Physiological complexity, aging, and the path to frailty. Sci. Aging Knowl. Environ. 2004, e16 ( 10.1126/sageke.2004.16.pe16) [DOI] [PubMed] [Google Scholar]
- 24.Cohen AA, et al. 2015. Detection of a novel, integrative aging process suggests complex physiological integration. PLoS ONE 10, e0116489 ( 10.1371/journal.pone.0122541) [DOI] [PMC free article] [PubMed] [Google Scholar]
- 25.Johnson TE. 2006. Recent results: biomarkers of aging. Exp. Gerontol. 41, 1243–1246. ( 10.1016/j.exger.2006.09.006) [DOI] [PubMed] [Google Scholar]
- 26.Mahalanobis P. 1936. Mahalanobis distance. Proc. Natl Inst. Sci. India 49, 234–256. [Google Scholar]
- 27.Cohen AA, Milot E, Yong J, Seplaki CL, Fülöp T, Bandeen-Roche K, Fried LP. 2013. A novel statistical approach shows evidence for multi-system physiological dysregulation during aging. Mech. Ageing Dev. 134, 110–117. ( 10.1016/j.mad.2013.01.004) [DOI] [PMC free article] [PubMed] [Google Scholar]
- 28.Belsky DW, et al. 2017. Eleven telomere, epigenetic clock, and biomarker-composite quantifications of biological aging: do they measure the same thing? Am. J. Epidemiol. 187, 1220–1230. ( 10.1101/071373) [DOI] [PMC free article] [PubMed] [Google Scholar]
- 29.McEwen BS. 1998. Stress, adaptation, and disease: allostasis and allostatic load. Ann. N. Y. Acad. Sci. 840, 33–44. ( 10.1111/j.1749-6632.1998.tb09546.x) [DOI] [PubMed] [Google Scholar]
- 30.Seplaki CL, Goldman N, Glei D, Weinstein M. 2005. A comparative analysis of measurement approaches for physiological dysregulation in an older population. Exp. Gerontol. 40, 438–449. ( 10.1016/j.exger.2005.03.002) [DOI] [PubMed] [Google Scholar]
- 31.Cohen AA. 2016. Complex systems dynamics in aging: new evidence, continuing questions. Biogerontology 17, 205–220. ( 10.1007/s10522-015-9584-x) [DOI] [PMC free article] [PubMed] [Google Scholar]
- 32.Arbeev KG, Ukraintseva SV, Akushevich I, Kulminski AM, Arbeeva LS, Akushevich L, Culminskaya IV, Yashin AI. 2011. Age trajectories of physiological indices in relation to healthy life course. Mech. Ageing Dev. 132, 93–102. ( 10.1016/j.mad.2011.01.001) [DOI] [PMC free article] [PubMed] [Google Scholar]
- 33.Franceschi C, Bonafè M, Valensin S, Olivieri F, De Luca M, Ottaviani E, De Benedictis G. 2000. Inflamm-aging: an evolutionary perspective on immunosenescence. Ann. N. Y. Acad. Sci. 908, 244–254. ( 10.1111/j.1749-6632.2000.tb06651.x) [DOI] [PubMed] [Google Scholar]
- 34.Medvedev ZA. 1990. An attempt at a rational classification of theories of ageing. Biol. Rev. Camb. Philos. Soc. 65, 375–398. ( 10.1111/j.1469-185X.1990.tb01428.x) [DOI] [PubMed] [Google Scholar]
- 35.Cohen AA, Li Q, Milot E, Leroux M, Faucher S, Morissette-Thomas V, Legault V, Fried LP, Ferrucci L. 2015. Statistical distance as a measure of physiological dysregulation is largely robust to variation in its biomarker composition. PLoS ONE 10, e0122541 ( 10.1371/journal.pone.0122541) [DOI] [PMC free article] [PubMed] [Google Scholar]
- 36.Milot E, Cohen AA, Vézina F, Buehler DM, Matson KD, Piersma T. 2014. A novel integrative method for measuring body condition in ecological studies based on physiological dysregulation. Methods Ecol. Evol. 5, 146–155. ( 10.1111/2041-210X.12145) [DOI] [Google Scholar]
- 37.Arbeev KG, et al. 2016. Optimal versus realized trajectories of physiological dysregulation in aging and their relation to sex-specific mortality risk. Front. Public Health 4, 3 ( 10.3389/fpubh.2016.00003) [DOI] [PMC free article] [PubMed] [Google Scholar]
- 38.Milot E, Morissette-Thomas V, Li Q, Fried LP, Ferrucci L, Cohen AA. 2014. Trajectories of physiological dysregulation predicts mortality and health outcomes in a consistent manner across three populations. Mech. Ageing Dev. 141–142, 56–63. ( 10.1016/j.mad.2014.10.001) [DOI] [PMC free article] [PubMed] [Google Scholar]
- 39.Li Q, Wang S, Milot E, Bergeron P, Ferrucci L, Fried LP, Cohen AA. 2015. Homeostatic dysregulation proceeds in parallel in multiple physiological systems. Aging Cell 14, 1103–1112. ( 10.1111/acel.12402) [DOI] [PMC free article] [PubMed] [Google Scholar]
- 40.Gurven MD, Kaplan HS, Winking J, Finch C, Crimmins E. 2008. Aging and inflammation in two epidemiological worlds. J. Gerontol. Biol. Sci. 63A, 196–199. ( 10.1093/gerona/63.2.196) [DOI] [PMC free article] [PubMed] [Google Scholar]
- 41.Crimmins EM, Finch CE. 2006. Infection, inflammation, height, and longevity. Proc. Natl Acad. Sci. USA 103, 498–503. ( 10.1073/pnas.0501470103) [DOI] [PMC free article] [PubMed] [Google Scholar]
- 42.Williams GC. 1957. Pleiotropy, natural selection and the evolution of senescence. Evolution 11, 398–411. ( 10.1111/j.1558-5646.1957.tb02911.x) [DOI] [Google Scholar]
- 43.Austad S. 2006. Why women live longer than men: sex differences in longevity. Gend. Med. 3, 79–92. ( 10.1016/S1550-8579(06)80198-1) [DOI] [PubMed] [Google Scholar]
- 44.Gaillard JM, Lemaître J. 2017. The Williams' legacy: a critical reappraisal of his nine predictions about the evolution of senescence. Evolution 71, 2768–2785. ( 10.1111/evo.13379) [DOI] [PubMed] [Google Scholar]
- 45.Beltrán-Sánchez H, Finch CE, Crimmins EM. 2015. Twentieth century surge of excess adult male mortality. Proc. Natl Acad. Sci. USA 112, 8993–8998. ( 10.1073/pnas.1421942112) [DOI] [PMC free article] [PubMed] [Google Scholar]
- 46.Wingard DL. 1984. The sex differential in morbidity, mortality, and lifestyle. Annu. Rev. Public Health 5, 433–458. ( 10.1146/annurev.pu.05.050184.002245) [DOI] [PubMed] [Google Scholar]
- 47.Gordon EH, Peel NM, Samanta M, Theou O, Howlett SE, Hubbard RE. 2017. Sex differences in frailty: a systematic review and meta-analysis. Exp. Gerontol. 89, 30–40. ( 10.1016/j.exger.2016.12.021) [DOI] [PubMed] [Google Scholar]
- 48.Viña J, Sastre J, Pallardó FV, Gambini J, Borrás C. 2006. Role of mitochondrial oxidative stress to explain the different longevity between genders. Protective effect of estrogens. Free Radic. Res. 40, 1359–1365. ( 10.1080/10715760600952851) [DOI] [PubMed] [Google Scholar]
- 49.Nakamura E, Miyao K. 2008. Sex differences in human biological aging. J. Gerontol. Ser. A 63, 936–944. ( 10.1093/gerona/63.9.936) [DOI] [PubMed] [Google Scholar]
- 50.Gurven MD, Kaplan HS, Zelada Supa A. 2007. Mortality experience of Tsimane Amerindians: regional variation and temporal trends. Am. J. Hum. Biol. 19, 376–398. ( 10.1002/ajhb.20600) [DOI] [PubMed] [Google Scholar]
- 51.Stieglitz J, Trumble BC, Finch CE, Dong L, Budoff MJ, Kaplan H, Gurven MD. 2019. Computed tomography shows high fracture prevalence among physically active forager-horticulturalists with high fertility. eLife 8, e48607 ( 10.7554/eLife.48607) [DOI] [PMC free article] [PubMed] [Google Scholar]
- 52.Gurven MD, Costa M, Trumble B, Stieglitz J, Beheim B, Eid Rodriguez D, Hooper PL, Kaplan HS. 2016. Health costs of reproduction are minimal despite high fertility, mortality and subsistence lifestyle. Nat. Sci. Rep. 6, 30056. [DOI] [PMC free article] [PubMed] [Google Scholar]
- 53.Gurven MD, Stieglitz J, Trumble B, Blackwell AD, Beheim B, Davis H, Hooper PL, Kaplan HS. 2017. The Tsimane Health and Life History Project: integrating anthropology and biomedicine. Evol. Anthropol. 26, 54–73. ( 10.1002/evan.21515) [DOI] [PMC free article] [PubMed] [Google Scholar]
- 54.Blackwell AD, Martin M, Kaplan HS, Gurven MD. 2013. Antagonism between two intestinal parasites in humans: the importance of co-infection for infection risk and recovery dynamics. Proc. R. Soc. B 280, 20131671 ( 10.1098/rspb.2013.1671) [DOI] [PMC free article] [PubMed] [Google Scholar]
- 55.Kaplan HS, et al. 2017. Coronary atherosclerosis in indigenous South American Tsimane: a cross-sectional cohort study. Lancet 389, 1730–1739. ( 10.1016/S0140-6736(17)30752-3) [DOI] [PMC free article] [PubMed] [Google Scholar]
- 56.Cohen AA, Legault V, Li Q, Fried LP, Ferrucci L. 2018. Men sustain higher dysregulation levels than women without becoming frail. J. Gerontol. Ser. A 73, 175–184. ( 10.1093/gerona/glx146) [DOI] [PMC free article] [PubMed] [Google Scholar]
- 57.R Core Team. 2019. R: a language and environment for statistical computing. Vienna, Austria: R Foundation for Statistical Computing; https://www.R-project.org/. [Google Scholar]
- 58.Arbeev KG, Ukraintseva SV, Bagley O, Zhbannikov IY, Cohen AA, Kulminski AM, Yashin AI. 2019. ‘Physiological dysregulation’ as a promising measure of robustness and resilience in studies of aging and a new indicator of preclinical disease. J. Gerontol. Ser. A 74, 462–468. ( 10.1093/gerona/gly136) [DOI] [PMC free article] [PubMed] [Google Scholar]
- 59.Gurven MD, Kaplan HS. 2007. Longevity among hunter-gatherers: a cross-cultural comparison. Popul. Dev. Rev. 33, 321–365. ( 10.1111/j.1728-4457.2007.00171.x) [DOI] [Google Scholar]
- 60.Finch CE. 1994. Longevity, senescence, and the genome. Chicago, IL: University of Chicago Press. [Google Scholar]
- 61.McEwen BS. 2003. Interacting mediators of allostasis and allostatic load: towards an understanding of resilience in aging. Metabolism 52, 10–16. ( 10.1016/S0026-0495(03)00295-6) [DOI] [PubMed] [Google Scholar]
- 62.Horvath S, et al. 2016. An epigenetic clock analysis of race/ethnicity, sex, and coronary heart disease. Genome Biol. 17, 171 ( 10.1186/s13059-016-1030-0) [DOI] [PMC free article] [PubMed] [Google Scholar]
- 63.Furman D, et al. 2019. Chronic inflammation in the etiology of disease across the life span. Nat. Med. 25, 1822–1832. ( 10.1038/s41591-019-0675-0) [DOI] [PMC free article] [PubMed] [Google Scholar]
- 64.Giefing-Kröll C, Berger P, Lepperdinger G, Grubeck-Loebenstein B. 2015. How sex and age affect immune responses, susceptibility to infections, and response to vaccination. Aging Cell 14, 309–321. ( 10.1111/acel.12326) [DOI] [PMC free article] [PubMed] [Google Scholar]
- 65.Lindahl-Jacobsen R, Hanson HA, Oksuzyan A, Mineau GP, Christensen K, Smith KR. 2013. The male-female health-survival paradox and sex differences in cohort life expectancy in Utah, Denmark, and Sweden 1850–1910. Ann. Epidemiol. 23, 161–166. ( 10.1016/j.annepidem.2013.02.001) [DOI] [PMC free article] [PubMed] [Google Scholar]
- 66.Stieglitz J, Beheim BA, Trumble BC, Madimenos FC, Kaplan HS, Gurven MD. 2015. Low mineral density of a weight-bearing bone among adult women in a high fertility population. Am. J. Phys. Anthropol. 156, 637–648. ( 10.1002/ajpa.22681) [DOI] [PMC free article] [PubMed] [Google Scholar]
- 67.Ziomkiewicz A, Sancilio A, Galbarczyk A, Klimek M, Jasienska G, Bribiescas RG. 2016. Evidence for the cost of reproduction in humans: high lifetime reproductive effort is associated with greater oxidative stress in post-menopausal women. PLoS ONE 11, e0145753 ( 10.1371/journal.pone.0145753) [DOI] [PMC free article] [PubMed] [Google Scholar]
Associated Data
This section collects any data citations, data availability statements, or supplementary materials included in this article.
Supplementary Materials
Data Availability Statement
Individual-level data on biomarkers are not publicly available due to human subjects restrictions. However, composite values of Dm and other variables necessary to recreate the analyses in this paper are available from the Dryad Digital Repository: https://doi.org/10.25349/D9NS4W. Individual-level biomarker data can be shared upon reasonable request.