Abstract
Mitochondria take up Ca2+ through the mitochondrial calcium uniporter complex to regulate energy production, cytosolic Ca2+ signaling, and cell death1,2. In mammals, the uniporter complex (uniplex) contains four core components: the pore-forming MCU, gatekeeper MICU1 and MICU2, and an auxiliary EMRE subunit essential for Ca2+ transport3–8. To prevent detrimental Ca2+ overload, the activity of MCU must be tightly regulated by MICUs, which sense the changes in cytosolic Ca2+ concentrations to switch MCU on and off9,10. Here, we report cryo-EM structures of human mitochondrial calcium uniporter holocomplex in inhibited and Ca2+-activated states. These structures define the architecture of this multi-component Ca2+ uptake machinery and reveal the gating mechanism by which MICUs control uniporter activity. This work provides a framework for understanding regulated Ca2+ uptake in mitochondria and lends clues to modulate uniporter activity for treating mitochondrial Ca2+ overload-related diseases.
The uniporter stays quiescent in resting cellular conditions and becomes activated only when local Ca2+ levels rise above ~1 μM11,12 This Ca2+-dependent activation, mediated by a MICU1-MICU2 heterodimer13,14, prevents excessive Ca2+ influx that can increase mitochondrial oxidative stress15 and trigger apoptosis1. Mutations that perturb MICU1’s regulatory function have been linked to debilitating neuromuscular diseases in humans16,17. Recent breakthroughs have advanced our understanding of the composition, function, and regulation of the uniplex9,10,18–32, but the structural basis underlying MICU control of the uniporter remains unclear. Here, we determined the structures of the human uniplex in low/high-Ca2+ conditions using single-particle cryo-electron microscopy (cryo-EM). Combined with functional analyses, our work reveals the molecular mechanisms by which intracellular Ca2+ signals control mitochondrial Ca2+ uptake.
Structural determination
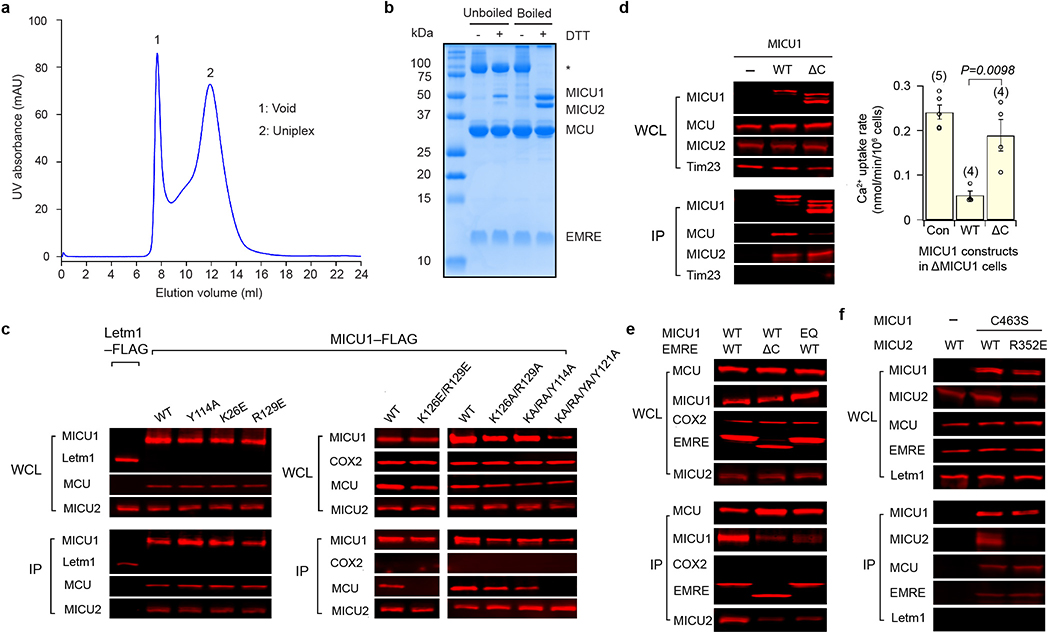
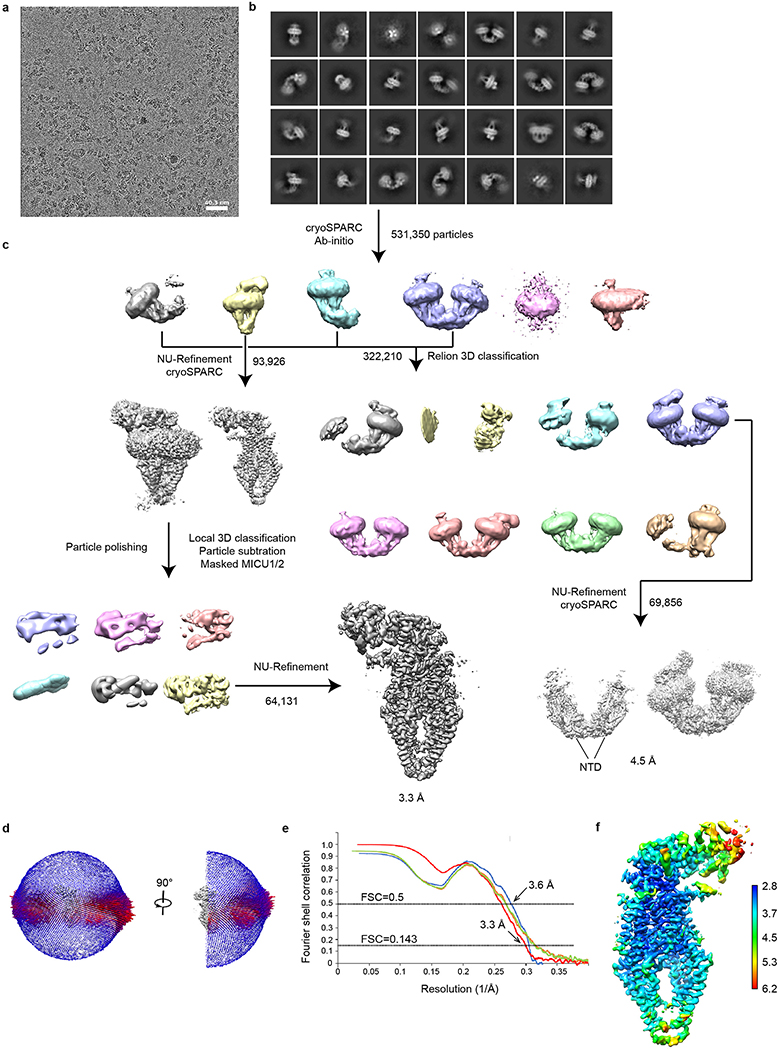
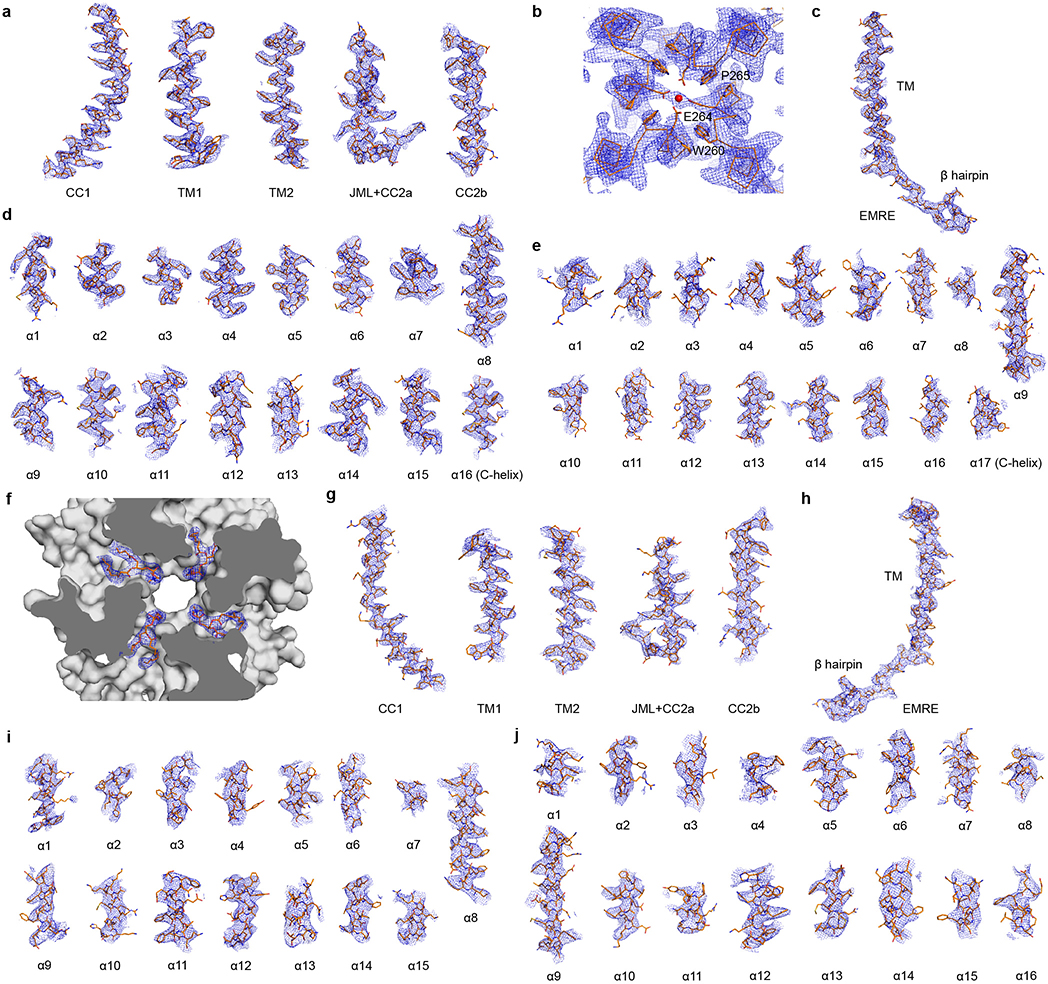
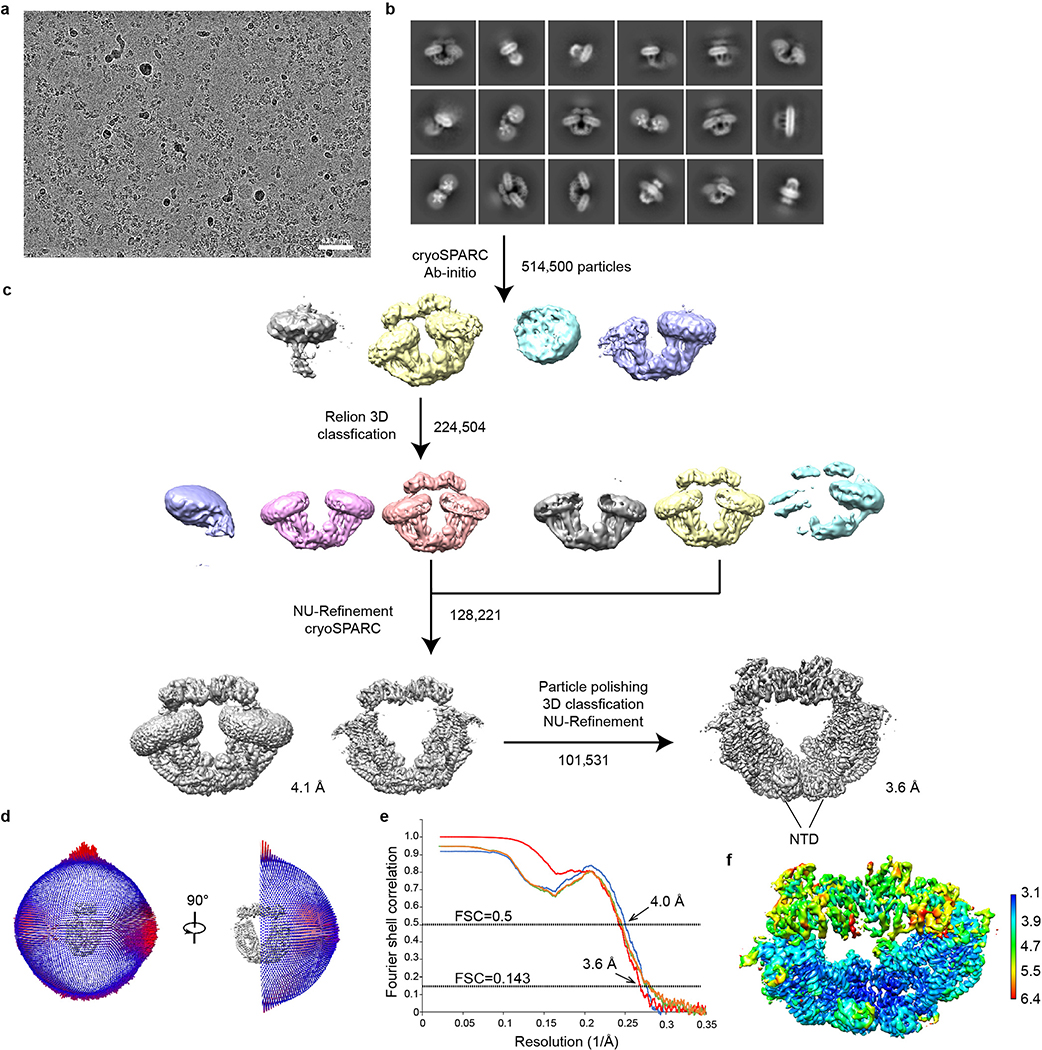
Purified human uniplex showed excellent biochemical behaviour with MICU1 and MICU2 connected by a disulfide (Extended Data Fig. 1a, b), recapitulating their reported properties13,14. Cryo-EM revealed two main particle species in low Ca2+ (5 mM EGTA, no added Ca2+): uniplex monomer and a “V”-shaped dimer (Extended Data Fig. 2), whose equivalent parts superimpose well onto each other. The monomer yielded a substantially higher-resolution map (3.3 Å) (Extended Data Fig. 3a–f), therefore becoming the focus of subsequent analyses. Consistent with previous studies24,27, the N-terminal domain (NTD) of MCU is well resolved in the uniplex dimer but not monomer. In high Ca2+ (2 mM), particles are predominantly dimers (Extended Data Fig. 4), with ~57% containing all four subunits and ~43% without visible density of MICU1-MICU2, which might dissociate during protein purification or grid preparation. The best classes containing all subunits yielded a 3.6 Å map (Extended Data Fig. 3g–j), corresponding to uniplex dimer with well-resolved NTDs. Attempts to reconstitute purified uniplex into liposomes were hindered by difficulties removing the LMNG detergent. Well-established, HEK cell-based mitochondrial Ca2+ uptake assays8,18 were therefore employed to validate the structures.
Overall structure and pore in low Ca2+
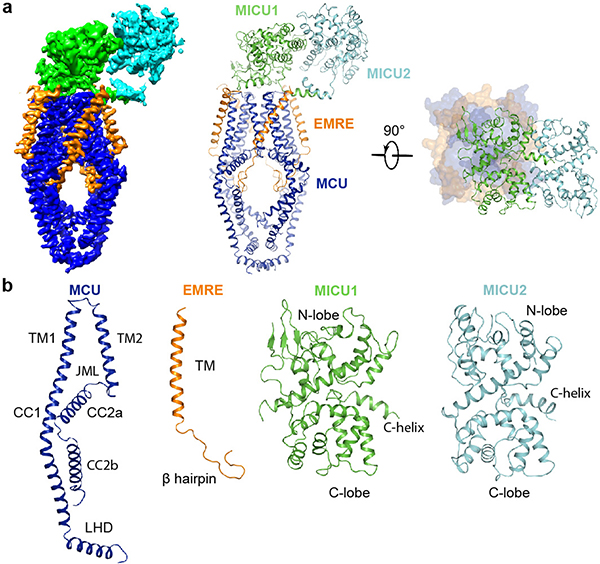
The structure determined in low Ca2+ reveals a 4:4:1:1 stoichiometry of MCU, EMRE, MICU1, and MICU2 (Fig. 1). MCU tetramerizes to form a Ca2+-conducting pore with EMREs attached to its periphery around a central approximate four-fold symmetry axis. MICU1 forms an extensive interacting surface with MCU to seal the pore’s intermembrane space (IMS) entrance, while MICU2 binds to MICU1 from the side without contacting MCU (Fig. 1a). Thus, the uniplex has an overall shape of an inverted “L”.
Figure 1 |. Overall structure of the human uniplex in low-Ca2+ conditions.
a, Architecture of the uniplex. Cryo-EM map (left) and ribbon representation (middle) are viewed from membrane. On the right, uniplex (MCU-EMRE, surface; MICU1-MICU2, ribbon) is viewed from the top. b, Domain organization of MCU, EMRE, MICU1, and MICU2.
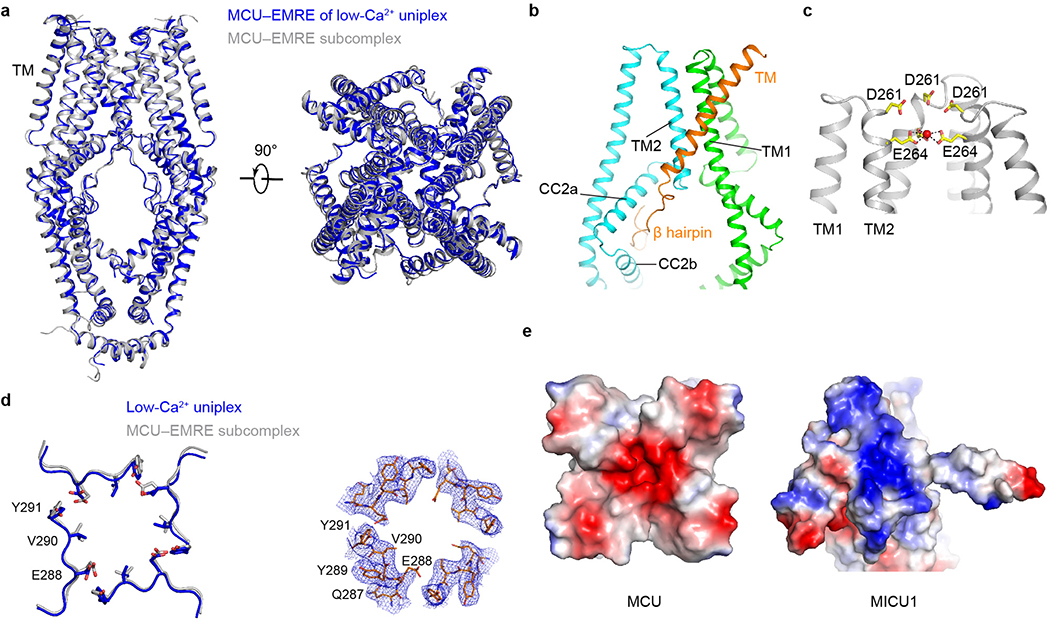
The uniplex’s transmembrane (TM) portion superimposes well onto the published MCU-EMRE subcomplex structure27 (Extended Data Fig. 5a). EMRE makes three contact sites with MCU’s TM1, TM2, and CC2 (Extended Data Fig. 5b). The IMS entrance of the MCU pore is formed by four D261 residues. One helical turn down is a glutamate ring that mediates high-affinity Ca2+ binding (Extended Data Fig. 5c). An extra density, possibly a cation, lies at the center of this ring (Extended Data Fig. 3b). The matrix end of the pore, presumably gated by EMRE via MCU’s juxtamembrane loop27, is wide open (Extended Data Fig. 5d). Densities consistent with lipids lie at the fenestration24 between TM1 and TM2 without blocking the pore (Extended Data Fig. 3f). Importantly, the overall pore structure in the full uniplex is virtually identical to that in the MICU-free, MCU-EMRE subcomplex27 (Extended Data Fig. 5a, d), indicating that MICU-dependent gating does not require substantial conformational changes inside the pore.
MCU-MICU1 interface in low Ca2+
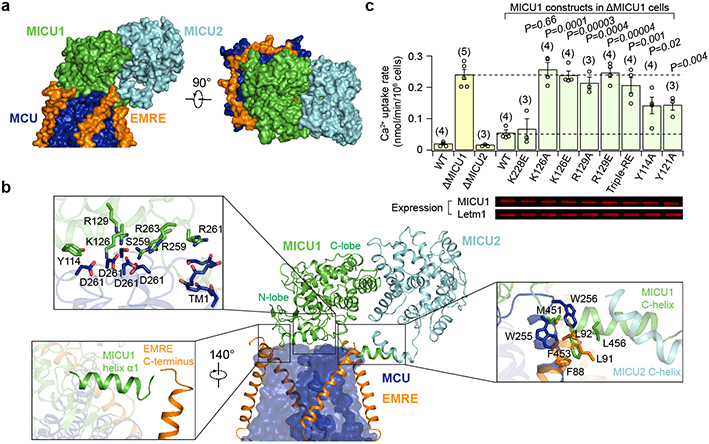
One striking feature of the uniplex is the 4:1 MCU:MICU1 stoichiometry. Such symmetry mismatch allows an MCU tetramer to devote its entire IMS surface to bind a single MICU1 (Fig. 2a). The relatively flat bottom of MICU1’s N-lobe docks directly onto the flat IMS surface of MCU so that a Lys/Arg ring (K126, R129, R259, R261, and R263) of MICU1 forms a cap to seal the D261 ring at the MCU pore entrance (Fig. 2b). All D261 residues are engaged in electrostatic interactions with K/R ring residues (Extended Data Fig. 5e), explaining previous findings that MICU1 binding to MCU is sensitive to ionic strength and can be abolished by the D261A mutation22. Several additional contacts appear to stabilize MCU-MICU1 interactions (Fig. 2b): (1) Y114 in MICU1 forms a hydrogen bond with D261 in MCU, (2) R129 and R263 in MICU1 contact MCU’s S259, a residue important for MICU1 binding22, (3) Y121 in MICU1 forms hydrophobic/π-stacking interactions with Y258 and I262 in MCU, and (4) R261 of MICU1 interacts with the helix dipole of TM1.
Figure 2 |. Interface between MICU1-MICU2 and MCU-EMRE in low-Ca2+ conditions.
a, Uniplex surface representation. CC and LHD domains of MCU and N-terminal part of EMRE are omitted for clarity. b, Uniplex subunit interfaces. MCU is shown as surface (blue). EMRE, MICU1, and MICU2 are shown as ribbons. Boxed panels show zoomed-in view of contact areas. c, Effects of MCU-MICU1 interfacial mutations on mitochondrial Ca2+ uptake in low Ca2+ (300 nM). Yellow bars compare WT, MICU1-KO (ΔMICU1), and MICU2-KO (ΔMICU2) cells. Green bars compare various MICU1 constructs in MICU1-KO cells. MICU1 expression was adjusted to similar levels as in Western images (Letm1: loading control; 3 independent experiments were performed with similar results). Data are presented as mean +/− S.E.M. Numbers in the parenthesis represent numbers of biologically independent experiments. Triple-RE: R259E-R261E-R263E. Two-tailed t-test was used to compare the ability of WT-MICU1 and MICU1 mutants to gate MCU (P values provided on the bar chart). For gel source data, see Supplementary Fig. 1.
We performed co-immunoprecipitation (CoIP) to validate this MCU-MICU1 interface. Although K126E or R129E alone in MICU1 was insufficient to perturb MCU binding, the K126E-R129E double mutation did strongly destabilize the MCU-MICU1 complex (Extended data Fig. 1c). The K126A-R129A mutant still binds MCU (Extended data Fig. 1c), consistent with presumably less disruptive effects of Ala substitution on electrostatic interactions with MCU’s D261. Adding Y114A and Y121A mutations to the K126A-R129A mutant abolished interactions with MCU (Extended data Fig. 1c), reflecting their contributions to the MCU-MICU1 interface.
In addition to the major MCU-MICU1 interface, the N-terminal end of MICU1’s C-terminal helix directly interacts with MCU and EMRE through hydrophobic interactions (Fig. 2b). As this amphiphilic helix parallels the membrane surface, it might also facilitate interactions with MCU via membrane anchoring. Indeed, C-helix truncation substantially weakens MICU1’s interaction with MCU but not MICU2 (Extended data Fig. 1d). Finally, the N-terminus of MICU1’s helix α1 contacts the C-terminus of another EMRE (Fig. 2b). Thus, their immediate neighbouring KKKKR (“polybasic sequence”) of MICU1 and EMRE’s C-terminal poly-aspartate tail, although unresolved, are within range for direct interaction, as proposed in a previous study18. This MICU1-EMRE interaction plays important roles in uniplex stability, as truncating EMRE’s C-terminus or mutating MICU1’s polybasic sequence facilitates MICU1 dissociation from the MCU-EMRE subcomplex (Extended data Fig. 1e). Together, these results unveil multiple molecular contacts that facilitate and stabilize the docking of MICU1 on MCU in low-Ca2+, resting cellular conditions.
Molecular mechanisms of Ca2+ activation
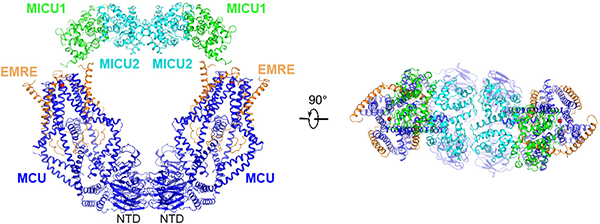
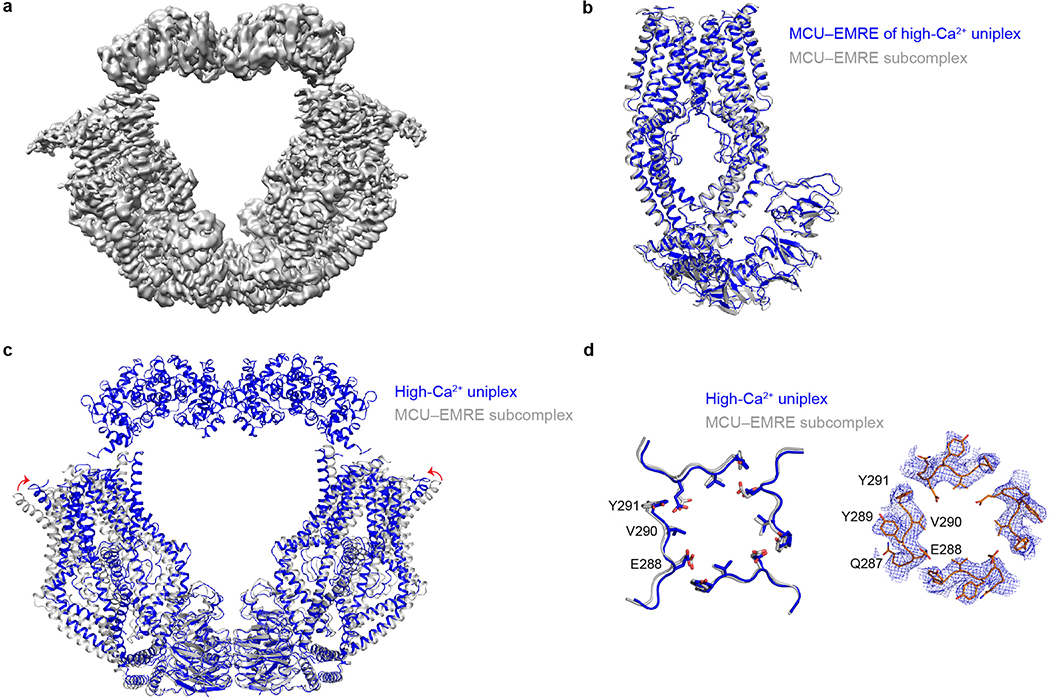
The uniplex structure in low Ca2+ suggests that MICU1 uses its K/R ring to seal the MCU pore. To further understand how Ca2+ activates the channel, we determined the cryo-EM structure of the uniplex in 2-mM Ca2+. The “O”-shaped complex has identical subunit stoichiometry ratio as the uniplex in low Ca2+, containing a “V”-shaped dimer of MCU-EMRE tetramers with two MICU1-MICU2 heterodimers arching over the top (Fig. 3, Extended Data Fig. 6a). The V-shaped dimer is similar to that observed in the MCU-EMRE subcomplex structure27, except that the two tetramers rotate slightly against MCU’s NTD, so that the top of the tetramers moves ~7 Å closer (Extended Data Fig. 6b–d). The relative flexibility between NTD and the remaining parts of MCU likely facilitates this rotation. The MCU pore assumes a conformation essentially identical to the low-Ca2+ state, with a putative Ca2+ density in the Glu-ring and the presumed JML luminal gate fully open.
Figure 3 |. Uniplex structure in high-Ca2+ conditions.
Overall structure of high-Ca2+ uniplex is shown in ribbon representation. Red sphere represents Ca2+.
The most striking feature of the uniplex in high Ca2+ is that MICU1 no longer covers the pore; instead, it moves to the edge of the MCU-EMRE tetramer, losing most of its interactions with MCU (Fig. 3). This suggests that Ca2+ activates the uniporter by removing MICU1 from the MCU surface to open the pore. Such mechanism predicts that mutations in MICU1’s K/R ring might disrupt the tight sealing to allow Ca2+ to leak into the pore, thus reducing MICU1’s ability to shut MCU in low-Ca2+ conditions. We tested this hypothesis using a quantitative 45Ca2+ flux assay. MICU1-KO, but not MICU2-KO, induced massive Ca2+ leakage into mitochondria (Fig. 2c), consistent with recent studies19,20 and the structural observation that MICU1 but not MICU2 seals the MCU pore. WT MICU1 or a control mutant (K228E, distal from the interface) strongly inhibited the uniporter (Fig. 2c). In contrast, mutations targeting the K/R ring, K126A/E, R129A/E, and R259E-R261E-R263E, eliminated MICU1’s inhibitory function (Fig. 2c). Alanine substitutions of Y114 or Y121 compromised MICU1 regulation to a lesser degree, reflecting their indirect roles in shutting MCU via facilitating MICU1 binding and positioning the K/R ring. These results confirm the critical role of MCU-MICU1 interfacial residues in Ca2+-dependent, MICU1-mediated gating. Finally, truncating MICU1’s C-helix reduced MICU1 functionality (Extended data Fig. 1d), consistent with C-helix stabilizing MCU-MICU1 interactions.
In the high-Ca2+ structure, MICU1 loses interactions with MCU’s IMS surface, relying on limited contacts with EMRE to stay within the uniplex. Specifically, EMRE’s C-terminus contacts the N-terminal end of MICU1’s helix α1, so that EMRE’s poly-aspartate tail and MICU1’s polybasic region before helix α1, although unresolved, can directly interact. The structure also implicates a tangential contact between the C-terminus of another EMRE and the N-terminal end of MICU1’s helix α10, although limited local resolution precludes resolving specific side-chain interactions. CoIP showed that raising Ca2+ strongly facilitated MICU1 dissociation from the uniplex, but a considerable portion of MICU1 stayed bound (Extended Data Fig. 7a), consistent with a much-reduced MICU1 interacting surface with MCU-EMRE upon Ca2+ elevation. C-terminal truncation of EMRE or charge-reversal of MICU1’s polybasic sequence induced full MICU1 dissociation (Extended Data Fig. 7a, b), corroborating a previous report18 and the structural implication that EMRE tethers MICU1 in the uniplex during Ca2+ stimulation.
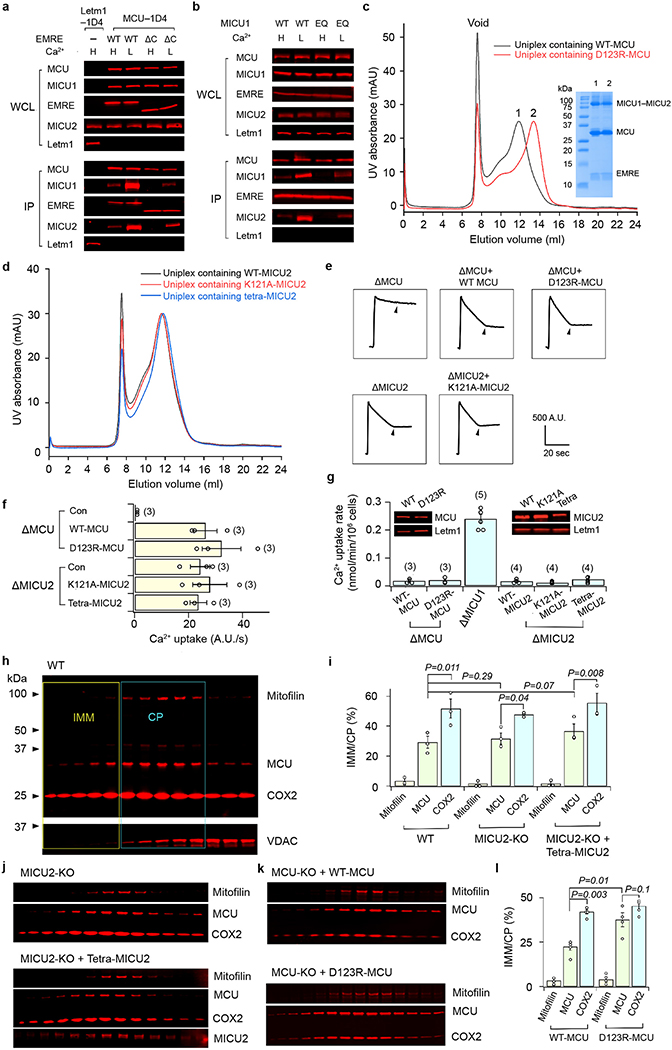
The O-shaped structure shows a uniplex dimer connected by MCU’s NTD, and two MICU2s making a “back-to-back” contact. Interestingly, size-exclusion chromatography shows that a D123R mutation that disrupts NTD interactions27 fully monomerizes the uniplex, but the uniplex dimer remains intact with a K121A mutation known to break MICU2 back-to-back dimers29 or R107E-R120E-K121E-D154R quadruple mutations (Extended Data Fig. 7c, d). Thus, it appears that primarily MCU’s NTD is responsible for uniplex dimerization. Consistently, the NTD interface is sufficient for MCU-EMRE subcomplex dimerization27. D123R-MCU mediates robust Ca2+ transport as WT-MCU in high Ca2+ (Extended Data Fig. 7e, f), and is properly MICU1 regulated in low Ca2+ (Extended Data Fig. 7g). Similar observations were obtained with K121A or R107E-R120E-K121E-D154R MICU2 mutants (Extended Data Fig. 7e–g). Thus, uniplex dimerization is not necessary for its basic channel function.
As V-shaped dimerization of the FoF1-ATPase drives this complex to the curved ridges of the inner membrane33, we investigated whether dimerization affects uniplex localization. Corroborating a previous report34, MCU is more enriched in inner/outer membrane contact points (CP) compared with a crista-membrane protein COX2 (Extended Data Fig. 7h, i). The dimer-breaking D123R mutation induces a COX2-like distribution of MCU, while neither MICU2-KO nor MICU2 dimer-interface mutations alter MCU distribution (Extended Data Fig. 7i–l). The results thus suggest that dimerization might be involved in CP enrichment of the uniplex.
Ca2+-induced MICU conformational changes
To understand how Ca2+ induces MICU conformational changes to unblock the MCU pore, we examined the structures of the MICU1–2 heterodimer within the uniplex under low/high-Ca2+ conditions. Overall, MICU1 and MICU2 share similar architectures28–31, comprising N-lobes with canonical EF1 and pseudo EF2 EF-hands, C-lobes with canonical EF4 and pseudo EF3 EF-hands, and C-terminal helix tails (Fig. 1b).
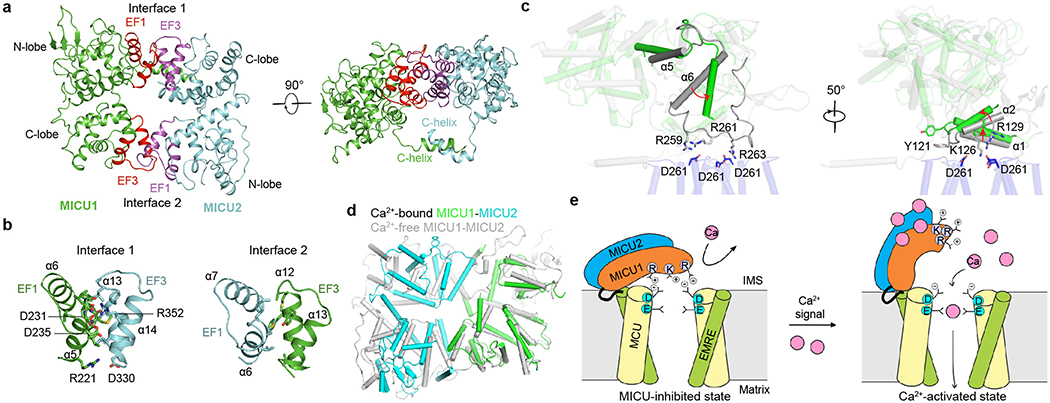
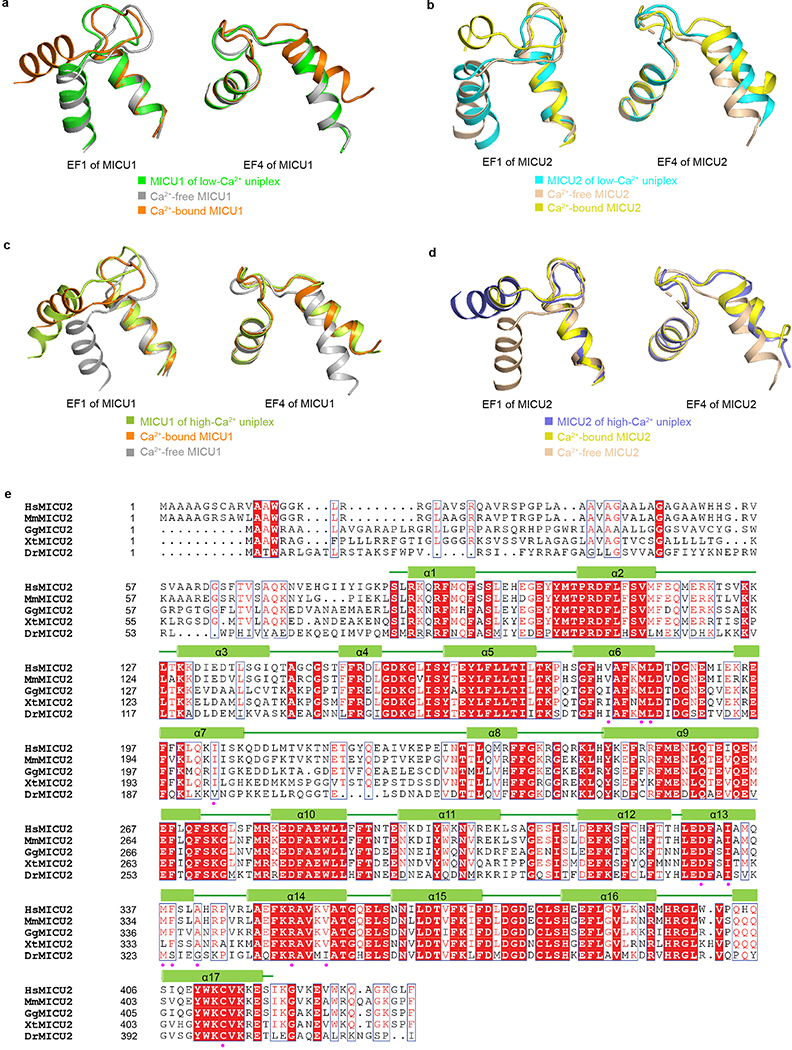
In low Ca2+, the conformations of the canonical EF-hands (EF1 and EF4) of MICU1 and MICU2 are compatible with no Ca2+ binding (Extended Data Fig. 8a, b). Moreover, both MICU1 and MICU2 match well with Ca2+-free but not Ca2+-bound MICUs28–31. MICU1 and MICU2 form a “face-to-face” heterodimer whose interface includes two parts (Fig. 4a, b). The first part is between MICU1’s N-lobe EF1 and MICU2’s C-lobe EF3. Particularly, R352MICU2 interacts electrostatically with D231MICU1 and D235MICU1 in the EF1 site, main-chain oxygen of residues between them, and the dipole of MICU1’s helix α5. R221MICU1 forms electrostatic contacts with D330MICU2. Multiple hydrophobic interactions also occur across the interface. The second part is reciprocal between MICU1’s C-lobe EF3 and MICU2’s N-lobe EF1, mainly mediated by hydrophobic interactions. Residues participating in MICU1-MICU2 interactions are mostly conserved in vertebrates (Extended Data Figs. 8e, 9). Confirming R352’s critical roles in MICU1–2 dimerization, CoIP shows that R352E disrupts the MICU1-MICU2 complex (Extended Data Fig. 1f). Besides the main heterodimer interface, MICU1 and MICU2’s C-terminal helices also interact via an antiparallel two-helix bundle, positioning C463MICU1 and C413MICU2 in range to form disulfide.
Figure 4 |. Ca2+-induced MICU conformational changes and the mechanism of uniplex activation.
a, Overall structure of the MICU1-MICU2 heterodimer. The interfacial EF-hands of MICU1 and MICU2 are coloured in red and magenta, respectively. b, Interfaces between MICU1 and MICU2. c, Ca2+-induced conformational changes in MICU1 (grey, low-Ca2+; green, high-Ca2+) near its interface with MCU. d, Superposition of Ca2+-bound and Ca2+-free MICU1-MICU2 heterodimers. e, Molecular model of Ca2+ activation of the uniplex. Only two copies of MCU/EMRE in the tetramer are presented to reveal the Ca2+ pathway.
Upon Ca2+ elevation, the MICU1-MICU2 heterodimer exhibits substantial conformational changes. MICU1 and MICU2 now match well with Ca2+-bound but not Ca2+-free MICUs28–31, and their canonical EF-hands (EF1 and EF4) are compatible with Ca2+-bound states (Extended Data Fig. 8c, d). Compared with the low-Ca2+ structure, MICU1’s outer helix (α6) of EF1 swings ~30° towards the interface edge and its C-terminal end is displaced ~9 Å outward (Fig. 4c). This would cause an associated outward movement of the loop after α6, which hosts R259, R261, and R263, thus weakening MCU-MICU1 interactions. Moreover, an upward movement of MICU1’s N-terminal helices α1 and α2 causes movement of Y121 away from the interface and an upward shift of K126 and R129, further crippling MICU1 interactions with MCU (Fig. 4c). Together, Ca2+ induces substantial re-arrangements of key residues in MICU1 to disrupt their interactions with the relatively static MCU surface, thus facilitating MICU1 withdrawal from the MCU pore to unblock the channel.
Finally, the structures hint at cooperative activation of the uniporter12. If Ca2+ binds to only one MICU in the heterodimer, the conformational changes could cause a clash between EF1 and EF3 across the heterodimer interface (Fig. 4d). If both MICU subunits bind Ca2+, however, reciprocal conformational changes are accommodated across the interface, thus stabilizing the fully Ca2+-occupied conformation that favors dislocation of the MICU1–2 heterodimer from the pore.
Discussion
Tight regulation of the uniporter by cytosolic Ca2+ signals is crucial for normal physiology1,2,9,10. This work elucidates the structural and functional mechanisms of MICU-mediated Ca2+ regulation of the uniporter (Fig. 4e). We demonstrate that a single MICU1–2 heterodimer is sufficient to gate an MCU-EMRE tetramer — an interesting parallel to calmodulin inhibition of TRPV5/6 and charybdotoxin block of potassium channels35–38. Rather than altering the pore conformation, MICU1 shuts the uniporter in resting conditions (Ca2+ < 1 μM) by employing a 5-residue K/R ring to cover the Asp-ring at the MCU pore entrance. Upon Ca2+ elevation, Ca2+ binds to the MICU1–2 heterodimer cooperatively, inducing conformational changes that weaken MCU-MICU1 interactions. MICU heterodimer then moves away from the pore, leading to Ca2+ activation of the uniporter. It remains to be investigated whether MICU1 additionally modulates MCU allosterically via EMRE8.
In low-Ca2+ conditions, multiple interfaces keep MICU1 tightly docked on MCU to occlude the pore. The major MCU-MICU1 contact site is formed by MICU1’s N-lobe and MCU’s IMS surface. Interfacial residues are highly conserved (Extended Data Figs. 8e, 9), particularly those in MICU1’s K/R ring and the Asp at MCU’s pore entrance, consistent with the observation that human MICU1 can complex with MCUs from distant organisms22. Additionally, MICU1’s C-terminal helix helps stabilize the MCU-MICU1 complex. The robust interactions between MCU and MICU1, which can accommodate K126E or R129E single mutations in the main interface, help explain why a previous Ala mutagenesis screen in MICU1 failed to implicate the K/R ring22. Previous studies21,22 proposed that MICU1’s R119/R154 and R440/R443, which are buried in our structures, contribute to MCU binding. This is likely because R119/R154 makes critical contacts with helices that position the K/R ring to contact MCU and R440/R443 helps maintain proper MICU1 conformation to interact with MCU. Thus, their mutations indirectly affect interactions with MCU. To shut MCU, MICU1 must tightly seal the pore entrance. Thus, single K/R ring mutations could be sufficient to compromise the seal to produce Ca2+ leakage, but multiple mutations are needed to substantially separate MICU1 from MCU.
Animal MCUs require EMRE binding for Ca2+ transport8,18. This EMRE-dependent gating, distinct from the MICU-regulation mechanism described here, might involve a putative luminal gate27. Future structural work on MCU in an EMRE-free state is needed to understand how EMRE controls this process. Previous work suggests that EMRE also binds MICU1 via its C-terminal tail, an interaction necessary for proper Ca2+ regulation of the uniplex18. Although the proposed contact site is unresolved in our structures, it is indeed in range for interaction. We further demonstrate that the MICU1-EMRE interaction helps keep MICU1 in place to seal the MCU pore in low Ca2+ and prevents MICU1 dissociation from the uniplex when Ca2+ increases. It is conceivable that EMRE’s MICU1-tethering function might allow MICUs to stay close to the pore during Ca2+ stimulation so as to rapidly terminate flux once the Ca2+ signal dissipates. Our results show that MICU2 does not directly block MCU. By analogy, the neuron-specific MICU37,39 might also indirectly modulate uniporter activation through concerted conformational changes with MICU1. Finally, our structures and a previous MCU-EMRE subcomplex structure27 show that the uniporter can dimerize. Such dimerization is not required for basic channel function but may contribute to biased uniporter distribution toward inner/outer membrane contact sites, where nearby crista junctions could potentially provide favorable curvature to accommodate the V-shaped dimer. Such spatial arrangement could presumably maximize the uniporter’s exposure to intracellular Ca2+ signals, thus facilitating effective Ca2+ transmission from the endoplasmic reticulum to the mitochondrial matrix40.
In summary, this work defines the architecture of the major Ca2+ signaling hub in mitochondria and establishes the MICU-mediated gating mechanism that underlies uniporter activation in response to intracellular Ca2+ signals. Our results establish a framework for understanding the principles governing tightly regulated mitochondria Ca2+ transport, shed light on Ca2+ signaling and homeostasis, and provide a starting point to aid the development of interventions to suppress pathological Ca2+ overload in mitochondria, which is associated with a variety diseases such as heart failure41 and ischemic brain injury42.
METHODS
Expression and purification of the human uniplex
Codon-optimized DNAs coding human MCU, EMRE (with a C-terminal Strep tag), MICU1, and MICU2 were synthesized and cloned into modified BacMam expression vectors43. Recombinant baculoviures for MCU, EMRE, MICU1, and MICU2 were generated separately using the Bac-to-Bac system as previously described43. HEK293S cells were co-infected by four viruses; 10 mM sodium butyrate was added to the culture medium after 12 h. Cells were further grown at 30 °C and harvested 72 h post infection.
Cell pellets were resuspended and homogenized in buffer A (50 mM Tris pH 7.4, 40 mM NaCl, 5 mM EGTA, 100 mM sorbitol, and protease inhibitors). The crude membrane fractions were extracted using 2% lauryl maltose neopentyl glycol (LMNG, Anatrace)/0.2% cholesteryl hemisuccinate (CHS, Anatrace) at 4 °C. After 2 h solubilization, the cell lysate was spun at 40,000 × g for 40 min, and the supernatant was incubated with prewashed Strep-Tactin Sepharose resin (IBA) for 2 h at 4 °C. The slurry was then poured out into a gravity-flow column (Bio-Rad). After washing the resin with buffer B (20 mM Tris pH 7.4, 40 mM NaCl, 5 mM EGTA, and 0.01% LMNG/0.002% CHS), the protein was eluted with buffer C (20 mM Tris pH 7.4, 40 mM NaCl, 5 mM EGTA, and 0.0033% LMNG/0.00066% CHS) containing 10 mM desthiobiotin (Sigma). To analyze the intactness of the purified human uniplex, a Superose 6 column (GE Healthcare) was used for gel filtration on an ÄKTA purifier system (GE Healthcare), and buffer B was used for running the gel filtration. The peak fractions were analyzed by SDS-PAGE. To obtain high-Ca2+ uniplex, the protein was eluted with buffer D (20 mM Tris pH 7.4, 50 mM NaCl, 0.1 mM EGTA, 2 mM CaCl2, and 0.0033% LMNG/0.00066% CHS) plus 10 mM desthiobiotin. Both samples were concentrated to about 9 mg/ml for cryo-EM grid preparation.
Electron microscopy sample preparation and data collection
For cryo-EM, 3 μl of purified human uniplex was applied to glow discharged 300 mesh Quantifoil R2/1 holey carbon grids, and blotted for 2.0 s at 96% humidity on a Leica EM GP2 before being plunge frozen in liquid ethane cooled by liquid nitrogen. Grids of low-Ca2+ uniplex were imaged on a Titan Krios electron microscope (Thermo Fisher Scientific) operated at 300 kV using a slit width a 20 eV on a GIF Quantum energy filter. Images were collected on a K2 Summit detector (Gatan) in super-resolution counting mode at a magnification of 130,000×, corresponding to a physical pixel size of 1.06 Å. SerialEM44 was used for data collection with a set of customized scripts enabling automated low-dose image acquisition. Data were collected using image shift to collect one image per hole by the Multiple Record method with a 3 × 3 set of holes per stage movement. Grids of high-Ca2+ uniplex were imaged on a Talos Arctica electron microscope (Thermo Fisher Scientific) operated at 200 kV. Images were collected on a K3 Summit detector (Gatan) in super-resolution counting mode at a magnification of 36,000×, corresponding to a physical pixel size of 1.1 Å. Data were collected using image shift to collect one image per hole by the Multiple Record method with a 2 × 2 set of holes per stage movement.
Cryo-EM data processing
For human low-Ca2+ uniplex, a total of 5,816 movies were collected and subjected to beam-induced motion correction using the program MotionCor245. A sum of all frames of each movie was calculated following a dose-weighting scheme, and used for all image processing steps. Contrast transfer function (CTF) parameters for each micrograph were estimated by CTFFIND446. Automated particle picking was first performed with cisTEM47 using 1,000 images, and the picked particles were extracted with a box size of 360 pixels and subjected to 2D classification in cisTEM. The resulting high-quality 2D class averages representing projections in different orientations were selected and imported to Relion 3.048 as templates for automatic particle picking. All particles picked in Relion were extracted with a box size of 360 pixels with the original pixel size of 1.06 Å, and then imported to cryoSPARC49 for 2D classification. Two rounds of 2D classification yielded 531,350 particle images with clear features of the uniplex. These particles were subjected to ab initio 3D reconstruction without symmetry, requesting 6 classes and a maximum resolution of 12 Å. Among all the 6 classes, one class with 93,926 particles stood out demonstrating clear overall features of a tetramer. The NU-Refinement of these particles produced a 3.9 Å resolution map without symmetry. Based on the 3.9 Å resolution map, two rounds of Bayesian polishing were performed in Relion 3.0. Further 3D classification and map investigation implied the heterogeneity of MICU1/2. To improve the map quality of the MICU part, local 3D classification focused on MICU1/2 was performed. The signal of the MCU/EMRE part was subtracted from the particles with a mask covering the whole uniplex except for MICU1/2. The modified particle set was subjected to another round of 3D classification without alignment using mask around MICU1/2 (k=6, T=20). After classification, the class with best features of MICU1/2 was selected and the corresponding 64,131 particles were imported back to cryoSPARC for final refinement. NU-Refinement in cryoSPARC yielded an improved map with better details at a resolution of 3.3 Å. From the ab initio reconstruction in cryoSPARC, classes representing the dimer of uniplex were observed, which contained 322,210 particles. Those particles were transferred to Relion for 3D classification (k=8, T=4). The class with the highest resolution contained 69,856 particles, and yielded a 4.5 Å resolution map after cryoSPARC NU-Refinement without symmetry and a 4.1 Å resolution map with C2 symmetry. All resolutions were estimated by applying a soft mask around the protein and using the gold-standard Fourier shell correlation (FSC) =0.143 criterion. BlocRes implemented in cryoSPARC was used to calculate the local resolution map.
For high-Ca2+ uniplex, all steps before cryoSPARC ab initio reconstruction were the same as for low-Ca2+ uniplex. Starting from cryoSPARC ab initio 3D reconstruction, one class containing 224,504 particles with obvious MICU1/2 map density was selected and imported to Relion for further 3D classification. The optimized 3D classification yielded two classes with clear MICU1/2 density, containing a total of 128,221 particles. Those particles were refined with a C2 symmetry using NU-Refinement, yielding a map at 4.1 Å resolution. Further particle polishing based on the 4.1 Å resolution map and additional 3D classification improved the map quality and resolution to 3.6 Å. Local resolution was calculated using BlocRes implemented in cryoSPARC. The number of particles in each dataset and other details related to data processing are summarized in Extended Data Figs. 2, 4 and Extended Data Table 1.
Model building and refinement
The low-Ca2+ uniplex model was built into a 3.3 Å cryo-EM map using available structures of uniplex components as templates (MCU-EMRE, PDB 6O5B; MICU1, PDB 4NSC; MICU2, PDB 6EAZ and 6AGH). The map shows excellent densities in MCU, EMRE, MICU1, and the majority of MICU2. Modelling on the distal part of MICU2 that shows relatively weaker density was facilitated by the available high-resolution crystal structures of MICU229,30. Local parts were manually rebuilt in Coot50. The high-Ca2+ uniplex model was built into a 3.6 Å cryo-EM map using available structures of uniplex components as templates (MCU-EMRE, PDB 6O58; MICU1, PDB 4NSD; MICU2, PDB 6IIH). High-quality cryo-EM maps and the availability of the structures of individual components27,28,31 facilitated model building. Local parts were manually adjusted in Coot. The models were refined using Phenix real space refine51 and the geometry of the models was evaluated by Molprobity52. All figures were prepared in PyMol (Schrödinger) or UCSF Chimera53.
Cell culture and molecular biology for functional experiments
Genes encoding uniporter subunits were cloned into the pcDNA 3.1 (+) expression vector. Site-directed mutagenesis was performed using a QuickChange kit (Agilent) and confirmed with Sanger sequencing. All MCU and MICU1 constructs contain a C-terminal 1D4 tag (TETSQVAPA) and a C-terminal FLAG tag (DYKDDDDK), respectively, for CoIP and Western detection. HEK 293 cells were cultured in Dulbecco’s modified Eagle’s medium (Gibco) supplemented with 10% FBS, and were incubated at 37 °C with 5% CO2. CRISPR knockout cell lines have been documented in previous work18. Transient transfection was performed using Lipofectamine 3000 (Invitrogen), following the manufacturer’s instructions. Cells were harvested for experiments 24–48 h after transfection.
Co-immunoprecipitation
CoIP experiments were performed at 4 °C. Transfected HEK 293 cells in a 60 mm dish were lysed in 0.5 mL solubilization buffer (SB, 100 mM NaCl, 20 mM Tris, 1 mM EGTA, 5 mM DDM, pH 7.5-HCl) supplemented with an EDTA-free protease inhibitor cocktail (cOmplete Ultra, Roche). When high Ca2+ conditions were needed, 1 mM EGTA in SB was substituted with 1 mM CaCl2. The lysate was clarified by spinning down. 50 μL of the supernatant was removed for total protein determination using a BCA assay. 10–50 μg of protein was used for whole-cell lysate analysis. Then, 25 μL of FLAG (Sigma-Aldrich, A2220)- or 1D4-conjugated beads (home-made, 50% slurry) were added to the rest of the supernatant for batch binding (30 min). The beads were collected on a spin column, washed 5 times with 1 mL of SB, and then eluted with 0.2 mL of SDS loading buffer. 10–60 μL of the elute was used for SDS-PAGE/Western blot.
For Western blots, proteins on SDS gels were transferred to low-fluoresce PVDF membranes (EMD-Millipore), which were blocked in a TBS-based Intercept blocking buffer (Li-Cor), and then incubated with primary antibodies in TBST (TBS + 0.075% Tween-20) at 4 °C overnight. After a 1 h incubation with infrared fluorescent secondary antibodies at room temperature, signals were acquired using an Odyssey CLx imaging system (Li-Cor), and quantified using an ImageStudio software (Li-Cor version 5.0). MCU and MICU1 were detected using α−1D4 and α-FLAG antibodies, respectively. Primary antibody and dilution: α-FLAG (Sigma-Aldrich F1804, 1:10,000), α-MICU2 (Abcam ab101465, 1:10,000), α−1D4 (home-made, 50 ng/mL), α-Letm1 (Abcam ab55434, 1:2,000), α-COX2 (Abcam ab110258, 100 ng/mL), α-TIM23 (Santa Cruz sc-514463, 100 ng/mL), α-mitofilin (Abcam ab110329, 100 ng/mL), α-VDAC1 (Abcam ab14734, 100 ng/mL), and α-EMRE (Santa Cruz, 86337, 1:400). Secondary antibody: goat anti-rabbit IRDye 680RD (Li-Cor, 1:10,000) & goat anti-mouse IRDye 680RD (Li-Cor, 1:15,000).
Mitochondrial Ca2+ flux assays
For the fluorescence-based assay to test uniporter activity in high Ca2+, 2×10⁷ HEK 293 cells were suspended in 10 mL of wash buffer (WB, 120 mM KCl, 25 mM HEPES, 2 mM KH2PO4, 1 mM MgCl2, 50 μM EGTA, pH 7.2-KOH), pelleted, and then resuspended in 2.2 mL of recording buffer (RB, 120 mM KCl, 25 mM HEPES, 2 mM KH2PO4, 5 mM succinate, 1 mM MgCl2, 5 μM thapsigargin, pH 7.2-KOH). Then, 2 mL of the cell suspension was placed in a stirred quartz cuvette in a Hitachi F-7100 spectrophotometer (ex: 506 nm, ex-slit: 2.5 nm, em: 532 nm, em-slit: 2.5 nm, sampling rate: 2 Hz). Reagents were added into the cell suspension in the following order: 0.25 μM calcium green 5N (Thermo C3737), 30 μM digitonin (Sigma-Aldrich D141), 10 μM CaCl2, and 75 nM Ru360 (home-made). Quantification was done by linear fit to the fluorescent signal between 5 s and 10 s after adding Ca2+. The slope after Ru360 addition was subtracted to yield uniporter-specific uptake.
For the 45Ca2+-based assay to test uniporter activity in low Ca2+, 2×10⁶ cells were suspended in 0.5 mL WB, spun down, and then resuspended in 110 μL WB, supplemented with 5 μM thapsigargin (Sigma-Aldrich, T9033) and 30 μM digitonin. To initiate mitochondrial Ca2+ uptake, 100 μL cell suspension was transferred to 300 μL flux buffer (FB, RB + 0.69 mM EGTA, 0.5 mM CaCl2, 20 μM 45CaCl2, 30 μM digitonin, pH 7.0-KOH). The total free Ca2+ in FB is ~300 nM, as calibrated by Fluo-4. 2, 4, and 6 min after the reaction started, Ca2+ uptake was terminated by adding 100 μL of the sample to 5 mL ice-cold WB, and then filtered through 0.45 μm nitrocellulose membranes on a vacuum filtration manifold. The membrane was washed immediately with 5 mL ice-cold WB, and later transferred into scintillation vials for counting. The data were fit with a linear function to obtain the rate of Ca2+ transport. 45Ca2+ radioisotope was obtained from Perkin Elmer, and has a specific activity of 12–18 mCi/mg.
Isolation of inner/outer membrane contact sites
HEK293 cells cultured in 6 of 15 cm dishes were harvested, and mitochondria were extracted as described before18. All the following procedures were performed at 4 °C. Pelleted mitochondria were resuspended in 25 mL of swelling buffer (0.5 mM EDTA, 20 mM MOPS, pH 7.4-KOH) and incubated for 5 min. Then, 10 mL of 60% sucrose was added. After 5 min of incubation, the sample was sonicated 3 times for 30 s with a 30 s break in between using a sonic dismembrator (Model 505, Fisher) at a power level of 3. Intact mitochondria were removed by spinning at 20,000 g for 20 min. The supernatant was then transferred to an ultracentrifuge tube with 0.3 mL of 60% sucrose added as a cushion. After 2 h of spinning at 100,000 g, membrane vesicles were harvested into a 1 mL suspension with 20% sucrose. 0.2 mL of the sample was subsequently loaded onto a 30–40-50–60% (0.7 mL/layer) discontinuous sucrose gradient, and spun at 200,000 g for 18 h. Afterwards, 14 of 0.2 – 0.22 mL fractions were taken from the bottom of the tube for Western blot analysis.
Statistics
All functional experiments were repeated with at least three independent measurements, and the data were presented as mean +/− s.e.m. Statistical analysis was performed with two-tailed Student’s t-test, with significance defined as P < 0.05.
Extended Data
Extended Data Figure 1 |. Biochemical characterization of the purified human uniplex and validation of the interfaces of low-Ca2+ uniplex.
a, Size-exclusion chromatography profile of the purified human uniplex. b, SDS-PAGE analysis of the purified human uniplex. The disulfide-linked MICU1-MICU2 heterodimer is labeled with an asterisk. Data in a and b are representative of five independent experiments with similar results. c, Effects of MCU-MICU1 interfacial mutations on complex stability. Flag-tagged MICU1 was immobilized to pull down 1D4-tagged WT-MCU co-expressed in MCU/EMRE/MICU1-KO cells. WCL: whole cell lysate. IP: eluted protein. KA, RA, and YA stand for K126A, R129A, and Y114A mutations, respectively. In a separate control CoIP experiment, Letm1-Flag was expressed alone in MCU/EMRE/MICU1-KO cells, which were solubilized and incubated with Flag beads. The eluent was then analyzed. Letm1 in WCL and IP was detected using anti-Flag and anti-Letm1 antibodies, respectively. Cytochrome C oxidase subunit 2 (COX2) serves as a control showing that MICU1 does not interact non-specifically with other mitochondrial inner-membrane proteins. MICU2 signals were obtained by targeting native proteins. EMRE blot was not performed as the EMRE gene was deleted in these cells. MICU1 mutants were properly folded as they still formed a complex with MICU2. d, Functional roles of MICU1’s C-terminal helix. In CoIP, WT-MCU, WT-MICU2, and Flag-tagged MICU1 constructs were expressed in MCU/EMRE/MICU1-KO cells, with MICU1 used to pull down other subunits. C-truncation (ΔC, residues 445 – 476 deleted) of MICU1 greatly weakens its interaction with MCU without affecting MICU2 binding. Tim23, a membrane-embedded component of the mitochondrial translocase of the inner membrane, was used to rule out non-specific binding. The bar chart summarizes the effect of MICU1 C-truncation on the gatekeeping function. WT or ΔC-MICU1 was expressed in MICU1-KO cells, and mitochondrial Ca2+ uptake in low-Ca2+ conditions (300 nM) was quantified using 45Ca2+ flux. Results are presented as mean +/− S.E.M. Numbers of independent repeats are provided inside parentheses. ΔC-MICU1 has a much weaker ability to gate MCU than WT-MICU1, as determined by two-tailed t-test (P=0.0098). Con: untransfected MICU1-KO cells. e, Roles of the MICU1-EMRE interaction in uniplex stability. The experiment assessed the complex stability of WT-MCU and the indicated MICU1 constructs in the presence of WT or C-truncated (residues 96 – 107 deleted) EMRE in low Ca2+ conditions. These three subunits were co-expressed in MCU/MICU1/EMRE-KO cells. C-truncation of EMRE or charge-reversal of MICU1’s KKKKR sequence to QEQEQ (EQ) greatly weakens MICU1 association with MCU. f, R352 contribution to MICU1–2 heterodimer formation. Complex formation between C463S-MICU1, which cannot form a disulfide MICU dimer, and WT- or R352E-MICU2 was examined in MICU1/MICU2-KO cells. The R352E mutation in MICU2 strongly perturbs dimerization with MICU1. Letm1, detected using anti-Letm1 antibody, serves as control for non-specific interactions. MCU and EMRE signals reflect native proteins. All CoIP experiments (c-f) were performed 4 times with similar results using independent biological samples. For gel source data, see Supplementary Fig. 1.
Extended Data Figure 2 |. Single-particle cryo-EM analysis of the uniplex in low Ca2+ conditions.
a, Representative cryo-EM image of the purified uniplex in low Ca2+ conditions. b, 2D class averages of the uniplex. c, The workflow of classification and refinement. d, Angle distributions of the particles for the final reconstruction. e, Fourier shell correlation (FSC) of the final reconstruction as a function of resolution. Red: gold-standard FSC curve, FSC=0.143; Blue: FSC = 0.5; Orange: FSC curve between the final model and half map 1; Green: FSC curve between the final model and half map 2. f, Local resolution of the map calculated by BlocRes.
Extended Data Figure 3 |. Representative cryo-EM density maps of the uniplex in low-Ca2+ and high-Ca2+ conditions.
a-b, Cryo-EM density maps of MCU (a) and its selectivity filter (b) of low-Ca2+ uniplex. The putative cation is shown as a red sphere. c, Cryo-EM density map of EMRE of low-Ca2+ uniplex. d-e, Cryo-EM density of the α-helices in MICU1 (d) and MICU2 (e) of low-Ca2+ uniplex. f, Cryo-EM density maps of lipids bound to the MCU TM region of low-Ca2+ uniplex. g-j, Cryo-EM density maps of MCU (g), EMRE (h), MICU1 (i), and MICU2 (j) of high-Ca2+ uniplex.
Extended Data Figure 4 |. Single-particle cryo-EM analysis of the uniplex in high-Ca2+ conditions.
a, Representative cryo-EM image of the uniplex in high-Ca2+ conditions. b, 2D class averages of the uniplex. c, The workflow of classification and refinement. d, Angle distributions of the particles for the final reconstruction. e, The final reconstruction FSC as a function of resolution. Red: gold-standard FSC curve, FSC=0.143; Blue: FSC=0.5; Orange: FSC curve between the final model and half map 1; Green: FSC curve between the final model and half map 2. f, Local resolution of the map calculated using BlocRes.
Extended Data Figure 5 |. Structural comparison of low-Ca2+ uniplex and the MCU-EMRE subcomplex.
a, Structural superposition of the MCU-EMRE part of low-Ca2+ uniplex (blue) and the MCU-EMRE subcomplex (grey). b, Interactions between MCU and EMRE in the uniplex. Two MCU subunits are coloured green and cyan, and one EMRE is coloured orange. c, The selectivity filter of MCU in the uniplex. The side chains of D261 and E264 are shown as sticks. The putative cation is shown as a red sphere. d, Comparison of the luminal gate of MCU in the uniplex (blue) and the MCU-EMRE subcomplex (grey). The cryo-EM density of the uniplex luminal gate is shown on the right. e, Surface representation of MCU-MICU1 interface, coloured according to electrostatic potential (red, negative; blue, positive).
Extended Data Figure 6 |. Structural comparison of high-Ca2+ uniplex and the MCU-EMRE subcomplex.
a, Cryo-EM map of high-Ca2+ uniplex. b, Superposition of one copy of high-Ca2+ uniplex and MCU-EMRE subcomplex. The MICU1 and MICU2 parts of the uniplex are omitted for clarity. The uniplex and the MCU-EMRE subcomplex are coloured in blue and grey, respectively. c, Superposition of dimeric high-Ca2+ uniplex and MCU-EMRE subcomplex. d, Comparison of the luminal gate of MCU in high-Ca2+ uniplex (blue) and the MCU-EMRE subcomplex (grey). The cryo-EM density of the uniplex luminal gate is shown on the right.
Extended Data Figure 7 |. Validation of the interface of high-Ca2+ uniplex and functional roles of uniplex dimer interfaces.
a, The effect of Ca2+ elevation and EMRE C-truncation on MICU1’s association with the uniplex. 1D4-tagged WT-MCU was used to precipitate WT-MICU1 and indicated EMRE constructs in high- or low-Ca2+ conditions. All three subunits were expressed in MCU/MICU1/EMRE-KO cells. The Letm1 control was performed as described in Extended Data Figure 1c, with a 1D4-tagged, rather than Flag-tagged, version of Letm1. Letm1 in WCL or IP was detected with anti-1D4 or -Letm1 antibodies, respectively. Four independent experiments were performed yielding similar results. b, Roles of MICU1’s polybasic sequence in MICU1 binding to the MCU-EMRE tetramer. The image compares the stability of WT-MCU complexed with WT or the KKKKR to QEQEQ mutant (EQ) of MICU1 in low or high Ca2+. WT-MCU/EMRE and MICU1 constructs were expressed in MCU/MICU1/EMRE-KO cells. Four independent repeats were performed leading to similar results. c, Size-exclusion chromatography profiles of the purified human uniplex containing WT- or D123R-MCU. Inset shows the SDS-PAGE gel analysis of the uniplex. The data are representative of three independent experiments with similar results. d, Size-exclusion chromatography profiles of the purified human uniplex containing WT- or mutant-MICU2. The uniplex was expressed in MICU2-KO HEK293 cells to eliminate the effect of endogenous MICU2. The experiment was performed twice independently with similar results. e-g, Functional roles of the uniporter’s dimer interfaces. A D123R-MCU mutant expressed in MCU-KO cells, or K121A- or R107E-R120E-K121E-D154R (tetra)-MICU2 mutants expressed in MICU2-KO cells were analyzed using a standard fluorophore-based mitochondrial Ca2+ uptake assay in 10 μM Ca2+ (e-f) or by 45Ca2+ flux in 300 nM Ca2+ (g). Numbers in parentheses indicate numbers of independent repeats. Arrowheads in e indicate addition of Ru360. Con: untransfected cells. In 45Ca2+ flux experiments, WT-MICU1 was co-expressed with WT or D123R-MCU in MCU-KO cells to ensure sufficient copies of MICU1 to gate MCU (1 μg MCU and 2 μg MICU1 DNA per well in 6-well plates). The tetra-MICU2 construct has lower expression levels despite using 3-fold more DNA in transient expression. h-j, Localization of the uniporter in the mitochondrial inner membrane of WT (h) or MICU2-KO (j) cells. Mitochondrial membrane fractions enriched in outer membrane, inner/outer membrane contact points (CP), or inner membrane (IMM) were separated in a sucrose gradient as described before54. COX2, mitofilin, and VDAC were used as the markers for inner membrane (IMM), inner/outer membrane contact points (CP), or outer membrane, respectively. MCU was found to be more enriched in CP (h-i). This feature was not affected by MICU2-KO or expressing tetra-MICU2 in MICU2-KO cells (i-j). The sucrose gradient goes from 60% down to 30% from left to right. The bar chart in i presents the ratio of total Westerns signals in IMM (yellow box in h) over the signals in CP (cyan box in h). N=3 biologically independent experiments were performed, generating similar results (h,j), as summarized in the bar chart (i). Two-tailed t-test was performed with p values labeled on the bar chart. k-l, The effect of the D123R mutation on uniporter distribution. D123R- or WT-MCU was expressed in MCU-KO cells, and MCU localization was analyzed. D123R reduces biased distribution of MCU in CP. N=4 biologically independent experiments were performed, producing similar results (k), as summarized in the bar chart (l). Statistical analyses were done with two-tailed t-test. All bar charts (f,g,i,l) in this figure present data as mean +/− S.E.M. For gel source data, see Supplementary Fig. 1.
Extended Data Figure 8 |. MICU1-MICU2 heterodimer in low-Ca2+ and high-Ca2+ conditions and sequence alignment of MICU2.
a, Structural comparison of canonical EF-hands 1 and 4 of MICU1 in low-Ca2+ uniplex with that known in Ca2+-free state and Ca2+-bound state. MICU1 of low-Ca2+ uniplex, Ca2+-free MICU1, and Ca2+-bound MICU1 are coloured in green, grey, and orange, respectively. b, Structural comparison of canonical EF-hands 1 and 4 of MICU2 in low-Ca2+ uniplex versus those known in the Ca2+-free and Ca2+-bound states. MICU2 of low-Ca2+ uniplex, Ca2+-free MICU2, and Ca2+-bound MICU2 are coloured in cyan, wheat, and yellow, respectively. c, Structural comparison of canonical EF-hands 1 and 4 of MICU1 in high-Ca2+ uniplex with that known in Ca2+-bound state and Ca2+-free state. MICU1 of high-Ca2+ uniplex, Ca2+-bound MICU1, and Ca2+-free MICU1 are coloured in lemon, orange, and grey, respectively. d, Structural comparison of canonical EF-hands 1 and 4 of MICU2 in high-Ca2+ uniplex versus those known in the Ca2+-bound and Ca2+-free states. MICU2 of high-Ca2+ uniplex, Ca2+-bound MICU2, and Ca2+-free MICU2 are coloured in blue, yellow, and wheat, respectively. e, Sequence alignment of MICU2 homologues from Homo sapiens (Hs), Mus musculus (Mm), Gallus gallus (Gg), Xenopus tropicalis (Xt), and Danio rerio (Dr). The residues participating in MICU1-MICU2 interactions are indicated with magenta circles.
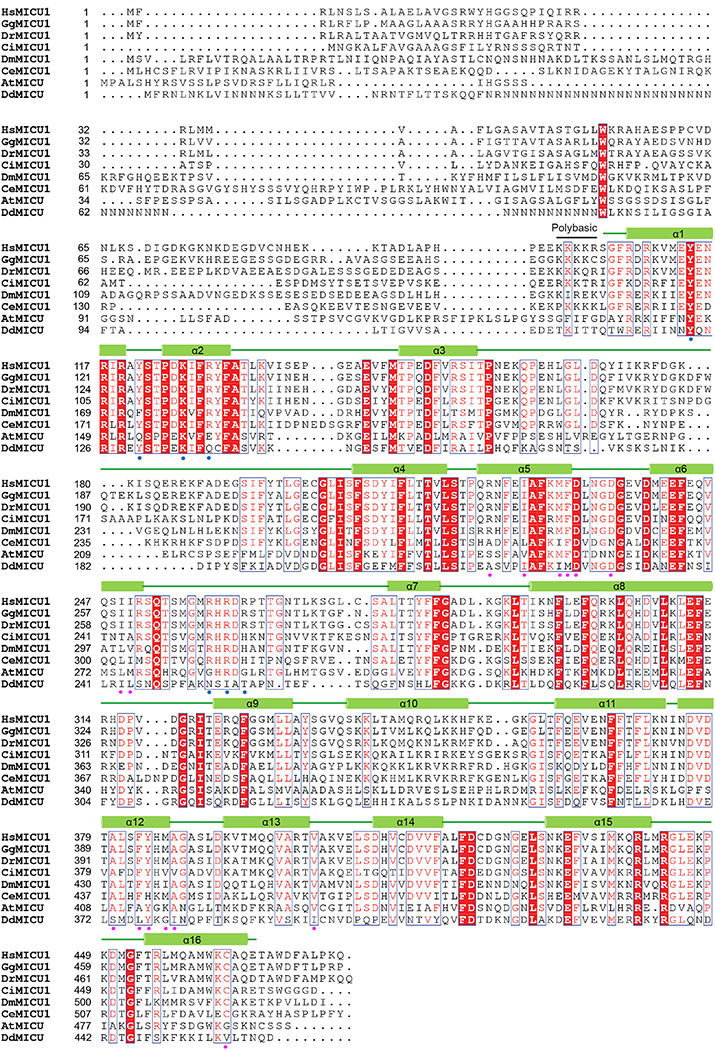
Extended Data Figure 9 |. Sequence alignment of MICU1 from different species.
Sequence alignment of MICU1 homologues from Homo sapiens (Hs), Gallus gallus (Gg), Danio rerio (Dr), Ciona intestinalis (Ci), Drosophila melanogaster (Dm), Caenorhabditis elegans (Ce), Arabidopsis thaliana (At), and Dictyostelium discoideum (Dd). The residues participating in MICU1-MICU2 interactions are indicated with magenta circles. The residues participating in MICU1-MCU interactions are indicated with blue circles.
Extended Data Table 1.
Cryo-EM data collection, refinement and validation statistics.
| Low-Ca uniplex (EMDB-21642) (PDB 6WDN) |
High-Ca uniplex (EMDB-21643) (PDB 6WDO) |
|
|---|---|---|
| Data collection and processing | ||
| Magnification | 130,000 | 36,000 |
| Voltage (kV) | 300 | 200 |
| Electron exposure (e−/Å2) | 63 | 30 |
| Defocus range (μm) | 1.5–3.0 | 1.5–2.5 |
| Pixel size (Å) | 1.06 | 1.1 |
| Symmetry imposed | C1 | C2 |
| Initial particle images (no.) | 900,008 | 2,572,617 |
| Final particle images (no.) | 64,131 | 101,531 |
| Map resolution (Å) | 3.3 | 3.6 |
| FSC threshold | 0.143 | 0.143 |
| Map resolution range (Å) | 2.8–6.2 | 3.1–6.4 |
| Refinement | ||
| Initial model used (PDB code) | 6O5B, 4NSC, 6AGH | 6O58, 4NSD, 6IIH |
| Model resolution (Å) | 3.6 | 4.0 |
| FSC threshold | 0.5 | 0.5 |
| Model resolution range (Å) | 3.15–381 | 3.43–381 |
| Map sharpening B factor (Å2) | −54 | −98 |
| Model composition | ||
| Non-hydrogen atoms | 12,612 | 29,867 |
| Protein residues | 1,540 | 3,645 |
| Ligands | 0 | 2 |
| B factors (Å2) | ||
| Protein | 135.59 | 130.26 |
| Ligand | - | 96.81 |
| R.m.s. deviations | ||
| Bond lengths (Å) | 0.005 | 0.005 |
| Bond angles (°) | 0.729 | 0.716 |
| Validation | ||
| MolProbity score | 2.12 | 2.37 |
| Clashscore | 14.61 | 21.32 |
| Poor rotamers (%) | 0.52 | 0.77 |
| Ramachandran plot | ||
| Favored (%) | 92.9 | 90.2 |
| Allowed (%) | 7.1 | 9.8 |
| Disallowed (%) | 0 | 0 |
Supplementary Material
Acknowledgements
We thank L. Montabana and D.-H. Chen at Stanford-SLAC Cryo-EM facilities, C. Xu, K. Lee and K. Song at the UMass cryo-EM facility for help with EM data collection, A. Van Keuren for technical assistance, and S. R. Levinson for assistance in establishing the submitochondrial fractionation assay. This work was made possible by support from Stanford University and the Harold and Leila Y. Mathers Charitable Foundation to L.F., an AHA postdoctoral fellowship to M.F., a Dean’s fellowship to J.Z. M.-F.T., C.-W.T., and M.R. are supported by the NIH grant R01-GM129345.
Footnotes
Competing interests: The authors declare no competing interests.
Data availability
The three-dimensional cryo-EM density maps are deposited into the Electron Microscopy Data Bank under accession numbers EMD-21642 and EMD-21643. The coordinates are deposited into the Protein Data Bank with accession numbers 6WDN and 6WDO.
Supplementary information is available for this paper at https://doi.org/10.1038/s41586-020-2309-6
Reprints and permissions information is available at http://www.nature.com/reprints.
REFERENCES
- 1.Rizzuto R, De Stefani D, Raffaello A & Mammucari C Mitochondria as sensors and regulators of calcium signalling. Nat. Rev. Mol. Cell Biol 13, 566–578 (2012). [DOI] [PubMed] [Google Scholar]
- 2.Giorgi C, Marchi S & Pinton P The machineries, regulation and cellular functions of mitochondrial calcium. Nat. Rev. Mol. Cell Biol 19, 713–730 (2018). [DOI] [PubMed] [Google Scholar]
- 3.Kirichok Y, Krapivinsky G & Clapham DE The mitochondrial calcium uniporter is a highly selective ion channel. Nature 427, 360–364 (2004). [DOI] [PubMed] [Google Scholar]
- 4.De Stefani D, Raffaello A, Teardo E, Szabo I & Rizzuto R A forty-kilodalton protein of the inner membrane is the mitochondrial calcium uniporter. Nature 476, 336–340 (2011). [DOI] [PMC free article] [PubMed] [Google Scholar]
- 5.Baughman JM et al. Integrative genomics identifies MCU as an essential component of the mitochondrial calcium uniporter. Nature 476, 341–345 (2011). [DOI] [PMC free article] [PubMed] [Google Scholar]
- 6.Perocchi F et al. MICU1 encodes a mitochondrial EF hand protein required for Ca2+ uptake. Nature 467, 291–296 (2010). [DOI] [PMC free article] [PubMed] [Google Scholar]
- 7.Plovanich M et al. MICU2, a paralog of MICU1, resides within the mitochondrial uniporter complex to regulate calcium handling. Plos One 8, e55785 (2013). [DOI] [PMC free article] [PubMed] [Google Scholar]
- 8.Sancak Y et al. EMRE is an essential component of the mitochondrial calcium uniporter complex. Science 342, 1379–1382 (2013). [DOI] [PMC free article] [PubMed] [Google Scholar]
- 9.Kamer KJ & Mootha VK The molecular era of the mitochondrial calcium uniporter. Nat. Rev. Mol. Cell Biol 16, 545–553 (2015). [DOI] [PubMed] [Google Scholar]
- 10.De Stefani D, Rizzuto R & Pozzan T Enjoy the trip: calcium in mitochondria back and forth. Annu. Rev. Biochem 85, 161–192 (2016). [DOI] [PubMed] [Google Scholar]
- 11.Mallilankaraman K et al. MICU1 is an essential gatekeeper for MCU-mediated mitochondrial Ca2+ uptake that regulates cell survival. Cell 151, 630–644 (2012). [DOI] [PMC free article] [PubMed] [Google Scholar]
- 12.Csordás G et al. MICU1 controls both the threshold and cooperative activation of the mitochondrial Ca2+ uniporter. Cell Metab 17, 976–987 (2013). [DOI] [PMC free article] [PubMed] [Google Scholar]
- 13.Patron M et al. MICU1 and MICU2 finely tune the mitochondrial Ca2+ uniporter by exerting opposite effects on MCU activity. Mol. Cell 53, 726–737 (2014). [DOI] [PMC free article] [PubMed] [Google Scholar]
- 14.Petrungaro C et al. The Ca2+-dependent release of the Mia40-induced MICU1-MICU2 dimer from MCU regulates mitochondrial Ca2+ uptake. Cell Metab 22, 721–733 (2015). [DOI] [PubMed] [Google Scholar]
- 15.Peng TI & Jou MJ Oxidative stress caused by mitochondrial calcium overload. Ann. NY Acad. Sci 1201, 183–188 (2010). [DOI] [PubMed] [Google Scholar]
- 16.Logan CV et al. Loss-of-function mutations in MICU1 cause a brain and muscle disorder linked to primary alterations in mitochondrial calcium signaling. Nat. Genet 46, 188–193 (2014). [DOI] [PubMed] [Google Scholar]
- 17.Musa S et al. A middle eastern founder mutation expands the genotypic and phenotypic spectrum of mitochondrial MICU1 deficiency: a report of 13 patients. JIMD Rep 43, 79–83 (2018). [DOI] [PMC free article] [PubMed] [Google Scholar]
- 18.Tsai MF et al. Dual functions of a small regulatory subunit in the mitochondrial calcium uniporter complex. eLife 5, e15545 (2016). [DOI] [PMC free article] [PubMed] [Google Scholar]
- 19.Kamer KJ, Grabarek Z & Mootha VK High-affinity cooperative Ca2+ binding by MICU1-MICU2 serves as an on-off switch for the uniporter. EMBO Rep 18, 1397–1411 (2017). [DOI] [PMC free article] [PubMed] [Google Scholar]
- 20.Payne R, Hoff H, Roskowski A & Foskett JK MICU2 restricts spatial crosstalk between InsP3R and MCU channels by regulating threshold and gain of MICU1-mediated inhibition and activation of MCU. Cell Rep 28, 3141–3154 (2017). [DOI] [PMC free article] [PubMed] [Google Scholar]
- 21.Paillard M et al. MICU1 interacts with the D-Ring of the MCU pore to control its Ca2+ flux and sensitivity to Ru360. Mol. Cell 72, 778–785 (2018). [DOI] [PMC free article] [PubMed] [Google Scholar]
- 22.Phillips CB, Tsai CW & Tsai MF The conserved aspartate ring of MCU mediates MICU1 binding and regulation in the mitochondrial calcium uniporter complex. eLife 8, e41112 (2019). [DOI] [PMC free article] [PubMed] [Google Scholar]
- 23.Fan C et al. X-ray and cryo-EM structures of the mitochondrial calcium uniporter. Nature 559, 575–579 (2018). [DOI] [PMC free article] [PubMed] [Google Scholar]
- 24.Baradaran R, Wang CY, Siliciano AF & Long SB Cryo-EM structures of fungal and metazoan mitochondrial calcium uniporters. Nature 559, 580–584 (2018). [DOI] [PMC free article] [PubMed] [Google Scholar]
- 25.Nguyen NX et al. Cryo-EM structure of a fungal mitochondrial calcium uniporter. Nature 559, 570–574 (2018). [DOI] [PMC free article] [PubMed] [Google Scholar]
- 26.Yoo J et al. Cryo-EM structure of a mitochondrial calcium uniporter. Science 361, 506–511 (2018). [DOI] [PMC free article] [PubMed] [Google Scholar]
- 27.Wang Y et al. Structural mechanism of EMRE-dependent gating of the human mitochondrial calcium uniporter. Cell 177, 1252–1261 (2019). [DOI] [PMC free article] [PubMed] [Google Scholar]
- 28.Wang LL et al. Structural and mechanistic insights into MICU1 regulation of mitochondrial calcium uptake. EMBO J 33, 594–604 (2014). [DOI] [PMC free article] [PubMed] [Google Scholar]
- 29.Xing YF et al. Dimerization of MICU proteins controls Ca2+ influx through the mitochondrial Ca2+ uniporter. Cell Rep 26, 1203–1212 (2019). [DOI] [PubMed] [Google Scholar]
- 30.Kamer KJ, Jiang W, Kaushik VK, Mootha VK & Grabarek Z Crystal structure of MICU2 and comparison with MICU1 reveal insights into the uniporter gating mechanism. Proc. Natl. Acad. Sci. USA 116, 3546–3555 (2019). [DOI] [PMC free article] [PubMed] [Google Scholar]
- 31.Wu W et al. The crystal structure of MICU2 provides insight into Ca2+ binding and MICU1-MICU2 heterodimer formation. EMBO Rep 20, e47488 (2019). [DOI] [PMC free article] [PubMed] [Google Scholar]
- 32.Kamer KJ & Mootha VK MICU1 and MICU2 play nonredundant roles in the regulation of the mitochondrial calcium uniporter. EMBO Rep 15, 299–307 (2014). [DOI] [PMC free article] [PubMed] [Google Scholar]
- 33.Davies KM, Anselmi C, Wittig I, Faraldo-Gomez JD & Kuhlbrandt W Structure of the yeast F1Fo-ATP synthase dimer and its role in shaping the mitochondrial cristae. Proc. Natl. Acad. Sci. USA 109, 13602–13607 (2012). [DOI] [PMC free article] [PubMed] [Google Scholar]
- 34.De La Fuente S et al. Strategic positioning and biased activity of the mitochondrial calcium uniporter in cardiac muscle. J. Biol. Chem 291, 23343–23362 (2016). [DOI] [PMC free article] [PubMed] [Google Scholar]
- 35.Singh AK, McGoldrick LL, Twomey EC & Sobolevsky AI Mechanism of calmodulin inactivation of the calcium-selective TRP channel TRPV6. Sci. Adv 4, eaau6088 (2018). [DOI] [PMC free article] [PubMed] [Google Scholar]
- 36.Dang SY et al. Structural insight into TRPV5 channel function and modulation. Proc. Natl. Acad. Sci. USA 116, 8869–8878 (2019). [DOI] [PMC free article] [PubMed] [Google Scholar]
- 37.Banerjee A, Lee A, Campbell E & Mackinnon R Structure of a pore-blocking toxin in complex with a eukaryotic voltage-dependent K+ channel. eLife 2, e00594 (2013). [DOI] [PMC free article] [PubMed] [Google Scholar]
- 38.Park CS & Miller C Interaction of charybdotoxin with permeant ions inside the pore of a K+ channel. Neuron 9, 307–313 (1992). [DOI] [PubMed] [Google Scholar]
- 39.Patron M, Granatiero V, Espino J, Rizzuto R & De Stefani D MICU3 is a tissue-specific enhancer of mitochondrial calcium uptake. Cell Death Differ 26, 179–195 (2019). [DOI] [PMC free article] [PubMed] [Google Scholar]
- 40.Rizzuto R et al. Close contacts with the endoplasmic reticulum as determinants of mitochondrial Ca2+ responses. Science 280, 1763–1766 (1998). [DOI] [PubMed] [Google Scholar]
- 41.Santulli G, Xie W, Reiken SR & Marks AR Mitochondrial calcium overload is a key determinant in heart failure. Proc. Natl. Acad. Sci. USA 112, 11389–11394 (2015). [DOI] [PMC free article] [PubMed] [Google Scholar]
- 42.Starkov AA, Chinopoulos C & Fiskum G Mitochondrial calcium and oxidative stress as mediators of ischemic brain injury. Cell Calcium 36, 257–264 (2004). [DOI] [PubMed] [Google Scholar]
- 43.Goehring A et al. Screening and large-scale expression of membrane proteins in mammalian cells for structural studies. Nat. Protoc 9, 2574–2585 (2014). [DOI] [PMC free article] [PubMed] [Google Scholar]
- 44.Mastronarde DN Automated electron microscope tomography using robust prediction of specimen movements. J. Struct. Biol 152, 36–51 (2005). [DOI] [PubMed] [Google Scholar]
- 45.Zheng SQ et al. MotionCor2: anisotropic correction of beam-induced motion for improved cryo-electron microscopy. Nat. Methods 14, 331–332 (2017). [DOI] [PMC free article] [PubMed] [Google Scholar]
- 46.Rohou A & Grigorieff N CTFFIND4: fast and accurate defocus estimation from electron micrographs. J. Struct. Biol 192, 216–221 (2015). [DOI] [PMC free article] [PubMed] [Google Scholar]
- 47.Grant T, Rohou A & Grigorieff N cisTEM, user friendly software for single-particle image processing. eLife 7, e35383 (2018). [DOI] [PMC free article] [PubMed] [Google Scholar]
- 48.Scheres SHW RELION: implementation of a Bayesian approach to cryo-EM structure determination. J. Struct. Biol 180, 519–530 (2012). [DOI] [PMC free article] [PubMed] [Google Scholar]
- 49.Punjani A, Rubinstein JL, Fleet DJ & Brubaker MA cryoSPARC: algorithms for rapid unsupervised cryo-EM structure determination. Nat. Methods 14, 290–296 (2017). [DOI] [PubMed] [Google Scholar]
- 50.Emsley P, Lohkamp B, Scott WG & Cowtan K Features and development of Coot. Acta Crystallogr. D 66, 486–501 (2010). [DOI] [PMC free article] [PubMed] [Google Scholar]
- 51.Adams PD et al. PHENIX: a comprehensive Python-based system for macromolecular structure solution. Acta Crystallogr. D 66, 213–221 (2010). [DOI] [PMC free article] [PubMed] [Google Scholar]
- 52.Chen VB et al. MolProbity: all-atom structure validation for macromolecular crystallography. Acta Crystallogr. D 66, 12–21 (2010). [DOI] [PMC free article] [PubMed] [Google Scholar]
- 53.Pettersen EF et al. UCSF chimera – a visualization system for exploratory research and analysis. J. Comput. Chem 25, 1605–1612 (2004). [DOI] [PubMed] [Google Scholar]
- 54.Ohlendieck K, Riesinger I, Adams V, Krause J & Brdiczka D Enrichment and biochemical characterization of boundary membrane contact sites from rat-liver mitochondria. Biochim. Biophys. Acta 860, 672–689 (1986). [DOI] [PubMed] [Google Scholar]
Associated Data
This section collects any data citations, data availability statements, or supplementary materials included in this article.


