

Abstract
The COVID-19 pandemic has led to extensive morbidity and mortality throughout the world. Clinical features that drive SARS-CoV-2 pathogenesis in humans include inflammation and thrombosis, but the mechanistic details underlying these processes remain to be determined. In this study, we demonstrate endothelial disruption and vascular thrombosis in histopathologic sections of lungs from both humans and rhesus macaques infected with SARS-CoV-2. To define key molecular pathways associated with SARS-CoV-2 pathogenesis in macaques, we performed transcriptomic analyses of bronchoalveolar lavage and peripheral blood and proteomic analyses of serum. We observed macrophage infiltrates in lung and upregulation of macrophage, complement, platelet activation, thrombosis, and proinflammatory markers, including C-reactive protein, MX1, IL-6, IL-1, IL-8, TNFα, and NF-κB. These results suggest a model in which critical interactions between inflammatory and thrombosis pathways lead to SARS-CoV-2-induced vascular disease. Our findings suggest potential therapeutic targets for COVID-19.
Keywords: SARS-CoV-2, vascular, thrombosis, complement, platelet, macrophage, IFNα, coagulation, vWF, collagen
Graphical Abstract
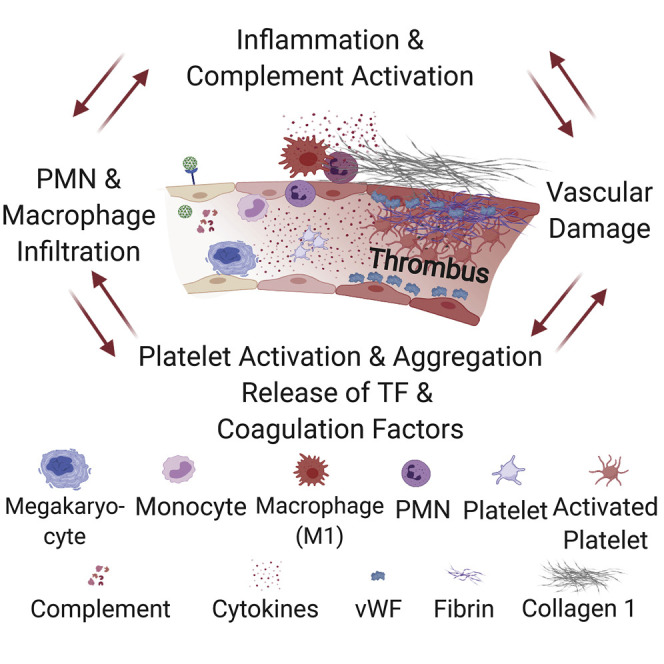
Aid et al. show that SARS-CoV-2 causes endothelial disruption and vascular thrombosis in both human and rhesus macaques lungs by inducing an upregulation of proinflammatory cytokines. Using an approach that combines histopathology and multiomics in macaques, they show the progression to vascular disease over time, which involves complement, macrophage, cytokine, and thrombosis cascades.
Introduction
Animal models are critical for studying SARS-CoV-2 pathophysiology and for preclinical evaluation of vaccines and therapeutics (Chandrashekar et al., 2020; Williamson et al., 2020; Yu et al., 2020). We and others have reported that rhesus macaques can be infected with SARS-CoV-2 and show robust viral replication in the upper and lower respiratory tract (Munster et al., 2020; Chandrashekar et al., 2020). However, the pathways underlying SARS-CoV-2-induced vascular disease have not yet been elucidated. Human studies have revealed a substantial role for inflammation in the pathogenesis of COVID-19 disease (Fung and Liu, 2019; Gralinski et al., 2018; Liao et al., 2020; McKechnie and Blish, 2020; Ravindra et al., 2020; Xiong et al., 2020; Yoshikawa et al., 2010; Zhou et al., 2020), including elevated proinflammatory cytokines (Huang et al., 2020; Blanco-Melo et al., 2020; Chen et al., 2020), which correlate with disease severity (Blanco-Melo et al., 2020; Chen et al., 2020; Qin et al., 2020; Zhou et al., 2020). Moreover, studies on autopsy specimens (Ackermann et al., 2020) and bronchoalveolar lavage (BAL) (Xiong et al., 2020; Zhou et al., 2020) fluid from infected patients suggested that complement activation and macrophages in the lungs may contribute to disease severity (Liao et al., 2020; Merad and Martin, 2020; Shen et al., 2020; Magro et al., 2020).
Clinical experience has also revelated the presence of elevated D-dimer, a fibrin degradation product, in critically ill patients (Lu et al., 2020) and extensive microvascular thromboses in autopsy specimens. These features are not typically observed with other respiratory viruses such as influenza (Carsana et al., 2020). Markers of endothelial and platelet activation were also enriched in patients with severe COVID-19 (Goshua et al., 2020). In this study, we compared pulmonary pathology in human autopsy specimens and rhesus macaques infected with SARS-CoV-2. We then evaluated the pathways underlying these processes in rhesus macaques using integrated histopathologic, transcriptomic, proteomic, and cytokine data.
Results
SARS-CoV-2 Infection in Humans and Rhesus Macaques Is Associated with Vascular Changes and Fibrin Deposition along Endothelial Vessels
SARS-CoV-2 infection has been associated with microvascular and macrovascular thrombosis and severe endothelial injury in humans (Ackermann et al., 2020; Magro et al., 2020; Noris et al., 2020; Trigonis et al., 2020). We conducted autopsies of COVID-19 patients in April 2020 at Beth Israel Deaconess Medical Center, Boston, MA, with research permission granted by the next of kin and approval by the Institutional Review Board. We observed vascular thromboses (Figures 1A and 1B) and endothelialitis and inflammation in the lung (Figures 1C and 1D), consistent with a recently published study (Ackermann et al., 2020).
Figure 1.

Comparative Pathology of SARS-CoV-2-Associated Vascular Changes in Humans and Rhesus Macaques
Histopathology images of endothelium from human autopsies of COVID-19 decedents (A–D) showing
(A) Thrombi in capillaries of the septae (arrow; H&E stain).
(B) Thrombus within alveolus (arrowhead) and fibrin deposition (magenta) within alveolar septae (Carstairs stain).
(C) Alveolar setae expanded by a lymphocytic infiltrate, and organizing pneumonia (arrowhead) and medium-sized arteriole with endothelial injury (arrow) and lymphocytes within the tunica intima and media of the vessel wall and expanding adjacent alveolar septae (Verhoeff-Van Gieson [vvG] stain).
(D) Organizing pneumonia with type II pneumocyte hyperplasia (arrowhead), and thrombosis (∗) with endothelialitis in the septal vessels with lymphocytes undermining the endothelium (arrow; H&E stain).
(E) Histopathology images of SARS-CoV-2-infected rhesus macaques demonstrate endothelialitis (H&E stain).
(F) Focal endothelial proliferation (vvG stain).
(G) Perivascular lymphocyte recruitment and extravasation with CD3 (white), CD31 endothelium (green), alpha-smooth muscle actin (aSMA, red), and DNA (blue).
(H) Higher magnification showing margination of CD8+ T lymphocytes (magenta) along endothelium.
(I) Microthrombus in alveolar septal capillary (H&E stain).
(J) Vascular proliferation and occlusion (vvG stain).
(K) Fibrin deposition (magenta) in alveolar septae (Carstairs stain).
(L) Fibrin deposition along endothelium of vessels (Carstairs stain).
(M) von Willebrand Factor (vWF).
(N) Collagen 1 immunohistochemistry from uninfected and SARS-CoV-2-infected macaques, 2 (D2) and 4 (D4) days following challenge. Scale bars, 20 μm (B, C, E, and I–L), 50 μm (A and F), 100 μm (D, G, H, M, and N). H&E, hematoxylin and eosin; vvG stain.
See also Figure S1.
We next evaluated histopathologic lung sections from a cohort of adult rhesus macaques (6–12 years old) on day 2 and day 4 following infection with SARS-CoV-2. Four regions from the left cranial and caudal lobes and four regions from the right cranial, middle, and caudal lobes, all including proximal and distal branches of the bronchial tree, were analyzed. Histopathology revealed prominent vascular changes including endothelialitis (Figure 1E), similar to that reported in humans (Ackermann et al., 2020; Varga et al., 2020) and characterized by hyperplastic endothelium, intimal proliferation, and adherence of macrophages and lymphocytes to the endothelium and perivascular space. Intimal thickening of inflamed medium-sized arteries was highlighted by Van Verhoeff Gieson silver stain for elastic fibers (Figure 1F). Using tissue multiplexed immunofluorescence (t-CyCIF) (Lin et al., 2018), we observed numerous CD8+ T lymphocytes adhering to the endothelium and in perivascular regions associated with endothelialitis (Figures 1G and 1H). We also observed microthrombi in alveolar septae (Figure 1I), similar to that seen in humans (Ackermann et al., 2020; Carsana et al., 2020). Irregular thickening of the endothelial lining in infected macaques was also associated with narrowed vessel lumina (Figure 1J). Moreover, early fibrin deposits (George et al., 2020) were observed in alveolar septae (Figure 1K) and along the endothelium of vessels (Figure 1L). This vascular pathology observed in SARS-CoV-2-infected macaques was not observed in simian immunodeficiency virus (SIV)- or Zika virus (ZIKV)-infected rhesus macaques (Figure S1 ).
Figure S1.

Comparative Endothelial Changes in Macaques Infected with SARS-CoV-2, ZIKV, or SIV, Related to Figure 1
Verhoeff-Van Gieson staining of pulmonary endothelium from (A–C) SARS-CoV-2 infected rhesus macaques 2 days following infection compared to (D) uninfected and (E, F) chronically SIV-infected rhesus macaques. Carstairs staining of lung from SARS-CoV-2 infected macaques 2 days following challenge showing fibrin deposits (magenta) within a vessel (G), alveolar septae (H) (arrow; with high magnification inset), along the endothelium (I) (arrow; with high magnification inset), as compared to a normal vessel from a SARS-CoV-2 animal on day 2 (J), an ZIKV infected macaque (K), and an uninfected macaque (L).
von Willebrand factor (vWF) is a key mediator of platelet adhesion and aggregation (Gragnano et al., 2017). We found increased vWF throughout the lung of infected animals compared to uninfected controls, including along the luminal side of blood vessel endothelial cells and within alveolar septae (Figure 1M). We also observed extensive collagen I deposition in lung parenchyma, including around blood vessels and within alveolar septae (Figure 1N), consistent with reports of fibroproliferation and pulmonary fibrosis in humans (George et al., 2020).
SARS-CoV-2 Infection Results in Rapid Induction of Molecular Signatures of Thrombosis Activators
To define key biological processes and pathways activated by SARS-CoV-2 infection, we performed bulk RNA sequencing (RNA-seq) transcriptomic profiling of BAL and peripheral blood samples, as well as serum proteomics, on days 1, 2, 4, 7, 10, and 14 following SARS-CoV-2 challenge in n = 9 rhesus macaques as well as n = 9 uninfected control samples from blood and serum and n = 5 uninfected control samples from BAL. Data from BAL and peripheral blood showed that genes with elevated expression on days 1–4 had largely returned to normal by day 14 including interferon and SARS-CoV-2 transcripts (Figure S2 ).
Figure S2.

SARS-CoV-2-Induced Transcriptional Changes in BAL and Peripheral Blood of Infected Macaques at Days 1–14 Post-Challenge, Related to Figure 2
(A) Barplots showing the number of differentially expressed genes (DEGs), in BAL (left panel) and peripheral blood (right panel) on days 1-14 following SARS-CoV-2 infection. Significant genes were assessed using a BH-adjusted p < 0.05.
(B) Heatmap of the normalized read counts of SARS-CoV-2 viral genes and interferonα genes at baseline (pre-challenges) and on days 1, 2, 4, 7, 10 and 14 post-challenge, identified by bulk RNA-Seq in BAL fluid. Reads count normalization was performed using the rlog() function in the DESeq2 R package. Significant genes were assessed using a BH-adjusted p < 0.05.
Gene set enrichment analysis (GSEA) (Subramanian et al., 2005) was performed for genes expressed in BAL and peripheral blood, and for proteins detected in serum, using a curated list of thrombosis-associated pathways; the list included signaling by transcription factors associated with neutrophil and monocyte-mediated inflammatory responses, platelet activation and aggregation (Xu et al., 2017; Elliott et al., 2013), as well as signatures for coagulation, thrombopoietin signaling, platelet activation and granulation, protein adhesion, formation of fibrin clots, and clotting cascade (Figure 2 A).
Figure 2.

Molecular Signatures of Thrombosis, Coagulation, and Fibrin Deposition in BAL, Peripheral Blood, and Serum of SARS-CoV-2-Infected Rhesus Macaques
(A) GSEA was performed using curated thrombosis-related signatures, compiled from ingenuity pathway analysis (QIAGEN), Reactome, PathCards, and Biocarta databases. For each time point post SARS-CoV-2 challenge, genes (BAL and blood) and proteins (serum) were ranked using the log2 fold change expression compared to baseline, from high to low fold change. The ranked list was submitted to GSEA. For each time point, signatures significantly enriched in the top (increased) or in the bottom (decreased) of the ranked lists were selected using a nominal p value cutoff of <0.05 and a false discovery rate (FDR) q-value of <0.20. Heatmaps represent the GSEA NES of significant pathways on days 1, 2, 4, 7, 10, and 14 in BAL and peripheral blood and on days 1, 2, 4, 10, and 14 in serum. Color gradient corresponds to the GSEA NES of pathways that are decreased (in blue) or increased (in red) following SARS-CoV-2 infection in rhesus macaques.
(B–D) Enrichment plots of the leading genes that contribute to the positive enrichment of thrombosis-related pathways shown in (A), in BAL (B), peripheral blood (C), and serum (D). The curves show the cumulative running enrichment score (ES), including the location of the maximum ES (peak of the curve) and the leading-edge genes represented by the small black bars on the x axis. The red plot corresponds to the ES for the pathway as the analysis walks down the ranked list. The small black bars on the x axis show where the members of the gene set appear in the ranked list of genes. The leading-edge subset of a gene set is the subset of members that contribute the most to the ES. All genes shown on the plots were increased by SARS-CoV-2 with a corrected p value (Benjamini-Hochberg method) <0.05.
See also Figures S2 and S3.
GSEA (Subramanian et al., 2005) revealed significant enrichment of transcriptomic and proteomics signatures associated with coagulation, thrombosis, and vascular disease in BAL, peripheral blood, and serum of infected macaques (Figure 2A). Pathways of coagulation and clotting cascade were increased on days 1–14 in BAL, peripheral blood, and serum of challenged macaques and included coagulation and tissue factors (F3, F5, F2, F8, and F11), markers of the clotting cascade (THBD and F13A1), and metalloproteinase genes (ADAMTS1) involved in the degradation of the extracellular matrix (Figures 2B–2D). Thrombomodulin (THBD) is an endothelial-specific type I membrane receptor that binds thrombin, and F13A1 encodes the coagulation factor XIIIA. Moreover, collagen is one of the major mediators of platelet activation and aggregation in response to tissue injury through various mechanisms including binding to vWF (Gragnano et al., 2017). We observed a significant increase of collagen and protein adhesion markers in BAL, peripheral blood, and serum (Figures 2B–2D), while vWF was upregulated only in peripheral blood and serum (Figures 2C and 2D, middle panels) of challenged macaques. These transcriptomic and proteomic findings confirm our histopathology and immunohistochemistry (IHC) data (Figure 1).
Additional thrombosis-associated markers, coagulation factors, and HIF1α signaling pathway previously reported in patients with severe inflammatory disease (Gangaraju et al., 2020) were upregulated in BAL, peripheral blood, and serum of infected macaques (Figure S3 A). Moreover, markers of platelet activation and aggregation and extracellular matrix organization (COL1A1, COL1A2, FN1, PF4, IGF1, and ADAM15), which were increased in patients with severe-to-critical COVID-19 disease (Ackermann et al., 2020), were also increased in BAL, peripheral blood, and serum of infected macaques (Figure S3B). To understand the mechanisms regulating thrombosis-associated markers increased by SARS-CoV-2, we performed upstream regulators analysis using ingenuity pathway analysis (IPA) on genes commonly upregulated by SARS-CoV-2 in humans (Ackermann et al., 2020) and macaques shown in Figure S3. This analysis showed interleukin (IL)-1 (p = 3.6E−10), IL-6 (p = 1.3E−06), tumor necrosis factor alpha (TNF-α) (p = 1.90E−10), transcription factors such as STAT3 (p = 1.90E−04) and NF-κB (p = 3.51E−08), and lipopolysaccharide (LPS) (p = 2.19E−11) (Figures S3C–S3E) as the top upstream regulators of thrombosis-associated markers increased by SARS-CoV-2 in patients with severe-to-critical disease and in macaques. Accumulating data suggest a role of LPS in boosting the proinflammatory responses following infection and disturbing the host immune response to infection (Arunachalam et al., 2020).
Figure S3.

SARS-CoV-2 Infection in Macaques Increased the Expression of Markers of Severe Inflammatory Disease Observed in Human and Markers of Severe to Critical COVID-19 Disease, Related to Figure 2
(A and B) Markers associated with thrombosis, HIF1α, coagulation factors (A) and thrombosis-associated markers increased in patients with severe to critical COVID-19 disease (B) increased in BAL, peripheral blood or serum of SARS-CoV-2 infected macaques. Heatmap gradient corresponds to the log2 transformed fold change on days 1-14 post challenge compared to baseline.
(C–E) Genes increased by SARS-CoV-2 from panels A and B, were uploaded into IPA for upstream regulators analysis. Upstream regulators predicted by IPA were represented by dark orange nodes and include transcription factors (C), cytokines (D), and chemicals (E). Each upstream regulator is connected to its target genes with a colored arrow that depicts activation. Solid and dashed lines correspond to direct and indirect interactions predicted by IPA.
SARS-CoV-2 Infection Induces Interferon and Inflammatory Pathways and Proinflammatory Cytokines in Macaques
Differential gene expression analysis revealed significant increase (Benjamini-Hochberg [BH]-adjusted p < 0.05) of viral sensing and interferon stimulated genes (ISGs) and proinflammatory markers as early as day 1 in both BAL and peripheral blood, similar to previous reports from humans infected with SARS-CoV-2 (Liao et al., 2020; Ravindra et al., 2020; Xiong et al., 2020). GSEA (Subramanian et al., 2005) showed significant increase of pathways of interferon alpha (IFNα), interferon gamma (IFNγ), TNFα, and inflammatory signaling on days 1–4 in BAL and peripheral blood of infected macaques (Figure 3 A). These changes generally resolved by days 10–14.
Figure 3.

Interferon and Inflammatory Pathways Increased by SARS-CoV-2 in BAL and Peripheral Blood of Infected Macaques
(A) Circles plot representation of the GSEA NES of interferon and inflammatory pathways (GSEA: FDR ≤ 5%) increased or decreased by SARS-CoV-2 in BAL (left panel) and in peripheral blood (right panel) on days 1, 2, 4, 7, 10, and 14 compared to control animals. An NES greater than 0 (in red) corresponds to a pathway for which member genes are increased by SARS-CoV-2, and an NES below 0 (in blue) corresponds to a pathway for which member genes are decreased by SARS-CoV-2. The size and color of each circle is proportional to the NES, where color gradient ranging from blue (significantly decreased), gray (not significant: FDR ≥ 5%), or red (significantly increased).
(B and C) Heatmaps of the log2 transformed fold change of interferon and inflammatory markers in BAL (B) and in peripheral blood (C) that are increased or decreased by SARS-CoV-2 on days 1, 2, 4, 7, 10, and 14 compared to baseline. Differential expression significance was assessed with a corrected p < 0.05 using Benjamini-Hochberg (BH) method.
(D) Heatmaps of log2 transformed fold change expression in serum (proteomics) of interferon genes, increased (in red gradient), decreased (in blue gradient), and white (not significant), on days 1, 2, 4, 10, and 14 compared to baseline. Differential expression significance was assessed with a corrected p < 0.05 using BH method.
(E and F) IHC shows increase of MX1 and pSTAT3 on day 2 or day 4 following SARS-CoV-2 challenge. Serial sections of lung tissue showed increased expression of MX1 (type 1 interferon response gene) (E) and phosphorylated STAT3 (Phospho-STAT3 (F). Scale bars, 100 μm.
See also Figure S4.
We observed a significant upregulation of ISGs and antiviral genes, including MX1, MX2, IFIT1-3, ISG15, IRF7, IFTM1, IFTM2, OAS1/2/3, DDX58, and IDO1 in BAL (Figure 3B) and peripheral blood (Figure 3C), as well as upregulation of inflammasome pathway, Toll-like receptors (TLRs) (TLR2/5/7), TNFα, colony stimulating factor (CSF), and NF-κB. Of note, RNA levels of IFNα genes including IFNA8, IFNA2, IFNA4, and IFNA10 were increased by SARS-CoV-2 in BAL (Figure 3B), whereas these IFNα transcripts were not detected by RNA-seq in peripheral blood or serum of infected macaques. Moreover, we compared the expression levels of IFNα genes and ISGs and inflammatory markers such as MX1, IRF7, TNF, NLRP3, and NF-κB and found ISGs and other inflammatory markers were expressed with higher magnitude compared to IFNα genes in BAL of infected macaques. Moreover, ISGs and inflammatory markers increased by SARS-CoV-2 in BAL, peripheral blood, and serum of macaques (Figure S4 ) were also increased in SARS-CoV-2-infected patients (Hadjadj et al., 2020).
Figure S4.

Markers of Interferon and Inflammatory Signaling Upregulated in Patients with Severe-to-Critical COVID-19 Disease Were Increased by SARS-CoV-2 in Macaques, Related to Figure 3
Markers of interferon and inflammatory signaling increased in BAL from patients with severe COVID-19 disease, and upregulated in BAL, peripheral blood and serum of rhesus macaques. Heatmaps represent the log2 fold change expression of these markers on days 1, 2, 4, 7, 10 and 14 in BAL, peripheral blood and serum.
Upregulation of inflammatory and ISGs markers by SARS-CoV-2 in macaques was validated by serum protein levels for C reactive protein (CRP), IFNA7, ISG15, MX1, and IDO1 among many others (BH-adjusted p < 0.05) (Figure 3D). Using immunohistochemistry, we further validated the upregulation of MX1, an interferon-induced protein with antiviral activity against a wide range of RNA viruses (Haller et al., 2007) and phosphorylated STAT3 (pSTAT3), which is activated by numerous cytokines and growth factors including IL-6 (Garbers et al., 2015; Hillmer et al., 2016; Xu et al., 2017) (Figures 3E and 3F).
Transcriptomic analyses revealed significant increase of cytokines and their downstream signaling pathways in BAL (Figure 4 A) and peripheral blood (Figure 4B), including IL-1RN, IL-6, IL-8, IL-4, IL-10, IL-27, IL-18, IL-15, IL-12, and IL-17. Signaling by IL-6_JAK_STAT3 was among the top enriched pathways in BAL (Figure 4C) (normalized enrichment score [NES] = 2.37; false discovery rate [FDR] q-value < 10−6) and peripheral blood (NES = 1.94; FDR q-value < 10−6) (Figure 4D). Elevated IL-6 and IL-10 levels were further validated by immunohistochemistry in the lung of SARS-CoV-2-infected animals compared to uninfected controls (Figures 4E and 4F).
Figure 4.

Cytokines and Chemokines Up- or Downregulated by SARS-CoV-2 in BAL, Peripheral Blood, and Serum of Infected Macaques
(A and B) (Left panels) Heatmaps of log2 transformed fold change expression of individual cytokines increased (in red gradient), decreased (in blue gradient), or white (not significant) in BAL (A) and peripheral blood (B) on days 1, 2, 4, 7, 10, and 14 compared to baseline. (Right panels) Heatmaps of the GSEA NES of cytokines’ signaling pathways increased (in red gradient), decreased (in blue gradient), or white (not significant) in BAL (A) and peripheral blood (B) on days 1, 2, 4, 7, 10, and 14 compared to baseline. All individual cytokines were significant with a p < 0.05 for at least one time point post-challenge compared to baseline and all cytokines’ signaling pathways were significant with a GSEA nominal p < 0.05 for at least one time point post-challenge compared to baseline. Star symbol indicates individual cytokines or chemokines and pathways that remain significant after correction for multiple comparisons (BH method) or using a FDR of <5%.
(C and D) Enrichment plot showing differentially expressed genes (DEGs) that contribute to the positive enrichment of the IL6-JAK-STAT3 signaling pathway on day 2 in BAL (C) and peripheral blood (D) of infected macaques. Plot of the running sum for pathway score in the dataset, including the location of the maximum ES and the leading-edge subset. The red plot shows the ES for the gene set as the analysis walks down the ranked list. The score at the peak of the plot (the score furthest from 0.0) is the ES for the gene set. The small black bars on the x axis show where the members of the gene set appear in the ranked list of genes. The leading-edge subset of a gene set is the subset of members that contribute most to the ES. The leading genes were shown for each plot.
(E and F) IHC shows increased expression of IL-6 (E) and IL-10 (F) on day 2 or day 4 following SARS-CoV-2 challenge. Scale bars, 100 μm.
(G) Heatmaps of log2 transformed fold change expression in serum (proteomics) of cytokines and chemokines increased (red gradient), decreased (blue gradient), and white (not significant), on days 1, 2, 4, 10, and 14 following challenge. Differential expression significance was assessed using a BH-corrected p < 0.05.
(H) Cytokine levels measured by the Luminex assay in BAL (top panel) and in serum (lower panel) increased by SARS-CoV-2 in rhesus macaques on days 1, 2, 4, 7, 10, 14, or 35. All the cytokines and chemokines that are significant (Wilcoxon-Mann-Whitney test, p < 0.05) for at least one time point were shown on the heatmaps. Color gradient ranging from white (not significant) to red (highly significant) corresponds to the log2 transformation of the fold change of cytokines’ median levels compared to baseline.
See also Figures S5 and S6.
In serum of infected macaques, we observed elevated protein levels of proinflammatory cytokines and chemokines such as CXCL11, IL-1RN, CXCL10, IL1-RL1, CCL8, CCL2, and CXCL12 (Figure 4G) as well as downstream signaling by IL-8, IL-6, and GM-CSF that were also increased in serum of infected animals (Figure S5 A). Serum cytokines levels, measured by Luminex, revealed increased IL-1β, IL-6, IL-1RA, IL-7, IL-8, and GM-CSF as well as chemokines involved in the recruitment and activation of macrophages, monocytes, and neutrophils such as CXCL11, CCL3, CCL2, and CCL11 and the B cell-attracting chemokine CXCL13 in BAL of infected macaques (Figure 4H, top panel). In peripheral blood, serum levels of IL-1RA, IL-8, and CXCL13 were significantly increased by SARS-CoV-2 (Figure 4H, lower panel).
Figure S5.

Signatures of Cytokines’ Signaling, Innate and Adaptive Immune Cell Populations, and Immune Exhaustion Were Increased in Serum, BAL, and Peripheral Blood of SARS-CoV-2-Infected Macaques, Related to Figure 4
(A) Functional analysis using ingenuity pathway (IPA) of proteins increased in serum on days 1-14. Genes increased in serum on infected macaques were uploaded into IPA for pathway enrichment analysis. Bar plots represent the IPA pathway enrichment Z-score, where color gradient corresponds to the –Log10 BH-adjusted p for each pathway (p < 0.05, Z-score > 2).
(B and C) Circles plot representation of the GSEA normalized enrichment score (NES) of innate (left panel) and adaptive (right panel) immune cells signatures (GSEA: FDR £ 5%) increased or decreased by SARS-CoV-2 in BAL (B) and in peripheral blood (C) of rhesus macaques. An NES greater than 0 (in red) corresponds to a pathway for which member genes are increased by Sars-CoV-2. an NES below 0 (in blue) corresponds to a pathway for which member genes are decreased by Sars-CoV-2. The size and color of each circle is proportional to the NES, where color gradient ranging from blue (decreased), gray (not significant: FDR > = 5%) and red (increased).
(D) Checkboard plot of immune exhaustion markers increased by SARS-Cov-2 in BAL and in peripheral blood on days 1, 2, 4, 7, 10 and 14 post-challenge. Color gradient corresponds to the log2 fold change expression on days 1, 2, 4, 7, 10 and 14 compared to baseline. All markers were selected using a BH-corrected p < 0.05.
GSEA (Subramanian et al., 2005) of genes upregulated in BAL and peripheral blood and histopathology also revealed upregulation of additional pathways including signatures of natural killer (NK), dendritic cells (DCs), neutrophils, monocytes, T cells, and B cells; (Figures S5B and S5C); markers of immune exhaustion (Figure S5D), apoptosis, and cell death (Figure S6 A); reactive oxygen species (ROS); and metabolism pathways such as mechanistic target of rapamycin (mTOR) signaling pathway (Figures S6B and S6C).
Figure S6.

Molecular Signatures of Cell Death and Apoptosis and Metabolism Increased in BAL and Peripheral Blood of SARS-CoV-2-Infected Macaques, Related to Figure 4
(A) Checkboard plot of cell death, apoptosis, and pyroptosis increased by SARS-Cov-2 in BAL (left panel) and in peripheral blood (right panel) on days 1, 2, 4, 7, 10 and 14. Color gradient corresponds to the log2 fold change expression on days 1, 2, 4, 7, 10 and 14 compared to baseline. All markers were selected using a BH-adjusted p < 0.05.
(B) Circles plot representation of the GSEA normalized enrichment score (NES) of metabolism signatures (left panel: BAL; right panel: peripheral blood) increased by SARS-CoV-2. An NES greater than 0 (in red) corresponds to a pathway for which member genes are increased by SARS-CoV-2, an NES below 0 (in blue) corresponds to a pathway for which member genes are decreased by Sars-CoV-2. An NES > 0 (in red) corresponds to a pathway for which member genes are increased by Sars-CoV-2. The size and the color of each circle is proportional to the NES, where color gradient ranging from blue (decreased), gray (not significant: FDR > 5%) and red (increased).
(C) Rhesus macaques were necropsied before (SARS-CoV-2 negative) or after high-dose SARS-CoV-2 challenge on day 2 (D2) and day 4 (D4) following challenge. Serial sections of lung tissue showed increased expression of phosphorylated mTOR (Phospho-mTOR). Scale bars = 100 μm.
SARS-CoV-2 Infection Leads to Massive Macrophage Infiltrates and Macrophage Activation in the Lung of Infected Macaques
Consistent with reports from SARS-CoV-2-infected humans (Felsenstein et al., 2020; Liao et al., 2020; Merad and Martin, 2020), t-CyCIF analysis of lung sections from rhesus macaques on day 2 and day 4 following SARS-CoV-2 challenge showed large numbers of CD68 and CD163 positive macrophages in large airways and filling alveoli throughout regions of consolidation and abnormal pathology (Figures 5A and 5B) as compared to uninvolved regions of lung in the same animal (Figure 5C). In consolidated regions of the lung (regions in which alveoli are filled with fluid), many cells found in large airways, alveoli, and the interstitium were also positive for CD16, a marker of monocyte/macrophages and NK cells in rhesus macaques (Webster and Johnson, 2005) (Figures 5D–5F). In contrast, CD206-positive macrophages were frequently observed in alveolar septae in uninvolved regions of the lung (Figure 5F). CD16-positive monocytes may have the ability to bind endothelium, extravagate, and replenish tissue macrophages in response to inflammation (Nowlin et al., 2018). Macrophages in affected lung and within airways were universally positive for the pan-macrophage and activation marker Iba-1 (Figures 5G–5I).
Figure 5.

Multiplexed CyCIF Immunofluorescence Images Showing Macrophages in the Lungs of SARS-CoV-2-Challenged Macaques as well as Macrophages Transcriptional Signatures in BAL, Peripheral Blood, and Serum of Infected Macaques
Multiplexed CyCIF images showing macrophage populations in large airways (A, D, and G) and in bronchioles and alveoli (B, E, and H) in regions of lung consolidation as compared to uninvolved lung on day 2 following SARS CoV-2 infection. Tissue architecture is defined by E-Cadherin (grayscale), smooth muscle actin (aSMA, magenta), and DNA (blue).
(A–C) CD68 (green) and CD163 (red) are used to stain macrophages in the context of the tissue markers smooth muscle actin (αSMA, magenta).
(D–F) Alveolar (CD206, red) and reactive (CD16, green and CD68, magenta) macrophage markers.
(G–I) Staining for activated macrophages (IBA1, green). Scale bars, 200 μM.
(J) Heatmaps presenting the sample-level enrichment analysis (SLEA) Z score of macrophages’ signatures for each individual animal at baseline and on days 1, 2, 4, 7, 10, and 14 following SARS-CoV-2 infection in BAL (top panel) and in peripheral blood (lower panel). Columns are grouped by time point, where each column corresponds to an individual animal. Each row represents a signature of macrophages that is increased by SARS-CoV-2. An SLEA Z score greater than 0 corresponds to a pathway for which member genes are upregulated, whereas an SLEA Z score less than 0 corresponds to a pathway for which genes are downregulated in that sample.
(K and L) Markers of macrophages CD163 and CD68 increased in BAL (K) and peripheral blood (L). Heatmaps show the row-scaled expression (using the Z score method) of CD163 and CD68 across all animals. Animals were grouped by time point. Columns correspond to individual animals, and rows correspond to genes. Differential expression significance was assessed with a BH-adjusted p < 0.05.
(M and N) Enrichment plot showing DEGs that contribute to the positive enrichment of M1 macrophages’ signature on day 2 post-challenge in BAL (M) and in peripheral blood (N). The curve shows the cumulative ES of the M1 signature, including the location of the maximum ES (peak of the curve) and the leading-edge genes. The red plot shows the ES for the gene set as the analysis walks down the ranked list. The small black bars on the x axis show where the members of the gene set appear in the ranked list of genes. The leading-edge subset of a gene set is the subset of members that contribute the most to the ES. Selected leading-edge genes were shown for each plot.
(O) Heatmap showing the row-scaled expression of markers of M1 macrophages’ signature in serum on days 1, 2, 4, 10, and 14 following SARS-CoV-2 infection. Columns represent individual animals grouped by time point and each row corresponds to an individual protein. Proteins’ expressions were scaled using the row Z score method and ranges from cyan (highly decreased) to red (highly increased). Differential expression significance was assessed with a BH-adjusted p < 0.05.
We also observed enrichment of transcriptional signatures of M0, M1, and M2 macrophages and IL-6-, IL-10-, and IFNα-activated macrophages in BAL and peripheral blood on days 1–4 post-challenge (Figure 5J). Consistent with the t-CyCIF analysis, markers of macrophages (CD163, CD68) were significantly increased by SARS-CoV-2 in BAL and peripheral blood of macaques (Figures 5K and 5L). Of note, the enrichment level of M1 macrophages’ signature in both BAL (NES = 2.5; FDR q-value < 10−6) and peripheral blood (NES = 2.41; FDR q-value < 10−6) was higher compared to M0 and M2 signatures (Figures 5M and 5N). The upregulation of macrophages’ M1 signature by SARS-CoV-2 was further validated in serum of infected macaques on days 2–4 post-challenge (Figure 5O). These histopathologic, transcriptomic, and proteomic data suggest a critical role of activated macrophages in the pathogenesis of SARS-CoV-2 infection in rhesus macaques.
SARS-CoV-2 Infection Increases Activation of Complement and Platelets
Lung sections of rhesus macaques on day 2 and day 4 following SARS-CoV-2 infection showed increased expression of key components of the complement pathway (Cedzyński et al., 2019), including complement receptor 1 (CR1) and C3, compared to uninfected controls (Figure 6 A). Transcriptomic analysis of BAL and peripheral blood of infected macaques similarly demonstrated upregulation of complement pathways on days 1–4 in BAL (day 2: NES = 1.60; FDR q-value = 0.003) and in peripheral blood (day 2: NES = 1.95; FDR q-value < 10−6), including complement markers C1R, C1S, C1QA, and C1QC; ficolin markers (e.g., FCN1 and FCN3); tissue factor F3; and fibronectin FN1 (Figure 6B; Figure S7 A). We further validated the upregulation of the complement cascade in serum by proteomics, which demonstrated increased serum levels of multiple complement components and complement cascade, including C1R, C1QC, C3b/C4b receptor 1 (CR1), and C3 and coagulation factors II, V, IX, and X (F2, F5, F9, and F10) (Figure 6C). Additionally, signatures of platelet activation, aggregation, and adhesion (Figures S7B and S7C) and signatures of megakaryocyte cells (Rapkiewicz et al., 2020) (Figure S7D) were also increased by SARS-CoV-2 in BAL and peripheral blood of infected macaques.
Figure 6.

Complement Activation and Coagulation Cascade Pathways Increased by SARS-CoV-2 in BAL, Peripheral Blood, and Serum of Infected Macaques
(A) Rhesus macaques were necropsied before (SARS-CoV-2 negative) or after high-dose SARS-CoV-2 challenge on day 2 (D2) and day 4 (D4) following challenge. Serial sections of lung tissue showed increased expression complement receptor 1 (CR1) and complement component 3 (C3). Scale bars, 100 μm.
(B) Enrichment plot showing DEGs that contribute to the positive enrichment of the complement pathway on day 2 in BAL (left panel) and in peripheral blood (right panel) of infected macaques. The curve shows the cumulative running ES of the complement pathway, including the location of the maximum ES (peak of the curve) and the leading-edge genes. The red plot shows the running ES for the gene set as the analysis walks down the ranked list. The small black bars on the x axis show where the members of the gene set appear in the ranked list of genes. The leading-edge subset of a gene set is the subset of members that contribute the most to the ES. Selected leading-edge genes were shown for each plot.
(C) Heatmap shows the row-scaled expression (Z score) for complement activation markers and complement cascade in serum on days 1, 2, 4, 10, and 14 following SARS-CoV-2 infection. Columns represent individual animals grouped by time point and each row corresponds to an individual protein. Proteins expression were averaged using the row Z score method and ranges from cyan (highly decreased) to red (highly increased). Differential expression significance was assessed with a BH-adjusted p < 0.05.
See also Figure S7.
Figure S7.

SARS-CoV-2 Infection Increased Expression of Signatures of Complement, Platelet Activation and Adhesion, and Megakaryocytes in BAL and Peripheral Blood of Infected Macaques, Related to Figure 6
(A) Enrichment plot of DEGs that contribute to the positive enrichment of signatures of complement activation cascade on days 1 and 4 in BAL (top panels) and in peripheral blood (lower panels). The curve shows the cumulative running pathway enrichment score ES, including the location of the maximum enrichment score (peak of the curve) and the leading-edge genes represented by the small black bars on the x axis. The red plot corresponds to the running ES for the gene set as the analysis walks down the ranked list. The small black bars on the x axis show where the members of the gene set appear in the ranked list of genes. The leading-edge subset of a gene set is the subset of members that contribute the most to the ES. False discovery rate (FDR) and the normalized enrichment score (NES) were shown for each plot.
(B) GSEA was performed using signatures of platelet activation and aggregation compiled from the MSigDB C2 database. Heatmaps represent the GSEA normalized enrichment score on days 1-14 in BAL (top panel) and peripheral blood (lower panel). Color gradient corresponds to the GSEA normalized enrichment score of pathways decreased (in blue) or increased (in red) following SARS-CoV-2 infection in rhesus macaques. All pathways were significant for at least one time point with a false discovery rate (FDR) < 0.10 and a nominal p of < 0.05.
(C and D) Enrichment plot of DEGs that contributed to the positive enrichment of signatures of platelet activation and aggregation on day 1 (left panel) and platelet adhesion to collagen on day 14 (right panel) in peripheral blood (C) and signature of megakaryocyte cells on day 2 in BAL (left panel) and on day 4 (right panel) in peripheral blood (D). The curve shows the cumulative running pathway enrichment score ES, including the location of the maximum enrichment score (peak of the curve) and the leading-edge genes represented by the small black bars on the x axis. The red plot corresponds to the running ES for the gene set as the analysis walks down the ranked list. The small black bars on the x axis show where the members of the gene set appear in the ranked list of genes. The leading-edge subset of a gene set is the subset of members that contribute the most to the ES. Geneset false discovery rate (FDR) or nominal p values were shown.
Finally, our analysis revealed that the expression level of innate immune markers increased by SARS-CoV-2 correlated positively with viral loads in BAL on day 2 post-challenge (Figure 7 A), including cytokines and inflammatory markers (IL-6R, IL1RN, IL-10, CXCL10, TNF, NFKB1, and NLRP3), ISGs (IRF7, IFIT1, and MX1), IFNα genes (IFNA2, IFNAR2, and IFNA4), and thrombosis-associated markers (C1QA, C3AR1, THBD, and FN1). These markers were also correlated positively with viral loads in BAL on days 1–10 post-challenge (Figure 7B). Of note, the expression of these markers returned to normal levels around days 10–14, consistent with resolved infection in macaques.
Figure 7.

Proinflammatory Cytokines, ISGs, IFNα, and Complement Cascade Genes Correlated with SARS-CoV-2 Viral Loads in BAL of Infected Macaques
(A) The expression of cytokines, ISGs, IFNα, and complement correlated with day 2 viral loads in BAL. The x axis corresponds to gene raw read counts and the y axis corresponds to log10 SARS-CoV-2 RNA copies/mL in BAL. A Spearman correlation was used for statistical analysis.
(B) The expression of additional cytokines, chemokines, and ISGs correlated positively with viral loads in BAL on days 1, 2, 4, 7, and 10 post SARS-CoV-2 challenge. Colored lines connecting genes with time points represent the Spearman correlation between the expression of each gene with viral loads across all animals for the same time point. For clarity, each time point was shown in a different color.
Discussion
SARS-CoV-2-infected rhesus macaques demonstrated thrombosis, endothelialitis, and endothelial disruption, analogous to the vascular disease in SARS-CoV-2-infected humans. Our histopathologic, transcriptomic, and proteomic analyses suggest a model in which upregulation of inflammatory and complement pathways leads to recruitment of macrophages and neutrophils, activation of platelets and adhesion and aggregation at the site of vascular injury, and triggering of the coagulation cascade, resulting in endothelial damage and thrombosis.
We observed microthrombi in the alveolar septae of SARS-CoV-2-infected rhesus macaques and increased fibrin and vWF deposition in the lungs of infected animals (Ackermann et al., 2020; Trigonis et al., 2020). The RNA and protein levels of vWF were also increased in peripheral blood and serum of infected animals (Figures 2C and 2D). We observed vascular intimal thickening with lymphocytic infiltrates, features of endothelialitis that have been observed in SARS-CoV-2-infected humans (Ackermann et al., 2020), as well as rapid and robust upregulation of molecular signatures associated with inflammation and thrombosis, including M1 macrophage infiltration in lung tissue (Carsana et al., 2020; Liao et al., 2020) and signatures in BAL and peripheral blood of proinflammatory cytokines, including IL-1, IL-6, and IL-8 (Mangalmurti and Hunter, 2020). In addition, our histopathologic, transcriptomic, and proteomic data suggest a critical role for complement, which may drive both inflammation and thrombosis (Lo et al., 2020). It has been suggested that the SARS-CoV-2 nucleocapsid may specifically activate the complement cascade through direct binding to MASP-2 (Noris et al., 2020). In our study, SARS-CoV-2-infected rhesus macaques exhibited increased C1R and C3 expression within the lung alveoli septae and vascular endothelium as well as increased complement C1R, C1S, and C3 levels in serum of infected macaques.
Similar to reports in infected humans, SARS-CoV-2 upregulated proinflammatory cytokines and chemokines in BAL and peripheral blood in macaques (Figure 3 and 4). Human studies of interferon and ISGs in SARS-CoV-2-infected patients have led to a diversity of outcomes (Hadjadj et al., 2020; Lucas et al., 2020), potentially as a result of differences in clinical cohorts and disease severity. Rhesus macaques do not develop severe or lethal SARS-CoV-2 disease and thus cannot inform the pathogenesis of severe disease. Nevertheless, our data are consistent with the findings of upregulated IFNα genes and ISGs in humans with mild or moderate disease (Hadjadj et al., 2020) as well as the transition from high to low IFNα responses over time, likely reflecting resolving infection (Lucas et al., 2020). Future studies could assess the impact of age on pathophysiology in the macaque model.
Overall, our data suggest a key role for IFNα, proinflammatory cytokines, activated macrophages, and complement activation in triggering the endothelial damage and thrombosis observed with SARS-CoV-2 infection. These findings improve our understanding of SARS-CoV-2 pathogenesis in rhesus macaques and suggest that cross-talk between the inflammatory and thrombosis pathways contributes to SARS-CoV-2-associated vascular disease (Ackermann et al., 2020; Bikdeli et al., 2020; Magro et al., 2020; Trigonis et al., 2020). These data also suggest therapeutic targets in the interferon, inflammatory, coagulation, and complement pathways.
STAR★Methods
Key Resources Table
| REAGENT or RESOURCE | SOURCE | IDENTIFIER |
|---|---|---|
| Antibodies | ||
| aSMA-AF750 | R&D Systems | Cat. No. IC1420S; clone 1A4; RRID: AB_2868436 |
| CD16-AF647 | Santa Cruz Biotechnology | Cat. No. sc-20052 AF647; clone DJ130c; RRID: AB_626925 |
| CD163-AF488 | Thermo-Fisher | Cat. No. MA5-11458; clone EPR14643; RRID: AB_10982556 |
| CD206-AF488 | Santa Cruz Biotechnology | Cat. No. sc-376108 AF488; clone D-1; RRID: AB_10987732 |
| CD31-AF647 | Abcam | Cat. No. ab218582; clone EPR3094; RRID: AB_2857973 |
| CD3D-AF647 | Abcam | Cat. No. ab198937; clone EP4426 |
| CD68-PE | Cell Signaling Technology | Cat. No. 79594S; clone D4B9C; RRID: AB_2799935 |
| CD8A-eF660 | Thermo-Fisher | Cat. No. 50-0008-80; clone AMC908; RRID: AB_2574148 |
| ECAD-AF488 | Cell Signaling Technology | Cat. No. 3199S; clone 24E10; RRID: AB_10691457 |
| IBA1-AF488 | Abcam | Cat. No. ab195031; clone EPR6136(2) |
| Mouse IgG-AF647 | Thermo-Fisher | Cat. No. A21237; RRID: AB_1500743 |
| MPO-AF488 | Abcam | Cat. No. ab225474; clone EPR20257 |
| Mx1 | EMD Millipore | Cat. No. MABF938; clone M143/CL143 |
| IL-6 | Sigma | Cat. No. SAB4301665 |
| IL-10 | Santa Cruz | Cat. No. sc-8438; clone E10; RRID: AB_627793 |
| VWF | Abcam | Cat. No. ab179451; clone EPR12010 |
| Collagen I | Sigma | Cat. No. C2456; clone COL-1; RRID: AB_476836 |
| pSTAT3 | Cell Signaling | Cat. No. 9145L; clone D3A7; RRID: AB_2491009 |
| TGFβ | Abcam | Cat. No. ab215715; clone EPR21143 |
| CR1/CD35 | Sigma | Cat. No. HPA049348; RRID: AB_2680723 |
| C3 | Sigma | Cat. No. HPA020432; RRID: AB_1847118 |
| p-MTOR | Cell Signaling | Cat. No. 2976S; clone 49F9; RRID: AB_490932 |
| SARS Rabbit Polyclonal Nucleocapsid Protein Antibody | Novus | Cat. No. NB100-56576; RRID: AB_838838 |
| Rabbit Polink-1 HRP | GBI Labs | Cat. No. D13-110 |
| Rabbit Polink-2 HRP | GBI Labs | Cat. No. D39-110 |
| Mouse Polink-2 HRP | GBI Labs | Cat. No. D37-110 |
| Bacterial and Virus Strains | ||
| SARS-CoV2 | BEI Repository | Strain MN985325.1 |
| Biological Samples | ||
| Adult autopsy lung tissue, formalin fixed, paraffin embedded tissue cores from two patients infected with SARS-CoV-2 | Beth Israel Deaconess Medical Center clinical autopsy service | Patient identifiers: AA20-38 and AA20-40 |
| Non-human primate SARS-CoV2 infected lung tissue, paraformaldehyde fixed, paraffin embedded | Bioqual, Inc.; Tufts Cummings School of Veterinary Medicine | Animal identifiers: 7253, 7255, 7259, and 7260 (Chandrashekar et al., 2020). |
| Critical Commercial Assays | ||
| Luminex multiplex assays | ThermoFisher | Cytokine/Chemokine/Growth Factor 37-Plex NHP ProcartaPlexTM Panel |
| SOMAmer® reagents, single-stranded DNA aptamers to 4776 unique Human Protein Targets | Somalogic | https://www.somalogic.com/wp-content/uploads/2016/08/SSM-002-Rev-3-SOMAscan-Technical-White-Paper.pdf |
| VECTOR®NovaRED™: Peroxidase Substrate Kit | Vector Lab., Inc. | Cat. No. SK-4800; RRID: AB_2336845 |
| Carstairs stain | Rowley Biochemical, Inc. | Cat. No. F-381 |
| Verhoffs Van Gieson stain | Rowley Biochemical, Inc. | Cat. No. F-374 |
| Impact™ DAB | Vector Lab., Inc. | Cat. No. SK-4105; RRID: AB_2336520 |
| Deposited Data | ||
| Raw and analyzed data | This paper | GEO: GSE156701 |
| Experimental Models: Organisms/Strains | ||
| Macaca mulatta - MacaM | https://www.unmc.edu/rhesusgenechip/index.htm | https://www.unmc.edu/rhesusgenechip/index.htm |
| Software and Algorithms | ||
| R programming language | Bioconductor | https://www.bioconductor.org/ |
| GeneCard | Weizmann institute of science | https://www.genecards.org/ |
| GSEA | BROAD Institute | https://www.gsea-msigdb.org/gsea/index.jsp |
| Ingenuity pathway analysis (IPA) | QIAGEN | https://www.ingenuity.com |
| SomaDataIO R package | Somalogic | Somalogic |
| R function adat2eSet | Somalogic | Somalogic |
| FastQC | Babraham Bioinformatics group | http://www.bioinformatics.babraham.ac.uk/projects/fastqc/ |
| gffread utility | Pertea and Pertea, 2020 | https://github.com/gpertea/gffread |
| DESeq2 | Bioconductor | R statistical software 3.5.1 |
| Biorender | Biorender.com | R statistical software 3.5.1 |
| estimateSizeFactors() function | Bioconductor | R statistical software 3.5.1 |
| DESeqDataSetFromHTSeqCount() function | Bioconductor | R statistical software 3.5.1 |
| Cytoscape | https://cytoscape.org | version 3.6.0 |
| GeneMANIA | http://genemania.org | version 3.3.1 |
| STAR v2.7.3 | Dobin and Gingeras, 2015 | https://github.com/alexdobin/STAR/releases |
| Sample-level enrichment analysis | Gundem and Lopez-Bigas, 2012 | https://github.com/sekalylab/rv144 |
| Other | ||
| mcmicro | Laboratory of Systems Pharmacology, Harvard Medical School | https://github.com/labsyspharm/mcmicro |
Resource Availability
Lead Contact
Further information and requests for resources and reagents should be directed to and will be fulfilled by the Lead Contact, Dr. Dan Barouch (dbarouch@bidmc.harvard.edu).
Materials Availability
This study did not generate new unique reagents.
Data and Code Availability
The accession number for the raw bulk RNA-Seq of BAL and peripheral blood data reported in this paper is Gene Expression Omnibus (GEO) accession GSE156701.
Experimental Model and Subject Details
Human subjects
Patients’ families were consented for limited autopsies by a pathologist (JLH) during a witnessed phone call immediately after the death through referral from the intensive care unit (ICU). Research using autopsy tissue for this project was approved by the Beth Israel Deaconess Medical Center IRB (IRB protocol 2020P000525). A HIPAA waiver was granted by the institutional review board for access to the patients’ charts for each project using the tissue.
Patient 1 (91 years old, male, 10-day hospital course) presented with low-grade fever and malaise, and negative chest X-ray without pulmonary symptoms. His labs showed lymphopenia and elevated inflammatory markers (CRP 110 mg/L Ferritin 1169 ng/mL) with a positive nasopharyngeal swab for COVID-19. He had profound hypotension following hemodialysis sessions, and progressive decline in strength and mental status. He was transitioned to comfort measures and died on day 10. Autopsy findings were consistent with the clinical story showing lungs with patchy pulmonary edema and acute alveolar hemorrhage, but without significant inflammation. The spleen showed white pulp depletion and red pulp expansion. The heart showed non-specific patchy replacement fibrosis, but no acute changes or inflammation. The liver was normal and he had end stage kidneys.
Patient 2 (82 years old, female, 16-day hospital course) had a history of infarct-related dementia with aspiration pneumonia 1 month prior to admission. After an initial recovery, she represented with fever, hypoxia, and respiratory distress requiring oxygen supplementation. She was septic with metabolic acidosis. After response to antibiotic and fluid resuscitation, she tested positive for COVID-19 by swab and was discharged to in-patient hospice where her respiratory status declined until death. Autopsy findings matched the clinical picture of lung injury and sepsis. The lungs showed diffuse alveolar damage. In less involved areas, a section showed a prominent septal lymphocytic infiltrate and type-II pneumocyte hyperplasia with multinucleated forms. Spleen had red pulp expansion and focal infarction. The heart showed no acute ischemic change, but there was a mild lymphocytic infiltrate between myocytes and around small vessels with rare microthrombi. Her liver showed central necrosis and kidneys showed acute tubular injury related to septic shock. Her kidneys showed changes related to her background chronic hypertension.
Animal models
13 outbred, healthy, research-naive Indian-origin adult male and female rhesus macaques (Macaca mulatta), 6-12 years old, were infected with SARS-CoV-2. All animals were singly housed in the ABSL3 facility at Bioqual, Inc. (Rockville, MD) and received routine veterinary care. Virus was administered as 1 mL by the intranasal (IN) route (0.5 mL in each nare) and 1 mL by the intratracheal (IT) route. A subset of macaques was necropsied on either day 2 (N = 2) or and day 4 (N = 2) following SARS-CoV-2 infection. All animal studies were conducted in compliance with all relevant local, state, and federal regulations and were approved by the Bioqual Institutional Animal Care and Use Committee (IACUC). Bronchoalveolar lavage (BAL), EDTA anticoagulated blood, and serum samples were collected at baseline (pre-challenge) and on days 1, 2, 4, 7, 10 and 14 following SARS-CoV-2 challenge. BAL samples were centrifuged for 10 min at 4 degrees at 2200 rpm, and the supernatant was aliquoted. Cells which were then resuspended in 100 uL RPMI and injected into the paxgene tubes. Tubes were wrapped in parafilm and frozen upright at −80C.
Method Details
Immunohistochemistry
Tissues were fixed in freshly prepared 4% paraformaldehyde for 24 h, transferred to 70% ethanol, and paraffin embedded within 7-10 days. Slides (5 μm sections) were baked for 30-60 min at 65 degrees then deparaffinized in xylene and rehydrated through a series of graded ethanol to distilled water. For IL-6, IL-10, Von Willebrand Factor (vWF), TGFβ, collagen I, phospho-STAT3, CR1/CD35, complement component 3 (C3), Mx1, and phospho-MTOR IHC, staining was performed either manually or using a Biocare intelliPATH autostainer. Heat induced epitope retrieval (HIER) was performed with the antigen retrieval buffers citraconic anhydride (0.01% containing 0.05% Tween; for IL-10, collagen I, pSTAT3, TGFβ, CR1/CD35, Mx1, and p-mTOR), ACD P2 (ACD Cat. No. 322000; for IL-6 and VWF) or Tris-HCl (0.01M, pH 8.6; for C3) in a Biocare NxGen Decloaking Chamber at 110°C for 15 min, cooled for 20 min, then rinsed twice in ddH2O and 1x TBS with 0.05% Tween-20 (TBS-T). Slides were incubated with blocking buffer (TBS-T with 0.25% casein) for 30 min at room temperature (except for slides stained with antibodies against IL-10, vWF, and CR1/CD35), rinsed with TBS-T, and incubated at room temperature with antibodies against IL-6 (Sigma; Cat. No. SAB4301665), IL-10 (Santa Cruz; Cat. No. sc-8438), vWF (Abcam; Cat. No. ab179451), Mx1 (EMD Millipore Cat. No. MABF938; clone M143/CL143), phospho-STAT3 (Cell Signaling; Cat. No. 9145L), TGFβ (Abcam; Cat. No. ab215715), CR1/CD35 (Sigma; Cat. No. HPA049348), C3 (Sigma; Cat. No. HPA020432) and phospho-MTOR (Cell Signaling; Cat. No. 2976S), which were diluted in blocking buffer. An additional proteinase retrieval step, using 4 μg/mL of Proteinase K in a 0.02M Tris pH7.4, 2 μM CaCl2 buffer for 20 min at room temperature before blocking, is required for optimal staining against collagen I (Sigma; Cat. No. C2456). Endogenous peroxidases were blocked with 1.5% H2O2 in TBS-T for 10 min. Slides were then incubated with Rabbit Polink-1 HRP (GBI Labs; Cat. No. D13-110; for VWF, TGFβ, and C3), Rabbit Polink-2 HRP (GBI Labs; Cat. No. D39-110; for IL-6, CR1/CD35, pSTAT3 and p-mTOR) or Mouse Polink-2 HRP (GBI Labs; Cat. No. D37-110; for IL-10, Mx1, and Collagen I). Slides were developed using Impact DAB (3,3¢-diaminobenzidine; Vector Laboratories), washed in ddH2O, counterstained with hematoxylin, mounted in Permount (Fisher Scientific), and scanned at 20x magnification on an Aperio AT2 (Leica Biosystems).
Histopathology
Special Stains. Lung sections were stained to identify fibrin and platelets using Carstairs’ Method per supplier’s recommendations. Briefly, slides were cut at 2 μm, deparaffinized, rehydrated and sequentially stained as follows: 1) Ferric ammonium sulfate, 5% (Rowley Biochemical F-381-1) for 5 min then rinsed in tap water 2) Mayer’s Hematoxylin (Rowley Biochemical F-381-2) for 5 min then rinsed in running tap water 3) Picric Acid-Orange G Solution (Rowley Biochemical F-381-3) for 30 min and rinsed in distilled water 4) Ponceau Fuchsin solution (Rowley Biochemical F-381-4) for 5 min and rinsed in distilled water 5) Phosphotungstic Acid 1% (Rowley Biochemical F-381-5), 2 changes, 5 s each and rinsed in distilled water 6) Aniline Blue Solution (Rowley Biochemical F-381-6) for 30 min, rinsed in distilled water, dehydrated and coverslipped. To identify elastic fibers of blood vessels, Verhoeff’s Van Gieson’s Method (vvG) was used. Slides were cut at 5 μm, deparaffinized, rehydrated and sequentially stained as follows using freshly prepared 10% working solution of vvG as indicated per supplier’s recommendations (Rowley Biochemical F-374-1): 1) Stain in Working Verhoeff’s Solution for one h then rinse in 2changes tap water 2) differentiate in Ferric Chloride 10% agitating gently for 2 dips then rinse in distilled water 3) treat with Sodium Thiosulfate 5% (Rowley BiochemicalF-374-5) for 1 min then rinse in running tap water for 5minutes 4) counterstain in Van Gieson’s solution (Rowley Biochemical F-374-6) for 5 min, then dehydrate and coverslip. Tissue pathology was assessed independently by two veterinary pathologists (AJM and ADM).
Cyclic Immunofluorescence
Cyclic Immunofluorescence (CyCIF) was performed as previously described (Lin et al., 2018). Briefly, paraformaldehyde fixed specimens on glass slides were dewaxed and antigen retrieval performed on a Leica Bond RX. Slides were then subjected to CyCIF using the antibodies described in the STAR methods. Slides were scanned with a RareCyte CyteFinder scanner equipped with a 20x, 0.8 NA objective and images then corrected for uneven illumination using the BaSiC tool. Flat-field-corrected images were processed using ASHLAR.
Luminex multiplex assays
Serum & BAL samples from multiple time points were thawed at room temperature, quickly vortexed for 10 s, then centrifuged to pellet and remove debris. Samples were then analyzed in duplicate using Cytokine/Chemokine/Growth Factor 37-Plex NHP ProcartaPlexTM Panel (ThermoFisher) according to the manufacturer’s protocol. 200 μL of bead mix solution were added to all wells and washed using a Bio-Plex Pro Wash Station (BIORAD). 25 μL of Universal Assay Buffer was added to all wells, then 25 μL of samples/standards/blanks (blanks utilize universal assay buffer) were added to the relevant wells, following a 2 h incubation on an orbital shaker (400-500rpm) at room temperature. Plates are then washed on the magnetic plate washer, and 25 μL of prepared detection antibody was added to all wells following a 30 m incubation, with agitation, at room temperature. Plates were washed again, following 50 μL of provided Streptavidin-PE solution was added to all wells, 30 m incubation with agitation at room temperature. Once complete, the plates were again washed using the magnetic plate washer, inactivation was then performed using a 10% Formalin solution (VWR), using 100 μL per well, overnight1. Plates were run on a Bio-Plex® 200 System (BIORAD), which was preprogrammed according to kit specifications for optimal signal detection. Raw data were analyzed using R to test for any significant increase or decrease in cytokines and chemokines levels in serum and BAL of SARS-CoV-2 infected rhesus macaques on days 1, 2, 4, 7, 10 and 14 post-challenge compared to baseline, we used the using the non-parametric Wilcoxon t test implemented in R.
Proteomics platform, data standardization and quality control
The SomaScan® Platform for proteomics profiling uses 4979 SOMAmer® reagents, single-stranded DNA aptamers, to 4776 unique Human Protein Targets (https://www.somalogic.com/wp-content/uploads/2016/08/SSM-002-Rev-3-SOMAscan-Technical-White-Paper.pdf). Cross-reactivity for non-human primate proteins to reagents developed to human protein targets is assumed when differential signal is observed. The assay used standard controls including 12 hybridization normalization control sequences used to control for variability in the Agilent readout process as well as 5 human calibrator controls and 3 quality controls used to mitigate batch effects and verify the quality of the assay run using standard acceptance criteria. The SomaScan® Assay is run using 96 well plates; eleven wells are allocated for control samples used to control for batch effects and to estimate the accuracy, precision, and buffer background of the Assay over time. Five pooled Calibrator replicates, three pooled Quality Control (QC) replicates, and three buffer replicates are run on every plate. The readout is performed using Agilent hybridization, scan, and feature extraction technology. Twelve Hybridization Control SOMAmers are added alongside SOMAmers to be measured from the biological samples and controls of each well during the SOMAmer elution step to control for readout variability. The control samples are run repeatedly during assay qualification and robust point estimates are generated and stored as references for each SOMAmer result for the Calibrator and QC samples. Plate Calibration is performed by calculating the ratio of the Calibrator Reference RFU value to the plate-specific Calibrator replicate median RFU value for each SOMAmer. The resulting ratio distribution is decomposed into a Plate Scale factor defined by the median of the distribution and a vector of SOMAmer-specific Calibration Scale Factors. Normalization of QC replicates and Samples is performed using adaptive normalization by maximum likelihood (ANML) with point and variance estimates from a normal U.S. population. Post calibration accuracy is estimated using the ratio of the QC reference RFU value to the plate-specific QC replicate median RFU value for each SOMAmer. The resulting QC ratio distribution provides a robust estimate of accuracy for each SOMAmer on every plate. Plate-specific Acceptance Criteria: Plate Scale Factor between 0.4-2.5 and 85% of QC ratios between 0.8 and 1.2 must be met prior to release. The raw data were uploaded into R using the SomaDataIO R package provided by the company Somalogic. Quality control (QC), visualization, and manipulation of the raw data were also performed using internal functions implemented in the SomaDataIO R package. We used the R function adat2eSet to convert the raw data into an expression set object. Differential expression analysis of proteins increased or decreased by SARS-CoV-2 on days 1, 2, 4, 10 and 14 compared to baseline, was performed in R using the limma package. Significant expressed proteins were selected after correcting for multiple testing via Benjamini-Hochberg method over all tests for each gene pair. All Day 7 samples and 5 samples from day 10 post challenge were discarded from the analysis because of technical issues during their processing.
Library preparation and RNA-Seq processing
RNA was isolated from blood and BAL (Bronchoalveolar lavage) samples stored in Paxgene tubes in a BSL-3 facility at the Yerkes National Primate Center before being transferred to a BSL-2 lab for library preparation (http://www.yerkes.emory.edu/nhp_genomics_core/). RNA quality was assessed using an Agilent 4200 TapeStation and concentration via the RNA HS assay on the Qubit. Globin transcripts in the blood RNA were blocked with the FastSelect Globin Reagent (QIAGEN) prior to library preparation. Libraries were prepared using the Clontech SMART-Seq v4 Ultra Low Input RNA kit (Takara Bio) in combination with the NexteraXT DNA Library Preparation kit to append dual-indexed adaptor sequences (Illumina). Libraries were validated by capillary electrophoresis on an Agilent 4200 TapeStation, pooled at equimolar concentrations, and sequenced on an Illumina NovaSeq6000 at 100SR, yielding 25-30 million reads per sample.
Reads mapping and quantification
Peripheral blood and BAL (Bronchoalveolar lavage) raw reads were examined for quality issues using FastQC (http://www.bioinformatics.babraham.ac.uk/projects/fastqc/) to ensure library generation and sequencing are suitable for further analysis. Reads were aligned using STAR v2.7.3. The STAR index was built by combining genome sequences for Macaca mulatta, SARS-CoV-2 and ERCC sequences. We used the macaques genome reference Macaca mulatta - MacaM (https://www.unmc.edu/rhesusgenechip/index.htm). The genome sequence for SARS-CoV2 (strain MN985325.1) was downloaded from NCBI (https://www.ncbi.nlm.nih.gov/nuccore/MN985325). The gff3 file for SARS-CoV2 was converted to gtf using gffread utility (https://github.com/gpertea/gffread). The generated gtf file for SARS-CoV2 was edited to include exon entries which had the same coordinates as CDS to get counts with STAR. The combined genomic and gtf files were used for generating the STAR index for MacaM. The counts of reads aligning to annotated genes was obtained from STAR ReadsPerGene files. We used DESeq2 (Moderated estimation of fold change and dispersion for RNA-Seq data with DESeq2) internal filtering algorithm called “independentFiltering” that sets a threshold on the mean of normalized counts of all samples (baseMean > 10) in order to maximize the number of tests that pass multiple test correction. DESeq2 was used to generate the normalized read count table based on their estimateSizeFactors() function with default parameters by calculating a pseudo-reference sample of the geometric means for each gene across all samples and then use the “median ratio” of each sample to the pseudo-reference as the sizeFactor for that sample. The sizeFactor is then applied to each gene’s raw count to get the normalized count for that gene. Differential expression at the gene level were performed by DESeq2 implemented in the DESeq2 R package, using counts per gene generated by a custom script that pulls out the library prep abundance estimation column into files, and read those files into DESeq2 with the DESeqDataSetFromHTSeqCount() function. A corrected p value cut-off of 0.05 was used to assess significant genes that were upregulated or downregulated by SARS-Cov2 on days 1, 2, 4, 7, 10 and 14 compared to baseline in blood and BAL using Benjamini-Hochberg (BH) method.
Pathways enrichment analyses
Gene set enrichment analysis and a compendium of databases of biological and immunological pathways were used to test the longitudinal enrichment of pathways and transcription factors (TFs) target signatures in peripheral blood, BAL and serum samples on days 1, 2, 4, 7, 10 and 14 post-challenge compared to baseline. Genes were pre-ranked by fold change from the highest to the lowest and GSEA was used to assess the enrichment of selected gene sets. Thrombosis signatures (Figure 2) were compiled from the MSigDB curated C2 gene sets, IPA ingenuity pathway analysis https://targetexplorer.ingenuity.com) and were manually curated in-house by checking the individual function of each gene using GeneCard data base (https://www.genecards.org/). Cytokines signaling, immune cell signatures, and molecular pathways were compiled from the MSigDB Hallmark, C2, C7 and C3 gene sets (https://www.gsea-msigdb.org/gsea/msigdb/collections.jsp), IPA ingenuity pathway analysis https://targetexplorer.ingenuity.com), and the blood transcriptional modules (BTMs) (Li et al., 2014). The GSEA Java desktop program was downloaded from the Broad Institute (https://www.broadinstitute.org/gsea/index.jsp) and used with GSEA Pre-Ranked module parameters (number of permutations: 1,000; enrichment statistic: weighted; minimal number of genes = 10; maximal number of genes = 5000). Sample-level enrichment analysis (Gundem and Lopez-Bigas, 2012) was used to investigate the enrichment of pathways in each individual animal. Briefly, the expression of all the genes in a specific pathway was averaged across samples and compared to the average expression of 1,000 randomly generated gene sets of the same size. The resulting Z score was then used to reflect the overall perturbation of each pathway in each individual sample.
Canonical pathway and upstream regulator functions analysis
The canonical pathway and upstream regulator functions of IPA core expression analysis tool (QIAGEN) were used to interrogate the lists of genes and proteins upregulated or downregulated by SARS-Cov2 on days 1, 2, 4, 7, 10 and 14. Canonical pathways and upstream regulators were considered significant if pathway activation Z-Score >2 and pathway overlap corrected p value < 0.05 (using the Benjamini-Hochberg method). Functional analysis of statistically significant gene and proteins changes, was performed using Ingenuity Pathways Knowledge Base (IPA; Ingenuity Systems). For all gene set enrichment analyses, a right-tailed Fisher’s exact test was used to calculate P values associated with each biological function and canonical pathway. Upstream Regulator Analysis in IPA was used to predict regulators and infer their activation state based on prior knowledge of expected effects between regulators and their known target genes or proteins according to the Ingenuity Knowledge Base (IKB). The calculated z-score signifies whether gene or protein expression changes for known targets of each regulator are consistent with what is expected from the literature (z > 2, regulator predicted to be activated, z < −2, regulator predicted to inhibited). Causal Network Analysis in IPA was used to understand gene expression changes and causal relationships between genes and networks of upstream regulators. The genes within the causal network represent nodes and the edge that defines the biological relationship between two nodes is represented as an arrow signifying regulation. Dashed arrows represent indirect relationships and solid arrows represent direct relationships. All edges are supported by at least one published reference or from canonical information stored in IKB (https://digitalinsights.qiagen.com/products/ingenuity-pathway-analysis).
For GSEA analysis, all significant pathways and molecular signatures, increased or decreased by SARS-CoV-2 on days 1-14, were selected using a false discovery rate < 20 and a nominal p value < 0.05. In IPA Global Canonical Pathways (GCP), a multiple-testing corrected p value was calculated using the Benjamini- Hochberg (BH) method.
Quantification and Statistical Analysis
We analyzed data from nine (n = 9) rhesus macaques. Quality of BAL and peripheral blood raw reads were examined using FastQC (http://www.bioinformatics.babraham.ac.uk/projects/fastqc/) and reads were aligned using STAR v2.7.3. Differential expression at the gene level were performed by DESeq2 implemented in the DESeq2 R package. A corrected p value of 0.05 was used to assess significant genes that were upregulated or downregulated by SARS-Cov2 on days 1, 2, 4, 7, 10 and 14 compared to baseline in blood and BAL using Benjamini-Hochberg (BH) method. Increase or decrease levels of cytokines and chemokines in BAL and serum were evaluated using the non-parametric Wilcoxon test implemented in R. Serum proteomics was measured using the SomaScan platform. Quality control (QC), visualization, and manipulation of the raw data were performed using the SomaDataIO R package. Pathways enrichment and upstream regulators analyses were analyzed through the use of ingenuity pathway analysis (IPA) (QIAGEN Inc., https://digitalinsights.qiagen.com/products/ingenuitypathway-analysis) and the GSEA Desktop v4.0.3 from (https://www.gsea-msigdb.org/gsea/index.jsp). For data presentation, we used a collection of tools including Cytoscape version 3.6.0 (https://cytoscape.org), GeneMANIA version 3.3.1 (http://genemania.org) and Genecards (https://www.genecards.org). Where indicated on the figures, all pvalues were adjusted for multiple comparisons using Bejamini-Hochberg method (BH). Pathways and gene signatures shown in main Figures 2, 3, 4, 5, and 6 and in supplementary figures S5B-C, S6B and S7 where generated using GSEA and selected with a false discovery rate q value cutoff < 0.20 and a nominal pvalue < 0.05. Signatures shown in figure S5A, were generated using IPA and a BH-adjusted p < 0.05 and Z-score > 2. All statistical analyses were performed using the R statistical software 3.5.1. Graphic abstract was generated using Biorender.com.
Acknowledgments
We thank L. Pessaint, M. Paiardini, G. Tharp, R. Flaumenhaft, N. Johnson, and the SomaLogic assay services team for generous advice, assistance, and reagents. We acknowledge support from the Ragon Institute of MGH, MIT and Harvard; Mark and Lisa Schwartz Foundation; Beth Israel Deaconess Medical Center; Massachusetts Consortium on Pathogen Readiness (MassCPR); Bill & Melinda Gates Foundation (INV-006131); and the National Institutes of Health (OD024917, CA260476, AI124377, AI126603, AI128751, AI129797, and AI149670). The Yerkes Genomics Core is supported in part by NIH P51 OD011132, and sequencing data were acquired on an Illumina NovaSeq6000 funded by NIH S10 OD026799.
Author Contributions
D.H.B. and M.A. designed the study. M.A. performed the transcriptomic and proteomics data analysis and interpretation. J.D.E., K.B.-S., Z.M., C.A.J., P.K.S., A.J.M., J.L.H., L.W., S.D., O.R.B., and A.D.M. performed the pathology studies. K.L.P, M. Pino, T.N.H., and S.E.B performed the bulk RNA-seq and generated the BAL and peripheral blood raw data. A.C. and S.P. helped with sample processing. M. Porto performed the Luminex assay. D.H.B., M.A., and S.J.V. wrote the paper with all co-authors.
Declaration of Interests
The authors declare no competing interests.
Published: October 9, 2020
References
- Ackermann M., Verleden S.E., Kuehnel M., Haverich A., Welte T., Laenger F., Vanstapel A., Werlein C., Stark H., Tzankov A., et al. Pulmonary Vascular Endothelialitis, Thrombosis, and Angiogenesis in Covid-19. N Engl J Med. 2020;383:120–128. doi: 10.1056/NEJMoa2015432. [DOI] [PMC free article] [PubMed] [Google Scholar]
- Arunachalam P.S., Wimmers F., Mok C.K.P., Perera R.A.P.M., Scott M., Hagan T., Sigal N., Feng Y., Bristow L., Tak-Yin Tsang O., et al. Systems biological assessment of immunity to mild versus severe COVID-19 infection in humans. Science. 2020;369:1210–1220. doi: 10.1126/science.abc6261. [DOI] [PMC free article] [PubMed] [Google Scholar]
- Bikdeli B., Madhavan M.V., Jimenez D., Chuich T., Dreyfus I., Driggin E., Nigoghossian C., Ageno W., Madjid M., Guo Y., et al. Global COVID-19 Thrombosis Collaborative Group, Endorsed by the ISTH, NATF, ESVM, and the IUA, Supported by the ESC Working Group on Pulmonary Circulation and Right Ventricular Function COVID-19 and Thrombotic or Thromboembolic Disease: Implications for Prevention, Antithrombotic Therapy, and Follow-Up: JACC State-of-the-Art Review. J Am Coll Cardiol. 2020;75:2950–2973. doi: 10.1016/j.jacc.2020.04.031. [DOI] [PMC free article] [PubMed] [Google Scholar]
- Blanco-Melo D., Nilsson-Payant B.E., Liu W.C., Uhl S., Hoagland D., Moller R., Jordan T.X., Oishi K., Panis M., Sachs D., et al. Imbalanced Host Response to SARS-CoV-2 Drives Development of COVID-19. Cell. 2020;181:1036–1045.e9. doi: 10.1016/j.cell.2020.04.026. [DOI] [PMC free article] [PubMed] [Google Scholar]
- Carsana L., Sonzogni A., Nasr A., Rossi R.S., Pellegrinelli A., Zerbi P., Rech R., Colombo R., Antinori S., Corbellino M., et al. Pulmonary post-mortem findings in a series of COVID-19 cases from northern Italy: a two-centre descriptive study. Lancet Infect Dis. 2020;20:1135–1140. doi: 10.1016/S1473-3099(20)30434-5. [DOI] [PMC free article] [PubMed] [Google Scholar]
- Cedzyński M., Thielens N.M., Mollnes T.E., Vorup-Jensen T. Editorial: The Role of Complement in Health and Disease. Front Immunol. 2019;10:1869. doi: 10.3389/fimmu.2019.01869. [DOI] [PMC free article] [PubMed] [Google Scholar]
- Chandrashekar A., Liu J., Martinot A.J., McMahan K., Mercado N.B., Peter L., Tostanoski L.H., Yu J., Maliga Z., Nekorchuk M., et al. SARS-CoV-2 infection protects against rechallenge in rhesus macaques. Science. 2020;369:812–817. doi: 10.1126/science.abc4776. [DOI] [PMC free article] [PubMed] [Google Scholar]
- Chen G., Wu D., Guo W., Cao Y., Huang D., Wang H., Wang T., Zhang X., Chen H., Yu H., et al. Clinical and immunological features of severe and moderate coronavirus disease 2019. J Clin Invest. 2020;130:2620–2629. doi: 10.1172/JCI137244. [DOI] [PMC free article] [PubMed] [Google Scholar]
- Dobin A., Gingeras T.R. Mapping RNA-seq Reads with STAR. Curr Protoc Bioinformatics. 2015:51:11.14.1–11.14.19. doi: 10.1002/0471250953.bi1114s51. [DOI] [PMC free article] [PubMed] [Google Scholar]
- Elliott R., Li F., Dragomir I., Chua M.M., Gregory B.D., Weiss S.R. Analysis of the host transcriptome from demyelinating spinal cord of murine coronavirus-infected mice. PLoS ONE. 2013;8:e75346. doi: 10.1371/journal.pone.0075346. [DOI] [PMC free article] [PubMed] [Google Scholar]
- Felsenstein S., Herbert J.A., McNamara P.S., Hedrich C.M. COVID-19: Immunology and treatment options. Clin Immunol. 2020;215:108448. doi: 10.1016/j.clim.2020.108448. [DOI] [PMC free article] [PubMed] [Google Scholar]
- Fung T.S., Liu D.X. Human Coronavirus: Host-Pathogen Interaction. Annu Rev Microbiol. 2019;73:529–557. doi: 10.1146/annurev-micro-020518-115759. [DOI] [PubMed] [Google Scholar]
- Gangaraju R., Song J., Kim S.J., Tashi T., Reeves B.N., Sundar K.M., Thiagarajan P., Prchal J.T. Thrombotic, inflammatory, and HIF-regulated genes and thrombosis risk in polycythemia vera and essential thrombocythemia. Blood Adv. 2020;4:1115–1130. doi: 10.1182/bloodadvances.2019001379. [DOI] [PMC free article] [PubMed] [Google Scholar]
- Garbers C., Aparicio-Siegmund S., Rose-John S. The IL-6/gp130/STAT3 signaling axis: recent advances towards specific inhibition. Curr Opin Immunol. 2015;34:75–82. doi: 10.1016/j.coi.2015.02.008. [DOI] [PubMed] [Google Scholar]
- George P.M., Wells A.U., Jenkins R.G. Pulmonary fibrosis and COVID-19: the potential role for antifibrotic therapy. Lancet Respir Med. 2020;8:807–815. doi: 10.1016/S2213-2600(20)30225-3. [DOI] [PMC free article] [PubMed] [Google Scholar]
- Goshua G., Pine A.B., Meizlish M.L., Chang C.H., Zhang H., Bahel P., Baluha A., Bar N., Bona R.D., Burns A.J., et al. Endotheliopathy in COVID-19-associated coagulopathy: evidence from a single-centre, cross-sectional study. Lancet Haematol. 2020;7:e575–e582. doi: 10.1016/S2352-3026(20)30216-7. [DOI] [PMC free article] [PubMed] [Google Scholar]
- Gragnano F., Sperlongano S., Golia E., Natale F., Bianchi R., Crisci M., Fimiani F., Pariggiano I., Diana V., Carbone A., et al. The Role of von Willebrand Factor in Vascular Inflammation: From Pathogenesis to Targeted Therapy. Mediators Inflamm. 2017;2017:5620314. doi: 10.1155/2017/5620314. [DOI] [PMC free article] [PubMed] [Google Scholar]
- Gralinski L.E., Sheahan T.P., Morrison T.E., Menachery V.D., Jensen K., Leist S.R., Whitmore A., Heise M.T., Baric R.S. Complement Activation Contributes to Severe Acute Respiratory Syndrome Coronavirus Pathogenesis. MBio. 2018;9 doi: 10.1128/mBio.01753-18. e01753–18. [DOI] [PMC free article] [PubMed] [Google Scholar]
- Gundem G., Lopez-Bigas N. Sample-level enrichment analysis unravels shared stress phenotypes among multiple cancer types. Genome Med. 2012;4:28. doi: 10.1186/gm327. [DOI] [PMC free article] [PubMed] [Google Scholar]
- Hadjadj J., Yatim N., Barnabei L., Corneau A., Boussier J., Smith N., Péré H., Charbit B., Bondet V., Chenevier-Gobeaux C., et al. Impaired type I interferon activity and inflammatory responses in severe COVID-19 patients. Science. 2020;369:712–718. doi: 10.1126/science.abc6027. [DOI] [PMC free article] [PubMed] [Google Scholar]
- Haller O., Staeheli P., Kochs G. Interferon-induced Mx proteins in antiviral host defense. Biochimie. 2007;89:812–818. doi: 10.1016/j.biochi.2007.04.015. [DOI] [PubMed] [Google Scholar]
- Hillmer E.J., Zhang H., Li H.S., Watowich S.S. STAT3 signaling in immunity. Cytokine Growth Factor Rev. 2016;31:1–15. doi: 10.1016/j.cytogfr.2016.05.001. [DOI] [PMC free article] [PubMed] [Google Scholar]
- Huang C., Wang Y., Li X., Ren L., Zhao J., Hu Y., Zhang L., Fan G., Xu J., Gu X., et al. Clinical features of patients infected with 2019 novel coronavirus in Wuhan, China. Lancet. 2020;395:497–506. doi: 10.1016/S0140-6736(20)30183-5. [DOI] [PMC free article] [PubMed] [Google Scholar]
- Li S., Rouphael N., Duraisingham S., Romero-Steiner S., Presnell S., Davis C., Schmidt D.S., Johnson S.E., Milton A., Rajam G., et al. Molecular signatures of antibody responses derived from a systems biology study of five human vaccines. Nat Immunol. 2014;15:195–204. doi: 10.1038/ni.2789. [DOI] [PMC free article] [PubMed] [Google Scholar]
- Liao M., Liu Y., Yuan J., Wen Y., Xu G., Zhao J., Cheng L., Li J., Wang X., Wang F., et al. Single-cell landscape of bronchoalveolar immune cells in patients with COVID-19. Nat Med. 2020;26:842–844. doi: 10.1038/s41591-020-0901-9. [DOI] [PubMed] [Google Scholar]
- Lin J.R., Izar B., Wang S., Yapp C., Mei S., Shah P.M., Santagata S., Sorger P.K. Highly multiplexed immunofluorescence imaging of human tissues and tumors using t-CyCIF and conventional optical microscopes. eLife. 2018;7:e31657. doi: 10.7554/eLife.31657. [DOI] [PMC free article] [PubMed] [Google Scholar]
- Lo M.W., Kemper C., Woodruff T.M. COVID-19: Complement, Coagulation, and Collateral Damage. J Immunol. 2020;205:1488–1495. doi: 10.4049/jimmunol.2000644. [DOI] [PMC free article] [PubMed] [Google Scholar]
- Lu R., Zhao X., Li J., Niu P., Yang B., Wu H., Wang W., Song H., Huang B., Zhu N., et al. Genomic characterisation and epidemiology of 2019 novel coronavirus: implications for virus origins and receptor binding. Lancet. 2020;395:565–574. doi: 10.1016/S0140-6736(20)30251-8. [DOI] [PMC free article] [PubMed] [Google Scholar]
- Lucas C., Wong P., Klein J., Castro T.B.R., Silva J., Sundaram M., Ellingson M.K., Mao T., Oh J.E., Israelow B., et al. Yale IMPACT Team Longitudinal analyses reveal immunological misfiring in severe COVID-19. Nature. 2020;584:463–469. doi: 10.1038/s41586-020-2588-y. [DOI] [PMC free article] [PubMed] [Google Scholar]
- Magro C., Mulvey J.J., Berlin D., Nuovo G., Salvatore S., Harp J., Baxter-Stoltzfus A., Laurence J. Complement associated microvascular injury and thrombosis in the pathogenesis of severe COVID-19 infection: A report of five cases. Transl Res. 2020;220:1–13. doi: 10.1016/j.trsl.2020.04.007. [DOI] [PMC free article] [PubMed] [Google Scholar]
- Mangalmurti N., Hunter C.A. Cytokine Storms: Understanding COVID-19. Immunity. 2020;53:19–25. doi: 10.1016/j.immuni.2020.06.017. [DOI] [PMC free article] [PubMed] [Google Scholar]
- McKechnie J.L., Blish C.A. The Innate Immune System: Fighting on the Front Lines or Fanning the Flames of COVID-19? Cell Host Microbe. 2020;27:863–869. doi: 10.1016/j.chom.2020.05.009. [DOI] [PMC free article] [PubMed] [Google Scholar]
- Merad M., Martin J.C. Pathological inflammation in patients with COVID-19: a key role for monocytes and macrophages. Nat Rev Immunol. 2020;20:355–362. doi: 10.1038/s41577-020-0331-4. [DOI] [PMC free article] [PubMed] [Google Scholar]
- Munster V.J., Feldmann F., Williamson B.N., van Doremalen N., Perez-Perez L., Schulz J., Meade-White K., Okumura A., Callison J., Brumbaugh B., et al. Respiratory disease in rhesus macaques inoculated with SARS-CoV-2. Nature. 2020;585:268–272. doi: 10.1038/s41586-020-2324-7. [DOI] [PMC free article] [PubMed] [Google Scholar]
- Noris M., Benigni A., Remuzzi G. The case of complement activation in COVID-19 multiorgan impact. Kidney Int. 2020;98:314–322. doi: 10.1016/j.kint.2020.05.013. [DOI] [PMC free article] [PubMed] [Google Scholar]
- Nowlin B.T., Wang J., Schafer J.L., Autissier P., Burdo T.H., Williams K.C. Monocyte subsets exhibit transcriptional plasticity and a shared response to interferon in SIV-infected rhesus macaques. J Leukoc Biol. 2018;103:141–155. doi: 10.1002/JLB.4A0217-047R. [DOI] [PMC free article] [PubMed] [Google Scholar]
- Pertea G., Pertea M. GFF Utilities: GffRead and GffCompare. F1000Res. 2020;28 doi: 10.12688/f1000research.23297.2. [DOI] [PMC free article] [PubMed] [Google Scholar]
- Qin C., Zhou L., Hu Z., Zhang S., Yang S., Tao Y., Xie C., Ma K., Shang K., Wang W., Tian D.S. Dysregulation of immune response in patients with COVID-19 in Wuhan, China. Clin Infect Dis. 2020;71:762–768. doi: 10.1093/cid/ciaa248. [DOI] [PMC free article] [PubMed] [Google Scholar]
- Rapkiewicz A.V., Mai X., Carsons S.E., Pittaluga S., Kleiner D.E., Berger J.S., Thomas S., Adler N.M., Charytan D.M., Gasmi B., et al. Megakaryocytes and platelet-fibrin thrombi characterize multi-organ thrombosis at autopsy in COVID-19: A case series. EClinicalMedicine. 2020;24:100434. doi: 10.1016/j.eclinm.2020.100434. [DOI] [PMC free article] [PubMed] [Google Scholar]
- Ravindra N.G., Alfajaro M.M., Gasque V., Wei J., Filler R.B., Huston N.C., Wan H., Szigeti-Buck K., Wang B., Montgomery R.R., et al. Single-cell longitudinal analysis of SARS-CoV-2 infection in human bronchial epithelial cells. bioRxiv. 2020 doi: 10.1101/2020.05.06.081695. [DOI] [Google Scholar]
- Shen B., Yi X., Sun Y., Bi X., Du J., Zhang C., Quan S., Zhang F., Sun R., Qian L., et al. Proteomic and Metabolomic Characterization of COVID-19 Patient Sera. Cell. 2020;182:59–72.e15. doi: 10.1016/j.cell.2020.05.032. [DOI] [PMC free article] [PubMed] [Google Scholar]
- Subramanian A., Tamayo P., Mootha V.K., Mukherjee S., Ebert B.L., Gillette M.A., Paulovich A., Pomeroy S.L., Golub T.R., Lander E.S., Mesirov J.P. Gene set enrichment analysis: a knowledge-based approach for interpreting genome-wide expression profiles. Proc Natl Acad Sci U S A. 2005;102:15545–15550. doi: 10.1073/pnas.0506580102. [DOI] [PMC free article] [PubMed] [Google Scholar]
- Trigonis R.A., Holt D.B., Yuan R., Siddiqui A.A., Craft M.K., Khan B.A., Kapoor R., Rahman O. Incidence of Venous Thromboembolism in Critically Ill Coronavirus Disease 2019 Patients Receiving Prophylactic Anticoagulation. Crit Care Med. 2020;48:e805–e808. doi: 10.1097/CCM.0000000000004472. [DOI] [PMC free article] [PubMed] [Google Scholar]
- Varga Z., Flammer A.J., Steiger P., Haberecker M., Andermatt R., Zinkernagel A.S., Mehra M.R., Schuepbach R.A., Ruschitzka F., Moch H. Endothelial cell infection and endotheliitis in COVID-19. Lancet. 2020;395:1417–1418. doi: 10.1016/S0140-6736(20)30937-5. [DOI] [PMC free article] [PubMed] [Google Scholar]
- Webster R.L., Johnson R.P. Delineation of multiple subpopulations of natural killer cells in rhesus macaques. Immunology. 2005;115:206–214. doi: 10.1111/j.1365-2567.2005.02147.x. [DOI] [PMC free article] [PubMed] [Google Scholar]
- Williamson B.N., Feldmann F., Schwarz B., Meade-White K., Porter D.P., Schulz J., van Doremalen N., Leighton I., Yinda C.K., Perez-Perez L., et al. Clinical benefit of remdesivir in rhesus macaques infected with SARS-CoV-2. Nature. 2020;585:273–276. doi: 10.1038/s41586-020-2423-5. [DOI] [PMC free article] [PubMed] [Google Scholar]
- Xiong Y., Liu Y., Cao L., Wang D., Guo M., Jiang A., Guo D., Hu W., Yang J., Tang Z., et al. Transcriptomic characteristics of bronchoalveolar lavage fluid and peripheral blood mononuclear cells in COVID-19 patients. Emerg Microbes Infect. 2020;9:761–770. doi: 10.1080/22221751.2020.1747363. [DOI] [PMC free article] [PubMed] [Google Scholar]
- Xu Z., Xu Y.J., Hao Y.N., Ren L.J., Zhang Z.B., Xu X., Cao B.Y., Dai K.S., Zhu L., Fang Q., et al. A novel STAT3 inhibitor negatively modulates platelet activation and aggregation. Acta Pharmacol Sin. 2017;38:651–659. doi: 10.1038/aps.2016.155. [DOI] [PMC free article] [PubMed] [Google Scholar]
- Yoshikawa T., Hill T.E., Yoshikawa N., Popov V.L., Galindo C.L., Garner H.R., Peters C.J., Tseng C.T. Dynamic innate immune responses of human bronchial epithelial cells to severe acute respiratory syndrome-associated coronavirus infection. PLoS ONE. 2010;5:e8729. doi: 10.1371/journal.pone.0008729. [DOI] [PMC free article] [PubMed] [Google Scholar]
- Yu J., Tostanoski L.H., Peter L., Mercado N.B., McMahan K., Mahrokhian S.H., Nkolola J.P., Liu J., Li Z., Chandrashekar A., et al. DNA vaccine protection against SARS-CoV-2 in rhesus macaques. Science. 2020;369:806–811. doi: 10.1126/science.abc6284. [DOI] [PMC free article] [PubMed] [Google Scholar]
- Zhou Z., Ren L., Zhang L., Zhong J., Xiao Y., Jia Z., Guo L., Yang J., Wang C., Jiang S., et al. Heightened Innate Immune Responses in the Respiratory Tract of COVID-19 Patients. Cell Host Microbe. 2020;27:883–890.e2. doi: 10.1016/j.chom.2020.04.017. [DOI] [PMC free article] [PubMed] [Google Scholar]
Associated Data
This section collects any data citations, data availability statements, or supplementary materials included in this article.
Data Availability Statement
The accession number for the raw bulk RNA-Seq of BAL and peripheral blood data reported in this paper is Gene Expression Omnibus (GEO) accession GSE156701.