Abstract
As the first discovered human cancer virus, Epstein–Barr virus (EBV) causes Burkitt’s lymphoma and nasopharyngeal carcinoma. Isolating virions for determining high-resolution structures has been hindered by latency—a hallmark of EBV infection—and atomic structures are thus available only for recombinantly expressed EBV proteins. In the present study, by symmetry relaxation and subparticle reconstruction, we have determined near-atomic-resolution structures of the EBV capsid with an asymmetrically attached DNA-translocating portal and capsid-associated tegument complexes from cryogenic electron microscopy images of just 2,048 EBV virions obtained by chemical induction. The resulting atomic models reveal structural plasticity among the 20 conformers of the major capsid protein, 2 conformers of the small capsid protein (SCP), 4 conformers of the triplex monomer proteins and 2 conformers of the triplex dimer proteins. Plasticity reaches the greatest level at the capsid–tegument interfaces involving SCP and capsid-associated tegument complexes (CATC): SCPs crown pentons/hexons and mediate tegument protein binding, and CATCs bind and rotate all five periportal triplexes, but notably only about one peri-penton triplex. These results offer insights into the EBV capsid assembly and a mechanism for recruiting cell-regulating factors into the tegument compartment as ‘cargoes’, and should inform future anti-EBV strategies.
Discovered in 1964 by Michael A. Epstein and Yvonne Barr through conventional electron microscopy (EM) of sectioned Burkitt’s lymphoma cells1, Epstein–Barr virus (EBV) is the first-ever virus identified to cause cancers in humans. As a member of the γ-herpesvirus subfamily of the Herpesviridae2, EBV infects children mostly asymptomatically, although occasionally it manifests as infectious mononucleosis (commonly referred to as ‘mono’ or the ‘kissing disease’). After this primary infection, EBV establishes latency—a hallmark of EBV infection, leading to persistent (dormant) infections among 90% of the adult population. EBV infection can lead to two major human cancers—Burkitt’s lymphoma and nasopharyngeal carcinoma—as well as several other malignancies3,4. Latency presents a major challenge in growing and isolating infectious virions for high-resolution structural studies. As such, prior EBV structural studies have primarily relied on recombinantly expressed proteins, which have yielded crystal structures of a replication-activating protein5, the BNRF1 gene-encoded major tegument protein6, the glycoprotein gp42 (ref. 7) and glycoprotein H/glycoprotein L8, as well as a recent cryogenic electron microscopy (cryo-EM) structure of the BBRF1 gene-encoded dodecameric portal complex9. To date, however, the only structure available for native EBV particles remains a low-resolution (20 Å (2 nm)) cryo-EM structure obtained from B capsids partially damaged by CsCl gradient purification10. The lack of atomic structure for native EBV has greatly limited our understanding of this human tumour herpesvirus of both historical and medical importance, and is in contrast to recent atomic structures of other members of the Herpesviridae11–19, including those for the fellow γ-herpesvirus subfamily member Kaposi’s sarcoma-associated herpesvirus (KSHV)11,18.
In the present study, we chemically treated latent EBV-infected B cells to induce lytic virion production and obtained EBV virions for cryo-EM imaging. By employing a sequential classification and subparticle reconstruction workflow, we have circumvented the difficulty of isolating EBV virions, and determined near-atomic resolution structures of the capsid with the DNA-translocating portal and capsid-associated tegument proteins from just 2,048 EBV virion cryo-EM images. From these structures, we have derived atomic models for a total of 28 unique conformers of the 4 capsid proteins, and uncovered their interactions with the portal complex and capsid-associated tegument complexes (CATCs) on the pseudo-icosahedral capsid. The conservation of capsid architecture, and the plasticity of capsid protein structures and CATC attachment, together offer insights into both EBV-capsid assembly and recruitment of host-regulatory tegument proteins into the virion of this human tumour herpesvirus.
Results
Cryo-EM subparticle reconstructions and 90 unique atomic models.
From a total of 2,048 good cryo-EM images of EBV virions (see Supplementary Fig. 1), we first obtained an icosahedral reconstruction, and then, by following a sequential symmetry relaxation and classification workflow (see Supplementary Fig. 2), structures of the subparticles encompassing the icosahedral fivefold, threefold and twofold axes at resolutions of 3.5, 3.4 and 3.4 Å, respectively (see Supplementary Figs. 2 and 3 and Supplementary Videos 1–3). Three-dimensional (3D) classification and 3D refinement of the penton vertex subparticles led to two kinds of C1 penton vertex subparticle reconstructions—CATC absent and CATC binding—at resolutions of 3.5 and 4.0 Å, respectively (see Supplementary Figs. 2 and 3 and Supplementary Videos 3 and 5). The subparticle reconstruction of the portal vertex containing five CATCs was obtained with C5 symmetry (Fig. 1c and see Supplementary Video 4) at 4.4-Å resolution (see Supplementary Fig. 3). Further analyses focusing on the portal region of the portal vertex particles yielded a C12 portal subparticle reconstruction at 6.7-Å resolution (see Supplementary Fig. 3). A reconstruction of the full capsid with the orientation parameters refined from this C5 portal subparticle reconstruction shows non-icosahedrally attached portals and variably associated CATCs (Fig. 1a,b and see also Supplementary Video 6).
Fig. 1 |. Subparticle reconstructions and architecture of the EBV capsid with portal and CATCs.
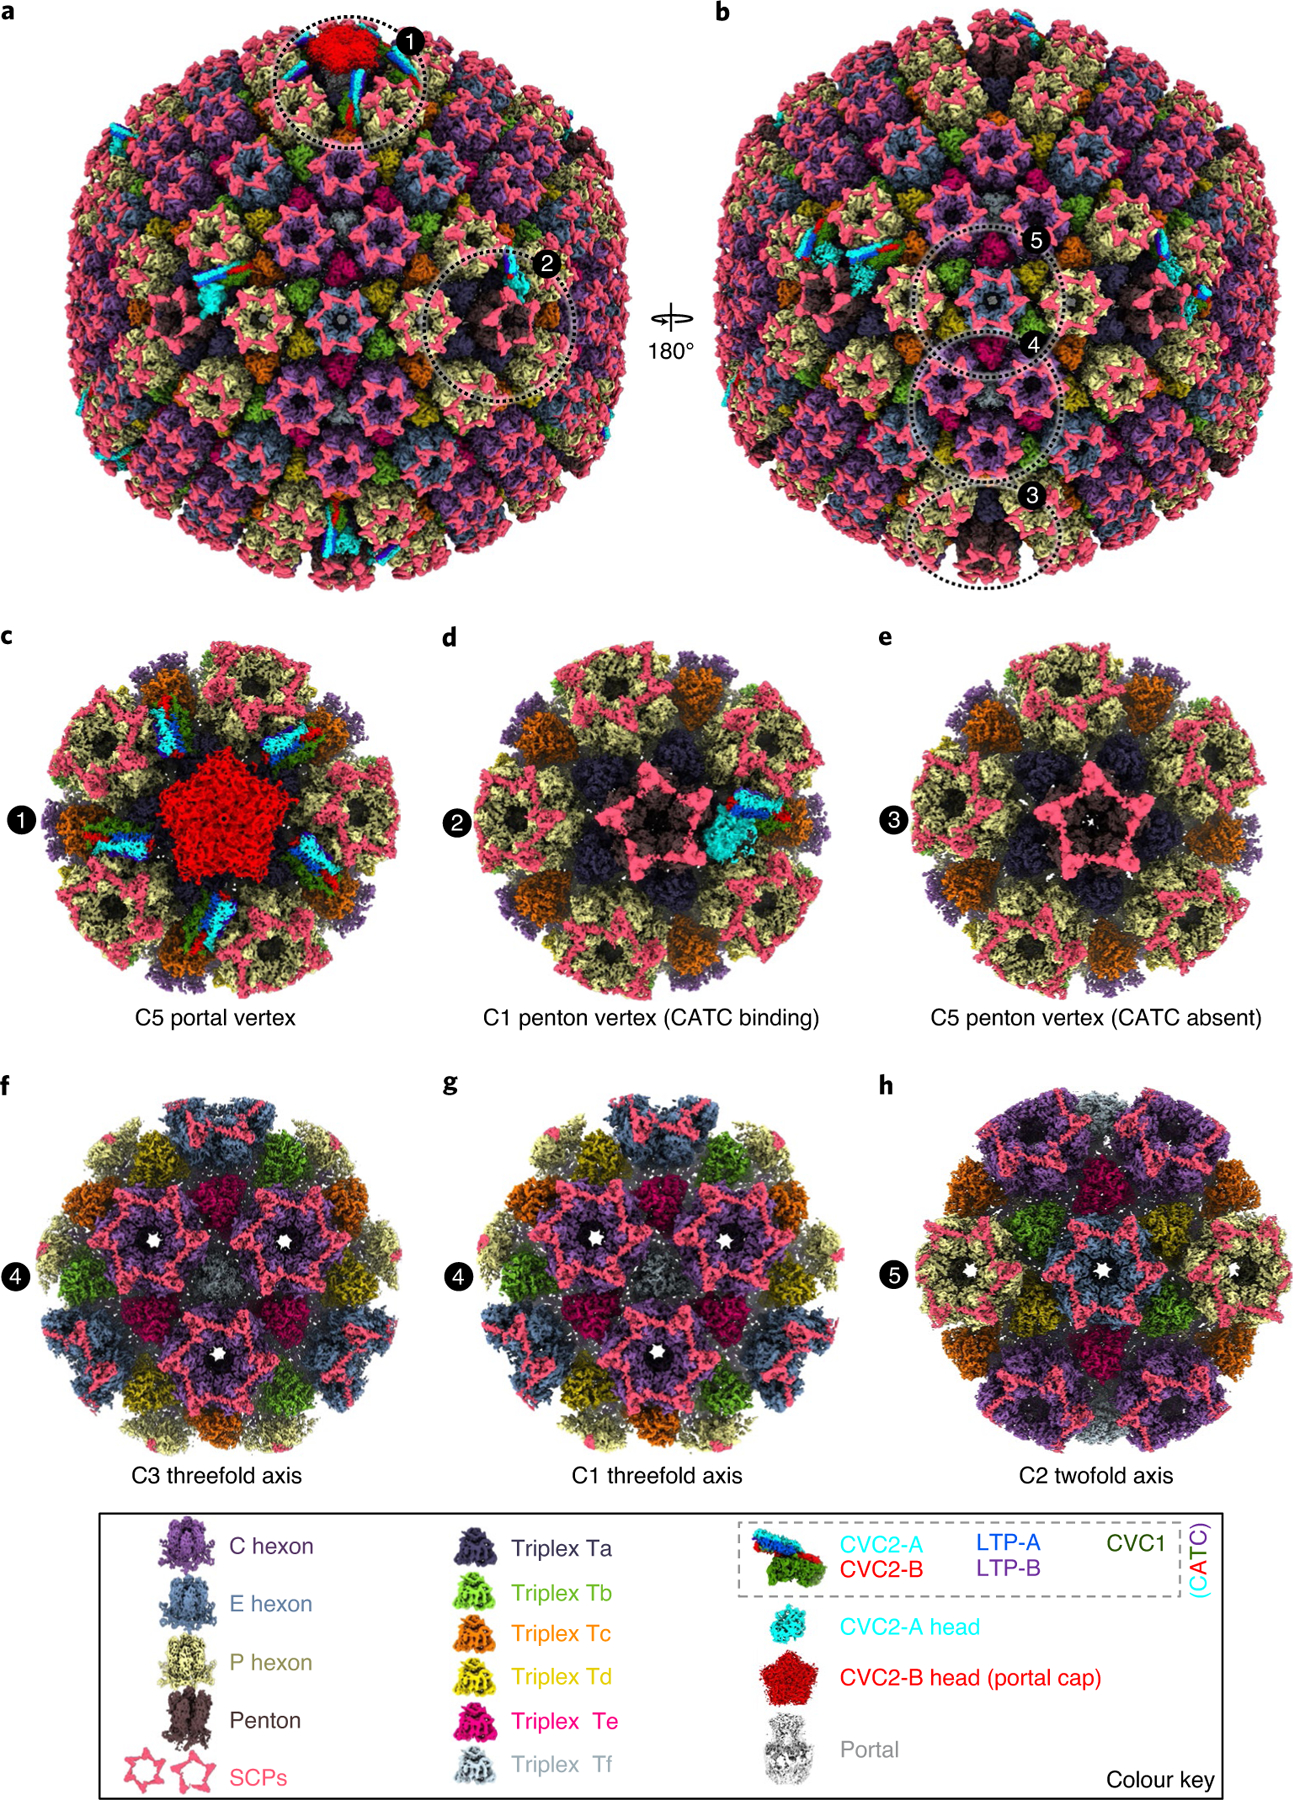
a,b, Shaded-surface representations of the eBV C5 whole-virus reconstruction, revealing the DNA-translocating portal vertex (a) and variable attachments of CATCs (a,b). b is the back view of a. c–h, Reconstructions for subparticles exemplified by the circled areas in a and b, including C5 reconstruction of the portal vertex (c), C1 reconstruction of the CATC-binding penton vertex (d), C5 reconstruction of the CATC-absent penton vertex (e), C3 (f) and C1 (g) reconstructions of the threefold axis region, and C2 reconstruction of the twofold axis region (h). Colour keys of structural components are at the bottom.
The T = 16 pseudo-icosahedral capsid structure (see Supplementary Video 6) contains 1 double-stranded (ds)DNA-translocating portal, 11 pentons, 150 hexons and 320 triplexes (Fig. 1a,b and see also Supplementary Video 6). Each icosahedral asymmetrical unit of the EBV capsid reconstruction contains 16 copies of the BcLF1 gene-encoded major capsid protein (MCP), 16 copies of the BFRF3 gene-encoded small capsid protein (SCP) (each on top of an MCP) and five and one-third triplexes (Ta, Tb, Tc, Td, Te and one-third of Tf) (Fig. 1a,b and see also Supplementary Video 7). From the main-axis subparticle reconstructions (Fig. 1d–h), including the C1 threefold subparticle reconstruction (for triplex Tf), we built atomic models (see Extended Data Figs. 1 and 2) for a total of 50 subunits of the 4 capsid proteins (see examples in Fig. 2a), including: 15 hexon MCP and 1 penton MCP subunits; 15 hexon SCP and 1 penton SCP subunits; 6 BORF1 gene-encoded triplex monomer protein (Tri1) subunits; and 12 BDLF1 gene-encoded triplex dimer protein (Tri2) subunits. These atomic models can be classified into 28 unique conformations (that is, conformers), including 20 for MCP, 4 for Tri1, 2 for SCP and 2 for Tri2 (Tri2A and Tri2B), based on their structural variations.
Fig. 2 |. Atomic models of representative EBV capsid and CATC subunits.
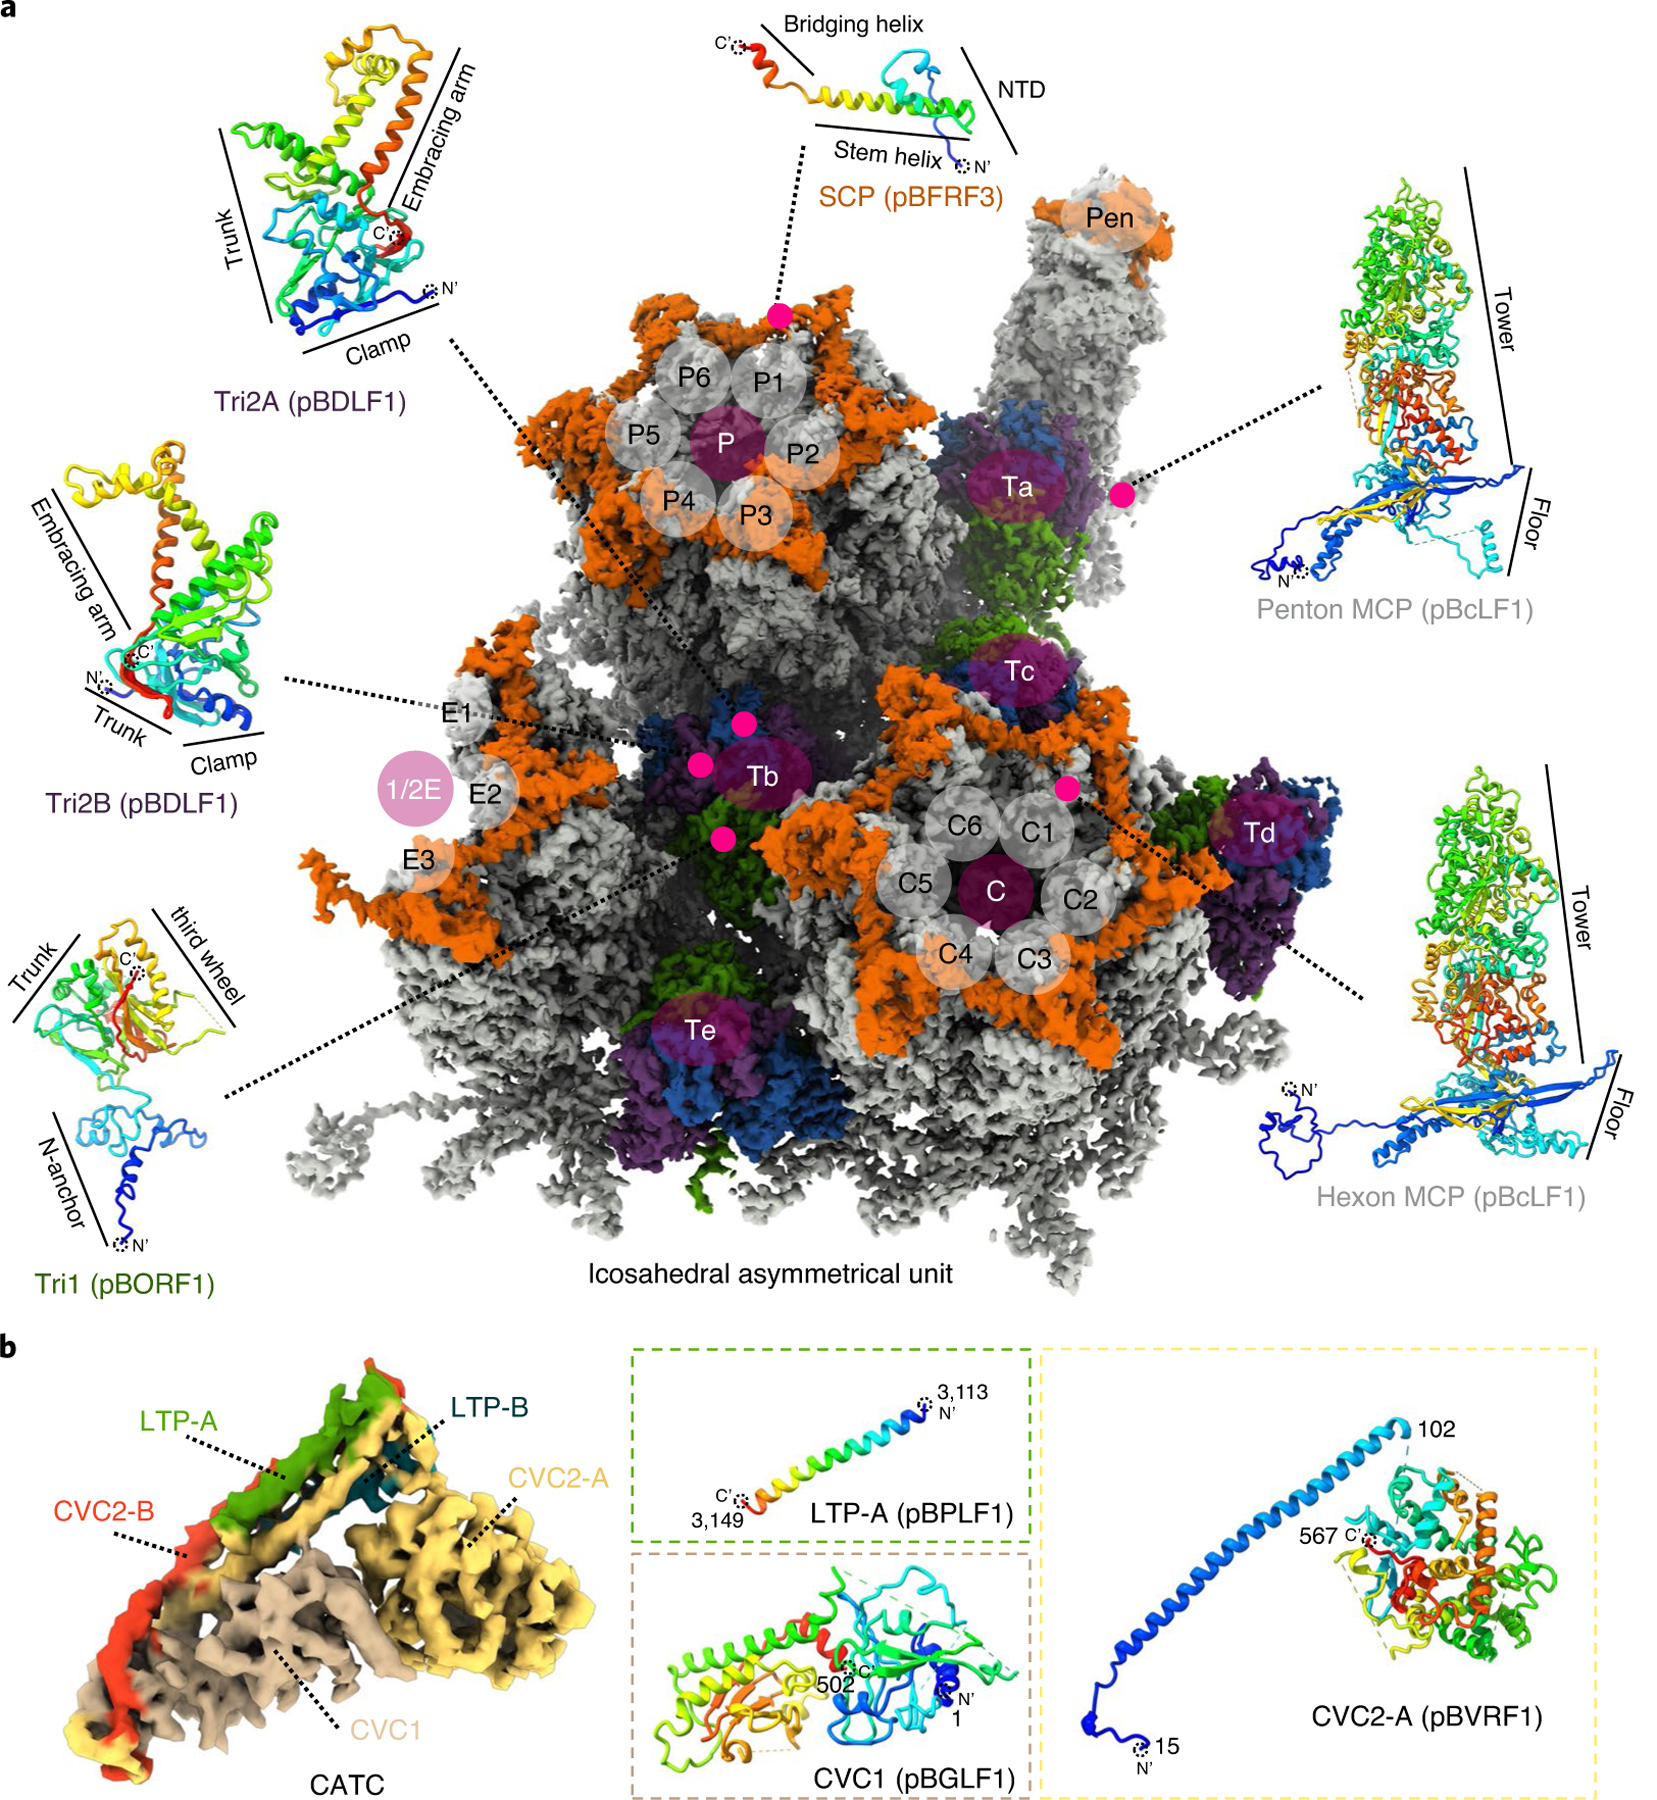
a, Density map for an icosahedral asymmetrical unit segmented from the three main-axis subparticle reconstructions and coloured by protein types: MCP (grey), Tri1 (green), Tri2A (blue), Tri2B (purple) and SCP (orange). b, Density map for CATC segmented from the C1 CATC-binding penton vertex subparticle reconstruction and coloured by protein subunits. In both a and b, representative atomic models of protein subunits are shown next to the density map as ribbons rainbow coloured from blue (N terminus) to red (C terminus).
The C5 whole-virus reconstruction reveals an unexpected pattern of CATC organization where only zero to two of the five available CATC-binding sites around each penton vertex are occupied (Fig. 1a,b and see also Supplementary Video 6). The 3D classification of penton vertex subparticles indicated that there were only two kinds of penton vertices—with zero (CATC absent) and one CATC binding. Together, these results suggest that location of CATC binding in the virion is not uniquely determined. Our model of the CATCs (Fig. 2b), based on C1 penton subparticle reconstruction, contains one subunit of the BGLF1 gene-encoded capsid vertex component 1 (CVC1), two copies of the BVRF1 gene-encoded capsid vertex component 2 (CVC2) and two copies of the BPLF1 gene-encoded large tegument protein (LTP).
In total, we built 90 atomic models for the capsid and tegument protein subunits (47 for the icosahedrally related capsid, 3 for the three subunits of the triplex Tf, 19 for the portal vertex and 21 for the CATC-binding penton vertex), amounting to over 45,900 amino acid residues (see Supplementary Table 1).
Domain organization of MCP and structural plasticity of the 20 MCP conformers.
The EBV capsid contains 11 pentons and 150 hexons, each of which is composed of 5 and 6 MCP–SCP pairs, respectively (Figs. 1–3). The 1,381 amino-acid-long MCP subunit is divided into ‘tower’ and ‘floor’ regions based on their spatial positions relative to the capsid shell (Fig. 3a–d). The tower region contains the upper (amino acids 484–1042), the channel (amino acids 411–483 and 1329–1381), the buttress (amino acids 1120–1328) and the helix–hairpin (amino acids 190–231) domains. The floor region contains the dimerization (amino acids 295–374), the N-lasso (amino acids 1–60), and the bacteriophage HK97-like20,21 or ‘Johnson fold’ (amino acids 61–189, 232–294, 375–410 and 1043–1119) domains (Fig. 3c,d and see also Extended Data Fig. 3a). There are a total of 20 unique conformers of MCP—16 MCPs within an asymmetrical unit, and 2 P1 and 2 P6 MCPs in CATC-binding penton and portal vertexes. As detailed in Supplementary Discussion and numerous illustrations (see Supplementary Figs. 4 and 5, Extended Data Figs. 3 and 4, and Supplementary Video 8), careful comparisons of their structures unveil a remarkable level of structural plasticity of MCPs not previously reported for any herpesviruses.
Fig. 3 |. Plasticity of the MCP structures.
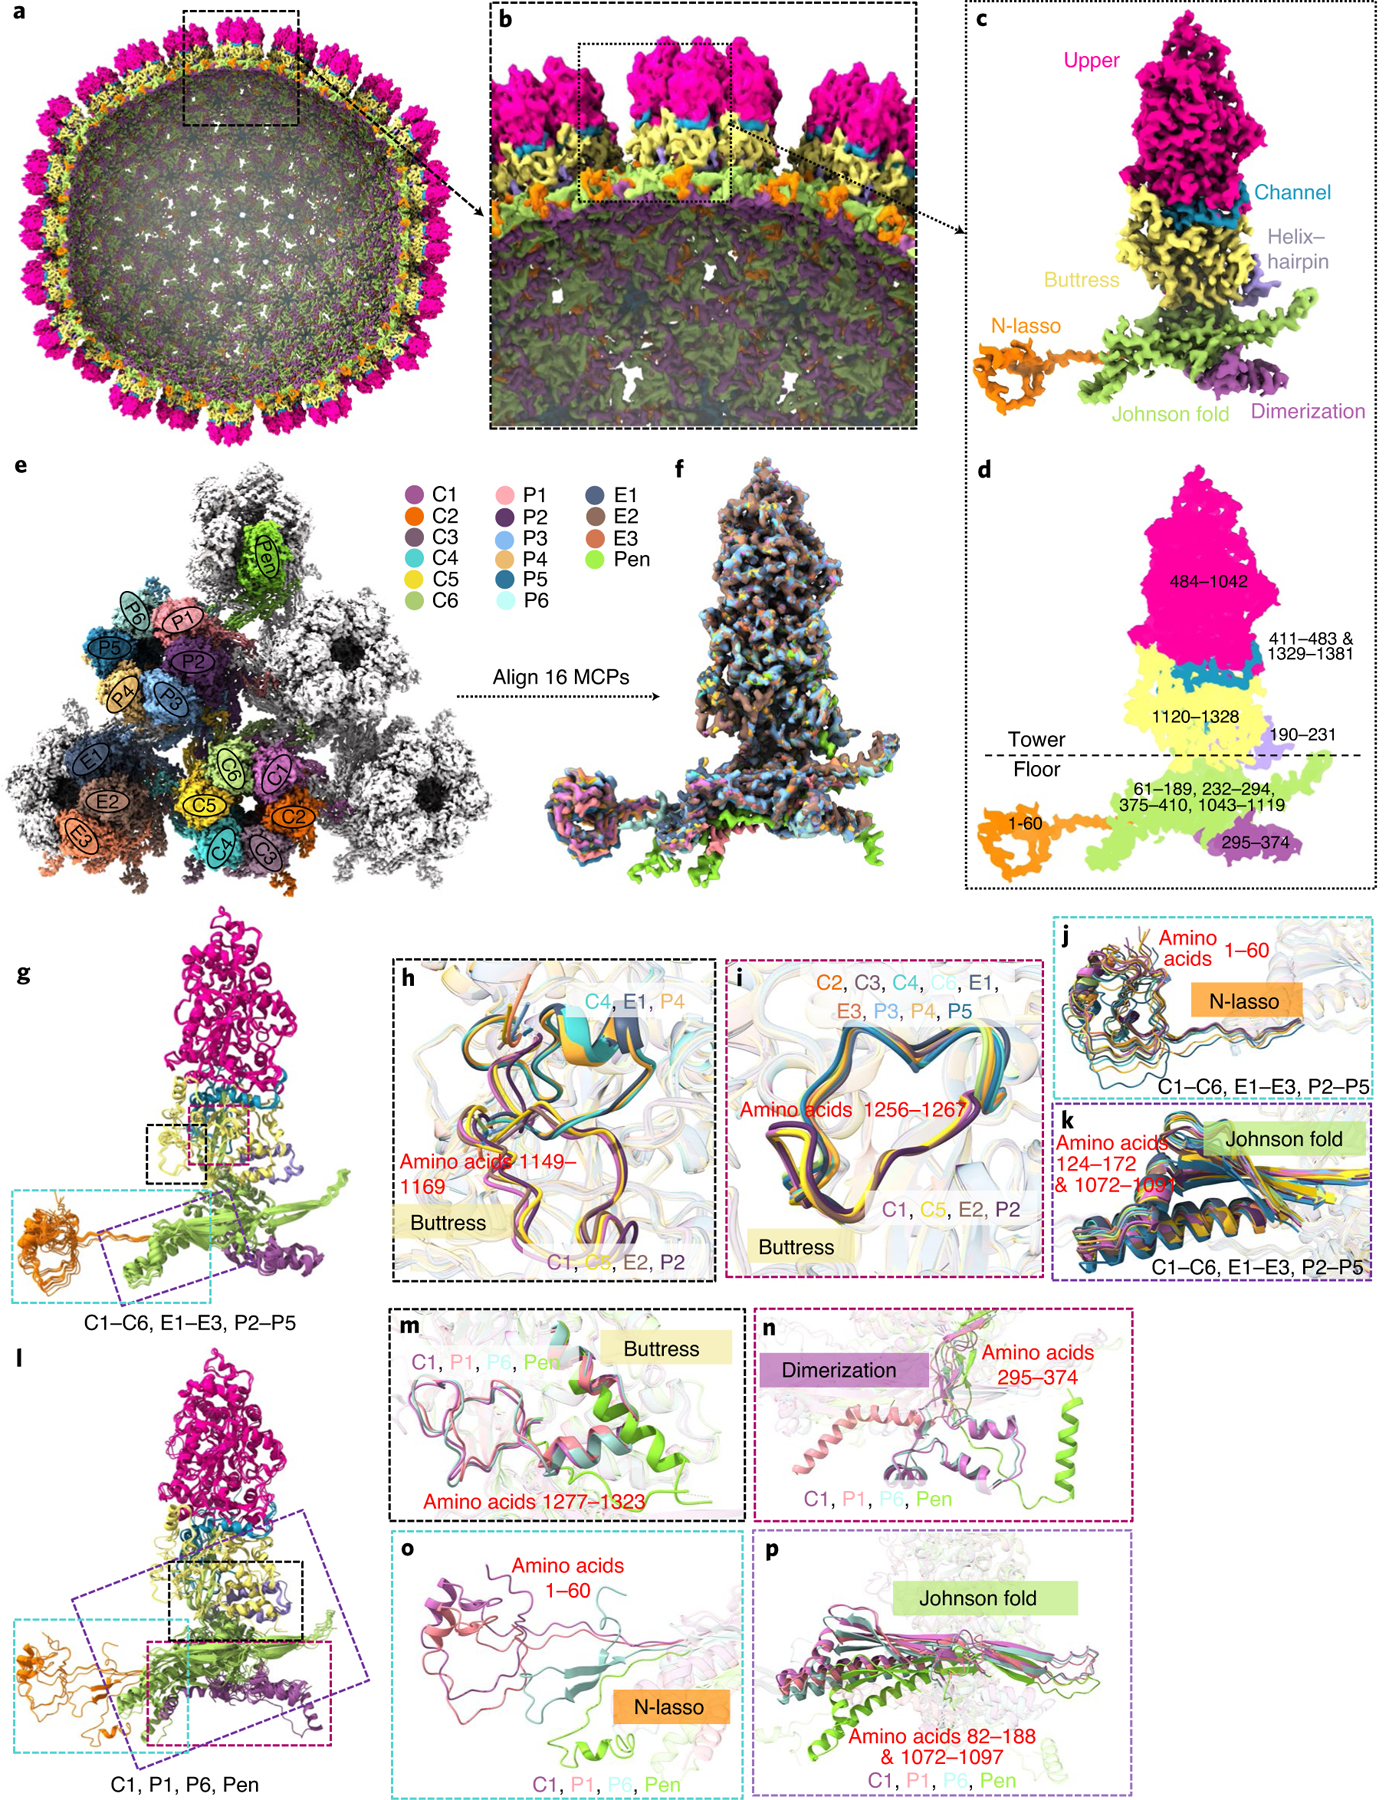
a–d, Cut-away (a) and zoomed-in (b) views of the C5 whole-virus reconstruction with only MCP subunits shown, coloured by domains defined in c and d. Ranges of amino-acid residues in each domain are numbered in d. e–p, Structural plasticity of the 16 MCP subunits at quasi-equivalent positions within an icosahedral asymmetrical unit (coloured in e). The superposition of 16 aligned MCPs (f) shows only small variations among the subunits C1–C6, e1–e3 and P2–P5 (g, with zoomed-in areas in h–k), but greater structural variations for subunits P1, P6 and Pen compared with subunit C1 (l, with zoomed-in areas in m–p).
Trans-capsid anchoring of the triplex by variable Tri1 N-anchors seals the capsid.
Each of the above-mentioned 320 triplexes on each EBV capsid is a heterotrimer of two proteins: two Tri2 conformers (Tri2A and Tri2B) (Fig. 2a) that embrace each other (see Extended Data Fig. 5) and a ‘third wheel’ Tri1 monomer that supports the two Tri2 subunits (see Extended Data Fig. 5e). Tri2 consists of three domains: clamp (amino acids 1–89), trunk (amino acids 90–191 and 282–299) and an embracing arm (amino acids 192–281) (Fig. 2a and see also Extended Data Fig. 5h,i). The embracing-arm domains of Tri2A (see Extended Data Fig. 5h) and Tri2B (see Extended Data Fig. 5i) project out at angles that differ by approximately 45° from each other (see Extended Data Fig. 5j–l).
Tri1 consists of three domains: N-anchor (amino acids 1–88), trunk (amino acids 89–228) and third-wheel (amino acids 229–364) (Fig. 2a and see also Extended Data Fig. 5d). The N-anchor anchors the triplex and seals holes through the capsid: its extended loop (amino acids 76–88) penetrates the capsid shell through a hole along a local threefold axis (see Extended Data Fig. 5e), and each helix of its loop–helix–loop–helix–loop–helix motif (amino acids 1–63) binds one of the three inner-floor valleys of three surrounding MCP subunits from inside the capsid (see Extended Data Fig. 5c). The valley is formed between the spine helix and its associated β-sheet of the MCP Johnson-fold domain. This configuration of N-anchor would lead to a stabilized, rather than a weakened, capsid when pressurized by DNA packaging. Tri1, particularly its N-anchor, exhibits a large degree of plasticity. For instance, the N-anchor domains of Tri1 of Tb, Tc, Td, Te and Tf is strikingly different from that of Tri1 of Ta (see Extended Data Fig. 5f,g and Supplementary Video 9). The N-anchor domain of Tri1 of Ta interacts with, and probably is stabilized by, a fragment of amino acids 308–339 in the Johnson-fold domain of P1 MCP (see Extended Data Fig. 6c,f). There is a high level of structural plasticity among the four types of Tri1: CATC-absent peri-penton Ta, CATC-binding peri-penton Ta, periportal Ta and Tb/Tc/Td/Te/Tf Tri1.
By contrast, although the two Tri2 subunits in each triplex differ greatly in the structure of their embracing arms (see Extended Data Fig. 5j–l), resulting in two distinguished conformations (conformers Tri2A and Tri2B), the structures of Tri2A (or Tri2B) in triplexes Ta through Tf, regardless of their periportal or peri-penton locations, do not change across different triplexes.
Capsid accommodation of the portal complex to enable DNA package and ejection.
Docking of the recently published structure of the recombinantly expressed EBV portal complex (Protein Data Bank (PDB), accession no. 6RVR)9 into our in situ structures reveals its interactions with the packaged DNA, capsid and tegument proteins (Fig. 4). Consistent with their conserved function of packaging and ejecting the dsDNA genome, the atomic structure of this recombinant EBV portal complex9 is highly similar to those resolved in herpes simplex virus 1 (HSV-1)19 and KSHV18, although the former lacks the tentacle helices visualized in the latter two and is proposed to be in the clip domain of their portal proteins. In the EBV portal complex, each monomer of the portal complex consists of five domains: clip (amino acids 280–473), stem (amino acids 251–279, 474–497), wing (amino acids 1–50, 138–171, 207–250), β-hairpin (amino acids 498–513) and wall (amino acids 51–137, 172–206, 514–613) (Fig. 4c). Much of the clip domain, which in HSV-1 and KSHV contains the tentacle helices, was not resolved in the recombinant portal complex. The recombinant portal structure fits well into our C12 portal subparticle reconstructed map (see Extended Data Fig. 7). Placing this C12 portal subparticle reconstruction together with the fitted atomic model into the C5 portal vertex, subparticle reconstruction according to the relative orientation as in HSV-1 (ref. 19) and KSHV18 also reveals tentacle helix densities (Fig. 4g), which may account for some of the five predicted clip-domain helices (from residue 288 to residue 434) that are missing in the recombinant portal complex9.
Fig. 4 |. Capsid accommodation of the DNA-translocating portal complex and periportal CATCs.
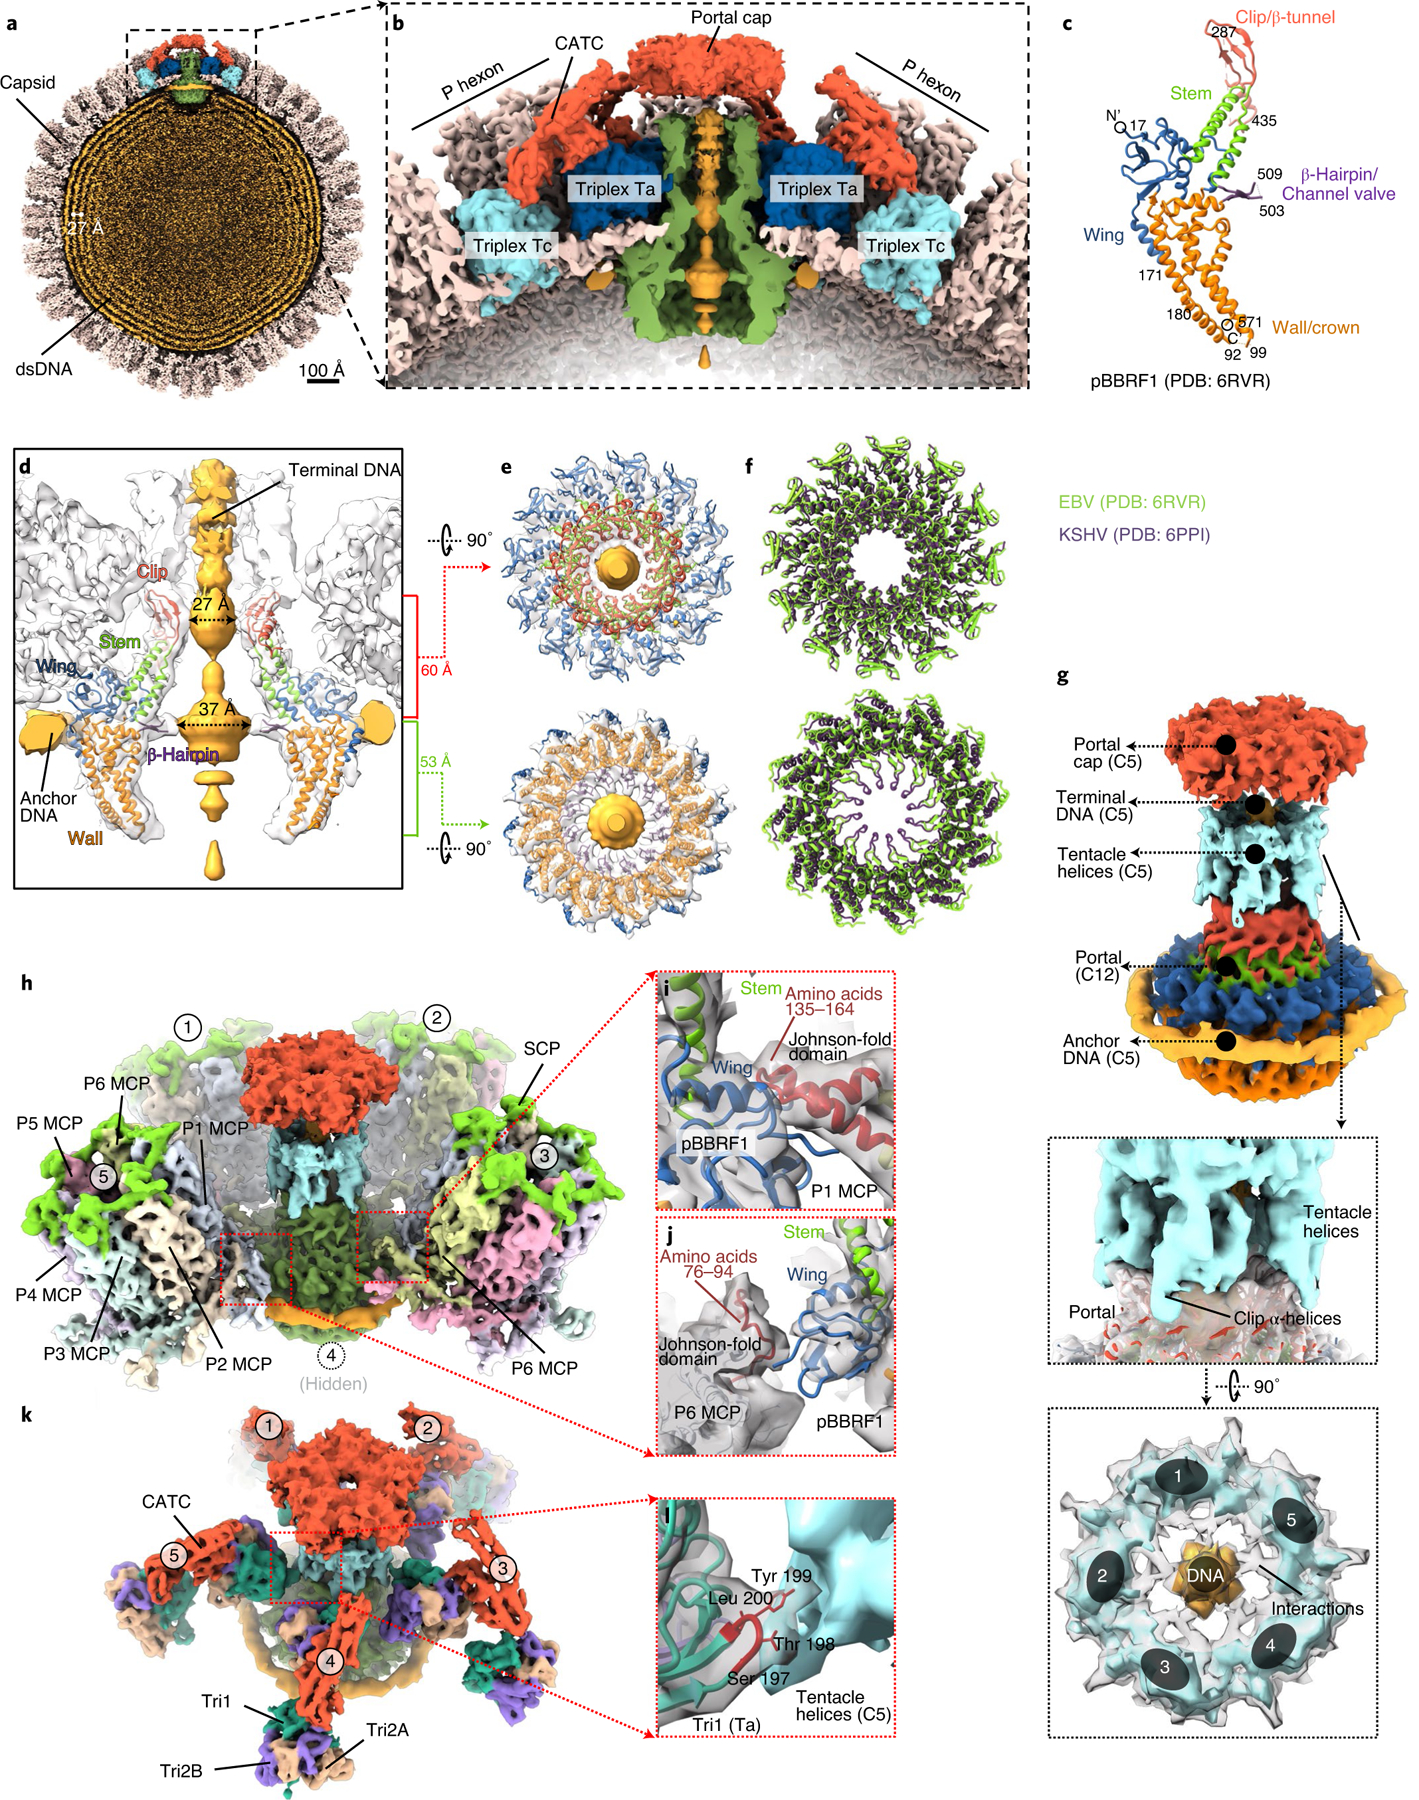
a,b, Clipped (a) and zoomed-in (b) views of the C5 whole-virus reconstruction, showing packaged dsDNA within the capsid with neighbouring dsDNA duplexes spaced ~27 Å apart (a) and structural components around the portal vertex (b). c, Atomic model of the recombinant portal protein9 shown as a monomer coloured by domains. d–f, Clipped view of the portal vertex region showing the fitted atomic models (ribbon) of two opposing subunits (d) and the two constrictions along the DNA-translocating channel (e). The superposition (f) of eBV and KSHV portal atomic models reveals similarities along these constrictions. g–l, Composite map of eBV portal region, showing interactions of the portal complex and DNA, and the MCP and Tri1. The C12 portal subparticle reconstruction was placed into the C5 portal vertex subparticle reconstruction by referencing HSV-1 and KSHV C1 portal vertex structures18,19, showing DNA, tentacle helices and portal cap structures surrounding the fitted atomic model of the portal complex (g). Five surrounding P hexons (h) interact with the wing domain of the portal protein through amino-acid segments 135–164 (i) and 76–94 (j) of P1 MCP and P6 MCP, respectively. Both segments are located within the Johnson-fold domain of the MCP. Likewise, surrounding the structure shown in g are five Ta triplexes (k), the Tri1 subunit of which interacts at residues 198 and 199 with the tentacle helices (l).
Docking also revealed both the anchor DNA that encircles the wall domains of the portal complex (Fig. 4g) and the terminal DNA that is held inside the portal channel at two aperture regions: one 27 Å in diameter at the clip domain and another 37 Å in diameter at the β-hairpin domain (Fig. 4d,e,g). Stabilized by the DNA presence, the fragment from amino acids 503–509 in the β-hairpin domain that was not resolved in the recombinant portal structure can now be seen (Fig. 4d). Likewise, the tentacle helices become visible in our in situ structure of the portal by their interaction with DNA (Fig. 4g) and the fivefold symmetrical portal cap (Fig. 4g). This portal cap is probably formed by five pairs of the CVC2 head domains belonging to the five CATCs, each of which bridges a set of periportal triplexes Ta and Tc (Fig. 4a,b). The tentacle helices of the portal appear to interact with the fragment of amino acids 197–200 in the trunk domain of Tri1 of periportal triplex Ta through Tyr 199 (Fig. 4k,l). The portal wing domain is positioned to interact with the Johnson-fold domain at amino-acid fragment 135–164 of P1 MCP and amino-acid fragment 76–94 of P6 MCP (Fig. 4h–j).
CATCs bind capsid variably.
In contrast to the above results showing five CATCs binding at each portal vertex, different numbers of CATCs can be seen at different thresholds (see Extended Data Fig. 8b,c)—one at each portal-proximal penton vertex, two at each portal-distal penton vertex, but at a lower density (implying lower occupancy), and none at the portal-opposite vertex (see Extended Data Fig. 8)—suggesting a diversity of the CATC-binding position or stoichiometry. Statistical analysis indicates that, around each penton vertex, the number of CATC attachments ranges from zero to five and obeys a quasi-Gaussian distribution, with the average number of CATCs per penton vertex being approximately one (see Extended Data Fig. 8d). The EBV CATC is a hetero-pentameric complex composed of three tegument proteins: one subunit of CVC1, two conformers of CVC2 (CVC2-A and CVC2-B) and two conformers of LTP (LTP-A and LTP-B) (Fig. 5a). A helix bundle is formed by CVC2-A (amino acids 66–102), CVC2-B (amino acids 66–102), LTP-A (amino acids 3114–3149) and LTP-B (amino acids 3114–3149) (Fig. 5a). Each CVC2 subunit has a head domain (Fig. 5a), but only that of CVC2-A was resolved, with its core region clearly visible (Fig. 5b). Only ~37 amino acids of the C-terminus of the 3,149 amino-acid-long LTP are visible, and the remaining part of the LTP is probably organized into multiple domains tethered by flexible linkers22, and thus not visible in the averaged structures presented here.
Fig. 5 |. CATC and its interactions with triplexes ta and tc.
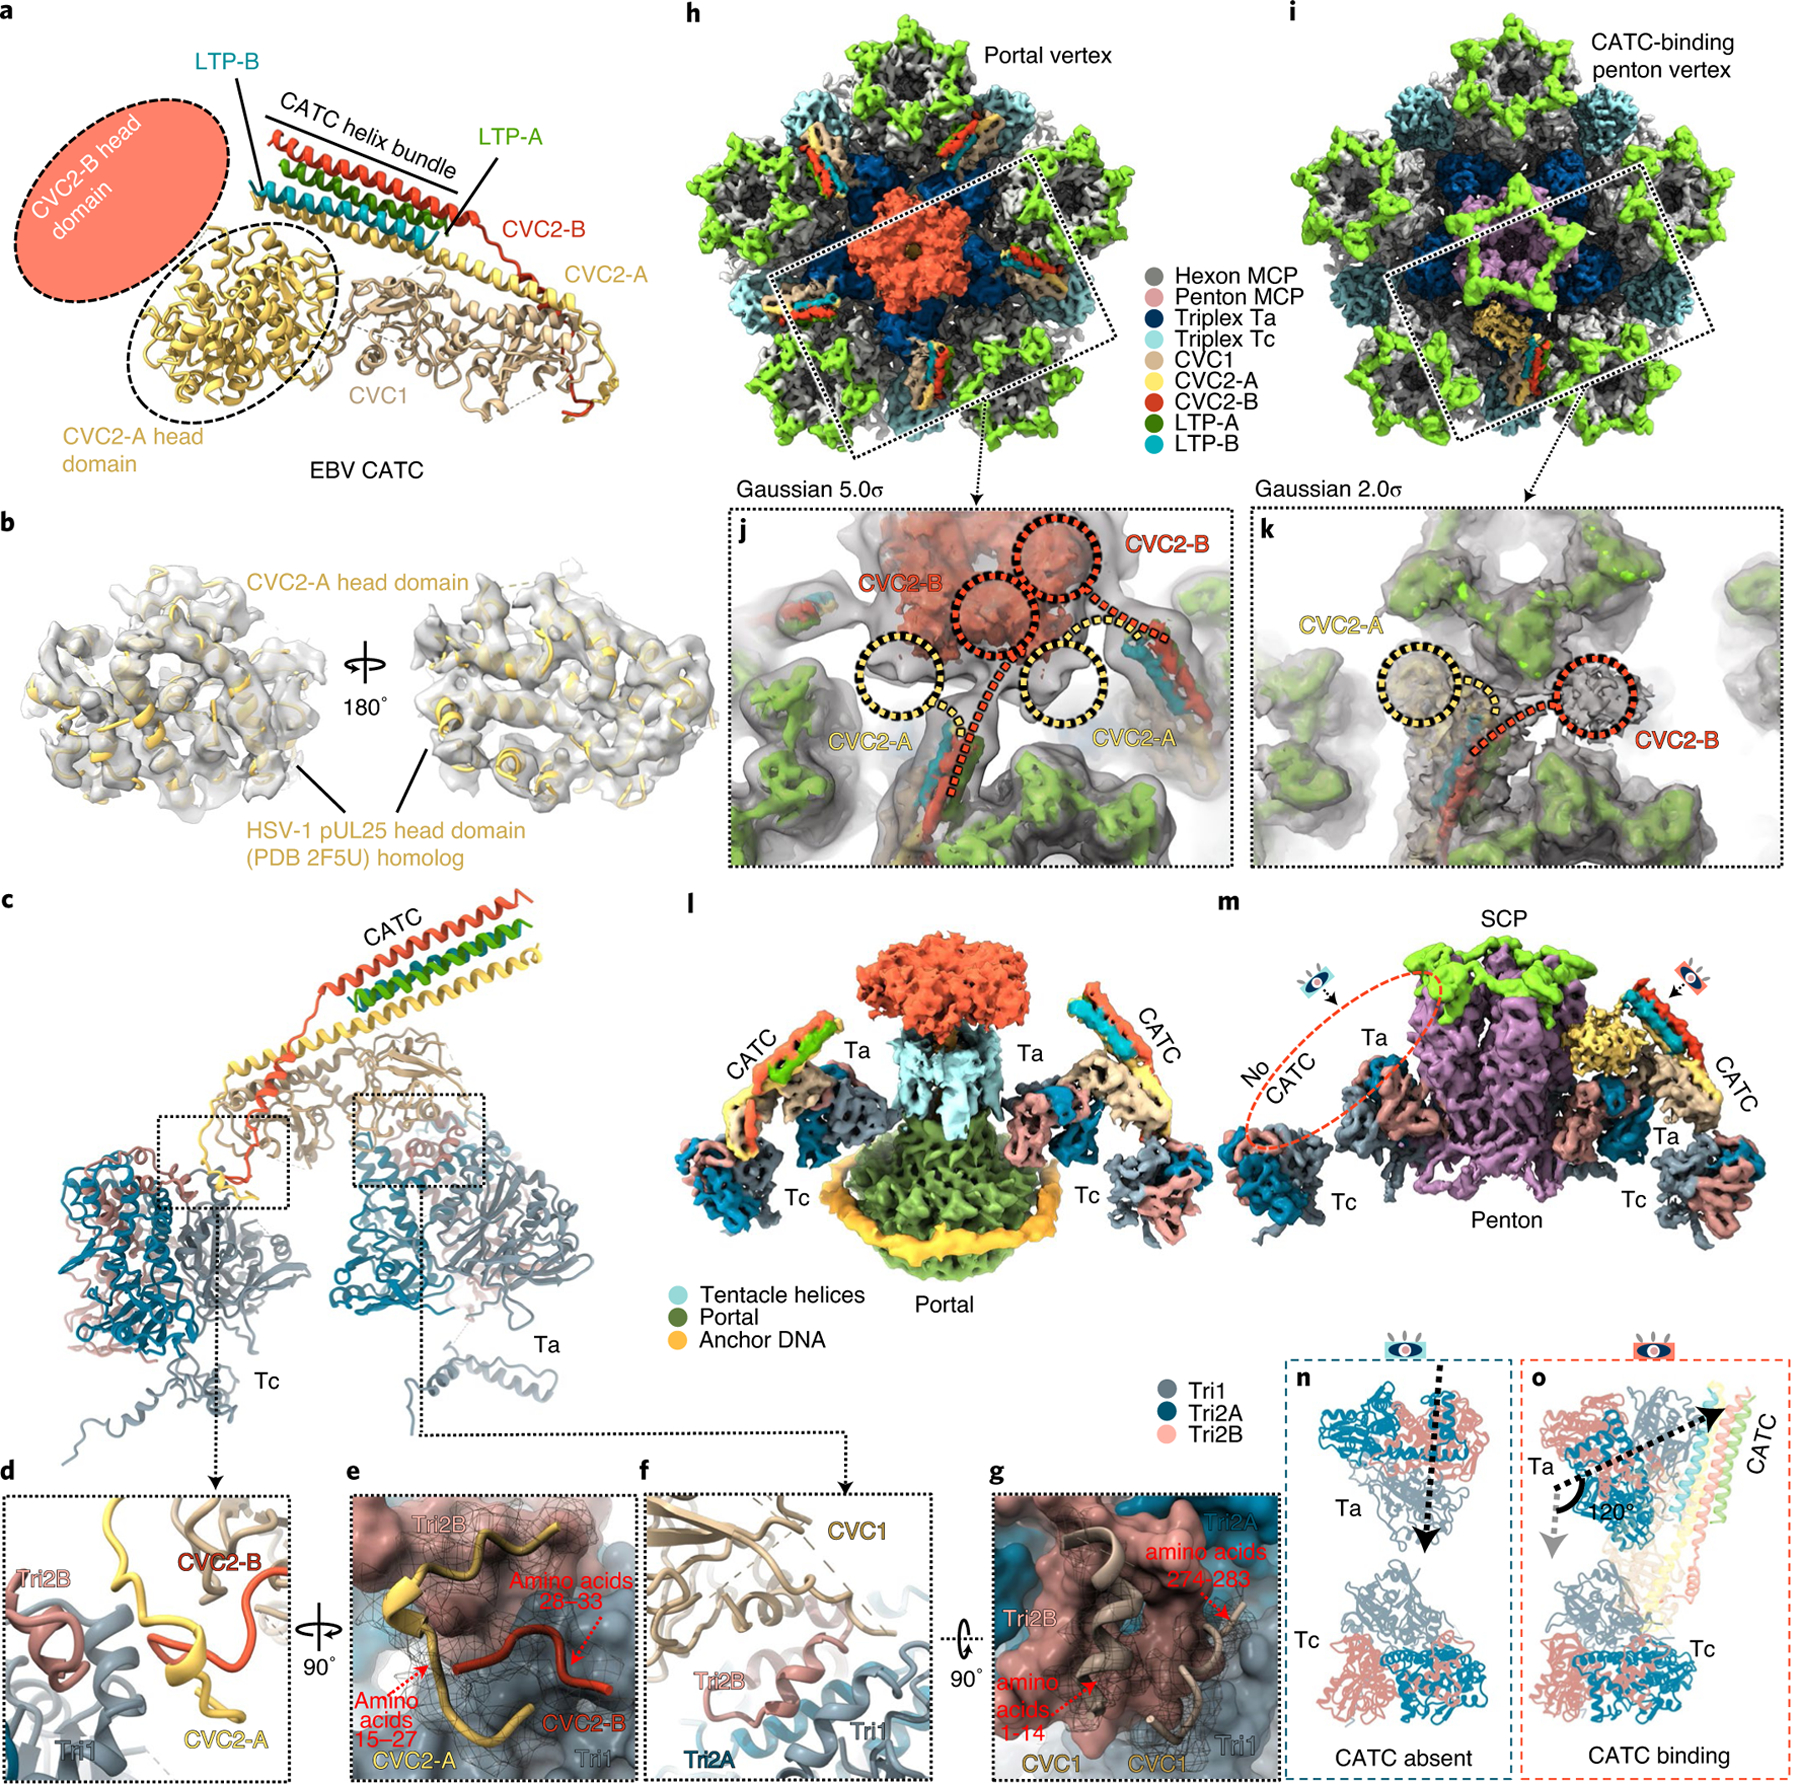
a–g, Atomic model of a peri-penton CATC showing hypothetical placement of the head domains of CVC2-A and CVC2-B conformers (a,b) and CATC interactions with triplexes Ta and Tc (c–g). Helices resolved in the density map (semi-transparent grey in b) of the CVC2-A head domain match those of the homologous HSV-1 pUL25 atomic model (ribbons in b). CATC interactions with triplex Ta and Tc are shown in c and detailed in d, e, f and g, respectively. h–o, CATC accommodation at the portal and penton vertices. Subparticle reconstructions of the portal vertex (h) and the CATC-binding penton vertex (i) with insets showing low-pass-filtered density maps (semi-transparent grey). In the penton vertex subparticle reconstruction, the CATC helix bundle is near two densities (circled) that are probably head domains of CVC2-A (yellow circle) and CVC2-B (red circle) (k). In the portal vertex reconstruction, the CATC helix bundle is connected to the portal cap (j), suggesting that the CVC2 head domains emanating from CATC contribute to the portal cap. l,m, Side views of the portal vertex (l) and CATC-binding penton vertex (m). n,o, Comparison of triplex Ta external orientation relative to triplex Tc in the absence (n) and presence (o) of CATC at the penton vertex, showing that the CATC binding rotates Ta apical domains for 120° counterclockwise.
Each CATC bridge crosses the space between, and binds at, triplexes Ta and Tc (Fig. 5c). The CATC stabilizes its binding on Ta and Tc by interacting with neighbouring capsid proteins. For instance, at the front of the CATC, the fragment of amino acids 1–14 of the CVC1 subunit of the CATC binds to the groove formed by the embracing-arm domain of Tri2B in triplex Ta (Fig. 5f,g), whereas another fragment of amino acids 274–283 of the CVC1 interacts with a groove formed by Tri1 and Tri2B of triplex Ta (Fig. 5f,g). In the EBV virion structure, both the portal vertex (Fig. 5h and see also Supplementary Video 10) and the CATC-binding penton vertex (Fig. 5i and see also Supplementary Video 11) have CATC bound. At the portal vertex, five CATCs bind on five sets of Ta and Tc triplexes (Fig. 5l), and their CVC2-B head domains jointly form a portal cap, with each of the five other CVC2-A head domains located to the left of the five copies of CVC2-B (Fig. 5j). In contrast, each CATC-binding penton vertex has only about one CATC that binds on top of related Ta and Tc triplexes (Fig. 5m). It is interesting that the CVC2-A head domain is located to the left of the CATC helix bundle, opposite to that in KSHV, which is to the right (see Extended Data Fig. 9). However, the CVC2-B head domain is visible only at a low-density threshold (Fig. 5k), suggesting flexibility.
CATC binding to triplex Ta rotates the latter by 120°.
Comparison of the structures of Tri1 of triplex Ta in CATC-absent, CATC-binding and portal vertices reveals even more interesting variations. Binding of CATC to triplex Ta rotates triplex domains outside the capsid shell counterclockwise by 120°, compared with the orientation of CATC-absent Tri1 (Fig. 5n,o and see also Supplementary Video 5), thus twisting the linker region between its N-anchor and the rest of the Tri1. Specifically, the trunk and the third-wheel domains of Tri1 of triplex Ta are rotated counterclockwise by 120° on CATC binding, whereas the orientation of the N-anchor domain remains the same in all triplexes, regardless of the presence or absence of CATC binding. In the portal vertex, much of the density of the N-anchor domain is missing. The density of its interacting amino-acid fragment 308–339 in P1 MCP is invisible, possibly due to the loss of its interactions with the N-anchor domain of Tri1 in triplex Ta, near a CATC-binding penton (see Extended Data Fig. 6i). Regardless of these, the relative orientations of Tri1 N-anchors also remain in Tri1 in triplexes elsewhere (see Extended Data Fig. 6c,f), although a portion (amino acids 63–83) of the N-anchor domain in CATC-binding peri-penton Tri1 is not resolved. This observation indicates that, during virion assembly, triplex Ta incorporation into the capsid precedes CATC binding, and the latter rotates the triplex domains above the capsid shell.
The manner of CATC binding to penton vertices in EBV differs not only from that in α-herpesvirus HSV-1 (refs. 12,19) and varicella-zoster virus (see coordinated submission from Wang et al.23), but also fellow γ-herpesvirus KHSV18. Five sets of CATCs occupy Ta triplexes surrounding the portal vertex, but only about one CATC binds to one of the five available Ta triplexes surrounding each penton vertex in EBV. Binding of a CATC to Ta triplexes in EBV and KHSV rotates Ta by 120° (Fig. 5o), but not peri-penton Ta in α-herpesviruses. In α-herpesviruses12,13,24, five CATCs, each consisting of two copies of pUL25, two copies of pUL36 and one copy of pUL17, associate through their combined ten pUL25 head domains to form a pentagram, crowning each of the eleven penton vertices12,13, as well as the portal vertex25. Even within the γ-herpesvirus subfamily, there are three major differences between EBV and KHSV18 concerning their CATC: first, the number of bound CATCs per penton vertex varies—about one CATC per penton vertex in EBV (see Extended Data Fig. 8d) and about two CATCs per penton vertex in KSHV; second, the visible head domain of the CVC2 dimer is located on the opposite side of the CATC helix bundle (see Extended Data Fig. 9a,b); and, third, the orientations of their helix bundle differ by ~30° (see Extended Data Fig. 9c).
Structures of SCPs and the SCP–tegument interface.
As the smallest of all the capsid proteins, SCPs are also remarkably the most divergent with respect to their 3D structure (Fig. 6a,b), and protein lengths and sequences (Fig. 6c,d), with their length varying from 75 to 176, and to 235 residues in human cytomegalovirus (HCMV), EBV and varicella-zoster virus (see coordinated submission from Wang et al.23), respectively (Fig. 6d). The 176-residue-long SCP in EBV consists of 4 segments: an N-terminal MCP-binding loop domain (NTD), a stem helix, a bridging helix and an intrinsically disordered C-terminal domain (residues 78–176) (Fig. 6c). For all SCP subunits in our density maps, the density quality for residues 77 and beyond (in the direction of the C-terminus, ~99 amino acids) gradually degrades from highly disordered to invisible, suggesting that the C-terminal fragment is inherently more flexible than the rest of the protein, and thus was not as well resolved in the cryo-EM maps obtained by averaging SCP subunits in individual virions. The location of the last visible C-terminal residue of an SCP suggests that the disordered C-terminal regions emanate from the top of a penton or a hexon (Fig. 6e), possibly excluding the binding of the CVC2 head domain on top of a penton (Fig. 5k).
Fig. 6 |. Plasticity of the SCP structure and implications for tegument protein recruitment.
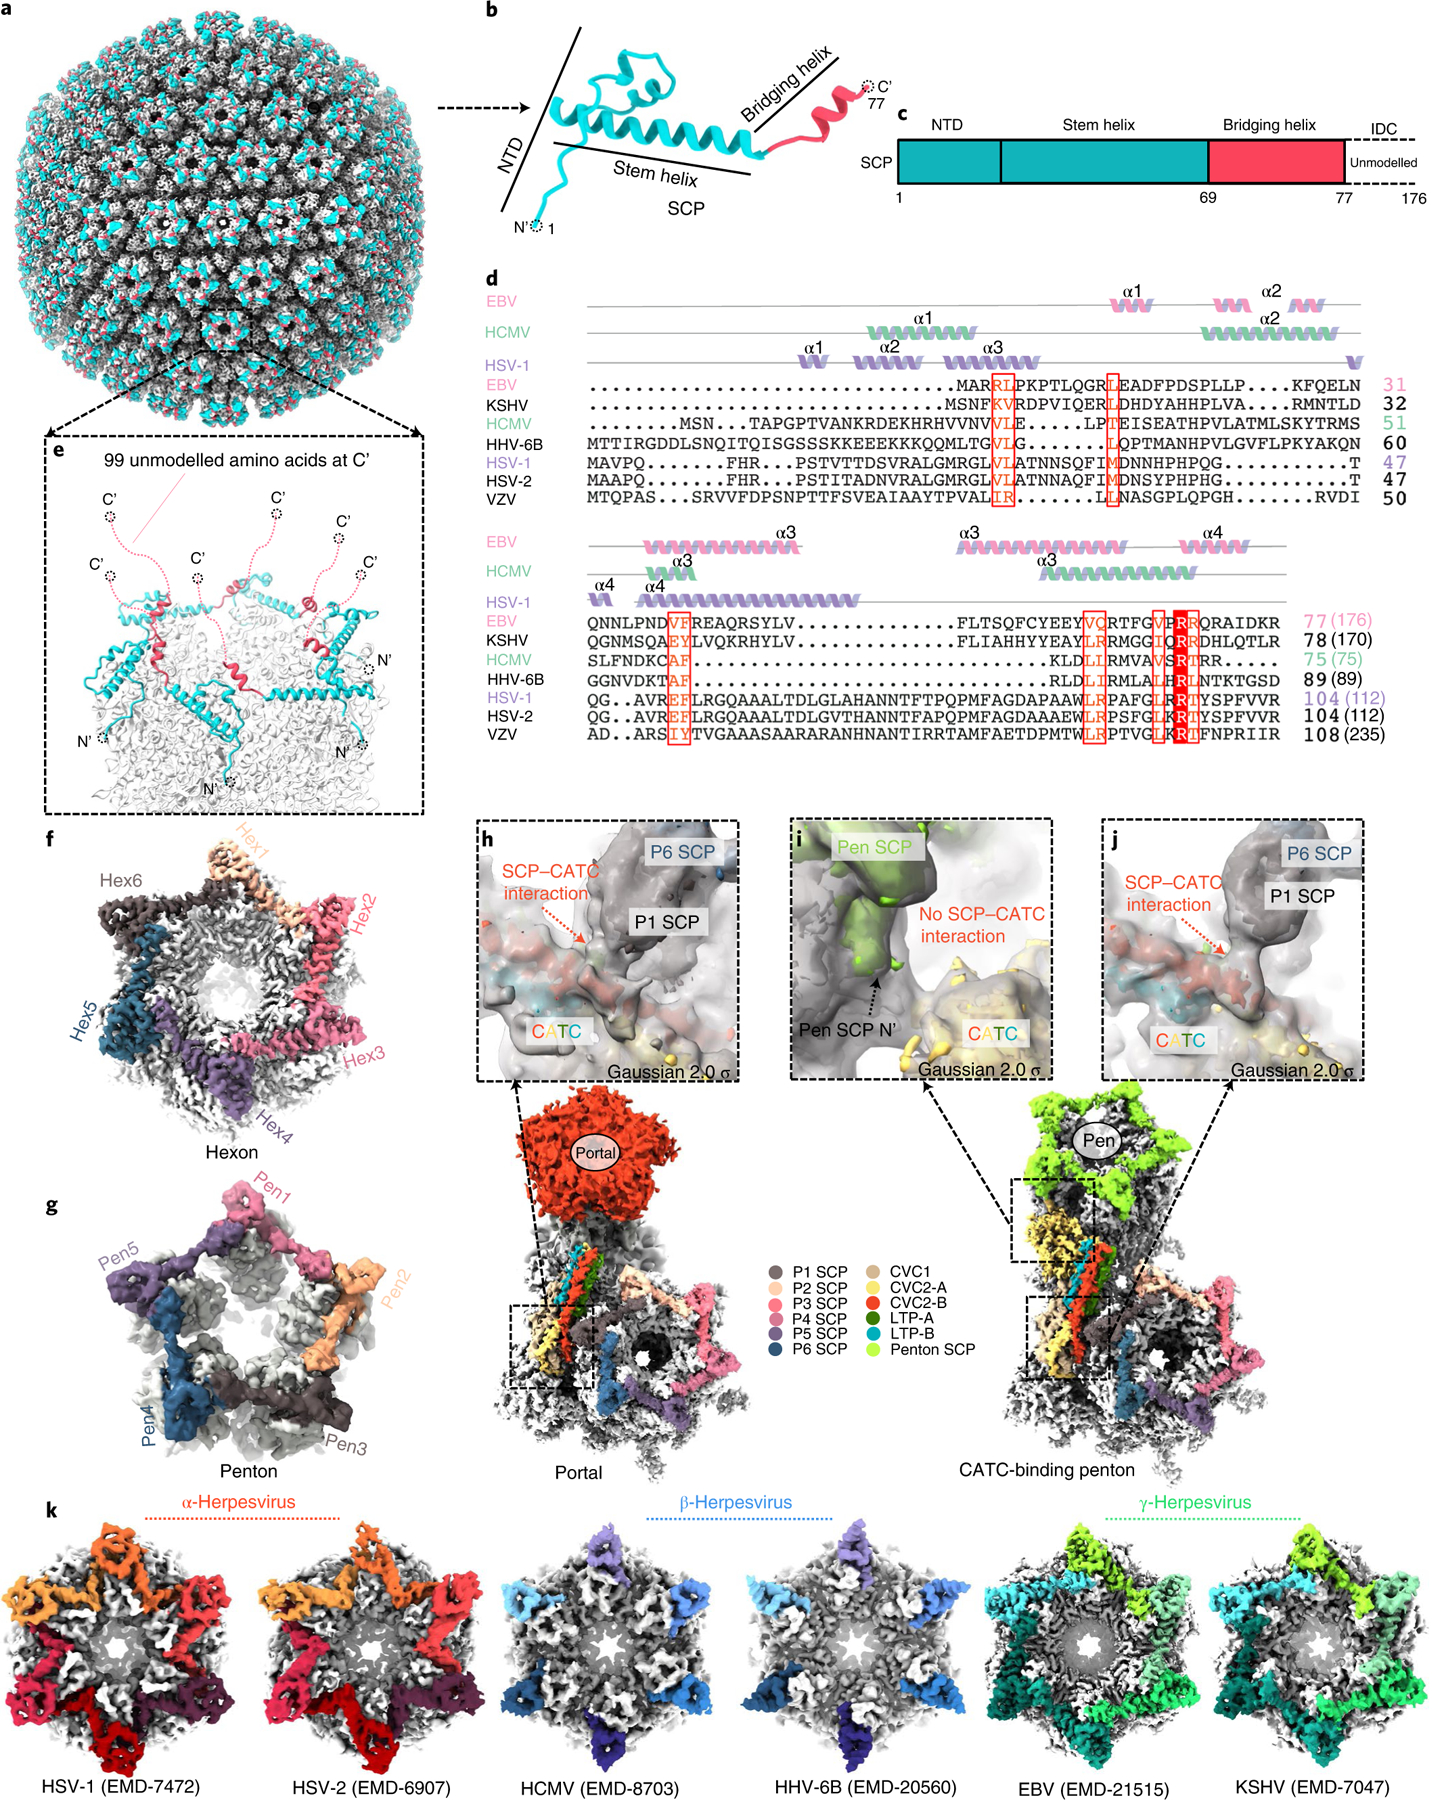
a–g, Structure of the eBV SCP in the penton and hexon. The SCP has a helix-rich N-terminal half (b) that sits on top of both the penton and the hexon of the capsid (a), bridging adjacent MCP subunits (e–g) and the flexible C-terminal half emanating into the tegument layer (e). c, Schematic diagram of the domain organization of SCP. Structure and sequence alignments (d) indicate that eBV SCP differs from known SCP structures. Lengths of SCP sequences are indicated in parentheses. ICD, intrinsically disordered C-terminal domain; VZV, varicella-zoster virus; HHV, human herpesvirus. f–g, Representative eBV hexon (f) and penton (g). h–j, Interactions between CATC and hexon SCP near the portal vertex (h) and the penton vertex (i and j). k, Comparison of interactions between SCP (colour) and MCP (grey) in the hexons of three subfamilies of herpesviruses.
An SCP interacts extensively with the upper domain of its underlying MCP in both the penton and the hexon (Fig. 6a,e,f,g and see also Extended Data Fig. 10a–d). Its C-terminal structure extends to, and interacts with, a neighbouring MCP through its bridging helix (see Extended Data Fig. 10a–d). Six SCPs bind six MCPs in a crown shape to form a hexon (Fig. 6f and see also Extended Data Fig. 10a,b). Likewise, five SCPs bind to five MCPs in a star shape to form a penton (Fig. 6g). The stem helix of one SCP inserts into a major SCP-binding groove of its closest MCP, whereas the bridging helix of this SCP inserts into a minor SCP-binding groove of the neighbouring MCP (see Extended Data Fig. 10c), both through hydrophobic interactions (see Extended Data Fig. 10d). Distinct from α- and β-herpesviruses, but similar to that in KSHV, two neighbouring SCPs interact with each other in EBV, and the NTD of one SCP interacts with the bridging helix of neighbouring SCPs, mainly by hydrophilic interactions (Fig. 6k and see also Extended Data Fig. 10b, right panels). The 16 subunits of the SCP in each asymmetry unit can be divided into 2 clearly different conformers: hexon SCP and penton SCP (see Extended Data Fig. 10e,f).
The SCP also has interactions with CATCs. For instance, when displayed at a low-density threshold, it can be seen that the density of NTD of the SCP in a CATC-binding penton vertex connects with that of CVC2-B in both portal (Fig. 6h) and CATC-binding (Fig. 6j) vertices. However, although next to each other, the CVC2-A head domain has no interaction with peri-penton SCPs (Fig. 6i).
Discussion
The first high-resolution structure analysis of the EBV virion presented in the present study reveals both conservation with, and divergences from, atomic structures of other human herpesviruses. Consistent with the role of DNA packaging and ejection, both the in situ structure and mode of interactions with capsid and tegument proteins of the DNA-translocating portal complex are conserved with those reported for HSV-1 (ref. 19) and KHSV18, members of the α- and γ-herpesvirus subfamilies, respectively. Although structures of EBV proteins differ from those in other human herpesviruses at multiple levels (such as much of the SCP, buttress and upper domains of the MCP, and the Tri1 N-anchor domain not modelled in other herpesviruses), the most striking observation in the EBV structure is the structural differences of these capsid proteins and variable attachment of tegument proteins even within the same EBV particle.
Structural plasticity—where the same protein adopts different conformations at geographically different locations, and thus probably chemically distinct environments—is the rule rather than the exception in viruses. Since Crick and Watson first hypothesized nature’s choice of icosahedral symmetry as a solution to the ‘limited genome size’ problem of viruses26, quasi-equivalence in viral subunit structures has been observed experimentally, first by X-ray diffraction27–30 and then by cryo-EM31. Notably, only DNA-containing virions (and thus infectious) were included in our reconstructions, indicating that the observed structural plasticity is unlikely to have contributed by the low plaque-forming unit characteristic of EBV infection. Rather, it probably has functional implications in the attachment of variable copies of CATCs and the recruitment of other cell-regulatory molecules (including RNA32,33) into the virion tegument compartment during virion assembly as ‘cargoes’ to be delivered to host cells. Such cargoes inside the tegument compartment of the EBV virion are released in the host cytoplasm to interfere with, and thus probably ‘enslave’, the host cell for virus spread during infection, which may determine the phase of the life cycle: latent or lytic32,33. For example, the BNRF1 gene-encoded major tegument protein has been shown to have cellular transforming capability through regulating cell cycle activities6,34. This EBV-unique tegument protein is essential for regulating transcription of viral genes during viral infection and B-cell proliferation, in an EBV-specific fashion33,34. Non-synonymous mutations of some EBV-specific tegument and envelope proteins are implicated in nasopharyngeal carcinoma34. Some of the tegument proteins enhance the initiation of the lytic cycle32. It is conceivable that the different cargo molecules may influence the choice of lytic versus latent cycles after infection. Therefore, beyond the importance embodied in this very first EBV atomic structure is the observed structural plasticity of two EBV proteins: first, the variably packaged LTP, which is known to participate in cellular transformation and lymphoma formation35 and to recruit other tegument and envelope proteins35,36; and, second, SCP’s observed interactions with tegument protein CVC2-B (Fig. 6h, j) and hypothesized C-terminal interactions with other tegument proteins (Fig. 6e). It has not escaped our attention that the observed structural plasticity and variable tegument protein association would promote non-deterministic recruitment of such cell-regulatory or cell-transformative cargo molecules into the tegument compartment. They increase diversity of the virions even with the same viral genome-coding capacity, thereby increasing the possibility for a portion of the virus population surviving in different environments. Although the importance of this diversity awaits future verification, the ultimate determinant of the oncogenic property of EBV lies, of course, at the level of viral genes, which code for proteins and their propensity to alter by environmental factors.
From the technical point of view, by using a sequential symmetry relaxation and classification workflow in subparticle reconstruction, we have overcome two intrinsic challenges in high-resolution structural studies of EBV: the scarcity of virion particles and the intrinsic structural plasticity of EBV proteins. Reflecting on the astonishing accomplishment of reconstructing the tomato bushy stunt virus by combining merely six virus particles at the dawn of 3D electron microscopy37, the work presented here—resolving 45,900 amino acid residues from only 2,048 EBV virus particles—highlights the progress in cryo-EM enabled by direct electron detection and advanced data analysis. Future efforts towards structure-based inhibitor design11,18 and vaccine development38 should extend to, and would probably benefit from, the structural plasticity documented in the present study.
Methods
Cell culture and virus isolation.
EBV is mostly latent in infected cells in vitro and grows to very low titres compared with other herpesviruses, presenting a major challenge in isolating high-concentration virions for structural studies. We obtained EBV virions by chemical induction of latently infected B cells. Latent EBV-infected marmoset B cells (B95–8, a gift from G. Miller of Yale University; the cell line has not been authenticated and not been tested for Mycoplasma contamination) were cultured in RPMI-1640 medium (Sigma-Aldrich) supplemented with 10% fetal bovine serum (FBS). To make EBV production medium, 25 ng μl−1 of tetradecanoyl phorbol acetate and 0.5 mM sodium butyrate are added to RPMI-1640 medium supplemented with 2% FBS. Tetradecanoyl phorbol acetate and sodium butyrate can both reactivate EBV from latency to virion-producing lytic replication, and the reduced level of FBS can minimize the secretion of EBV-like vesicles39. For each batch of EBV virion production, 30 T175 flasks of B95–8 cells at ~90% confluency were replenished with fresh EBV production medium. After 5 d, cell culture supernatant was collected and subjected to EBV virion purification by a procedure described previously11. Briefly, the supernatant was centrifuged at 10,000g for 10 min at 4 °C to clear cellular debris. Then viral particles were pelleted by ultracentrifugation (21,000g for 1.5 h at 4 °C; SW28 rotor), followed by resuspension in phosphate-buffered saline, pH7.4. Viral particles were further purified by ultracentrifugation through a 10–50% (w:v) sucrose gradient. The virion-containing fraction was collected, pelleted by ultracentrifugation and resuspended in 20 µl phosphate-buffered saline before cryo-EM sample preparation.
Cryo-EM data acquisition.
Aliquots of 2.5 μl of the sample were applied to 200-mesh Quantifoil R2/1 cooper grids, blotted with filter paper and plunge-frozen into liquid ethane with a manual plunger. These grids were stored in a liquid nitrogen Dewar before cryo-EM imaging. Cryo-EM was performed in an FEI Titan Krios cryo-electron microscope equipped with a Gatan imaging filter (GIF) and a post-GIF Gatan K2 Summit direct electron detector. Before imaging, the electron microscope was carefully aligned and the parallel beam was optimized using the coma-free alignment tool in SerialEM40. The microscope was operated at 300 kV with the GIF slit set to 20 eV. Movies were recorded at a dose rate of ~8.5 electrons per s per physical pixel on the detector with a ×105,000 nominal magnification (corresponding to a pixel size of 0.68 Å at the specimen level) in super-resolution mode. The total exposure time for each movie was 6 s, fractionated equally into 30 frames, leading to a total dosage of ~28 electrons Å−2 on the specimen. We circumvented the scarcity of virion particles by employing a combination of advanced imaging technologies40–42 to precisely target sparsely distributed EBV virions (barely one particle per movie, for example, see Supplementary Fig. 1). A total of 3,908 movies were recorded in a continued session spanning 3 d.
Micrograph pre-processing and icosahedral reconstruction.
Movies were processed using MotionCor2 (ref. 43) with a subframe of a 5 × 5 array and binned 2× (final pixel size: 1.36 Å) to generate two micrographs: one without dose weighting (used for manual micrograph screening, particle picking and defocus determination) and the other with dose weighting (used for final reconstruction). The defocus values of these micrographs were determined with CTFFIND4 (ref. 44). Micrographs without virion particle, or with crystal ice contamination or a defocus value beyond the range from −0.8 to −4 μm were discarded; 1,833 good micrographs were selected for subsequent in-depth data processing.
Using RELION v.3 (ref. 45), we manually picked 2,801 particles, including those near the edge of micrographs. These particles were extracted from the original dose-weighted micrographs and binned by 2 (bin2) into an image size of 512 × 512 pixel2. One binary sphere with a radius of 236 pixels created with the ‘relion_mask_create’ command was used as the initial reference to run a 3D classification with icosahedral symmetry in the I3 convention (that is, the 52 setting, with z axis and y axis along an icosahedral fivefold axis and twofold axis, respectively) by requesting three classes. The best class contained 2,048 particles and showed good structural features. Particles in this class were re-extracted with more accurate centre coordinates from the original micrographs (bin2, box size 512 pixels). Those particles were then subjected to 3D auto-refine with I3 icosahedral symmetry and post-processing, yielding an I3 reconstruction at 6.2-Å resolution. To improve the resolution of this icosahedral reconstruction, we ran three additional steps to calibrate defocus, astigmatism and beam tilt, a procedure that we refer to as iterative CTF refinement. In the first step, the defocus values of all particles included in the data STAR file from the above 3D refinement were calibrated through RELION v.3 CTF refinement. The 3D auto-refine, with the defocus-calibrated data STAR file and post-processing, yielded a new icosahedral reconstruction at 5.9-Å resolution and a new data STAR file. In the second step, the defocus and the astigmatism of all particles in the new data STAR file were calibrated simultaneously, and the resolution of the icosahedral reconstruction was pushed to 5.6 Å. In the third step, not only were parameters of defocus and astigmatism of all particles calibrated, but also the beam tilt parameters of the microscopes were estimated. The resolution of the resulting icosahedral reconstruction was pushed to 5.5 Å (5.46 Å as reported by RELION v.3). As the resolution limit (Nyquist limit) for bin2 images (pixel size 2.72 Å) is 5.44 Å, we reasoned that we had reached the best possible resolution through 3D auto-refine and iterative CTF refinement.
C5 fivefold, C3 threefold and C2 twofold subparticle reconstructions.
To obtain the higher-resolution structures required for atomic model building, we used a subparticle reconstruction strategy12–14,16,17,46,47 to reconstruct subregions (that is, ‘subparticles’) surrounding the icosahedral fivefold, threefold and twofold axes (that is, main axes) of the EBV icosahedral capsid. These main-axis subparticle reconstructions began with the above-described I3 icosahedral reconstruction and the corresponding I3-icosahedral data STAR file. Our workflow (see Supplementary Fig. 2) is based on tools in Relion3 and includes two main steps: subparticle extraction and subparticle reconstruction, as detailed in the following four paragraphs.
In the first step, we extracted main-axis subparticles. To extract fivefold vertex subparticles, we expanded the I3-icosahedral data STAR file with I3 symmetry using RELION’s ‘relion_particle_symmetry_expand’ command to create a symmetry-expanded data STAR file, which contains 60 entries for each virus particle. These entries differ in their orientations. For the I3 convention, the z axis is along a fivefold axis and the centre coordinates of this fivefold vertex can be conveniently estimated to be at (x = 0, y = 0, z = 188 pixels) in the bin2 3D reconstructed map. We then extracted one particle for each entry in the I3-icosahedral symmetry, expanded data STAR file using RELION’s ‘relion_preprocess’ command with the centre on the fivefold vertex centre coordinates (x = 0, y = 0, z = 188 pixels) and a box size of 800 pixels (using such a big box size ensures that at least some regions of the extracted subparticle are within the original micrograph, see C6 hexon subparticle reconstruction), yielding a subparticle data STAR file in which each subparticle image has a fivefold vertex in the centre. As each EBV virus only contains 12 fivefold vertices other than 60, this subparticle data STAR file contains 5 subparticle entries corresponding to each fivefold vertex. These duplicative subparticles were removed using RELION’s ‘relion_star_handler’ command with the following criteria: if the distance of two images in the newly obtained particle data STAR file is shorter than 6 Å, these two subparticles were considered to be duplicates, and thus only one of them will be retained. Also removed (by Linux command ‘awk’) are those images with centre coordinates (‘_rlnCoordinateX’ and ‘_rlnCoordinateY’) in the data subparticle data STAR file that go beyond the edge ranges of 160–3,678 pixels and 160–3,550 pixels, respectively, of the original micrographs. In the final step, we ran RELION’s ‘relion_preprocess’ command again to re-extract subparticles listed in the cleaned fivefold subparticle data STAR file at a size of 320 × 320 pixels from the original micrographs (pixel size 1.36 Å), yielding a total of 22,981, non-duplicative, fivefold vertex subparticles.
To extract subparticles around twofold and threefold axes with more accurate initial orientation information, virus particles listed in the I3-icosahedral data STAR file obtained from the above section were subjected to another round of 3D auto-refine with icosahedral symmetry in the I2 convention (Crowther 222 setting, with icosahedral twofold axes along x, y and z axes), yielding an I2 icosahedral reconstruction (identical to the icosahedral I3 reconstruction but oriented in the Crowther 222 setting) and a corresponding I2 icosahedral data STAR file. For the icosahedral I2 reconstruction, a twofold axis is along the z axis and a threefold axis lies in the YZ plane about 20.9° from the z axis, so we could conveniently set the centre coordinates of the two- and threefold subparticles as (x = 0, y = 0 and z = 188 pixels) and (x = 0, y = 68 and z = 178 pixels), respectively, in the I2 bin2 reconstruction. We then expanded the I2 icosahedral data STAR file with I2 symmetry to create an I2 icosahedral symmetry-expanded data STAR file, which contains 60 entries for each virus particle. Using the same strategy in re-extracted, fivefold, non-duplicative subparticles, we re-extracted 50,684 twofold and 31,807 threefold axis-related, non-duplicative subparticles at a size of 320 × 320 pixels from the original micrographs.
In the second step, we obtained subparticle reconstructions by combining RELION 3D auto-refine, post-processing and CTF refinement. In the present study, we describe only fivefold subparticles as one example to illustrate this step. We cropped one fivefold vertex map from the icosahedral reconstruction (bin2) using RELION’s ‘relion_image_handle’ command with the listed parameters: –shiftz −188,–anpix 2.72,–rescale_angpix 1.36,–new_box 320. The 22,981, non-duplicative, fivefold vertex subparticles were subjected to one round of RELION-focused 3D auto-refine (focused means only local search, by setting ‘– healpix_order’ and ‘–auto_local_healpix_oder’ to the same number; here 4 was applied) with the newly created fivefold vertex map as the reference (filtered to 15 Å), and post-processing, initially yielding a fivefold subparticle reconstruction (C5 symmetry) at 4.0 Å. As described, during extraction of fivefold subparticles, we did not adjust the subparticles by considering their locations in the virus, so we did not eliminate effectively the depth-of-focus problem for the enormous virus particles48,49. Instead, we used the iterative CTF refinement strategy described in Micrograph pre-processing and icosahedral reconstruction to alleviate this problem. With three iterations of CTF refinement, the resolution of the C5 fivefold subparticle reconstruction finally converged at 3.4 Å.
The workflow for twofold subparticles was the same as for the fivefold subparticles, except the symmetry was set to C2 during the focused 3D auto-refine step. The resolution of the final C2 twofold subparticle reconstruction is also 3.4 Å. For threefold subparticles, the C3 symmetry axis of the cropped map from the I2 icosahedral reconstruction is not along the z axis, so we first aligned the C3 symmetry axis of the cropped map to the z axis manually and resampled the map to one map reference (the C2 twofold subparticle reconstruction) with Chimera50. The workflow of the twofold subparticle reconstruction is the same as the fivefold and threefold subparticle reconstructions, except that the latter were subjected to the first round of 3D auto-refine with the resampled map (filtered to 15 Å) as the reference, the ‘–healpix_order’ and ‘–auto_local_healpix_oder’ parameters were set to 1 and symmetry was set to C3. After three iterations of CTF refinement, the resolution of the final threefold subparticle reconstruction was pushed to 3.4 Å. Resolutions were based on the 0.143 ‘gold-standard’ Fourier shell correlation criterion51.
C6 hexon subparticle reconstruction.
Similarly, we extracted hexon subparticles and performed subparticle reconstruction (see Supplementary Fig. 2). The nearest main axis of E, C and P hexons is the twofold, threefold and threefold axis, respectively. We used the RELION data STAR file of the main-axis subparticle reconstruction to guide extracting the hexon subparticles nearest to the corresponding main axis; thus, E, C and P hexon subparticle extractions were guided by the STAR files of the twofold, threefold and fivefold subparticle reconstructions, respectively. We expanded the C3 threefold reconstruction-related data STAR file with C3 symmetry to create a threefold reconstruction-related, symmetry-expanded data STAR file. Similarly, we expanded the final C5 fivefold reconstruction-related data STAR file with C5 symmetry to create a fivefold reconstruction-related, symmetry-expanded data STAR file. As E hexon is at the centre of the C2 twofold subparticle reconstruction, there was no need to expand the final C2 twofold reconstruction-related data STAR file. The centre coordinates of E, C and P hexons were estimated to be at (x = 0, y = 0, z = 0 pixels), (x = 0, y = 64, z = −4 pixels) and (x = −108, y = 0, z = −15 pixels) in the two-, three- and fivefold subparticle reconstructions, respectively. We extracted 50,684 E-hexon, 95,421 C-hexon and 114,905 P-hexon subparticles at a size of 160 × 160 pixels from the original micrographs, separately, using RELION’s ‘relion_preprocess’ command with the related centre coordinates and data STAR files as the inputs. The initial parameters for orientation, defocus, astigmatism and beam tilt of each hexon subparticle are the same as those of the nearest main-axis subparticle processed above (E hexons to twofold, C hexons to threefold and P hexons to fivefold).
These hexon subparticles were then subjected to focused 3D classification (focused here means applying local search only by setting ‘–sigma_angle’ to 10) with four classes requested and C6 symmetry applied; 99,821 hexon subparticles belonging to one class with the highest reported resolution were selected and subjected to a final round of 3D auto-refine with C6 symmetry and post-processed with a B-factor −120 Å2, yielding a C6 hexon subparticle reconstruction at 3.0 Å (see Supplementary Figs. 2 and 3). Iterative CTF refinement in this step did not improve the final resolution further.
C1 threefold subparticle reconstruction for triplex Tf.
To obtain the structure of the triplex Tf located at the centre of the threefold subparticles, we expanded the final C3 threefold subparticle reconstruction-related data STAR file with C3 symmetry by using the ‘relion_particle_symmetry_expand’ command, generating a new data STAR file that contains three unique orientation entries for each threefold subparticle. The new data STAR file was then used to run a focused 3D classification without orientation search, by requesting three classes and applying a soft mask that covers only the triplex Tf protein area. We obtained three maps that are almost identical except for rotational differences of 120° and 240°, indicating that the three classes are duplicative and may contain duplicative particles. After removing duplicative particles, the particles belonging to one class were subjected to 3D auto-refine with C1 symmetry and post-processing, yielding a C1 threefold subparticle reconstruction at 4.1 Å. In this reconstruction, the quality of Tf density is similar to that of the SCP subunits nearby (Fig. 1g, and see also Supplementary Figs. 2 and 3 and Supplementary Video 7), indicating that we have successfully resolved the structure of triplex Tf.
C5 portal vertex subparticle, C12 portal subparticle and C5 whole-virus reconstructions.
To obtain the C5 portal subparticle reconstruction and the C12 portal vertex reconstruction, we used a similar data-processing strategy as descried previously19. Briefly, the subparticles used in the above-described fivefold subparticle reconstruction (see above section entitled “C5 fivefold, C3 threefold and C2 twofold subparticle reconstructions”) were used to run a RELION-focused 3D classification without orientation search by requesting five classes. One class (2,305 particles, ~10% subparticles) has portal vertex feature, so subparticles (2,305 particles) classified into this class were considered to be portal vertex subparticles; the other four classes (20,672 particles, ~90% subparticles) all have penton vertex features, so subparticles in these classes were chosen as penton vertex subparticles (see CATC-binding and CATC-absent penton vertex subparticle reconstructions). The portal subparticles were subjected to one round of RELION’s 3D auto-refine and post-processing, yielding a C5 portal subparticle reconstruction at 4.0 Å and its related data STAR file. We only had about 2,000 portal vertex subparticles, which presented difficulties in the initial steps to determine a C12 portal vertex reconstruction if using the same strategy as before19, so we included 4,648 and 2,085 portal vertex subparticles from HCMV and HSV-1, respectively, to assist our initial data processing. We expanded the fivefold symmetry of the combined portal vertex dataset, generating a new data STAR file that contains five unique orientation entries for each subparticle. The new data STAR file was then used to run a focused 3D classification step with C12 symmetry by requesting three classes. The class with clear portal features was chosen as a ‘good’ class and non-duplicative EBV subparticles (1,739 in total) in this ‘good’ class were retained (all subparticles belonging to HCMV and HSV-1 were discarded from this step onwards). The remaining EBV portal vertex subparticles were subjected to a final round of RELION 3D auto-refine with C12 symmetry and post-processing, yielding a C12 portal vertex reconstruction at 6.7 Å.
To obtain a C5 whole-virus reconstruction, we re-extracted 2,305 whole virus particles using RELION’s ‘relion_proprocess’ command with the C5 portal subparticles reconstruction-related data STAR file as the input, centring on (x = 0, y = 0, z = −366 pixels). Then, 1,959 particles were selected by removing the duplicative particles with the following criterion: if the distance of two subparticles images in the newly obtained particle data STAR file is shorter than 50 Å, these two subparticles were considered to be duplicates and only one was retained. The 1,959 non-duplicative particles were subjected to 3D auto-refine by applying C5 symmetry and post-processing, yielding a C5 whole-virus reconstruction at 7.8 Å.
CATC-binding and CATC-absent penton vertex subparticle reconstructions.
The penton vertex subparticles obtained were subjected to another 3D auto-refine and post-processing, yielding a C5 penton vertex subparticle reconstruction at 3.4 Å and its related data STAR file. To obtain the structure of the peri-penton CATC, we expanded the C5 penton vertex reconstruction data STAR file with the C5 symmetry to generate a new data STAR file (thus generating five duplicates for each penton vertex subparticle). We used a soft mask to mask just the CATC area, thus creating five sub-subparticle entries containing only the CATC region for each penton vertex subparticle. The new data STAR file was used to run one round of focused 3D classification by requesting three classes without orientation search (see Supplementary Fig. 2). About 20% of particles in one class containing CATC density were selected and subjected to 3D auto-refine and post-processed with a B-factor of −120 Å2, yielding a C1 CATC-binding penton vertex reconstruction at 4.0 Å. About 73.3% in another CATC-absent class with clear MCP features were selected and subjected to 3D auto-refine and post-processed with a B-factor of −120 Å2, yielding a C1 CATC-absent penton vertex reconstruction at 3.5 Å. The density of the CATC-absent penton vertex reconstruction (3.51 Å) is identical to the C5 penton vertex subparticle reconstruction (3.45 Å) obtained above.
To figure out how many CATCs each penton contains, we examined the five sub-subparticle entries from each penton and counted their frequency of appearance in the three resulting 3D classes. If only one of the five entries was classified into the CATC-binding class, then this penton vertex has only one CATC bound; if two entries were classified into this class, then this penton vertex is bound by two CATCs; likewise, if three, four or five entries were classified into this class, then this vertex is bounded by three, four or five CATCs, respectively. If none of the five entries was found in this CATC-binding class, then this vertex either contains no CATC or is simply a ‘bad’/damaged vertex. This statistical analysis result was summarized in the plot of Extended Data Fig. 8d.
Atomic model building.
Local resolution assessments indicate that density maps at the capsid shell region in our subparticle reconstructions have resolutions uniformly better than 3.5 Å (see Supplementary Fig. 3). These density maps have clear features of amino-acid side chains (see Fig. 1), enabling atomic modelling (see Fig. 2a and also Extended Data Figs. 1 and 2). The C2 twofold subparticle, C3 threefold subparticle and C5 penton vertex subparticle reconstructions described in the “C5 fivefold, C3 threefold and C2 twofold subparticle reconstructions“ section have sufficient resolution for us to model 47 unique protein subunits in the icosahedral asymmetrical unit with Coot52 by following the model-building workflow detailed previously53 and referencing the atomic models of KSHV capsid (PDB accession nos. 6B43 and 6PPD)11,18. The SWISS-MODEL server54 was used to generate homology models of penton MCP, hexon MCP, hexon SCP, Tri1, Tri2A, Tri2B and CATC subunits of EBV, using the corresponding subunits in the atomic models of KSHV as templates (see Supplementary Table 1). These subunits include 16 for MCPs, 16 for SCPs and 15 for triplexes (Ta, Tb, Tc, Td, Te, but not Tf). These initial models were docked into the three main-axis subparticle reconstructions that were sharpened with a B factor of −120 Å2. For the model of each subunit, the ‘Rigid Body Fit Zone’, ‘Rotate Translate’, ‘Real Space Refinement Zone’ and ‘Regularize Zone’ utilities in Coot52 were used to manually adjust the model to match the density map. For those regions that could not simply be adjusted to match the model, we rebuilt the model de novo by referencing secondary structures predicted with the Phyre2 server55 and using bulky amino-acid side chains as landmarks. This manual modelling step resulted in initial atomic models for an icosahedral asymmetrical unit.
We built a triplex Tf atomic model based on the C1 threefold subparticle reconstruction (see Fig. 1g and also Supplementary Figs. 2 and 3). The resolution for this reconstruction is 4.1 Å, good enough to facilitate atomic modelling by using the atomic model of triplex Td in the above asymmetrical unit model as the starting model.
Similarly, models for the EBV CATC components were built using a combination of homology modelling based on CATC of KSHV (PDB accession no. 6PPH) and manual modification based on cryo-EM density maps. EBV CATC contains one subunit of the BGLF1 gene-encoded CVC1, two subunits of the BVRF1 gene-encoded CVC2 (conformers CVC2-A and CVC2-B) and two subunits of the BPLF1 gene-encoded LTPs (conformers LTP-A and LTP-B). We have obtained two CATC-containing subparticle reconstructions: C1 CATC-binding penton vertex subparticle reconstruction at 4.0-Å resolution and C5 portal vertex subparticle reconstruction at 4.4-Å resolution (see Supplementary Figs. 2 and 3). These resolutions are not as high as those of the main-axis subparticle reconstructions described in the “C5 fivefold, C3 threefold and C2 twofold subparticle reconstructions” section. Nevertheless, in these two density maps, we can identify bumps corresponding to bulky amino-acid side chains to support homology-guided modelling. We obtained a homology model of each EBV CATC subunit using the corresponding CATC subunit of KSHV as template. These EBV homology models were docked into the CATC density region in the CATC-binding penton vertex subparticle map and the portal vertex subparticle reconstructions, which were sharpened with a B factor of −80 and −120 Å2, respectively. The models were manually adjusted, resulting in two CATC models: penton CATC and portal CATC.
To obtain an atomic model for the CATC-binding penton vertex, we used 16 subunits in the above atomic model of the icosahedral asymmetrical unit, including triplexes Ta and Tc, hexon MCP subunits of P1, P2, P5 and P6, penton MCPs and these five MCP-related SCPs. These subunits and the penton CATC model were fitted into the C1 CATC-binding penton vertex subparticle reconstruction and manually adjusted and, when necessary, modelled de novo with Coot, as described above at the beginning of this section.
To obtain an atomic model for the portal vertex, we used 14 subunits in the atomic model for the icosahedral asymmetrical unit, including triplexes Ta and Tc, hexon MCP subunits of P1, P2, P5 and P6, and four MCP-related SCPs. These subunits and five copies of the penton CATC model were fitted into the portal vertex subparticle reconstruction and manually adjusted and, when necessary, modelled de novo with Coot. The atomic model of the recombinant dodecameric portal PDB model (accession no. 6RVR) was rigid-body docked into our C12 portal vertex structure, and placed together into C5 portal vertex subparticle reconstruction by referencing portal location in HSV-1 (ref. 19) and KSHV18, resulting in a portal vertex model. This model contains four hexon MCPs (P1, P2, P5 and P6), four SCPs, triplexes Ta and Tc, one CATC and one dodecameric portal complex, totalling thirty-one subunits.
Model refinement and validation.
The manually built models were then iteratively improved through both Phenix real-space refinement56 and manual readjustment in Coot52. The 47 PDB files in each asymmetrical unit were divided into 3 groups: group 1 contained 16 subunits around the twofold axis, group 2 contained 15 subunits around the threefold axis and group 3 contained 16 subunits around the fivefold axis (see Supplementary Table 1). The atomic models in groups 1–3 were subjected to multiple iterations of refinement based on C2 twofold subparticle, C3 threefold subparticle and C5 penton vertex subparticle reconstructions, respectively. Each iteration consisted of two steps.
The first step is real-space refinement against subparticle reconstructions. Using group 1 as an example, we combined the 16 group 1 subunits with the atomic models of the 9 neighbouring protein subunits that make direct contact with group 1 subunits into a single concatenated PDB coordinate file. This PDB file was subjected to real-space refinement against the C2 twofold subparticle reconstruction using Phenix. We obtained a PDB coordinate file for the refined 16 group 1 subunits by discarding the neighbouring subunits in the resulting PDB coordinate file. Likewise, the coordinates for the 15 subunits belonging to group 2 and 16 subunits belonging to group 3 were combined with their corresponding 14 and 10 neighbouring protein subunits, and then refined against the C3 threefold and C5 penton vertex subparticle reconstructions, respectively. After discarding the neighbouring subunits from the resulting PDB files, we obtained a group 2 and a group 3 PDB coordinate file containing 15 and 16 refined subunits, respectively.
The second step is model evaluation and manual fixing. The above refined models were assessed by various programs and, when necessary, manually corrected. We used both the wwPDB validation web server57 and the built-in ‘validate’ utility in Coot to identify and locate outliers of the modelled amino-acid residues. For models in each group, wwPDB outputs a list of outliers based on bond length and angle, planarity and chirality. The quality of the modelled protein chains was evaluated based on the ‘Overall quality at a glance’ tables in the ‘Validation Reports’ section of the wwPDB website. If the values/percentile ranks were sufficiently low (side-chain outliers <4%, Ramachandran outliers <0.4%), we deemed the models to be well refined. If not, all outliers on the list were then manually fixed in Coot using refinement tools, including ‘Real Space Refinement Zone’, ‘Regularize Zone’, ‘Auto-Fit Rotamer’ and ‘Rotate Translate Zone/Chain/Molecule’ modules. When using these refinement tools, we turned on the following restraint options: Torsion, Planar Peptide, Trans Peptide and Ramachandran. Utilities such as a Ramachandran plot, geometry analysis, rotamer analysis and probe clashes in the pull-down validation menu of Coot provided various properties of the residues being refined. When modifying residues in an α-helix or a β-strand, the respective type of secondary structure was also restrained by turning on their respective ‘Mainchain Restraints’ located under ‘Refinement and Regularization Parameters’ in Coot. Occasionally, some refinement steps can cause residues to move away from the cryo-EM densities, leading to misfit. When this happened, we manually fixed such refinement-introduced anomalies so that all residues fitted the cryo-EM densities.
The above two steps were repeated until no further improvements were made and the models converged. The number of iterations to convergence varied for the three groups and was about 10. On achieving refinement convergence for all three groups, the three refined PDB coordinate files were combined to produce a final PDB coordinate file containing 47 protein subunits in the asymmetrical unit.
Similarly, the initial atomic models of triplex Tf, CATC-binding penton vertex and portal vertex were refined against the C1 threefold subparticle reconstruction, the CATC-binding penton vertex subparticle reconstruction and the C5 portal vertex subparticle reconstruction, respectively. However, no neighbours were used in the real-space refinement step for all these three models. In addition, when the portal vertex model was refined, we excluded the dodecameric portal complex.
The number of iterations for this refinement was seven, ten and eight for the model of triplex Tf, the CATC-binding penton vertex and the portal vertex, respectively. Figures were rendered in Chimera50 and ChimeraX58, and movies were recorded using ChimeraX58.
Extended Data
Extended Data Fig. 1 |. Density maps (gray) and atomic models (ribbon) of a P4 hexon MCP and a penton MCP segmented from the C2 2-fold and the C5 CATC-absent 5-fold sub-particle reconstructions.
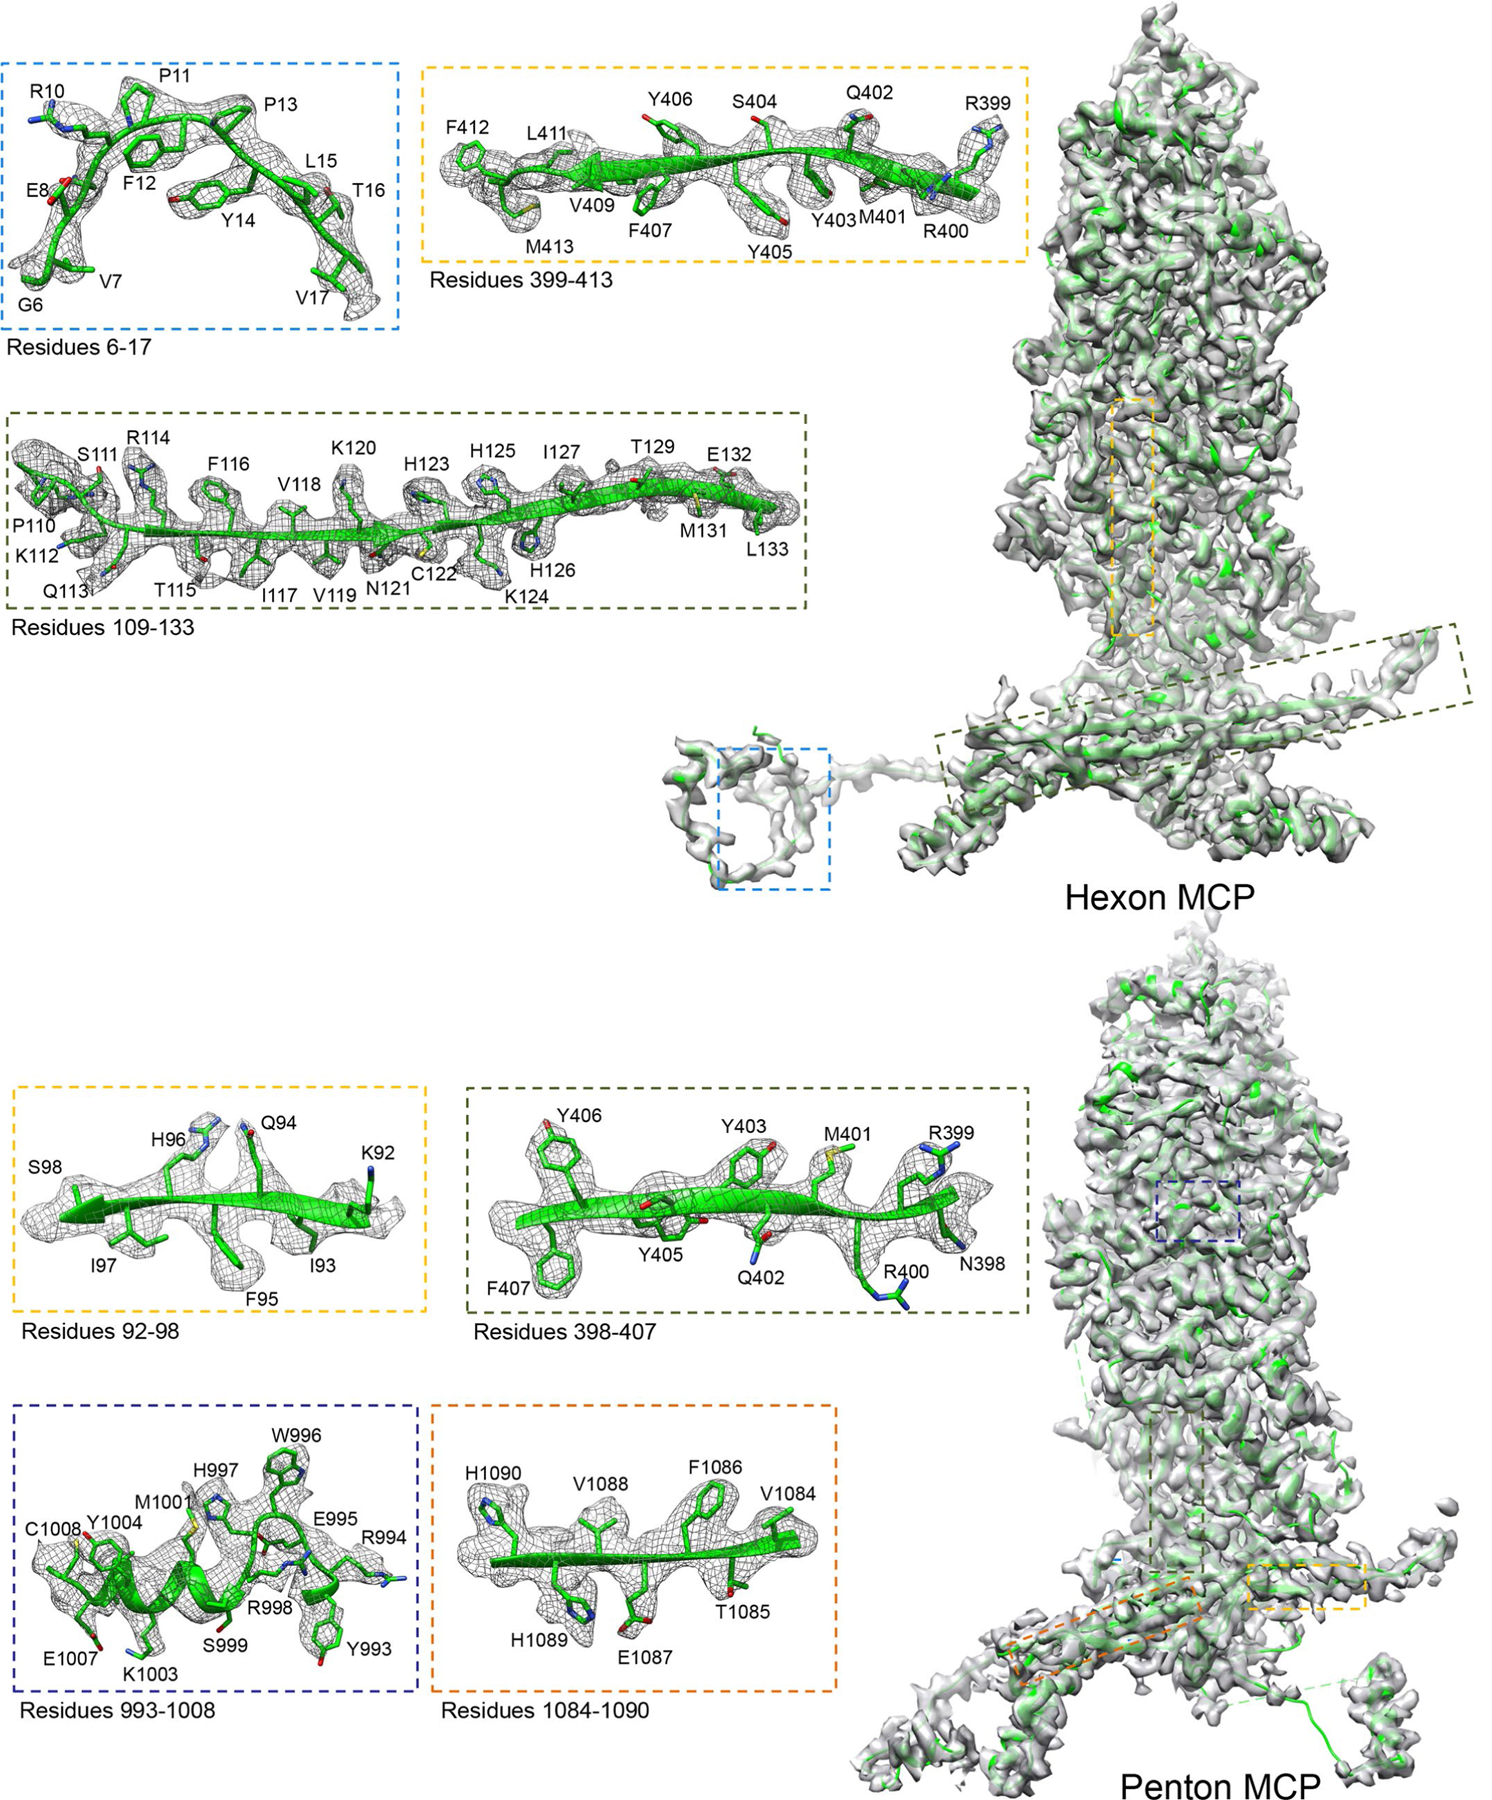
Boxed regions are enlarged in boxes with edges colored correspondingly, with density shown as gray mesh and atomic models as ribbon/sticks.
Extended Data Fig. 2 |. Density maps (gray) and atomic models (ribbon) of an SCP, a tri1, a tri2a, and a tri2B monomer.
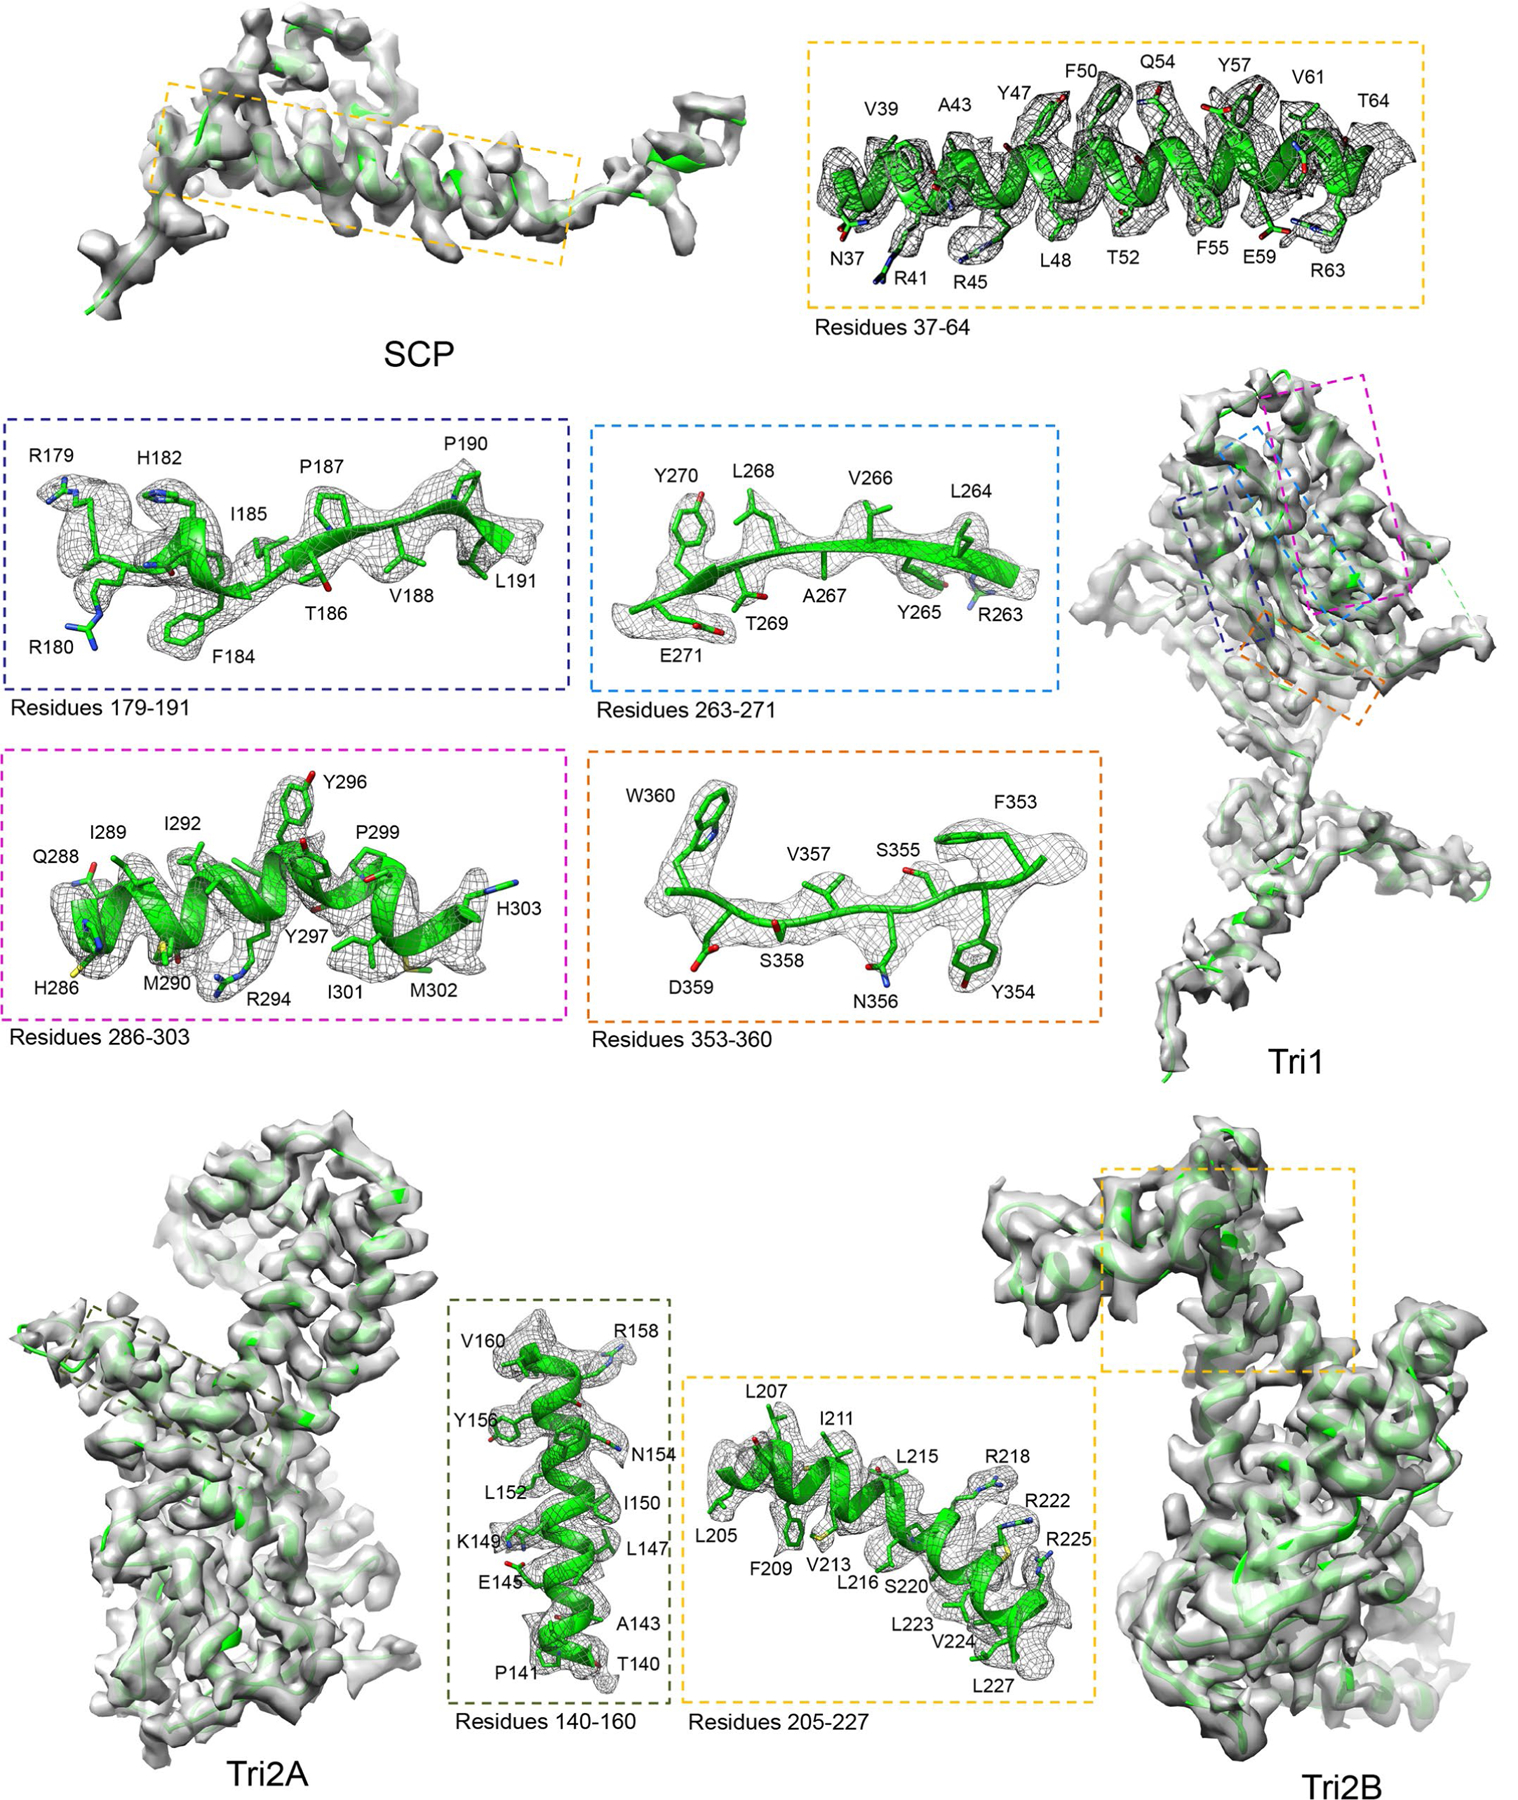
An SCP (for example, e1 SCP, was docked and segmented out from the 3.0-Å C6 hexon sub-particle reconstruction) is superposed with the atomic model (ribbon). Density maps (gray) of the Tri1, Tri2A, and Tri2B (segmented out from triplex Tb of the C3 3-fold sub-particle reconstruction) at 3.4 Å are superposed with their atomic models (ribbon). Boxed regions are enlarged in boxes with edges colored correspondingly, with density shown as gray mesh and atomic models as ribbon/sticks.
Extended Data Fig. 3 |. MCP interactions.
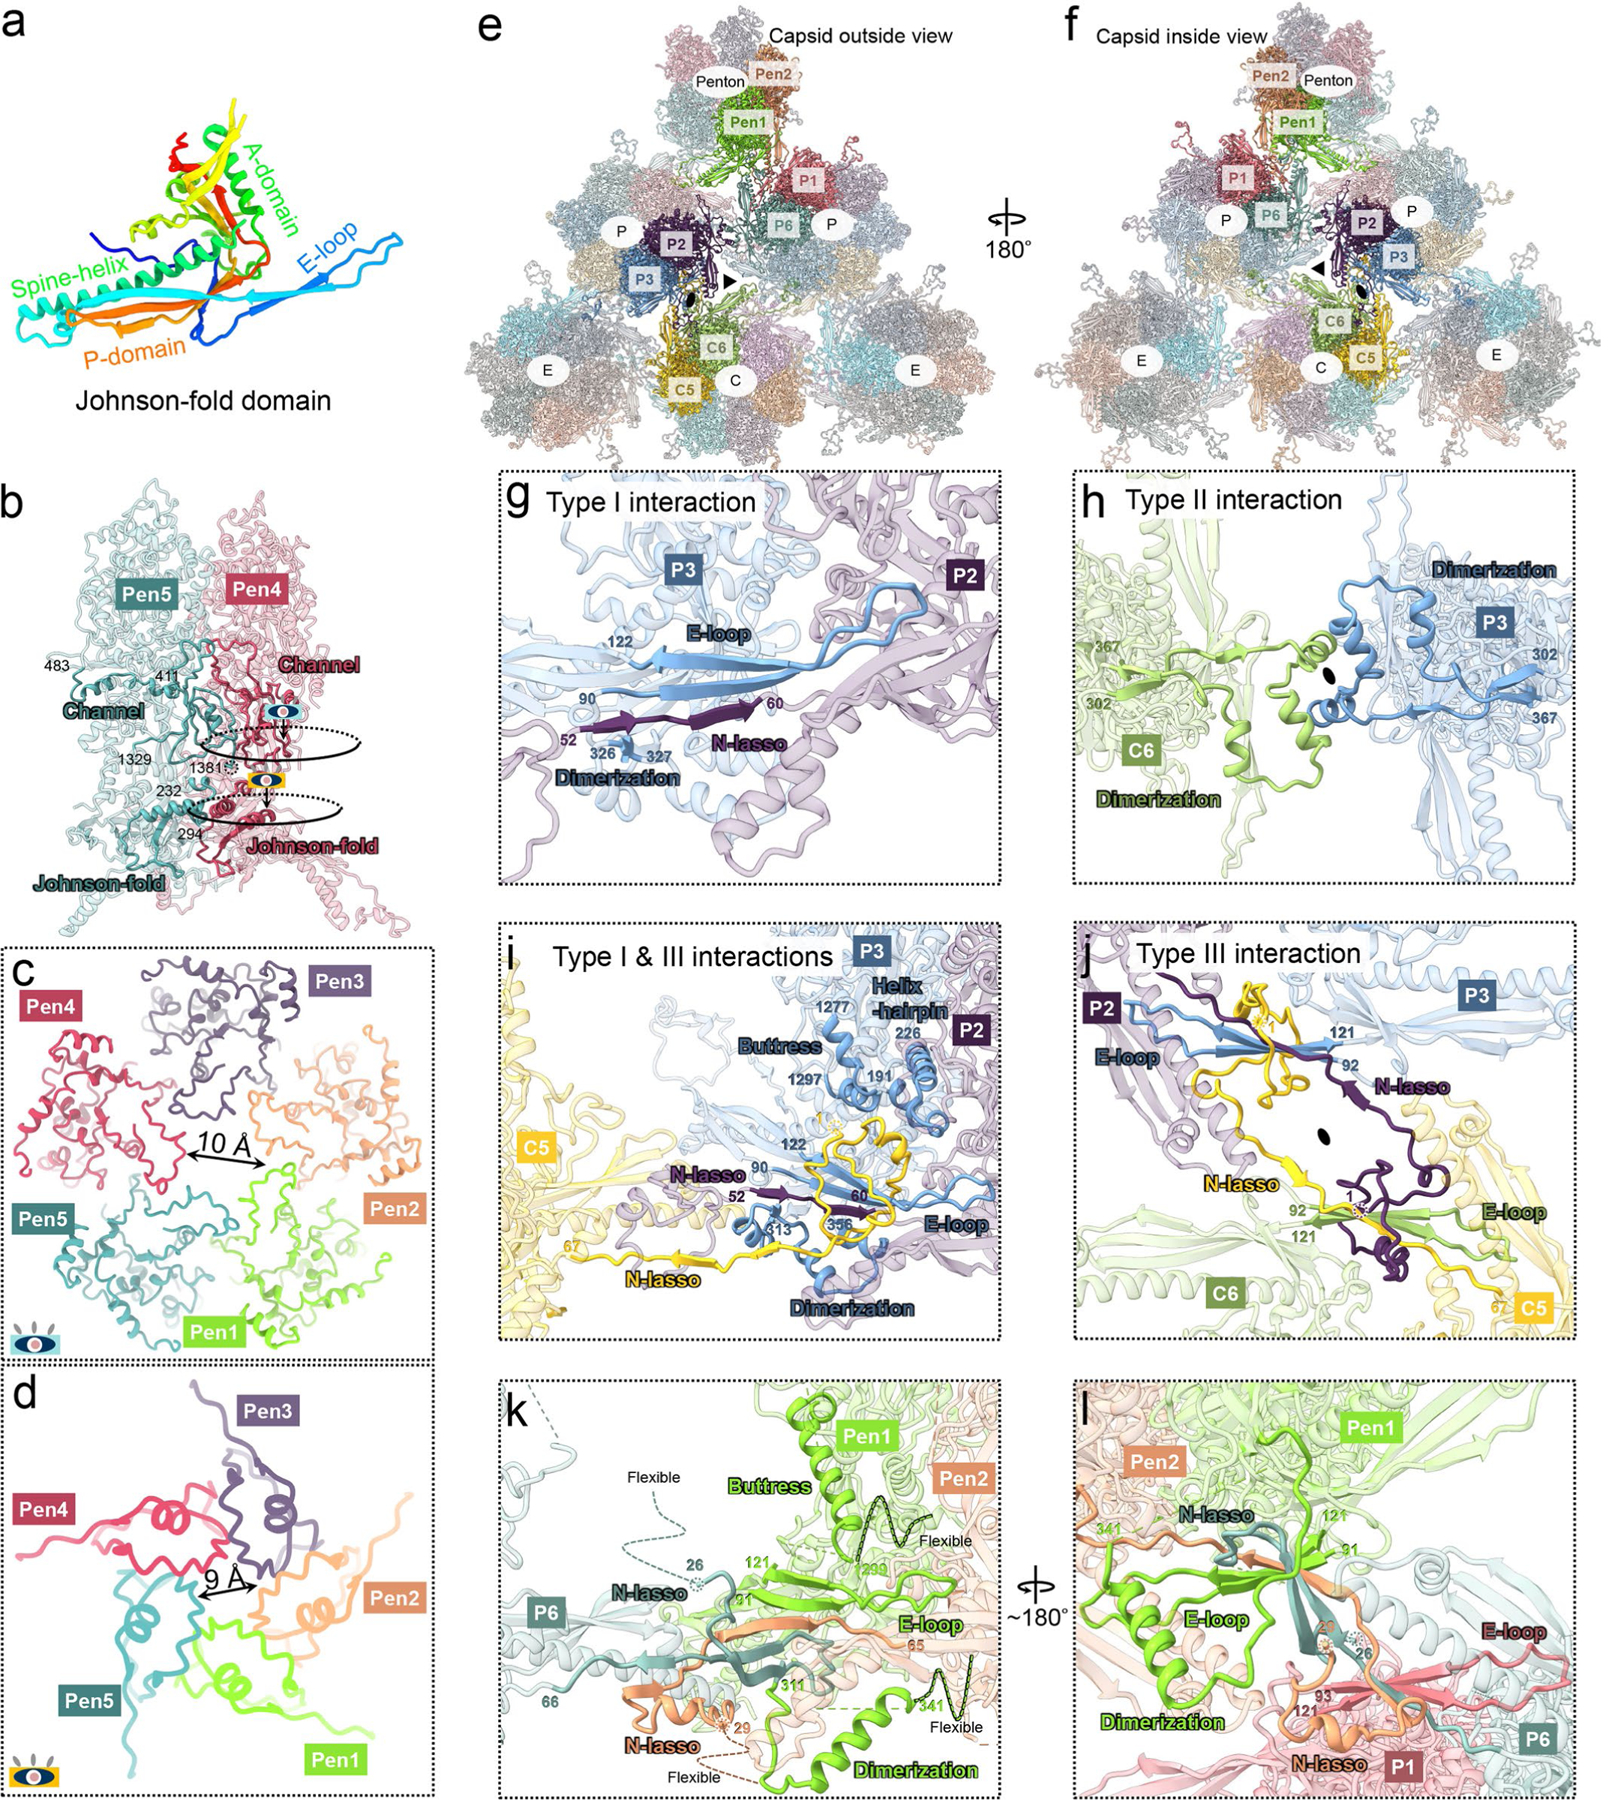
a, Atomic model of the Johnson-fold domain of MCP shown in rainbow-colored ribbon. b-d, MCP-MCP interactions in penton (b) and constrictions in penton channel (c, d). The colored eye symbols in (b) indicate the view directions in (c) and (d). e, f, Part of the MCP network viewed from outside (e) and inside (f) the capsid. g-j, Three types of network interactions among hexon MCPs. Type I interactions (g) are hydrogen bonds in an intra-capsomeric augmentation of β-strands from adjacent MCPs (for example, P2 and P3) in the same capsomer. Type II interactions h, inter-capsomeric interactions among a pair of MCPs (for example, P3 and C6), join two dimerization domains. Type III interactions i, j, characterized by the lassoing action of the N-lasso domain (for example, P3, C5, and C6) among three MCPs, build on and fortify type I interactions (j). k, l, Penton MCP interactions with hexon MCP subunits P1 and P6. Note that penton MCP lacks type II and III interactions and the N-lasso domain of P6 hexon MCP differs from those in other hexon MCPs.
Extended Data Fig. 4 |. Plasticity of MCP structures and MCP interactions with CATC.
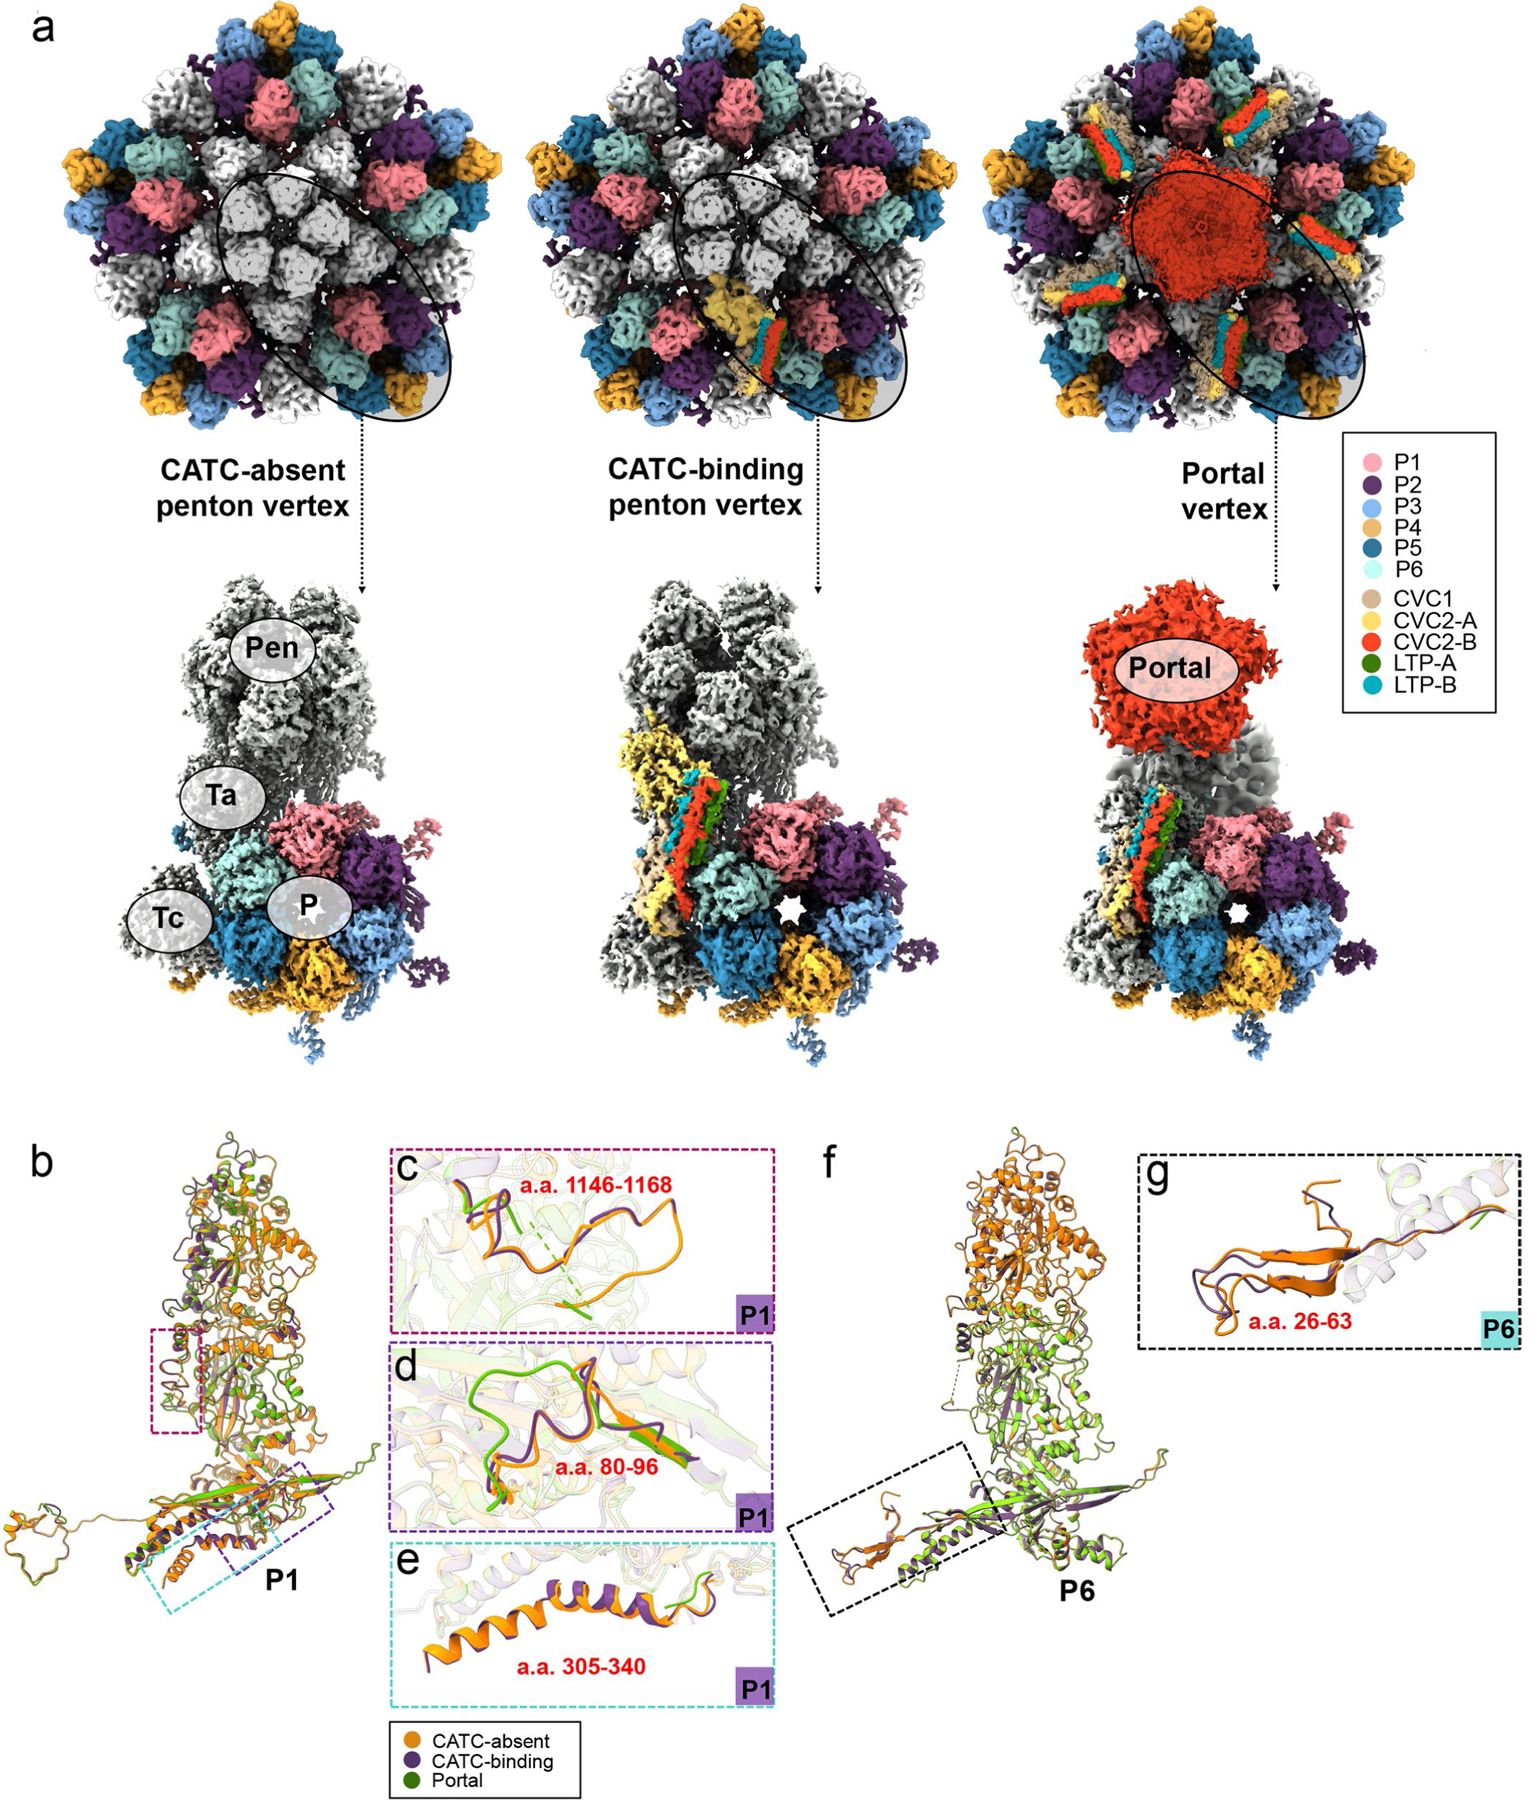
a-g, Plasticity of MCPs related to interactions with portal or CATC. Shown in (a) are the three types of vertices—CATC-absent penton vertex, CATC-binding penton vertex, and portal vertex—and how MCP subunits P1 and P6 are variably engaged in CATC or portal interactions. Corresponding MCPs were extracted from the three types of vertices and aligned. The superpositions of the three aligned P1 MCPs (b, with zoomed-in areas shown in c-e) and of the three aligned P6 MCPs f, with zoomed-in areas shown in g, show structural plasticity.
Extended Data Fig. 5 |. Triplex structures and plasticity of the tri1 N-anchor domains.
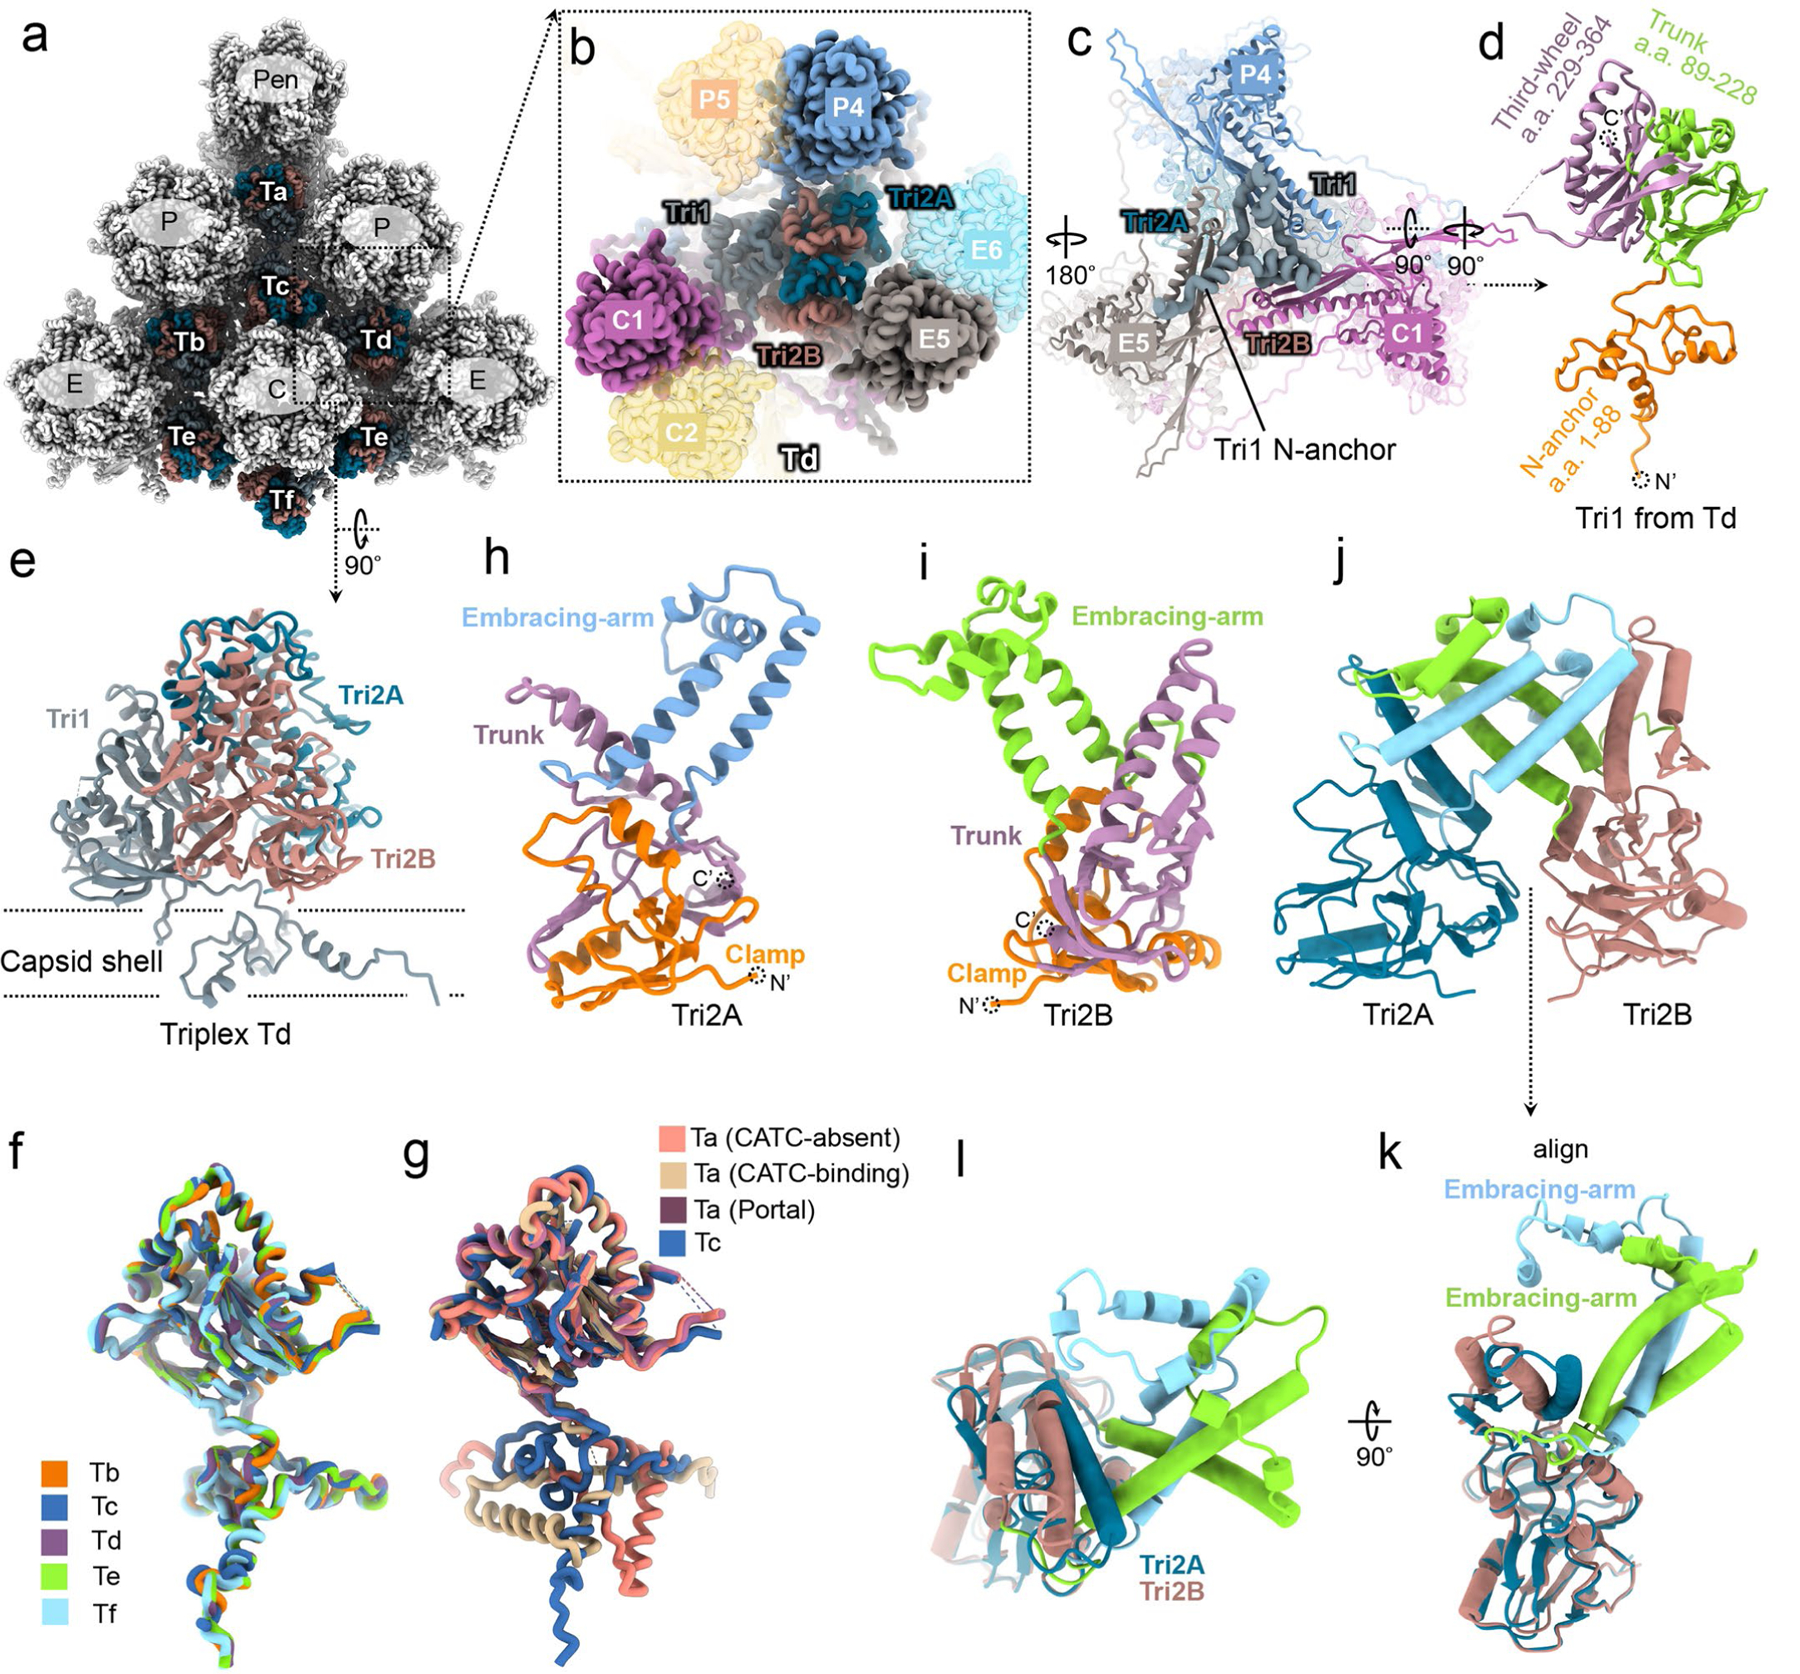
a, Distribution of triplexes Ta, Tb, Tc, Td, Te, and Tf among the penton and three types of hexons (C, e, and P). b-e, enlarged view of a triplex Td with three adjacent hexon MCP subunits (C1, e5, and P4) from outside (b) and inside (c). The inside view (c) shows that N-anchor domain of Td Tri1 lines along the three valleys of the MCP inner floor. Also shown are side views of Tri1 monomer (d) and triplex Td (e). f, Superpositions of Tri1 monomers from different triplexes except Ta. g, Superpositions of Tri1 monomers from triplex Tc, peri-penton triplex Ta before and after CATC binding, and peri-portal Ta. h-j, Tri2A (h) and Tri2B (i) shown as ribbons side by side, or together as pipe-and-plank (j). k, l, Two orthogonal views of the superposition of the aligned Tri2A and Tri2B, showing nearly identical clamp and trunk domains, but different embracing arm domain.
Extended Data Fig. 6 |. Interactions between triplexes and MCP subunits at three types of vertex sub-particle reconstructions.
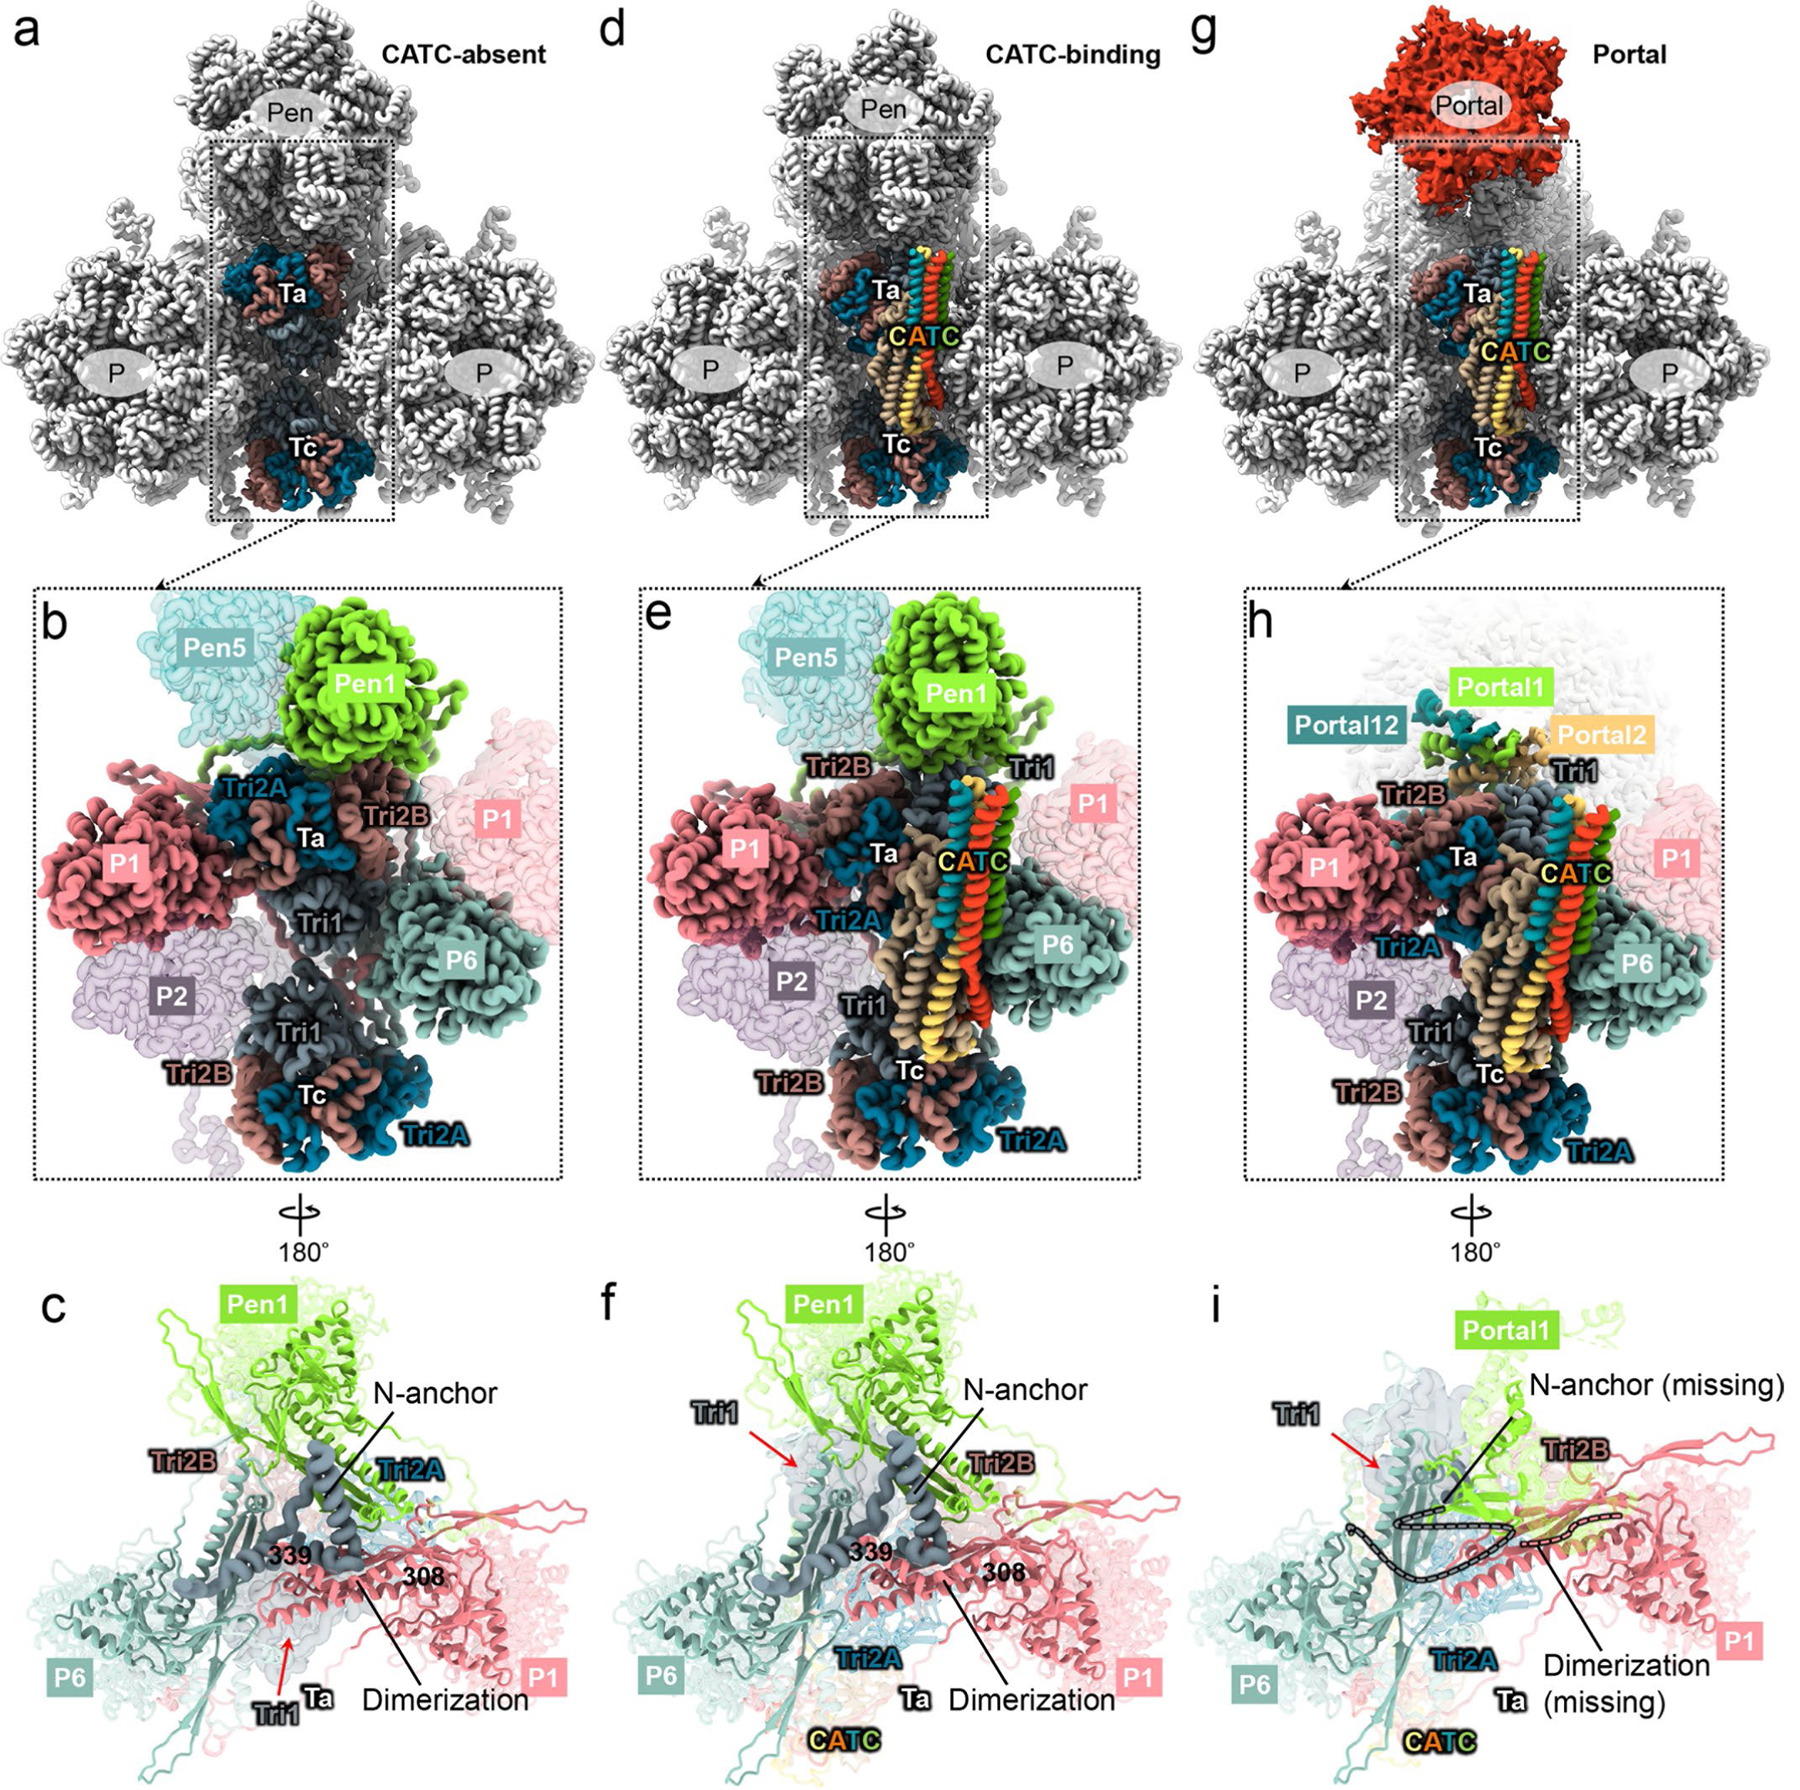
a–c, Interactions in CATC-absent penton vertex sub-particle reconstruction. d–f, Interactions in CATC-binding penton vertex sub-particle reconstruction. g–i, Interactions in portal vertex sub-particle reconstruction. Overviews (a, d, g) and close-up views (b, e, h) of the triplexe Ta and Tc region observed from outside the capsid. In the close-up views, the locations of the three Ta subunits (Tri1, Tri2A and Tri2B) are rotated counter-clockwise by 120° in both the CATC-binding penton vertex (e) and the portal vertex (h), as compared to those in the CATC-absent penton vertex (b). By contrast, there is no rotation in triplex Tc. From inside the capsid, the N-anchor domain of Tri1 is secured by the dimerization domain of P1 MCP in the penton vertex (c) and remains unrotated after CATC binding (f). Neither Tri1 N-anchor domain nor the P1 MCP dimerization domain is resolved (i), suggesting flexibility of both.
Extended Data Fig. 7 |. Fitting of the atomic model of the recombinant portal protein.
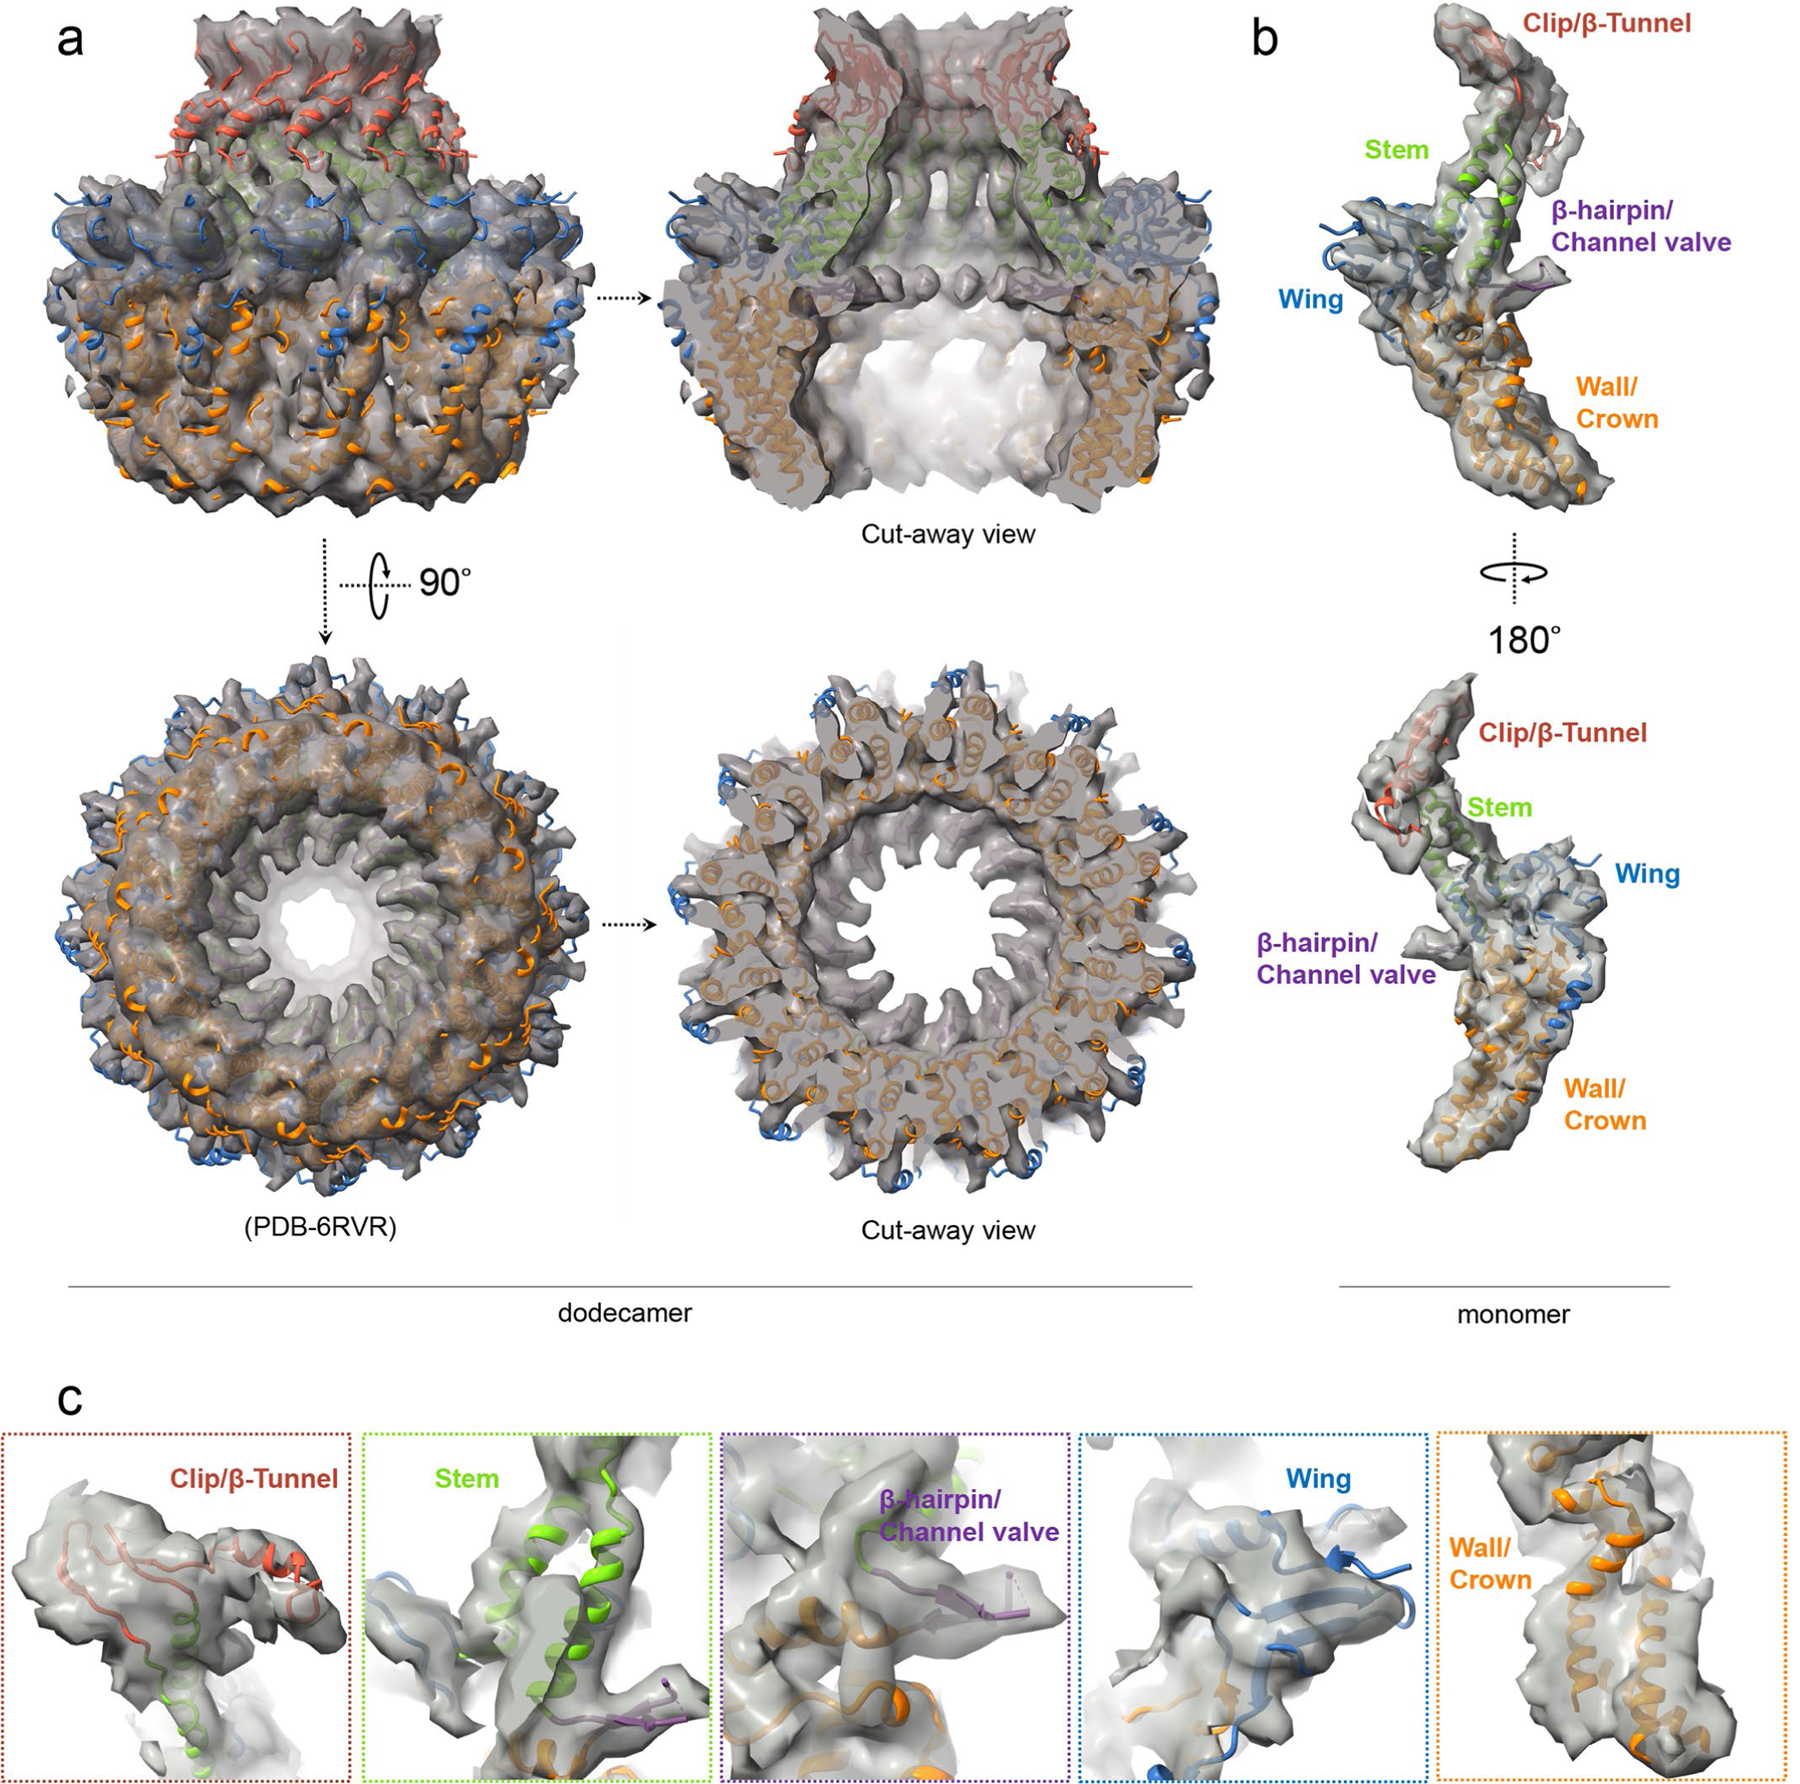
a, b, The recent published portal structure9 was docked in our in situ structure of the portal (semi-transparent gray) as either a dodecamer viewed in two orthogonal directions (a) or a monomer (b). c, Five insets show good fittings of five domains of the portal protein.
Extended Data Fig. 8 |. Plasticity of CATC attachment on the capsid.
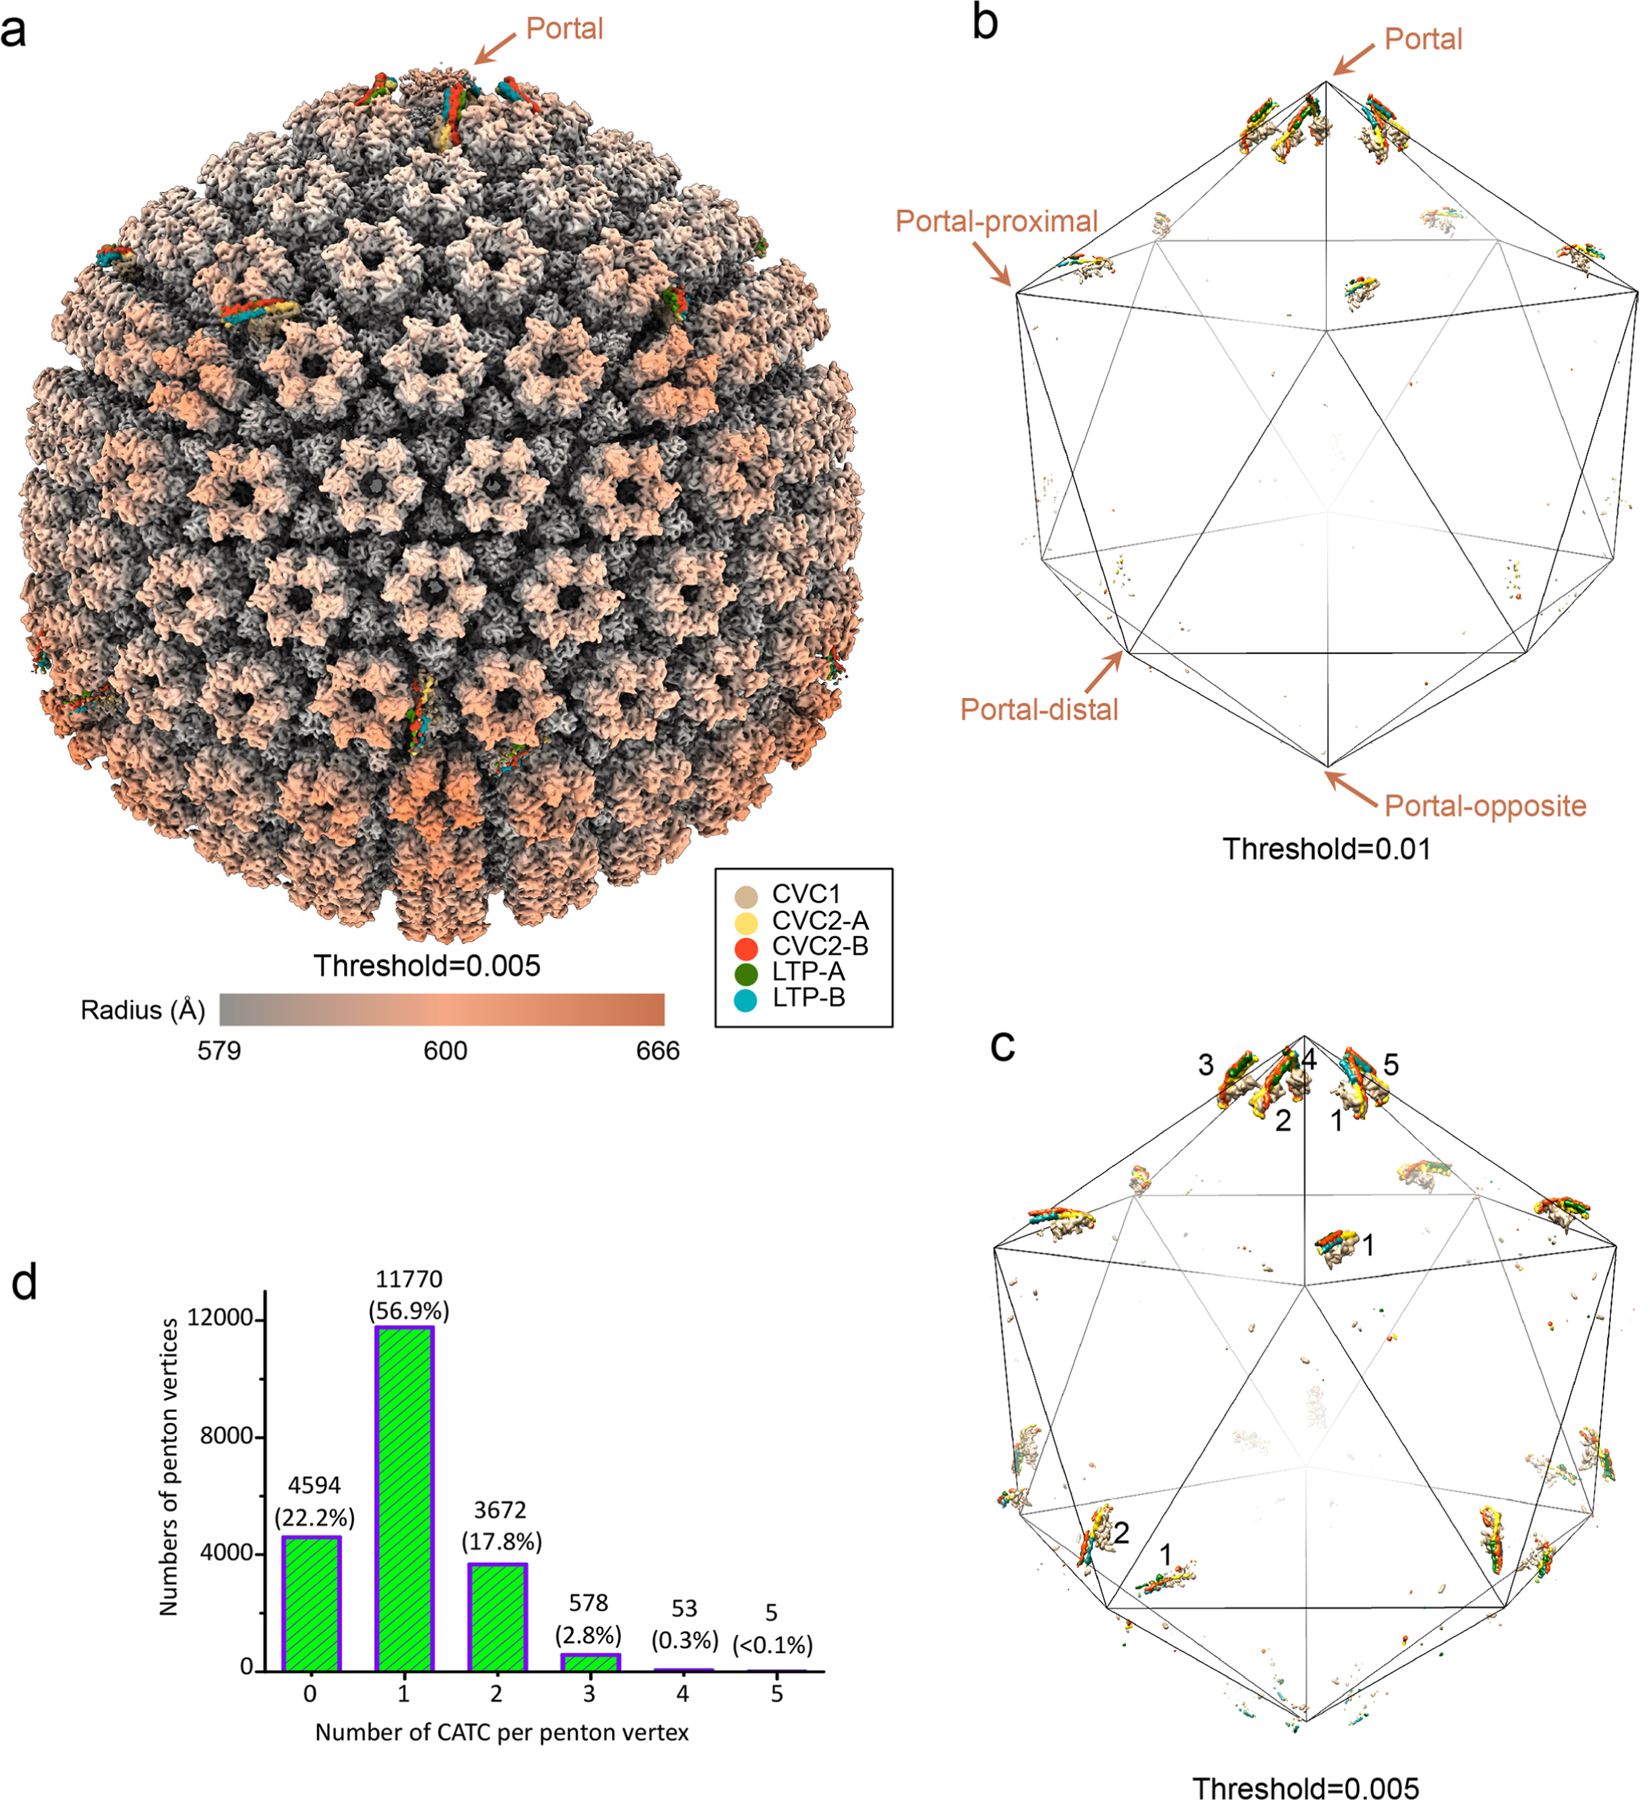
a, Global view of the C5 whole virus reconstruction showing consensus-patterned (that is, averaged) occupancy of CATCs at penton vertices. b, c, Same as in (a) but with only CATC densities (Gaussian-filtered [2σ], CVC2 head domains are removed for clarity) displayed at two progressively lower thresholds. The two thresholds (0.01 and 0.005) were chosen interactively in UCSF Chimera such that at the first threshold one CATC are visible at the portal-proximal positions (b), and at the second threshold two CATCs are visible at the portal-distal positions (c). d, Histogram of number of CATC per penton vertex.
Extended Data Fig. 9 |. Structural differences of CATCs in EBV and KSHV.
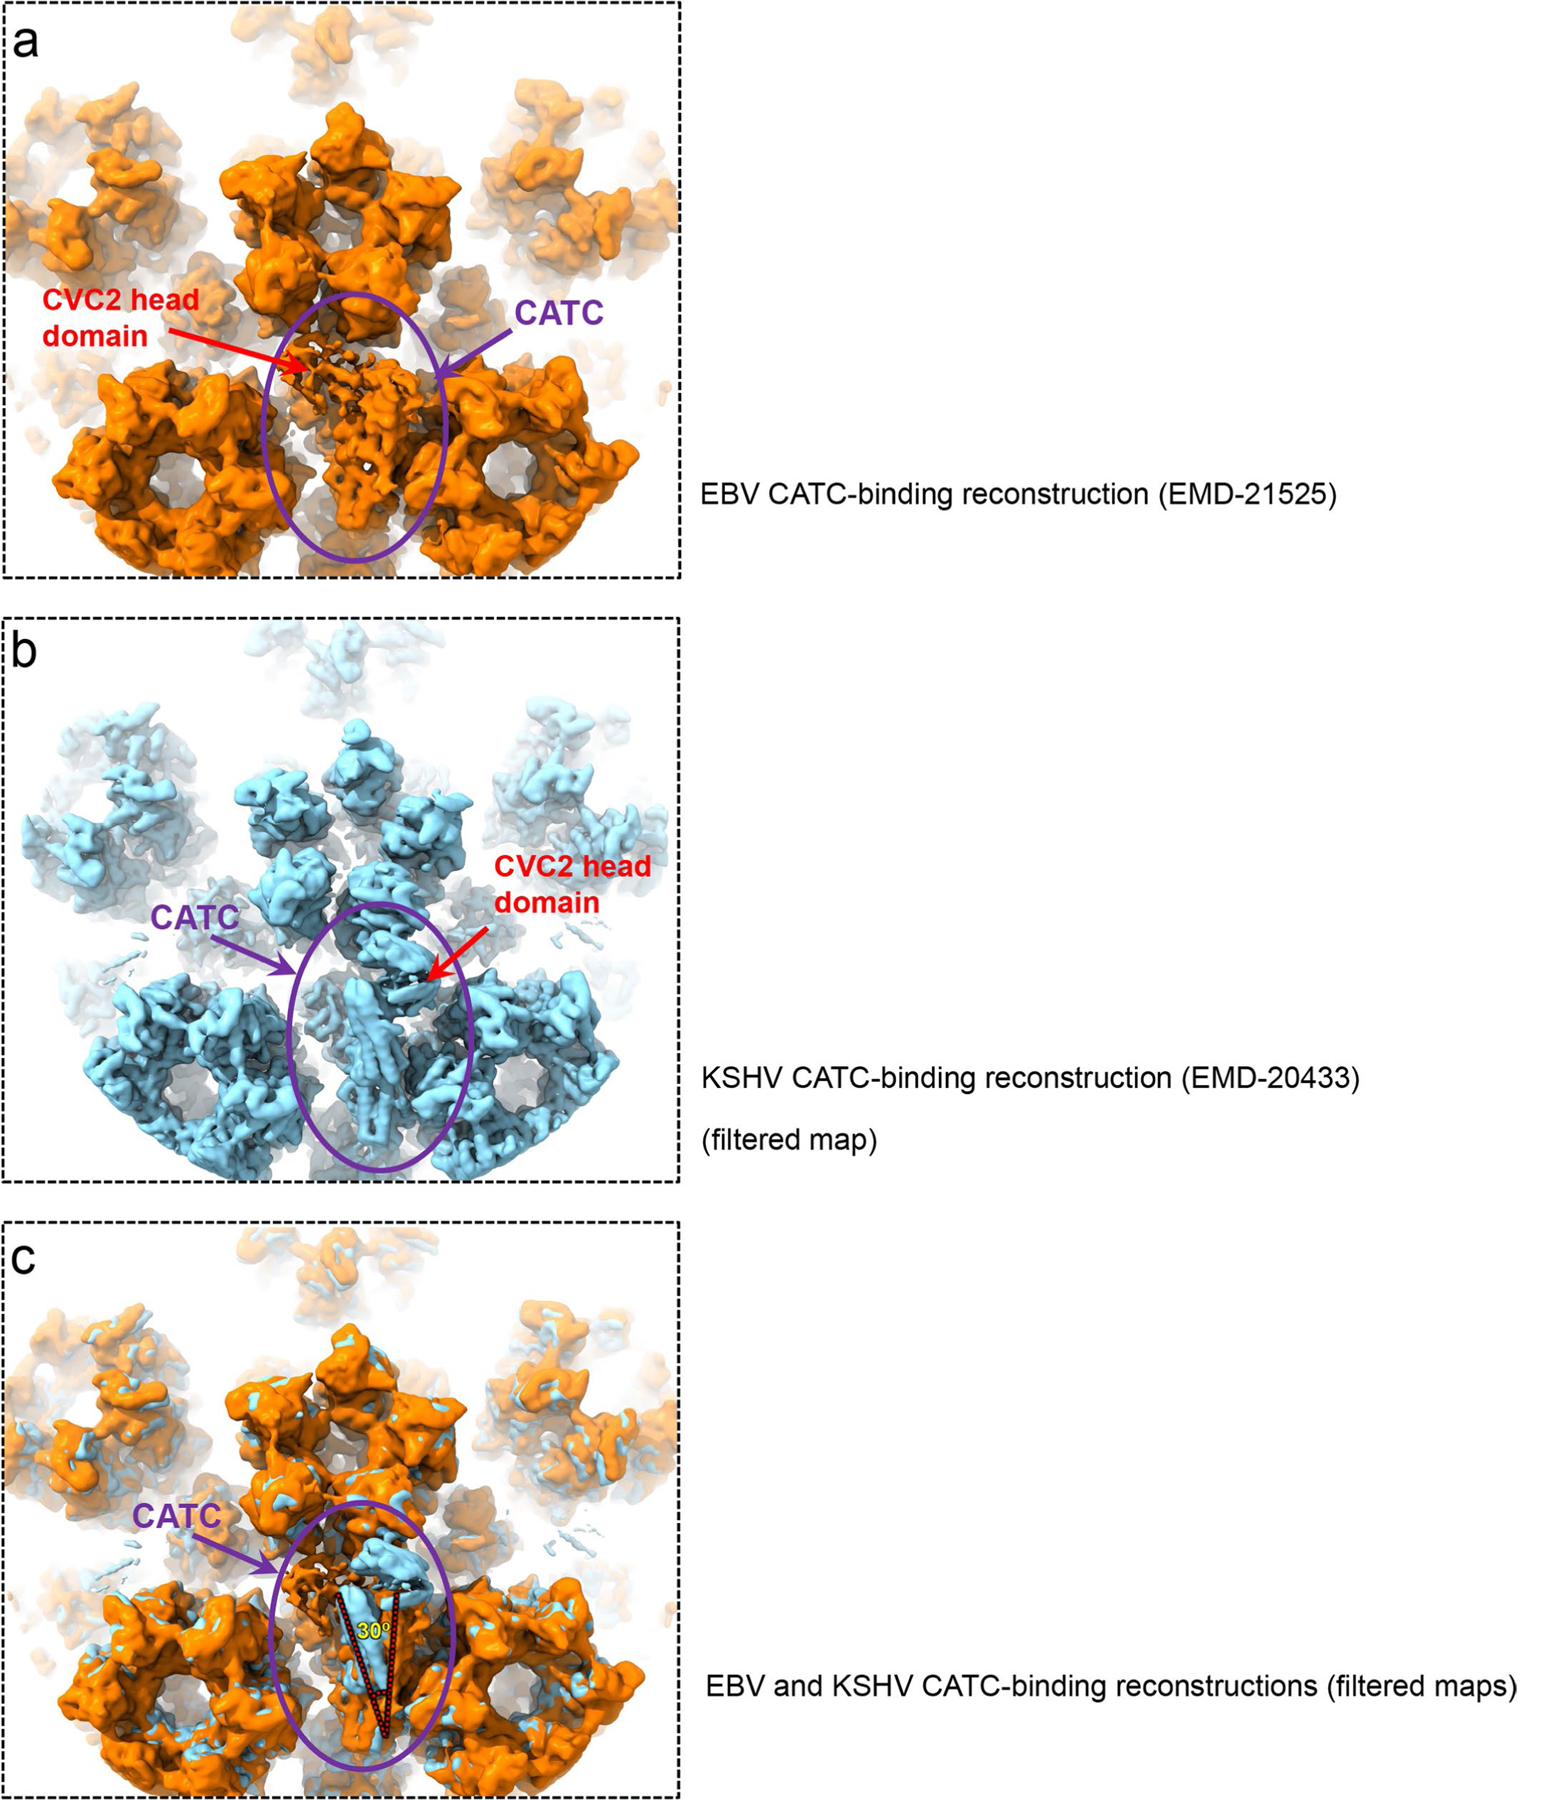
a-b, Low-pass filtered sub-particle reconstructions of eBV CATC-binding penton vertex (a) and of KSHV CATC-binding penton vertex (eMD-20433) (b). c, Superposition of (a) and (b) showing that eBV and KSHV CATC structures differ in two aspects: First, CVC2 head domain in KSHV heads right, as opposite to that in eBV, which heads left; Second, their helix bundles have an ~30º angle difference.
Extended Data Fig. 10 |. Interactions of SCP with hexon MCP.
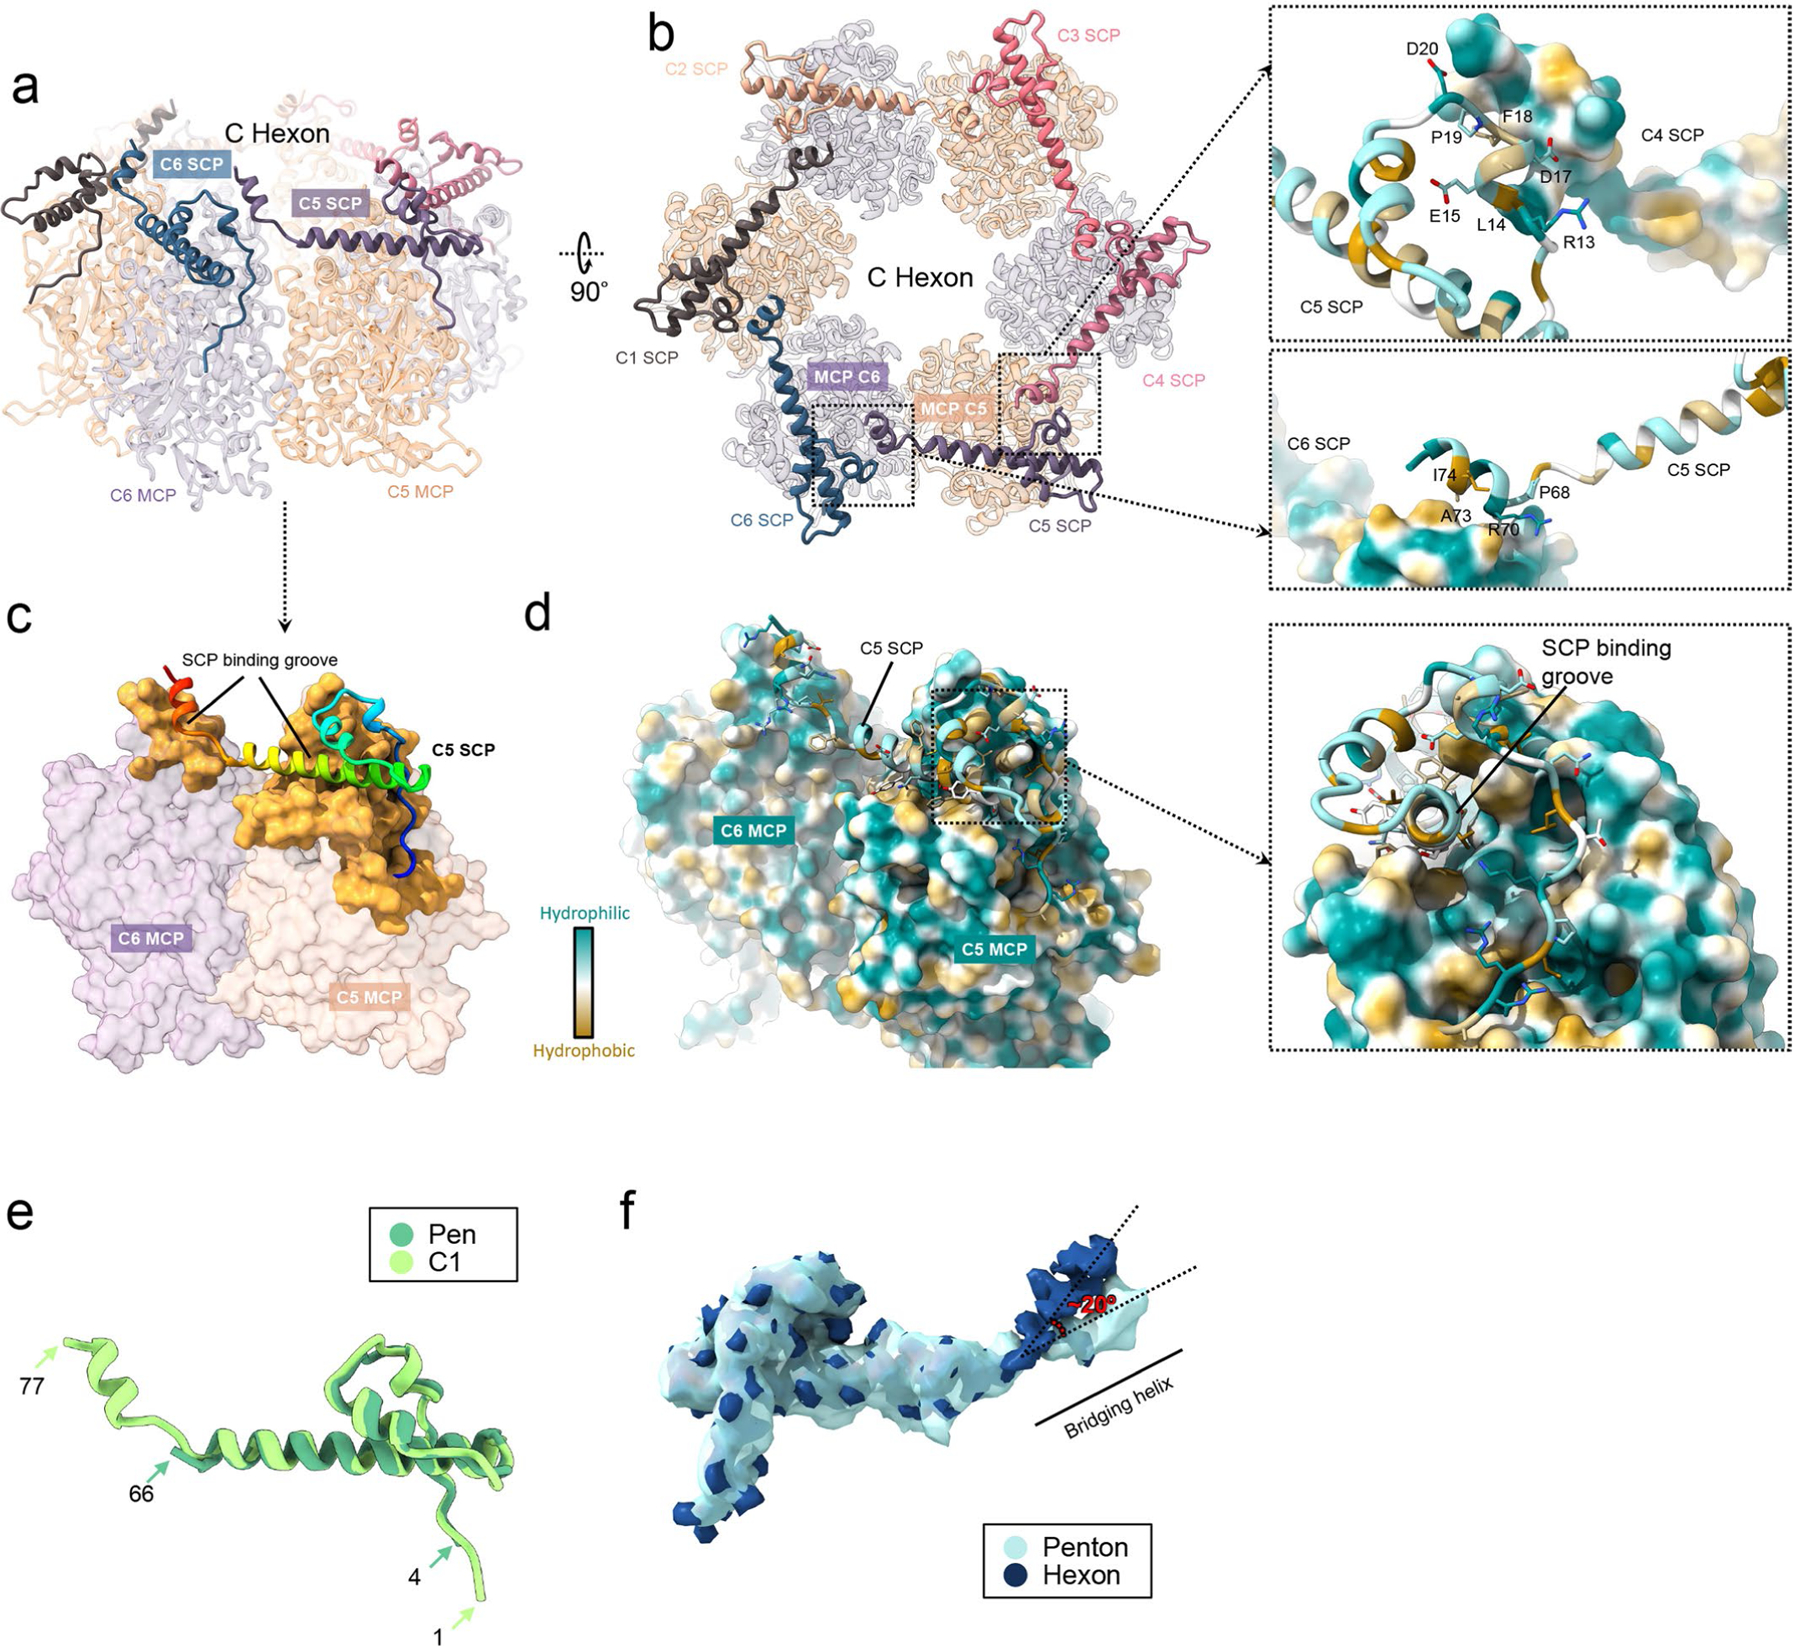
a, b SCP binds the upper domain of C hexon MCPs and six copies of SCP form a flower-shaped ring crowning and stabilize the hexon mainly by hydrophilic (right panels) interactions. c, d SCP interacts with two adjacent MCPs on their upper domains by inserting its stem helix into the SCP binding grooves (gold) (c) mainly by hydrophobic interactions (d). e, f Superposition of representative hexon SCP (for example, C1) and a penton SCP’s atomic models (e) and density maps (f) reveals the plasticity of SCP protein in eBV.
Supplementary Material
Acknowledgements
We thank I. Atanasov for technical support and Y.-T. Liu for discussion. This project has been supported in part by grants from the National Institutes of Health (grant nos. DE028583 to R.S. and Z.H.Z., and AI094386 and DE025567 to Z.H.Z.) and from the National Key R&D Program of China (grant nos. 2016YFA0400900 and 2017YFA0505300 to G.-Q.B.). We acknowledge the use of the resources at the Electron Imaging Center for Nanomachines supported in part by 1S10RR23057, 1S10OD018111 and 1U24GM116792, NSF (DBI-1338135 and DMR-1548924) and CNSI at UCLA.
Footnotes
Reporting summary. Further information on research design is available in the Nature Research Reporting Summary linked to this article.
Data availability
Ten cryo-EM maps generated during the present study have been deposited in the Electron Microscopy Data Bank (EMDB) and are available under accession nos. EMD-21504 (icosahedral capsid reconstruction), EMD-21505 (C5 whole virus reconstruction), EMD-21506 (C2 twofold subparticle reconstruction), EMD-21507 (C3 threefold subparticle reconstruction), EMD-21508 (C5 CATC-absent penton vertex subparticle reconstruction), EMD-21510 (C1 threefold subparticle reconstruction), EMD-21515 (C6 hexon subparticle reconstruction), EMD-21525 (C1 CATC-binding penton vertex subparticle reconstruction), EMD-21526 (C5 portal vertex subparticle reconstruction) and EMD-21527 (C12 portal subparticle reconstruction). Atomic models corresponding to EMD-21506, EMD-21507, EMD-21508 and EMD-21510 have been deposited in the PDB and are available under accession no. 6W19 (combined). Atomic models corresponding to EMD-21525 and EMD-21526 have been deposited in the PDB and are available under accession nos. 6W2D and 6W2E, respectively.
Competing interests
The authors declare no competing interests.
Additional information
Extended data is available for this paper at https://doi.org/10.1038/s41564-020-0758-1.
Supplementary information is available for this paper at https://doi.org/10.1038/s41564-020-0758-1.
Correspondence and requests for materials should be addressed to Z.H.Z.
Peer review information Peer reviewer reports are available.
Reprints and permissions information is available at www.nature.com/reprints.
Publisher’s note Springer Nature remains neutral with regard to jurisdictional claims in published maps and institutional affiliations.
References
- 1.Epstein MA, Achong BG & Barr YM Virus particles in cultured lymphoblasts from Burkitt’s lymphoma. Lancet 283, 702–703 (1964). [DOI] [PubMed] [Google Scholar]
- 2.Salahuddin SZ et al. Isolation of a new virus, HBLV, in patients with lymphoproliferative disorders. Science 234, 596–601 (1986). [DOI] [PubMed] [Google Scholar]
- 3.Andersson JP Clinical aspects on Epstein–Barr virus infection. Scand. J. Infect. Dis. Suppl 80, 94–104 (1991). [PubMed] [Google Scholar]
- 4.Fugl A & Andersen CL Epstein–Barr virus and its association with disease—a review of relevance to general practice. BMC Fam. Pract 20, 62 (2019). [DOI] [PMC free article] [PubMed] [Google Scholar]
- 5.Bochkarev A et al. Crystal structure of the DNA-binding domain of the Epstein–Barr virus origin-binding protein EBNA1. Cell 83, 39–46 (1995). [DOI] [PubMed] [Google Scholar]
- 6.Huang H et al. Structural basis underlying viral hijacking of a histone chaperone complex. Nat. Commun 7, 12707 (2016). [DOI] [PMC free article] [PubMed] [Google Scholar]
- 7.Mullen MM, Haan KM, Longnecker R & Jardetzky TS Structure of the Epstein–Barr virus gp42 protein bound to the MHC class II receptor HLA-DR1. Mol. Cell 9, 375–385 (2002). [DOI] [PubMed] [Google Scholar]
- 8.Matsuura H, Kirschner AN, Longnecker R & Jardetzky TS Crystal structure of the Epstein–Barr virus (EBV) glycoprotein H/glycoprotein L (gH/gL) complex. Proc. Natl Acad. Sci. USA 107, 22641–22646 (2010). [DOI] [PMC free article] [PubMed] [Google Scholar]
- 9.Machón C et al. Atomic structure of the Epstein–Barr virus portal. Nat. Commun 10, 3891 (2019). [DOI] [PMC free article] [PubMed] [Google Scholar]
- 10.Germi R et al. Three-dimensional structure of the Epstein–Barr virus capsid. J. Gen. Virol 93, 1769–1773 (2012). [DOI] [PubMed] [Google Scholar]
- 11.Dai X et al. Structure and mutagenesis reveal essential capsid protein interactions for KSHV replication. Nature 553, 521–525 (2018). [DOI] [PMC free article] [PubMed] [Google Scholar]
- 12.Dai X & Zhou ZH Structure of the herpes simplex virus 1 capsid with associated tegument protein complexes. Science 360, eaao7298 (2018). [DOI] [PMC free article] [PubMed] [Google Scholar]
- 13.Wang J et al. Structure of the herpes simplex virus type 2 C-capsid with capsid-vertex-specific component. Nat. Commun 9, 3668 (2018). [DOI] [PMC free article] [PubMed] [Google Scholar]
- 14.Yuan S et al. Cryo-EM structure of a herpesvirus capsid at 3.1 Å. Science 360, eaao7283 (2018). [DOI] [PubMed] [Google Scholar]
- 15.Yu X, Jih J, Jiang J & Zhou ZH Atomic structure of the human cytomegalovirus capsid with its securing tegument layer of pp150. Science 356, eaam6892 (2017). [DOI] [PMC free article] [PubMed] [Google Scholar]
- 16.Liu W et al. Atomic structures and deletion mutant reveal different capsid-binding patterns and functional significance of tegument protein pp150 in murine and human cytomegaloviruses with implications for therapeutic development. PLoS Pathog 15, e1007615 (2019). [DOI] [PMC free article] [PubMed] [Google Scholar]
- 17.Zhang Y et al. Atomic structure of the human herpesvirus 6B capsid and capsid-associated tegument complexes. Nat. Commun 10, 5346 (2019). [DOI] [PMC free article] [PubMed] [Google Scholar]
- 18.Gong D et al. DNA-packing portal and capsid-associated tegument complexes in the tumor herpesvirus KSHV. Cell 178, 1329–1343 (2019). [DOI] [PMC free article] [PubMed] [Google Scholar]
- 19.Liu YT, Jih J, Dai X, Bi GQ & Zhou ZH Cryo-EM structures of herpes simplex virus type 1 portal vertex and packaged genome. Nature 570, 257–261 (2019). [DOI] [PMC free article] [PubMed] [Google Scholar]
- 20.Fokine A et al. Structural and functional similarities between the capsid proteins of bacteriophages T4 and HK97 point to a common ancestry. Proc. Natl Acad. Sci. USA 102, 7163–7168 (2005). [DOI] [PMC free article] [PubMed] [Google Scholar]
- 21.Zhang X et al. A new topology of the HK97-like fold revealed in Bordetella bacteriophage by cryoEM at 3.5 Å resolution. eLife 2, e01299 (2013). [DOI] [PMC free article] [PubMed] [Google Scholar]
- 22.Scrima N et al. Insights into herpesvirus tegument organization from structural analyses of the 970 central residues of HSV-1 UL36 protein. J. Biol. Chem 290, 8820–8833 (2015). [DOI] [PMC free article] [PubMed] [Google Scholar]
- 23.Wang W et al. Atomic structures of varicella-zoster virus capsids. Nat. Microbiol (in the press). [DOI] [PMC free article] [PubMed] [Google Scholar]
- 24.Liu Y-T et al. A pUL25 dimer interfaces the pseudorabies virus capsid and tegument. J. Gen. Virol 98, 2837–2849 (2017). [DOI] [PMC free article] [PubMed] [Google Scholar]
- 25.McElwee M, Vijayakrishnan S, Rixon F & Bhella D Structure of the herpes simplex virus portal-vertex. PLoS Biol 16, e2006191 (2018). [DOI] [PMC free article] [PubMed] [Google Scholar]
- 26.Crick FHC & Watson JD Structure of small viruses. Nature 177, 473–475 (1956). [DOI] [PubMed] [Google Scholar]
- 27.Caspar DL & Klug A Physical principles in the construction of regular viruses. Cold Spring Harb. Symp. Quant. Biol 27, 1–24 (1962). [DOI] [PubMed] [Google Scholar]
- 28.Harrison SC, Olson AJ, Schutt CE, Winkler FK & Bricogne G Tomato bushy stunt virus at 2.9 Å resolution. Nature 276, 368–373 (1978). [DOI] [PubMed] [Google Scholar]
- 29.Abad-Zapatero C et al. Structure of southern bean mosaic virus at 2.8 Å resolution. Nature 286, 33–39 (1980). [DOI] [PubMed] [Google Scholar]
- 30.Liddington RC et al. Structure of simian virus 40 at 3.8-Å resolution. Nature 354, 278–284 (1991). [DOI] [PubMed] [Google Scholar]
- 31.Vogel RH, Provencher SW, von Bonsdorff CH, Adrian M & Dubochet J Envelope structure of Semliki Forest virus reconstructed from cryo-electron micrographs. Nature 320, 533–535 (1986). [DOI] [PubMed] [Google Scholar]
- 32.Liu X & Cohen JI Epstein–Barr virus (EBV) tegument protein BGLF2 promotes EBV reactivation through activation of the p38 mitogen-activated protein kinase. J. Virol 90, 1129–1138 (2016). [DOI] [PMC free article] [PubMed] [Google Scholar]
- 33.Tsai K, Thikmyanova N, Wojcechowskyj JA, Delecluse HJ & Lieberman PM EBV tegument protein BNRF1 disrupts DAXX-ATRX to activate viral early gene transcription. PLoS Pathog 7, e1002376 (2011). [DOI] [PMC free article] [PubMed] [Google Scholar]
- 34.Shumilov A et al. Epstein–Barr virus particles induce centrosome amplification and chromosomal instability. Nat. Commun 8, 14257 (2017). [DOI] [PMC free article] [PubMed] [Google Scholar]
- 35.Whitehurst CB et al. Knockout of Epstein–Barr virus BPLF1 retards B-cell transformation and lymphoma formation in humanized mice. mBio 6, e01574–15 (2015). [DOI] [PMC free article] [PubMed] [Google Scholar]
- 36.Rozen R, Sathish N, Li Y & Yuan Y Virion-wide protein interactions of Kaposi’s sarcoma-associated herpesvirus. J. Virol 82, 4742–4750 (2008). [DOI] [PMC free article] [PubMed] [Google Scholar]
- 37.Crowther RA, Amos LA, Finch JT, De Rosier DJ & Klug A Three dimensional reconstructions of spherical viruses by fourier synthesis from electron micrographs. Nature 226, 421–425 (1970). [DOI] [PubMed] [Google Scholar]
- 38.Weibel RE et al. Live attenuated varicella virus vaccine. Efficacy trial in healthy children. N. Engl. J. Med 310, 1409–1415 (1984). [DOI] [PubMed] [Google Scholar]
- 39.Gong D et al. Virus-Like Vesicles of Kaposi’s Sarcoma-Associated Herpesvirus Activate Lytic Replication by Triggering Differentiation Signaling. J. Virol 91, 17 (2017). [DOI] [PMC free article] [PubMed] [Google Scholar]
- 40.Mastronarde DN Automated electron microscope tomography using robust prediction of specimen movements. J. Struct. Biol 152, 36–51 (2005). [DOI] [PubMed] [Google Scholar]
- 41.Jin L et al. Applications of direct detection device in transmission electron microscopy. J. Struct. Biol 161, 352–358 (2008). [DOI] [PMC free article] [PubMed] [Google Scholar]
- 42.Yonekura K, Braunfeld MB, Maki-Yonekura S & Agard DA Electron energy filtering significantly improves amplitude contrast of frozen-hydrated protein at 300 kV. J. Struct. Biol 156, 524–536 (2006). [DOI] [PubMed] [Google Scholar]
- 43.Zheng SQ et al. MotionCor2: anisotropic correction of beam-induced motion for improved cryo-electron microscopy. Nat. Methods 14, 331–332 (2017). [DOI] [PMC free article] [PubMed] [Google Scholar]
- 44.Rohou A & Grigorieff N CTFFIND4: fast and accurate defocus estimation from electron micrographs. J. Struct. Biol 192, 216–221 (2015). [DOI] [PMC free article] [PubMed] [Google Scholar]
- 45.Scheres SHW RELION: implementation of a Bayesian approach to cryo-EM structure determination. J. Struct. Biol 180, 519–530 (2012). [DOI] [PMC free article] [PubMed] [Google Scholar]
- 46.Ilca SL et al. Localized reconstruction of subunits from electron cryomicroscopy images of macromolecular complexes. Nat. Commun 6, 8843 (2015). [DOI] [PMC free article] [PubMed] [Google Scholar]
- 47.Cui Y, Zhang Y, Zhou K, Sun J & Zhou ZH Conservative transcription in three steps visualized in a double-stranded RNA virus. Nat. Struct. Mol. Biol 26, 1023–1034 (2019). [DOI] [PMC free article] [PubMed] [Google Scholar]
- 48.DeRosier DJ Correction of high-resolution data for curvature of the Ewald sphere. Ultramicroscopy 81, 83–98 (2000). [DOI] [PubMed] [Google Scholar]
- 49.Zhang X & Zhou ZH Limiting factors in atomic resolution cryo electron microscopy: no simple tricks. J. Struct. Biol 175, 253–263 (2011). [DOI] [PMC free article] [PubMed] [Google Scholar]
- 50.Pettersen EF et al. UCSF chimera—a visualization system for exploratory research and analysis. J. Comput. Chem 25, 1605–1612 (2004). [DOI] [PubMed] [Google Scholar]
- 51.Rosenthal PB & Henderson R Optimal determination of particle orientation, absolute hand, and contrast loss in single-particle electron cryomicroscopy. J. Mol. Biol 333, 721–745 (2003). [DOI] [PubMed] [Google Scholar]
- 52.Emsley P & Cowtan K Coot: model-building tools for molecular graphics. Acta Crystallogr. D Biol. Crystallogr 60, 2126–2132 (2004). [DOI] [PubMed] [Google Scholar]
- 53.Yu I et al. Building atomic models based on near atomic resolution cryoEM maps with existing tools. J. Struct. Biol 204, 313–318 (2018). [DOI] [PMC free article] [PubMed] [Google Scholar]
- 54.Schwede T, Kopp JR, Guex N & Peitsch MC SWISS-MODEL: an automated protein homology-modeling server. Nucleic Acids Res 31, 3381–3385 (2003). [DOI] [PMC free article] [PubMed] [Google Scholar]
- 55.Kelley LA, Mezulis S, Yates CM, Wass MN & Sternberg MJ The Phyre2 web portal for protein modeling, prediction and analysis. Nat. Protoc 10, 845–858 (2015). [DOI] [PMC free article] [PubMed] [Google Scholar]
- 56.Afonine PV et al. Towards automated crystallographic structure refinement with phenix.refine. Acta Crystallogr. D Biol. Crystallogr 68, 352–367 (2012). [DOI] [PMC free article] [PubMed] [Google Scholar]
- 57.Berman H, Henrick K & Nakamura H Announcing the worldwide protein data bank. Nat. Struct. Biol 10, 980 (2003). [DOI] [PubMed] [Google Scholar]
- 58.Goddard TD et al. UCSF ChimeraX: meeting modern challenges in visualization and analysis. Protein Sci. Publ. Protein Soc 27, 14–25 (2018). [DOI] [PMC free article] [PubMed] [Google Scholar]
Associated Data
This section collects any data citations, data availability statements, or supplementary materials included in this article.


