

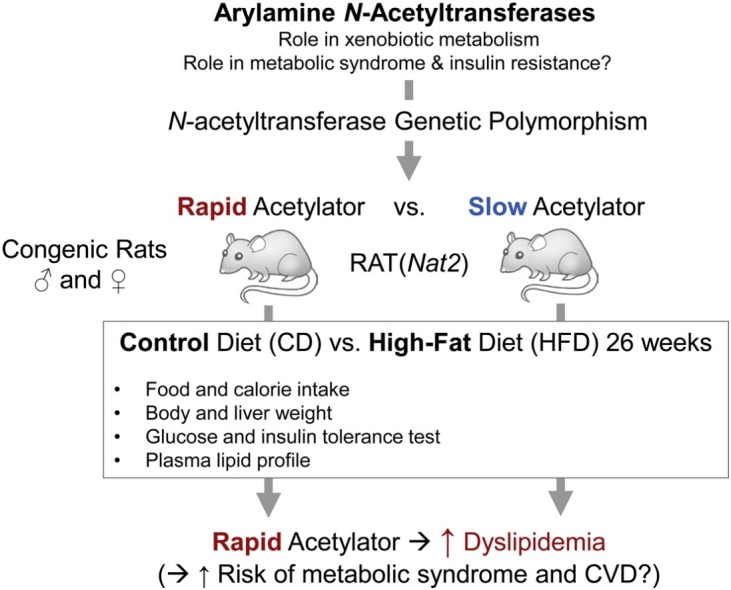
Graphical abstract
Abbreviations: AUC, area under the curve; CD, control diet; GWAS, genome-wide association study; HFD, high-fat diet; invAUC, inverse area under the curve; ITT, insulin tolerance test; NAT, arylamine N-acetyltransferase; OGTT, oral glucose tolerance test; TC, total cholesterol
Keywords: Arylamine N-acetyltransferase, obesity, insulin resistance, metabolic syndrome, diet, dyslipidemia
Highlights
-
•
Interactions between sex, diet & Nat2 were investigated in rats congenic for Nat2.
-
•
Rapid Nat2 congenic rats developed greater dyslipidemia.
-
•
Total cholesterol (TC)-to-HDL ratios were significantly higher in rapid Nat2 rats.
-
•
HDL-to-LDL ratios were significantly lower in rapid Nat2 rats.
-
•
Rapid Nat2 rats may have increased risk towards metabolic & cardiovascular disease.
Abstract
Recent reports suggest that arylamine N-acetyltransferases (NAT1 and/or NAT2) serve important roles in regulation of energy utility and insulin sensitivity. We investigated the interaction between diet (control vs. high-fat diet) and acetylator phenotype (rapid vs. slow) using previously established congenic rat lines (in F344 background) that exhibit rapid or slow Nat2 (orthologous to human NAT1) acetylator genotypes. Male and female rats of each genotype were fed control or high-fat (Western-style) diet for 26 weeks. We then examined diet- and acetylator genotype-dependent changes in body and liver weights, systemic glucose tolerance, insulin sensitivity, and plasma lipid profile. Male and female rats on the high fat diet weighed approximately 10% more than rats on the control diet and the percentage liver to body weight was consistently higher in rapid than slow acetylator rats. Rapid acetylator rats were more prone to develop dyslipidemia overall (i.e., higher triglyceride; higher LDL; and lower HDL), compared to slow acetylator rats. Total cholesterol (TC)-to-HDL ratios were significantly higher and HDL-to-LDL ratios were significantly lower in rapid acetylator rats. Our data suggest that rats with rapid systemic Nat2 (NAT1 in humans) genotype exhibited higher dyslipidemia conferring risk for metabolic syndrome and cardiovascular dysfunction.
1. Introduction
Metabolic syndrome represents a cluster of risk factors that includes insulin resistance, hypertension, central obesity, and dyslipidemia [1]. It is estimated that in the United States, more than a third of the adult population has metabolic syndrome [2], and they are at a significantly greater risk of developing cardiovascular disease and type 2 diabetes. Although the underlying cause of metabolic disorders has been generally attributed to dysregulated energy utilization and storage, our current understanding of genetic and environmental factors that contribute to development of metabolic syndrome still remains insufficient [3]. To address this ever-growing health issue, it is important to identify the underlying mechanisms of metabolic syndrome, which would allow us to design and explore new therapeutic interventions.
Arylamine N-acetyltransferases (NAT1 and NAT2) play key roles in detoxification of carcinogenic arylamines and xenobiotics by catalyzing acetyl coenzyme A-dependent biotransformation [[4], [5], [6]]. Recent studies have suggested that NATs play other physiological roles in addition to xenobiotic metabolism. For instance, NAT1 is frequently upregulated in estrogen receptor-positive breast cancers as well as triple-negative breast cancers [[7], [8], [9], [10]]. This led us and others to investigate the role of NAT1 in cancer cell growth, morphology and metastasis in recent years [[11], [12], [13], [14], [15], [16], [17], [18]].
Recently, polymorphisms within NAT2 have been linked to insulin resistance, high serum triglycerides, and coronary artery disease, as well as high fasting plasma glucose level [[19], [20], [21], [22], [23]], which indicate that NAT2 may play an important role in regulation of insulin sensitivity and metabolism. In support of this, analysis of Nat1 (the functional ortholog of human NAT2) knockout (KO) mice revealed that Nat1 deficiency leads to development of insulin resistance and metabolic defects at the systemic level without any diet challenge, highlighting the previously unrecognized role of NAT2 in regulating metabolism and insulin sensitivity [24,25]. Moreover, insulin resistance in Nat1 KO mice was accompanied by mitochondrial dysfunction [25]. Similarly, deletion of human NAT1 in cancer cell lines resulted in decreased oxidative phosphorylation with a significant loss in respiratory reserve capacity via inhibition of pyruvate dehydrogenase [18], indicating that NAT1 may also serve an essential role in maintaining the mitochondrial integrity. Taken together, these studies suggest that NATs are involved in regulating insulin sensitivity and energy utilization, possibly via mitochondria, and that individuals of certain NAT acetylator genotypes may be at a higher risk of developing insulin resistance and metabolic syndrome.
Currently, it is unknown how NAT polymorphism influences the state of metabolism or insulin sensitivity in individuals. We have previously established congenic rat lines in F344 background that carry naturally occurring rapid or slow Nat2 alleles [26]. In all tissues examined, N-acetyltransferase activities towards p-aminobenzoic acid (selective for rat Nat2) were Nat2-genotype dependent, with highest levels in homozygous rapid acetylators and lowest in homozygous slow acetylators. In contrast, rat Nat1 activities in each tissue remained the same regardless of the Nat2 genotype [26].
The present study was conducted to assess if Western-style diet and the resulting pathophysiological changes (e.g., obesity, insulin resistance, and dyslipidemia, etc.) are modified by acetylator genotype. We subjected male and female rats of rapid and slow acetylator genotypes to a control or a high-fat, high-sucrose (a.k.a., Western style) diet for 26 weeks and examined diet- and genotype-dependent changes in body and liver weights, systemic glucose tolerance, insulin sensitivity, and plasma lipid profile.
2. Materials and Methods
2.1. Animals
Rapid and slow acetylator Nat2 congenic Fischer 344 (F344.WKY) rats were housed in the University of Louisville AAALAC-approved animal facility, and the experiments were reviewed and approved by the University’s Institutional Animal Care and Use Committee. The generation of rapid and slow acetylator Nat2 congenic rats was previously reported [26]. Briefly, F344 (homozygous for rapid Nat2 allele) males were mated to WKY (homozygous for slow Nat2 allele) females to produce the obligate heterozygous F1 generation. F1 females were then backcrossed with F344 males. Heterozygous acetylator female progeny from each successive backcross were identified by rat Nat2 genotype and were mated with F344 rapid acetylator males. After ten generations of backcrossing, heterozygous acetylator brother/sister progeny were mated to produce the homozygous rapid and slow acetylator congenic rat Nat2 lines. The congenic F344.WKY rats have been previously confirmed for rapid and slow phenotypic differences in activity across multiple tissues and with different substrates [26]. Of note, rat Nat1 and rat Nat2 each contain an intronless 870 bp open reading frame [27]. Rats also possess a third rat Nat3 [28] that expresses transcripts are at least 100-1000-fold lower than rat Nat1 and rat Nat2 in hepatic and extrahepatic tissues [29,30]. Rat Nat1 [27] and rat Nat3 [30] coding regions are identical in rapid and slow acetylators and their recombinant proteins exhibit equivalent N-acetyltransferase activities [27].
Three-week-old rats were allocated to the following 8 treatment groups according to their genotypes: 1) Rapid male, control diet (CD) (n = 7); 2) Slow male, CD (n = 7); 3) Rapid male, high-fat diet (HFD) (n = 7); 4) Slow male, HFD; 5) Rapid female, CD (n = 7); 6) Slow female, CD (n = 7); 7) Rapid female, HFD (n = 7); and 8) Slow female, HFD (n = 7). Each group was fed the corresponding diet for 26 weeks. See Fig. 1 for the overall experimental scheme.
Fig. 1.

Experimental scheme. Three-week-old rats (F344) of indicated sex and acetylator genotypes (rapid and slow) were fed with control (CD) or high-fat, high-sucrose (“Western style”) diet (HFD) for 26 weeks. Body and liver weight and plasma lipid profiles were measured in each animal at indicated time points. Animals were also subjected to oral glucose tolerance test (OGTT) and insulin tolerance test (ITT) towards the end of the study.
2.2. Diets
Purified diets were purchased from Harlan Teklad (Control Diet, TD.08485 and HFD or “Western-style” diet, TD.88137) and provided ad libitum. The nutrient composition of each diet is shown in Table 1. In brief, the CD consisted of (in % Kcal) 19.2% protein, 67.9% carbohydrate, and 13% fat. The HFD consisted of 15.2% protein, 42.7% carbohydrate, and 42% fat. The food intakes were monitored weekly in each group between 16 and 25 weeks of treatment by calculating the difference between the amount given and amount left in the cage. The amount of food intake was used to calculate the calorie intake using the following information provided by the manufacturer of the diets: 3.6 kcal/g for CD and 4.5 kcal/g for HFD.
Table 1.
Composition of the Diets.
| Control Diet (CD) |
High-Fat Diet (HFD) |
|||||
|---|---|---|---|---|---|---|
| Components | % by weight | % kcal from | % by weight | % kcal from | Source of Fat: | Anhydrous milk-fat |
| Protein | 17.3 | 19.1 | 17.3 | 15.2 | ||
| Carbohydrates | 61.3 | 67.9 | 48.5 | 42.7 | % of total fatty acids | |
| Fat | 5.2 | 13.0 | 21.2 | 42.0 | Saturated | 61.8 ± 2.0 % |
| Sucrose | 12.0 | 13.3 | 34.6 | 30.5 | Monounsaturated | 27.3 ± 2.1 % |
| Cholesterol | 0.0 | - | 0.2 | - | Polyunsaturated | 4.7 ± 0.8 % |
2.3. Glucose and insulin tolerance tests
Following 23 weeks of the diet treatments, oral glucose tolerance test (OGTT) was performed. Animals were fasted overnight and given a bolus dose of glucose (2 g/kg body weight) by gavage in the morning. Glucose levels were measured prior to the glucose gavage (0 min) and at 15, 30, 45, 60, 90, and 120 min after the gavage. Glucose concentrations were determined using an Accu-Chek Aviva Plus glucometer and test strips (Roche) with blood obtained through tail prick. Insulin tolerance test (ITT) was performed following 26 weeks of the diet treatments. Animals were fasted overnight and given a dose of insulin (2 mU/g body weight; Humalog, Eli Lilly) by i.p. injection. Glucose levels were measured prior to the insulin injection (0 min) and at 15, 30, 45, 60, 90, and 120 min after the injection. For OGTT, the glucose handling over time was analyzed by calculating the incremental area-under-the-curve (AUC) [31] using GraphPad Prism v6.0c (GraphPad Software). For ITT, the insulin sensitivity over time was analyzed by calculating the inverse area-under-the-curve (invAUC) below baseline glucose. For calculation of invAUC, the glucose measurements from each animal were subtracted from the baseline glucose value to create an inversed line graph. Then the AUC above zero was calculated using GraphPad Prism v6.0c.
2.4. Plasma biochemistry
Following euthanasia by CO2 affixation, blood was collected via vena cava, added with citrate anticoagulant, and centrifuged to separate plasma. Plasma was aliquoted and stored at −80 °C until analysis. Plasma samples were analyzed using COBAS MIRA‐plus chemistry analyzer (Roche) as previously described [32].
2.5. Body and liver weights
Each animal was weighed on an analytical balance prior to the diet treatments (3 weeks of age) and at the end of the study (29 weeks of age). The liver weights were measured following euthanasia at the end of the study.
2.6. Statistical analysis
Males and females were analyzed separately when comparing the effects of diets and genotypes. For assessing the effects of diets, data from two genotypes within each diet and sex group were combined. Differences between the indicated groups were analyzed with the appropriate parametric or non-parametric test according to the data by one-way or two-way ANOVA followed by Dunn’s, Tukey or Sidak post hoc test where appropriate. All statistical analyses were performed using GraphPad Prism v6.0c (GraphPad Software). The results are expressed as the mean ± the standard deviation (SD). Values of p < 0.05 were considered statistically significant.
3. Results
3.1. Food and Calorie Intake
3.1.1. CD vs. HFD
We subjected 3-week old, rapid and slow acetylator rats of both sexes to either control diet (CD) or high-fat (“Western style”) diet (HFD) for 26 weeks (Fig. 1). The food and caloric intakes were monitored in each group between 16 and 25 weeks of treatment. Males consumed considerably more food than females in both diet groups (Fig. 2A). Among males, rats in the CD group consumed a significantly larger amount of food (approximately 10% greater) on average (14.8 ± 1.3 g/day), compared to their HFD counterparts (13.5 ± 1.2 g/day) (Fig. 2A). Females on CD also consumed approximately 8% more food per day (8.6 ± 0.8 g/day) than HFD females (7.9 ± 0.6 g/day) (Fig. 2A), but the difference was not statistically significant. Although CD rats consumed more food per day than the HFD rats, HFD male and female rats consumed significantly higher calories than the CD counterparts (approximately 14% and 15% more, respectively) (Fig. 2D). CD males consumed 53.2 ± 4.6 kcal/day, while HFD males consumed 60.8 ± 5.2 kcal/day (Fig. 2D). CD females consumed 30.9 ± 2.89 kcal/day, while HFD females consumed 35.7 ± 2.48 kcal/day (Fig. 2D).
Fig. 2.

Food and calorie consumption. Food consumption was monitored weekly in each group between 16 and 25 weeks of the diet regime. Amount of food consumed per day per rat (panels A-C) and total calorie intake per day per rat (panels D-F). A and D, Comparison between CD and HFD groups in each sex. B and E, Comparison between male rapid and slow acetylators in each diet group. C and F, Comparison between female rapid and slow acetylators in each diet group. Data are expressed as mean ± SD. Inter-group differences were analyzed via two-way ANOVA followed by a Bonferroni test. *, p < 0.05; **, p < 0.01; ***, p < 0.001. CD, control diet; HFD, high-fat diet. ‘Rapid’ and ‘Slow’ indicate the acetylator genotype.
3.1.2. Rapid vs. slow acetylator
Within CD diet groups, there were genotype-dependent differences in food consumption. Within CD, male rapid acetylator rats consumed significantly greater amount of food on average (15.6 ± 0.8 g/day) than the slow acetylator rats (14.0 ± 1.2 g/day) (Fig. 2B). Similarly, rapid acetylator female rats of CD consumed significantly larger amount of food on average (9.1 ± 0.6 g/day) than the slow acetylator female rats (8.1 ± 0.7 g/day) of CD (Fig. 2C). Consequently, male and female rapid acetylator rats of the CD group consumed a significantly greater calories per day than slow acetylator CD rats (56.0 ± 2.8 kcal/day for rapid acetylator males vs. 50.4 ± 4.4 kcal/day for slow acetylator males; 32.7 ± 2.10 kcal/day for rapid acetylator females vs. 29.2 ± 2.54 kcal/day for slow acetylator females) (Fig. 2E and F). Overall, rapid acetylator rats consumed 10-11% greater amount of calories compared to the slow acetylator rats within CD groups. A similar trend was also observed within HFD groups, where rapid acetylator rats consumed more calories than the slow acetylator rats on average, although the difference did not reach statistical significance (Fig. 2E and F).
3.2. Body and Liver Weights
3.2.1. CD vs. HFD
At the end of the study, we measured the total body weight and the liver weight of each animal. The male rats weighed considerably more than the females (Fig. 3A). In males, HFD resulted in a significant increase in the body weight, compared to CD (Fig. 3A). On average, males (443.4 ± 25.0 g) and females (228.3 ± 12.8 g) of HFD weighed approximately 9% and 11% more than their CD counterparts (405.7 ± 40.7 g for males and 205.5 ± 12.8 g for females), respectively (Fig. 3A). Within each diet/sex group, rapid and slow acetylator rats shared similar body weights, and we did not observe acetylator genotype-dependent differences in body weight (Fig. 3B and C). Obesogenic diets are known to cause hepatomegaly, driven by both hepatocyte hypertrophy and hyperplasia. HFD increased the liver weight (expressed as % body weight) in male rats by 20% (Fig. 3D). In contrast, such an HFD-induced hepatomegaly was not observed among female rats (2.58 ± 0.54% for HFD females vs. 2.69 ± 0.16% for CD females) (Fig. 3D). Within the HFD group, male rats had a significantly higher liver to body ratio (3.41 ± 0.25%) compared to female rats with HFD (2.58 ± 0.54%) (Fig. 3D and data not shown).
Fig. 3.

Body and liver weights. Body (panels A-C) and liver (panels D-F) weights were measured for each animal at the end of the study, and compared between different diet groups (panels A and D) or between two genotypes (i.e., rapid and slow) within each sex (panels B and E for males; panels C and F for females). The body weight is expressed in grams. The liver weight is expressed as liver-to-body weight ratio (%). Data are expressed as mean ± SD. Inter-group differences were analyzed via two-way ANOVA followed by a Bonferroni test. ***, p < 0.001. CD, control diet; HFD, high-fat diet. ‘Rapid’ and ‘Slow’ indicate the acetylator genotype.
3.2.2. Rapid vs. slow acetylator
Within the HFD group, the percentage liver to body weight was consistently higher in rapid acetylator rats than in slow acetylator rats among both male and female rats. Following HFD, the liver to body weight ratios increased approximately by 8% in rapid acetylator males (3.5 ± 0.3%), compared to the slow acetylator males (3.3 ± 0.1) (Fig. 3E). Similarly, rapid acetylator females of the HFD group also showed an approximately 19% increase in the liver to body weight ratio compared to the slow acetylator females of the same group (2.8 ± 0.6% in rapid vs. 2.4 ± 0.5% in slow) (Fig. 3F). In contrast, rapid and slow acetylator males or females in the CD group did not show a significant difference in their liver to body weight ratio (Fig. 3E and F). These results suggest that there are Nat2 genotype-dependent changes in liver weight among rats subjected to fat-enriched diet.
3.3. Glucose Tolerance
3.3.1. Baseline glucose
In order to assess diet and genotype-dependent changes in glucose handling, we measured the baseline glucose level and conducted oral glucose tolerance test (OGTT) in each animal. The baseline/fasting glucose levels were largely unaffected by the diet or acetylator genotype (Fig. 4). Only the female rapid acetylator rats exhibited significantly lower baseline glucose levels, compared to slow acetylators, but such finding was not observed with HFD or among male rats (Fig. 4B and C).
Fig. 4.

Baseline (fasting) glucose levels. Following 26 weeks of the diet treatment, animals were fasted overnight and measured of their blood glucose levels (in mg/dL) using a glucometer, prior to the insulin tolerance test. A, Comparison between two diets within each sex. B, Comparison between two genotypes (rapid and slow) within each diet group among male rats. C, Comparison between two genotypes (rapid and slow) within each diet group among female rats. Data are expressed as mean ± SD. Inter-group differences were analyzed via two-way ANOVA followed by a Bonferroni test. *, p < 0.05. CD, control diet; HFD, high-fat diet. ‘Rapid’ and ‘Slow’ indicate the acetylator genotype.
3.3.2. OGTT (CD vs. HFD)
For OGTT which was performed at 23 weeks of diet, animals were fasted overnight, given a bolus glucose by gavage, and the blood glucose levels were measured up to 120 min after the gavage (Fig. 5). Based on the area under the curve (AUC) analysis, the HFD groups showed a larger, incremental AUC compared to the CD groups in both males and females, although the difference was not statistically significant (Fig. 5A, D, and G).
Fig. 5.

Oral glucose tolerance test (OGTT). OGTT was performed at 23 weeks of the diet treatment. Following an overnight fasting, animals were given a bolus oral glucose (2 g/kg body weight). Blood glucose levels were measured prior to and after the bolus glucose at indicated time intervals. The data was analyzed for each sex separately. The line graphs show the changes in blood glucose levels as a function of time for male (panels A-C) and female (panels D-F) rats. The bar graphs (panels G-J) show incremental, area-under-the-curve (AUC) calculated based on the OGTT line graphs. Data are expressed as mean ± SD. Inter-group differences were analyzed via two-way ANOVA followed by a Bonferroni test. *, p < 0.05; **, p < 0.01; ***, p < 0.001. CD, control diet; HFD, high-fat diet. ‘Rapid’ and ‘Slow’ indicate the acetylator genotype.
3.3.3. OGTT (Rapid vs. slow acetylator)
When OGTT results were compared between two genotypes in each group, rapid acetylator rats showed significantly higher glucose levels at some of the time points. For instance, among CD males, rRapid acetylator males had a significantly higher level of glucose at 40 min post-bolus glucose (Fig. 5B), and the OGTT AUC for rapid acetylator males (7661 ± 1498) were also significantly larger than that for slow acetylator males (5871 ± 1194) (Fig. 5I), suggesting that it takes a longer time for rapid acetylator males to clear excess glucose. In the HFD male group, the average OGTT AUC value was also higher in rapid acetylator male rats (7904 ± 906), compared to the slow acetylator males (7506 ± 1019) (Fig. 5I). However, the difference was statistically significant only in the CD male group. Similarly, with regard to female rats, the mean OGTT AUC values were also higher in rapid acetylator females compared to slow acetylator females with both CD and HFD regimes (Fig. 5J).
3.4. Insulin Sensitivity
3.4.1. ITT (CD vs. HFD and male vs. female)
Each animal was also subject to insulin tolerance test (ITT) at 26 weeks of diet to assess any changes in whole-body insulin sensitivity. Animals were fasted overnight, given a dose of insulin by i.p., and measured of blood glucose levels up to 120 min after the injection (Fig. 6). In all groups, an unexpected spike in the glucose level appeared at 15 min post-insulin injection, but the level started to decline afterwards as expected. We then calculated the inverse area-under-the-curve (invAUC) below baseline glucose for each treatment group as an index of whole-body glucose sensitivity. In either sex, the HFD did not result in a significant change in invAUC (Fig. 6G). In both diet groups, however, males exhibited significantly lower invAUCs compared to females, suggesting that the males have a relatively lower sensitivity to insulin than the females (Fig. 6H). The males of the HFD and CD groups had invAUCs of 506.7 ± 459.0 and 457.2 ± 469.6, respectively, and the females of the HFD and CD had invAUCs of 1058.0 ± 669.5 and 1568.0 ± 864.0, respectively (Fig. 6H).
Fig. 6.

Insulin tolerance test (ITT). ITT was performed at 26 weeks of the diet treatment. Following an overnight fasting, animals were given an insulin injection (i.p.). Blood glucose levels were measured prior to and after the insulin injection at indicated time intervals. The data was analyzed for each sex separately. The line graphs show the changes in blood glucose levels as a function of time for male (panels A-C) and female (panels D-F) rats. The bar graphs (panels G-J) show inversed area-under-the-curve (invAUC) (i.e., AUC below the baseline glucose) calculated based on the ITT line graphs. Data are expressed as mean ± SD. Inter-group differences were analyzed via two-way ANOVA followed by a Bonferroni test. *, p < 0.05; **, p < 0.01; ***, p < 0.001. CD, control diet; HFD, high-fat diet. ‘Rapid’ and ‘Slow’ indicate the acetylator genotype.
3.4.2. ITT (Rapid vs. slow acetylator)
There were genotype-dependent differences in whole-body insulin sensitivity. In both CD and HFD male groups, the decline in glucose level by insulin appeared attenuated in rapid acetylator males, compared to slow acetylator males, and the glucose levels of rapid acetylator males were significantly higher at some of the time points measured (Fig. 6B). In both CD and HFD male groups, the mean invAUCs were lower in rapid acetylator males (406.9 ± 432.7 HFD and 261.3 ± 290.4 CD), compared to those in slow acetylator males (606.6 ± 495.8 in HFD and 653.1 ± 551.3 in CD) (Fig. 6I), suggesting that the systemic response to insulin is relatively blunted in rapid acetylator males. In contrast, the opposite trend was observed among females. In case of females, regardless of the diet regime, invAUCs were considerably higher in rapid acetylator females (1399 ± 770 in HFD and 1816 ± 976 in CD), compared to those in slow acetylator females (716.9 ± 337.5 in HFD and 1270 ± 687 in CD) (Fig. 6J).
3.5. Plasma Biochemistry
3.5.1. Lipid profile (CD vs. HFD and male vs. female)
Prior to euthanasia, we collected blood to measure parameters of plasma biochemistry in individual rats. The measured parameters included triglyceride, total cholesterol, HDL (high-density lipoprotein), and LDL (low-density lipoprotein) (Fig. 7). With respect to total cholesterol, the male rats had a significantly higher levels compared to the females with both diet regimes, and the HFD increased the total cholesterol level significantly in both sexes (Fig. 7A). Among male rats, the average cholesterol levels in CD and HFD groups were 110.5 ± 12.4 and 149.0 ± 13.8 mg/dl, respectively, and among females, they were 87.3 ± 11.2 and 109.2 ± 11.6 mg/dl, respectively (Fig. 7A). HFD also resulted in a significant increase (by 1.6-1.7-fold) in the LDL level in both male and females. CD and HFD males had LDL levels of 7.61 ± 2.10 mg/dl and 13.0 ± 2.41 mg/dl, respectively, and the females had 4.09 ± 1.36 mg/dl and 6.64 ± 1.29 mg/dl, respectively (Fig. 7E). Males showed significantly higher LDL levels, compared to the females, regardless of the diet regime (Fig. 7F). With respect to HDL, the HFD-associated change was not as pronounced as LDL, and the difference reached the statistical significance only with male rats (40.6 ± 10.4 mg/dl in CD vs. 51.9 ± 4.75 mg/dl in HFD) (Fig. 7I). With regard to triglycerides, the male rats had significantly higher level than the females, regardless of the diet regime (Fig. 7N). Among males, HFD resulted in a markedly higher level of triglycerides (436.9 ± 133.3 mg/ml), compared to CD (299.2 ± 105.3 mg/ml), congruent with their diet regime (Fig. 7M).
Fig. 7.

Plasma lipid profiles. Following 26 weeks of the diet treatment, plasma concentrations (in mg per dL) of triglyceride (panels A-D), total cholesterol (panels E-H), high-density lipoprotein (HDL) (panels I-L) and low-density lipoprotein (LDL) (panels M-P) were measured in each animal. Data are expressed as mean ± SD. Inter-group differences were analyzed via two-way ANOVA followed by a Bonferroni test. *, p < 0.05; **, p < 0.01; ***, p < 0.001. CD, control diet; HFD, high-fat diet. ‘Rapid’ and ‘Slow’ indicate the acetylator genotype.
3.5.2. Lipid profile (Rapid vs. slow acetylator)
Acetylator genotype modified LDL and HDL levels. The average LDL levels were consistently higher in rapid acetylator rats, regardless of sex or diet (Fig. 7G and H). For instance, the rapid acetylator male rats of CD showed an average LDL of 9.28 ± 0.77 mg/dl which was approximately 56% higher than that in slow acetylator males of the same group (5.94 ± 1.58 mg/dl) (Fig. 7G). The rapid acetylator females of HFD had an average LDL of 7.60 ± 1.10 mg/dl which was approximately 30% higher than that in slow acetylator females of the same group (5.85 ± 0.84 mg/dl) (Fig. 7H). The genotype-dependent differences in plasma LDL level, however, did not seem to be augmented by HFD (Fig. 7G and H). In contrast to LDL, the HDL levels were lower in rapid acetylator rats within CD groups. The rapid acetylator male rats of CD showed 31.5 ± 4.69 mg/dl of HDL which was approximately 37% lower than that in slow acetylator males of the same group (49.7 ± 4.29 mg/dl) (Fig. 7K). Similarly, the rapid and slow acetylator females of CD showed HDL levels of 34.0 ± 4.23 mg/dl and 44.3 ± 4.04 mg/dl, respectively (Fig. 7L). However, no such genotype-dependent differences were found in rats treated with HFD (Fig. 7K and L).
Additionally, there was also a genotype-dependent difference in the triglyceride level within the male HFD group. The rapid acetylator HFD males exhibited a significantly higher triglyceride level (529.3 ± 108.4 mg/dl) than the slow acetylators (344.5 ± 82.7 mg/dl) (Fig. 7O). Although the rapid acetylator males of the CD group also showed a higher average triglyceride level than slow acetylator males (Fig. 7O), the difference did not reach statistical significance. In contrast, the plasma triglyceride level was not significantly elevated in females of the HFD group. Among females, the triglyceride levels were 128.7 ± 36.0 mg/dl and 186.5 ± 141.1 mg/dl in the HFD and CD groups, respectively (Fig. 7M). Although the average plasma triglyceride level was not significantly influenced by the type of diet in females, there was a genotype type-dependent differences particularly within the CD group. Rapid acetylator females of CD showed a noticeably high level of triglyceride (284.5 ± 83.8 mg/dl), compared to the slow acetylators (39.6 ± 5.9 mg/dl) (Fig. 7P), and interestingly, its level was even significantly higher than the ones observed in the HFD females (130.4 ± 29.9 and 127.1 ± 44.1 mg/dl in rapid and slow acetylator females of HFD, respectively) (Fig. 7P).
3.6. TC:HDL and HDL:LDL ratios
Based on the plasma lipid profile measurements, we calculated the total cholesterol (TC)-to-HDL ratio (TC:HDL ratio) and HDL-to-LDL (HDL:LDL) ratio (Fig. 8). The HFD did not result in a significant increase in the TC:HDL ratio in both males and females (Fig. 8A), compared to CD. When two genotypes were compared, however, rapid acetylator rats showed consistently higher values, regardless of sex or diet. For instance, CD-fed, rapid acetylator males had a TC:HDL ratio of 3.46 ± 0.26 which was significantly higher than that in slow acetylator males (2.28 ± 0.25) (Fig. 8C). Similarly, CD-fed rapid females exhibited a statistically significant higher TC:HDL ratio (2.48 ± 0.20), compared to slow acetylators (2.03 ± 0.13) (Fig. 8D). The analysis of HDL:LDL ratios was consistent with the TC:HDL ratios in that rapid acetylators had significantly lower values than slow acetylators in both sexes, regardless of the diet (Fig. 8G and H). These results reflect that rapid acetylators showed higher LDL levels while having lower HDL levels, compared to slow acetylators (Fig. 7).
Fig. 8.

Total cholesterol-to-HDL (TC:HDL) and HDL-to-LDL (HDL:LDL) ratios. Based on the plasma levels of total cholesterol, HDL, and LDL (see Fig. 7), TC:HDL (panels A-D) and HDL:LDL ratios (panels E-H) were calculated for each animal. The TC:HDL and HDL:LDL ratios serve as important indicators of cardiovascular risk [49]. Data are expressed as mean ± SD. Inter-group differences were analyzed via two-way ANOVA followed by a Bonferroni test. *, p < 0.05; **, p < 0.01; ***, p < 0.001. CD, control diet; HFD, high-fat diet. ‘Rapid’ and ‘Slow’ indicate the acetylator genotype.
3.7. Data summary
A listing of all data described in the manuscript is provided in Supplemental Table 1.
4. Discussion
Differences in carcinogen-induced liver DNA adducts [33] and mammary cancer [34] have been reported between the rapid and slow acetylator Nat2 congenic strains. These strains differ significantly between rapid and slow acetylators with respect to Nat2 activity in every tissue examined whereas differences between males and females is not observed [26]. In the current study, we investigated the interaction between diet and NAT acetylator genotype and its impact on pathophysiological changes associated with “Western-style diet”. Overall, HFD-induced changes in physiological variables measured in the study were marginal in both male and female rats. However, there were notably significant differences between rapid and slow acetylator genotypes (see below).
HFD induced significant dyslipidemia (see Fig. 7), consistent with the adipogenic nature of the diet. However, it resulted in only marginal changes in glucose tolerance and insulin sensitivity (see Fig. 5, Fig. 6). In other words, the HFD did not cause or augment overt insulin resistance or other indicators of metabolic syndrome in our congenic rats. It is well-known that the dietary effect is sensitive to strain of model animals [[35], [36], [37], [38]]. Our congenic acetylator rats had been previously established in F344 background [26]. Historically most diet studies in rats have been conducted with Sprague-Dawley and Wistar rats [39,40]. Thus, it appears that F344 rats are relatively resistant to the deleterious impact of HFD on glucose homeostasis and insulin sensitivity. A study by Pancani et al. explored the effects of HFD on metabolic changes and cognitive decline in F344 rats, an animal model of brain aging [41]. The authors reported that a chronic HFD in F344 rats resulted in lipid dysregulation, accompanied by an increase in liver weight. However, HFD-fed animals maintained normal peripheral glucose regulation. Our current results are consistent with their findings. Interestingly, Pancani et al. also observed that the level of circulating adiponectin in the F344 rats was much higher (20 μg/ml) [41], compared to that in other rodent models [[42], [43], [44], [45]]. Elevated adiponectin levels have been shown to protect from metabolic dysregulation associated with HFD [46] and inversely correlate with insulin resistance [47]. Based on this, it is plausible that the inherently high levels of adiponectin in F344 rats may provide protective effects against the HFD-induced changes.
With regard to systemic glucose tolerance, genotype-dependent differences were present. Rapid acetylator males of the CD group had a significantly higher OGTT AUC (7661 ± 1498) compared to slow acetylator males (5871 ± 1194) in the same group (see Fig. 5I). Although not statistically significant, such trend also held true in other diet and sex groups, with rapid acetylator animals exhibiting higher OGTT AUCs than slow acetylators in each group (see Fig. 5I and J). However, HFD feeding did not further augment the differences between two genotypes. These results suggest that rapid acetylator rats became relatively glucose intolerant over time, regardless of sex or diet regime.
In general, the HFD led to changes in plasma lipid profiles in both male and female rats (see Fig. 7). The plasma triglyceride levels were elevated in rapid acetylator male rats, regardless of the diet (see Fig. 7O). Such increase was also observed with rapid acetylator females that were fed the CD (see Fig. 7P). Of note, hypertriglyceridemia is a strong predictor of coronary heart disease [48]. The relative hypertriglyceridemia seen with rapid acetylator rats accompanied marginal increases in liver-to-body ratio in response to HFD feeding (see Fig. 3E and F). The increased sizes of liver in these rapid acetylator rats are likely due to increased accumulation of fat in the liver. Histological assessment of liver sections showed that the HFD increased lipid accumulation in the liver, especially in male rats (data not shown).
The relative hypertriglyceridemia observed in rapid acetylator rats was in line with other lipid markers (see Fig. 7). These results are consistent with adipogenic nature of the HFD. Rapid acetylator rats exhibited significantly higher total cholesterol to HDL lipoprotein (TC:HDL) ratio than the slow acetylators, regardless of the diet or sex (see Fig. 8C and D). The TC:HDL ratio, known as the atherogenic or Castelli index is an important indicator of cardiovascular risk, for its predictive value is greater than the isolated parameters [49]. It is well-known that an increase in total cholesterol (specifically LDL cholesterol) is atherogenic and is associated with a greater risk of coronary artery disease [50], while reductions in HDL correlates with risk factors of metabolic syndrome [49,51,52]. Consistent with this observation, the average HDL:LDL ratios in rapid acetylator groups were significantly lower than those in slow acetylators (see Fig. 8G and H). Thus, the current results indicate that the differences in plasma lipid profiles of rapid acetylator rats may place them at a higher risk for cardiovascular dysfunction. Overall, the rapid acetylator rats of either sex tended to show higher plasma triglyceride, higher LDL, lower HDL levels, and higher TC:HDL ratios, when compared to the slow acetylator rats of the same sex groups. Taken together, the current findings indicate that rapid acetylator rats may be more prone to dysregulation of lipid storage and metabolism and subsequent cardiovascular outcomes and metabolic disease.
Previous studies that have depleted Nat1 in mice (orthologous to human NAT2) indicated that the absence of NAT2 activity lead to systemic insulin resistance and glucose intolerance [24,25]. Nat1 (orthologous to human NAT2)-deficient mice exhibited reduced basal metabolic rate and exercise capacity without altered thermogenesis. Moreover, the KO mice had a decreased ability to utilize fatty acids for energy. The metabolic defects observed in Nat1 KO mice were accompanied by mitochondrial dysfunction both in vitro and in vivo, which provided a mechanistic link between insulin resistance and Nat1 [25]. It should be noted that the 4 single nucleotide polymorphisms that exist in our congenic rats are on RAT(Nat2) gene, a functional ortholog of HUMAN(NAT1), whereas the aforementioned knockout mice studies were on MOUSE(Nat1) gene, a functional ortholog of HUMAN(NAT2). Although human NAT1 and rat Nat2 share many common substrates, they clearly differ in substrate selectivity [4,6,53]. Thus, it is unknown if they share interchangeable roles in energy homeostasis and regulation of insulin sensitivity.
A genome-wide association study (GWAS) linked two common SNPs [rs1208 (803A > G, K268R) and rs1801280 (341 T > C, I114 T)] located within NAT2 gene to increased susceptibility to insulin resistance in human populations [20]. Although these two nonsynonymous coding SNPs are associated with slow acetylator phenotype [54], the GWAS studies conducted in human populations could have been confounded by exposures to arylamine xenobiotics, including heterocyclic amines (HCAs), that are metabolized by NATs. For instance, a recent epidemiological study reported that insulin resistance was associated with exposure to HCAs via consumption of cooked meat [55].
Moreover, Teslovich et al. reported an association of NAT2 SNP (rs1495741) with higher plasma triglyceride as well as total cholesterol levels in their GWAS [23]. Zhang and colleagues reported an association of NAT2 SNP, rs1799930 with higher serum lipid parameters (e.g., triglyceride) among Han people of China [56]. As discussed above, our results suggest that rapid acetylator rats, that exhibit higher NAT activities, displayed a greater tendency to develop dyslipidemia and suboptimal handling of excess glucose, implying that they may be more susceptible to developing metabolic or cardiovascular disorders. According to the reports from the Meta-Analyses of Glucose and Insulin-related traits Consortium (MAGIC; http://www.magicinvestigators.org), the G-allele of a human NAT2 SNP, rs1495741 (linked to rapid acetylator phenotype), was associated with higher HbA1c (hemoglobin A1C) and higher fasting plasma glucose levels [23,57].
In our study, sex differences in response to high-fat feeding, especially in body and liver weight gain and plasma lipid profiles were observed (see Fig. 3, Fig. 7). Similar to humans, laboratory rats exhibit clear sex differences with respect to weight gain and their cellular response to high-fat diet, and this has been well-documented for many years [[58], [59], [60], [61]]. This has been attributed to many physiological, neurohormonal as well as behavioral differences between the two sexes. These include differences in sex hormones, physical activity, feeding behaviors, and energy expenditure [60,[62], [63], [64]]. Mouse Nat1 and Nat2 expression and activities have been reported to increase from neonatal day 4 to adult in a nonlinear fashion [65] suggesting that rat developmental stage could be an important factor in short-term exposure scenarios. However, all rats used in this study were continuously treated with the indicated diets for 26 weeks and developmental changes in F344 rat Nat2 mRNA are not observed [29].
In summary, the HFD treatment of our acetylator congenic rats in F344 background did not induce an overt obesity or insulin resistance, but sufficiently induced dyslipidemia in both sexes. Rapid acetylator rats were more prone to dyslipidemia overall (i.e., higher LDL; higher triglyceride; and lower HDL), compared to slow acetylator rats. The genotypic effects were not further augmented by HFD in this initial study, a finding which requires further investigation. Our data supports an hypothesis that rats with high systemic Nat2 (NAT1 in humans) activity exhibit higher risk of developing metabolic syndrome as well as cardiovascular dysfunction. Further investigations are necessary to test this hypothesis regarding the role of acetylator genotype in risk of metabolic disorders.
Funding
This work was supported by the National Institutes of Health [grant numbers P20-GM113226,P42-ES023716, and P30-ES030283].
CRediT authorship contribution statement
Kyung U. Hong: Writing - original draft, Formal analysis, Validation, Visualization. Mark A. Doll: Investigation, Data curation, Formal analysis, Validation, Visualization, Project administration, Writing - review & editing. Angeliki Lykoudi: Investigation, Data curation. Raúl A. Salazar-González: Investigation, Data curation, Formal analysis, Writing - review & editing. Mariam R. Habil: Investigation, Data curation. Kennedy M. Walls: Validation, Visualization, Data curation. Alaa F. Bakr: Data curation. Smita S. Ghare: Resources, Writing - review & editing. Shirish S. Barve: Resources, Writing - review & editing. Gavin E. Arteel: Resources, Writing - review & editing. David W. Hein: Conceptualization, Supervision, Project administration, Funding acquisition, Writing - review & editing.
Declaration of Competing Interest
None.
Footnotes
Supplementary material related to this article can be found, in the online version, at doi:https://doi.org/10.1016/j.toxrep.2020.09.011.
Appendix A. Supplementary data
The following is Supplementary data to this article:
References
- 1.Alberti K.G.M.M., Eckel R.H., Grundy S.M., Zimmet P.Z., Cleeman J.I., Donato K.A., Fruchart J.-C., James W.P.T., Loria C.M., Smith S.C. International Diabetes Federation Task Force on Epidemiology and Prevention, Hational Heart, Lung, and Blood Institute, American Heart Association, World Heart Federation, International Atherosclerosis Society, International Association for the Study of Obesity, Harmonizing the metabolic syndrome: a joint interim statement of the International Diabetes Federation Task Force on Epidemiology and Prevention; National Heart, Lung, and Blood Institute; American Heart Association; World Heart Federation; International Atherosclerosis Society; and International Association for the Study of Obesity. Circulation. 2009;120:1640–1645. doi: 10.1161/CIRCULATIONAHA.109.192644. [DOI] [PubMed] [Google Scholar]
- 2.Moore J.X. Metabolic Syndrome Prevalence by Race/Ethnicity and Sex in the United States, National Health and Nutrition Examination Survey, 1988–2012. Prev. Chronic. Dis. 2017;14 doi: 10.5888/pcd14.160287. [DOI] [PMC free article] [PubMed] [Google Scholar]
- 3.McCracken E., Monaghan M., Sreenivasan S. Pathophysiology of the metabolic syndrome. Clin. Dermatol. 2018;36:14–20. doi: 10.1016/j.clindermatol.2017.09.004. [DOI] [PubMed] [Google Scholar]
- 4.Hein D.W. Molecular genetics and function of NAT1 and NAT2: role in aromatic amine metabolism and carcinogenesis. Mutat. Res. 2002;506–507:65–77. doi: 10.1016/s0027-5107(02)00153-7. [DOI] [PubMed] [Google Scholar]
- 5.Hein D.W., Doll M.A., Fretland A.J., Leff M.A., Webb S.J., Xiao G.H., Devanaboyina U.-S., Nangju N.A., Feng Y. Molecular Genetics and Epidemiology of the NAT1 and NAT2 Acetylation Polymorphisms. Cancer Epidemiol. Prev. Biomark. 2000;9:29–42. [PubMed] [Google Scholar]
- 6.Sim E., Abuhammad A., Ryan A. Arylamine N-acetyltransferases: from drug metabolism and pharmacogenetics to drug discovery. Br. J. Pharmacol. 2014;171:2705–2725. doi: 10.1111/bph.12598. [DOI] [PMC free article] [PubMed] [Google Scholar]
- 7.Fei H., Chen S., Xu C. RNA-sequencing and microarray data mining revealing: the aberrantly expressed mRNAs were related with a poor outcome in the triple negative breast cancer patients. Ann. Transl. Med. 2020;8:363. doi: 10.21037/atm.2020.02.51. [DOI] [PMC free article] [PubMed] [Google Scholar]
- 8.Perou C.M., Jeffrey S.S., van de Rijn M., Rees C.A., Eisen M.B. Distinctive gene expression patterns in human mammary epithelial cells and breast cancers. Proc. Natl. Acad. Sci. U. S. A. 1999;96:9212–9217. doi: 10.1073/pnas.96.16.9212. [DOI] [PMC free article] [PubMed] [Google Scholar]
- 9.Wakefield L., Robinson J., Long H., Ibbitt J.C., Cooke S., Hurst H.C., Sim E. Arylamine N-acetyltransferase 1 expression in breast cancer cell lines: a potential marker in estrogen receptor-positive tumors. Genes. Chromosomes Cancer. 2008;47:118–126. doi: 10.1002/gcc.20512. [DOI] [PubMed] [Google Scholar]
- 10.Zhao H., Langerød A., Ji Y., Nowels K.W., Nesland J.M., Tibshirani R., Bukholm I.K., Kåresen R., Botstein D., Børresen-Dale A.-L., Jeffrey S.S. Different gene expression patterns in invasive lobular and ductal carcinomas of the breast. Mol. Biol. Cell. 2004;15:2523–2536. doi: 10.1091/mbc.e03-11-0786. [DOI] [PMC free article] [PubMed] [Google Scholar]
- 11.Carlisle S.M., Trainor P.J., Yin X., Doll M.A., Stepp M.W., States J.C., Zhang X., Hein D.W. Untargeted polar metabolomics of transformed MDA-MB-231 breast cancer cells expressing varying levels of human arylamine N-acetyltransferase 1. Metabolomics Off. J. Metabolomic Soc. 2016;12 doi: 10.1007/s11306-016-1056-z. [DOI] [PMC free article] [PubMed] [Google Scholar]
- 12.Carlisle S.M., Trainor P.J., Doll M.A., Stepp M.W., Klinge C.M., Hein D.W. Knockout of human arylamine N-acetyltransferase 1 (NAT1) in MDA-MB-231 breast cancer cells leads to increased reserve capacity, maximum mitochondrial capacity, and glycolytic reserve capacity. Mol. Carcinog. 2018;57:1458–1466. doi: 10.1002/mc.22869. [DOI] [PMC free article] [PubMed] [Google Scholar]
- 13.Carlisle S.M., Trainor T., Hong K.U., Doll M.A., Hein D.W. CRISPR/Cas9 knockout of human arylamine N-acetyltransferase 1 in MDAMB-231 breast cancer cells suggests a role in cellular metabolism. Sci. Rep. 2020;10(June 17):9804. doi: 10.1038/s41598-020-66863-4. [DOI] [PMC free article] [PubMed] [Google Scholar]
- 14.Li P., Butcher N.J., Minchin R.F. Arylamine N-Acetyltransferase 1 Regulates Expression of Matrix Metalloproteinase 9 in Breast Cancer Cells: Role of Hypoxia-Inducible Factor 1-α. Mol. Pharmacol. 2019;96:573–579. doi: 10.1124/mol.119.117432. [DOI] [PubMed] [Google Scholar]
- 15.Li P., Butcher N.J., Minchin R.F. Effect arylamine N-acetyltransferase 1 on morphology, adhesion, migration, and invasion of MDA-MB-231 cells: role of matrix metalloproteinases and integrin αV. Cell Adhes. Migr. 2020;14:1–11. doi: 10.1080/19336918.2019.1710015. [DOI] [PMC free article] [PubMed] [Google Scholar]
- 16.Stepp M.W., Doll M.A., Carlisle S.M., States J.C., Hein D.W. Genetic and small molecule inhibition of arylamine N-acetyltransferase 1 reduces anchorage-independent growth in human breast cancer cell line MDA-MB-231. Mol. Carcinog. 2018;57:549–558. doi: 10.1002/mc.22779. [DOI] [PMC free article] [PubMed] [Google Scholar]
- 17.Stepp M.W., Salazar-González R.A., Hong K.U., Doll M.A., Hein D.W. N-Acetyltransferase 1 Knockout Elevates Acetyl Coenzyme A Levels and Reduces Anchorage-Independent Growth in Human Breast Cancer Cell Lines. J. Oncol. 2019;2019 doi: 10.1155/2019/3860426. [DOI] [PMC free article] [PubMed] [Google Scholar]
- 18.Wang L., Minchin R.F., Essebier P.J., Butcher N.J. Loss of human arylamine N-acetyltransferase I regulates mitochondrial function by inhibition of the pyruvate dehydrogenase complex. Int. J. Biochem. Cell Biol. 2019;110:84–90. doi: 10.1016/j.biocel.2019.03.002. [DOI] [PubMed] [Google Scholar]
- 19.Hegele R.A., Kwan K., Harris S.B., Hanley A.J., Zinman B., Cao H. NAT2 polymorphism associated with plasma glucose concentration in Canadian Oji-Cree. Pharmacogenetics. 2000;10:233–238. doi: 10.1097/00008571-200004000-00004. [DOI] [PubMed] [Google Scholar]
- 20.Knowles J.W., Xie W., Zhang Z., Chennamsetty I., Chennemsetty I., Assimes T.L., Paananen J., Hansson O., Pankow J., Goodarzi M.O., Carcamo-Orive I., Morris A.P., Chen Y.-D.I., Mäkinen V.-P., Ganna A., Mahajan A., Guo X., Abbasi F., Greenawalt D.M., Lum P., Molony C., Lind L., Lindgren C., Raffel L.J., Tsao P.S. RISC (Relationship between Insulin Sensitivity and Cardiovascular Disease) Consortium, EUGENE2 (European Network on Functional Genomics of Type 2 Diabetes) Study, GUARDIAN (Genetics UndeRlying DIAbetes in HispaNics) Consortium, SAPPHIRe (Stanford Asian and Pacific Program for Hypertension and Insulin Resistance) Study, E.E. Schadt, J.I. Rotter, A. Sinaiko, G. Reaven, X. Yang, C.A. Hsiung, L. Groop, H.J. Cordell, M. Laakso, K. Hao, E. Ingelsson, T.M. Frayling, M.N. Weedon, M. Walker, T. Quertermous, Identification and validation of N-acetyltransferase 2 as an insulin sensitivity gene. J. Clin. Invest. 2015;125:1739–1751. doi: 10.1172/JCI74692. [DOI] [PMC free article] [PubMed] [Google Scholar]
- 21.Marzuillo P., Di Sessa A., Umano G.R., Nunziata L., Cirillo G., Perrone L., Miraglia Del Giudice E., Grandone A. Novel association between the nonsynonymous A803G polymorphism of the N-acetyltransferase 2 gene and impaired glucose homeostasis in obese children and adolescents. Pediatr. Diabetes. 2017;18:478–484. doi: 10.1111/pedi.12417. [DOI] [PubMed] [Google Scholar]
- 22.Marzuillo P., Sessa A.D., Umano G.R., Nunziata L., Cirillo G., Perrone L., del Giudice E.M., Grandone A. Novel association between the nonsynonymous A803G polymorphism of the N-acetyltransferase 2 gene and impaired glucose homeostasis in obese children and adolescents. Pediatr. Diabetes. 2017;18:478–484. doi: 10.1111/pedi.12417. [DOI] [PubMed] [Google Scholar]
- 23.Teslovich T.M., Musunuru K., Smith A.V., Edmondson A.C., Stylianou I.M., Koseki M., Pirruccello J.P., Ripatti S., Chasman D.I., Willer C.J., Johansen C.T., Fouchier S.W., Isaacs A., Peloso G.M., Barbalic M., Ricketts S.L., Bis J.C., Aulchenko Y.S., Thorleifsson G., Feitosa M.F., Chambers J., Orho-Melander M., Melander O., Johnson T., Li X., Guo X., Li M., Shin Cho Y., Jin Go M., Jin Kim Y., Lee J.-Y., Park T., Kim K., Sim X., Twee-Hee Ong R., Croteau-Chonka D.C., Lange L.A., Smith J.D., Song K., Hua Zhao J., Yuan X., Luan J., Lamina C., Ziegler A., Zhang W., Zee R.Y.L., Wright A.F., Witteman J.C.M., Wilson J.F., Willemsen G., Wichmann H.-E., Whitfield J.B., Waterworth D.M., Wareham N.J., Waeber G., Vollenweider P., Voight B.F., Vitart V., Uitterlinden A.G., Uda M., Tuomilehto J., Thompson J.R., Tanaka T., Surakka I., Stringham H.M., Spector T.D., Soranzo N., Smit J.H., Sinisalo J., Silander K., Sijbrands E.J.G., Scuteri A., Scott J., Schlessinger D., Sanna S., Salomaa V., Saharinen J., Sabatti C., Ruokonen A., Rudan I., Rose L.M., Roberts R., Rieder M., Psaty B.M., Pramstaller P.P., Pichler I., Perola M., Penninx B.W.J.H., Pedersen N.L., Pattaro C., Parker A.N., Pare G., Oostra B.A., O’Donnell C.J., Nieminen M.S., Nickerson D.A., Montgomery G.W., Meitinger T., McPherson R., McCarthy M.I., McArdle W., Masson D., Martin N.G., Marroni F., Mangino M., Magnusson P.K.E., Lucas G., Luben R., Loos R.J.F., Lokki M.-L., Lettre G., Langenberg C., Launer L.J., Lakatta E.G., Laaksonen R., Kyvik K.O., Kronenberg F., König I.R., Khaw K.-T., Kaprio J., Kaplan L.M., Johansson A., Jarvelin M.-R., Janssens A.C.J.W., Ingelsson E., Igl W., Kees Hovingh G., Hottenga J.-J., Hofman A., Hicks A.A., Hengstenberg C., Heid I.M., Hayward C., Havulinna A.S., Hastie N.D., Harris T.B., Haritunians T., Hall A.S., Gyllensten U., Guiducci C., Groop L.C., Gonzalez E., Gieger C., Freimer N.B., Ferrucci L., Erdmann J., Elliott P., Ejebe K.G., Döring A., Dominiczak A.F., Demissie S., Deloukas P., de Geus E.J.C., de Faire U., Crawford G., Collins F.S., Chen Y.I., Caulfield M.J., Campbell H., Burtt N.P., Bonnycastle L.L., Boomsma D.I., Boekholdt S.M., Bergman R.N., Barroso I., Bandinelli S., Ballantyne C.M., Assimes T.L., Quertermous T., Altshuler D., Seielstad M., Wong T.Y., Tai E.-S., Feranil A.B., Kuzawa C.W., Adair L.S., Taylor H.A., Borecki I.B., Gabriel S.B., Wilson J.G., Holm H., Thorsteinsdottir U., Gudnason V., Krauss R.M., Mohlke K.L., Ordovas J.M., Munroe P.B., Kooner J.S., Tall A.R., Hegele R.A., Kastelein J.J.P., Schadt E.E., Rotter J.I., Boerwinkle E., Strachan D.P., Mooser V., Stefansson K., Reilly M.P., Samani N.J., Schunkert H., Cupples L.A., Sandhu M.S., Ridker P.M., Rader D.J., van Duijn C.M., Peltonen L., Abecasis G.R., Boehnke M., Kathiresan S. Biological, clinical and population relevance of 95 loci for blood lipids. Nature. 2010;466:707–713. doi: 10.1038/nature09270. [DOI] [PMC free article] [PubMed] [Google Scholar]
- 24.Camporez J.P., Wang Y., Faarkrog K., Chukijrungroat N., Petersen K.F., Shulman G.I. Mechanism by which arylamine N-acetyltransferase 1 ablation causes insulin resistance in mice. Proc. Natl. Acad. Sci. U. S. A. 2017;114:E11285–E11292. doi: 10.1073/pnas.1716990115. [DOI] [PMC free article] [PubMed] [Google Scholar]
- 25.Chennamsetty I., Coronado M., Contrepois K., Keller M.P., Carcamo-Orive I., Sandin J., Fajardo G., Whittle A.J., Fathzadeh M., Snyder M., Reaven G., Attie A.D., Bernstein D., Quertermous T., Knowles J.W. Nat1 Deficiency Is Associated with Mitochondrial Dysfunction and Exercise Intolerance in Mice. Cell Rep. 2016;17:527–540. doi: 10.1016/j.celrep.2016.09.005. [DOI] [PMC free article] [PubMed] [Google Scholar]
- 26.Hein D.W., Bendaly J., Neale J.R., Doll M.A. Systemic functional expression of N-acetyltransferase polymorphism in the F344 Nat2 congenic rat. Drug Metab. Dispos. Biol. Fate Chem. 2008;36:2452–2459. doi: 10.1124/dmd.108.023960. [DOI] [PMC free article] [PubMed] [Google Scholar]
- 27.Doll M.A., Hein D.W. Cloning, sequencing and expression of NAT1 and NAT2 encoding genes from rapid and slow acetylator inbred rats. Pharmacogenetics. 1995;5:247–251. doi: 10.1097/00008571-199508000-00009. [DOI] [PubMed] [Google Scholar]
- 28.Walraven J.M., Doll M.A., Hein D.W. Identification and characterization of functional rat arylamine N-acetyltransferase 3: comparisons with rat arylamine N-acetyltransferases 1 and 2. J. Pharmacol. Exp. Ther. 2006;319:369–375. doi: 10.1124/jpet.106.108399. [DOI] [PubMed] [Google Scholar]
- 29.Barker D.F., Walraven J.M., Ristagno E.H., Doll M.A., States J.C., Hein D.W. Quantitative Tissue and Gene Specific Differences and Developmental Changes in Nat1, Nat2 and Nat3 mRNA Expression in the Rat, Drug Metab. Dispos. Biol. Fate Chem. 2008;36:2445–2451. doi: 10.1124/dmd.108.023564. [DOI] [PMC free article] [PubMed] [Google Scholar]
- 30.Walraven J.M., Barker D.F., Doll M.A., Hein D.W. Tissue expression and genomic sequences of rat N-acetyltransferases rNat1, rNat2, rNat3, and Functional characterization of a novel rNat3*2 genetic variant. Toxicol. Sci. Off. J. Soc. Toxicol. 2007;99:413–421. doi: 10.1093/toxsci/kfm159. [DOI] [PMC free article] [PubMed] [Google Scholar]
- 31.Allison D.B., Paultre F., Maggio C., Mezzitis N., Pi-Sunyer F.X. The use of areas under curves in diabetes research. Diabetes Care. 1995;18:245–250. doi: 10.2337/diacare.18.2.245. [DOI] [PubMed] [Google Scholar]
- 32.Srivastava S., Sithu S.D., Vladykovskaya E., Haberzettl P., Hoetker D.J., Siddiqui M.A., Conklin D.J., D’Souza S.E., Bhatnagar A. ORAL EXPOSURE TO ACROLEIN EXACERBATES ATHEROSCLEROSIS IN APO E-NULL MICE. Atherosclerosis. 2011;215:301–308. doi: 10.1016/j.atherosclerosis.2011.01.001. [DOI] [PMC free article] [PubMed] [Google Scholar]
- 33.Metry K.J., Neale J.R., Bendaly J., Smith N.B., Pierce W.M., Hein D.W. Effect of N-acetyltransferase 2 polymorphism on tumor target tissue DNA adduct levels in rapid and slow acetylator congenic rats administered 2-amino-1-methyl-6-phenylimidazo[4,5-b]pyridine or 2-amino-3,8-dimethylimidazo-[4,5-f]quinoxaline. Drug Metab. Dispos. Biol. Fate Chem. 2009;37:2123–2126. doi: 10.1124/dmd.109.029512. [DOI] [PMC free article] [PubMed] [Google Scholar]
- 34.Stepp M.W., Doll M.A., Samuelson D.J., Sanders M.A.G., States J.C., Hein D.W. Congenic rats with higher arylamine N-acetyltransferase 2 activity exhibit greater carcinogen-induced mammary tumor susceptibility independent of carcinogen metabolism. BMC Cancer. 2017;17:233. doi: 10.1186/s12885-017-3221-9. [DOI] [PMC free article] [PubMed] [Google Scholar]
- 35.Levin B.E., Triscari J., Sullivan A.C. Relationship between sympathetic activity and diet-induced obesity in two rat strains. Am. J. Physiol.-Regul. Integr. Comp. Physiol. 1983;245:R364–R371. doi: 10.1152/ajpregu.1983.245.3.R364. [DOI] [PubMed] [Google Scholar]
- 36.Schemmel R., Mickelsen O., Gill J.L. Dietary Obesity in Rats: Body Weight and Body Fat Accretion in Seven Strains of Rats. J. Nutr. 1970;100:1041–1048. doi: 10.1093/jn/100.9.1041. [DOI] [PubMed] [Google Scholar]
- 37.Surwit R.S., Feinglos M.N., Rodin J., Sutherland A., Petro A.E., Opara E.C., Kuhn C.M., Rebuffé-Scrive M. Differential effects of fat and sucrose on the development of obesity and diabetes in C57BL/6J and A/J mice. Metabolism. 1995;44:645–651. doi: 10.1016/0026-0495(95)90123-x. [DOI] [PubMed] [Google Scholar]
- 38.West D.B., Waguespack J., McCollister S. Dietary obesity in the mouse: interaction of strain with diet composition. Am. J. Physiol. 1995;268:R658–R665. doi: 10.1152/ajpregu.1995.268.3.R658. [DOI] [PubMed] [Google Scholar]
- 39.Buettner R., Schölmerich J., Bollheimer L.C. High-fat diets: modeling the metabolic disorders of human obesity in rodents. Obes. Silver Spring Md. 2007;15:798–808. doi: 10.1038/oby.2007.608. [DOI] [PubMed] [Google Scholar]
- 40.Wong S.K., Chin K.-Y., Suhaimi F.H., Fairus A., Ima-Nirwana S. Animal models of metabolic syndrome: a review. Nutr. Metab. 2016;13 doi: 10.1186/s12986-016-0123-9. [DOI] [PMC free article] [PubMed] [Google Scholar]
- 41.Pancani T., Anderson K.L., Brewer L.D., Kadish I., DeMoll C., Landfield P.W., Blalock E.M., Porter N.M., Thibault O. Effect of high-fat diet on metabolic indices, cognition, and neuronal physiology in aging F344 rats. Neurobiol. Aging. 2013;34:1977–1987. doi: 10.1016/j.neurobiolaging.2013.02.019. [DOI] [PMC free article] [PubMed] [Google Scholar]
- 42.Shimada M., Mochizuki K., Sakurai N., Goda T. Dietary Supplementation with Epigallocatechin Gallate Elevates Levels of Circulating Adiponectin in Non-Obese Type-2 Diabetic Goto-Kakizaki Rats. Biosci. Biotechnol. Biochem. 2007;71:2079–2082. doi: 10.1271/bbb.70174. [DOI] [PubMed] [Google Scholar]
- 43.Wan R., Ahmet I., Brown M., Cheng A., Kamimura N., Talan M., Mattson M.P. Cardioprotective Effect of Intermittent Fasting is Associated with an Elevation of Adiponectin Levels in Rats. J. Nutr. Biochem. 2010;21:413–417. doi: 10.1016/j.jnutbio.2009.01.020. [DOI] [PMC free article] [PubMed] [Google Scholar]
- 44.Zhang W., Liu C.-Q., Wang P.-W., Sun S.-Y., Su W.-J., Zhang H.-J., Li X.-J., Yang S.-Y. Puerarin improves insulin resistance and modulates adipokine expression in rats fed a high-fat diet. Eur. J. Pharmacol. 2010;649:398–402. doi: 10.1016/j.ejphar.2010.09.054. [DOI] [PubMed] [Google Scholar]
- 45.Zhu M., Miura J., Lu L.X., Bernier M., DeCabo R., Lane M.A., Roth G.S., Ingram D.K. Circulating adiponectin levels increase in rats on caloric restriction: the potential for insulin sensitization. Exp. Gerontol. 2004;39:1049–1059. doi: 10.1016/j.exger.2004.03.024. [DOI] [PubMed] [Google Scholar]
- 46.Asterholm I.W., Scherer P.E. Enhanced metabolic flexibility associated with elevated adiponectin levels. Am. J. Pathol. 2010;176:1364–1376. doi: 10.2353/ajpath.2010.090647. [DOI] [PMC free article] [PubMed] [Google Scholar]
- 47.Yamamoto Y., Hirose H., Saito I., Tomita M., Taniyama M., Matsubara K., Okazaki Y., Ishii T., Nishikai K., Saruta T. Correlation of the adipocyte-derived protein adiponectin with insulin resistance index and serum high-density lipoprotein-cholesterol, independent of body mass index, in the Japanese population. Clin. Sci. Lond. Engl. 1979. 2002;103:137–142. doi: 10.1042/cs1030137. [DOI] [PubMed] [Google Scholar]
- 48.Hokanson J.E. Hypertriglyceridemia and risk of coronary heart disease. Curr. Cardiol. Rep. 2002;4:488–493. doi: 10.1007/s11886-002-0112-7. [DOI] [PubMed] [Google Scholar]
- 49.Millán J., Pintó X., Muñoz A., Zúñiga M., Rubiés-Prat J., Pallardo L.F., Masana L., Mangas A., Hernández-Mijares A., González-Santos P., Ascaso J.F., Pedro-Botet J. Lipoprotein ratios: Physiological significance and clinical usefulness in cardiovascular prevention. Vasc. Health Risk Manag. 2009;5:757–765. [PMC free article] [PubMed] [Google Scholar]
- 50.Ballantyne C.M. Low-density lipoproteins and risk for coronary artery disease. Am. J. Cardiol. 1998;82:3Q–12Q. doi: 10.1016/s0002-9149(98)00769-3. [DOI] [PubMed] [Google Scholar]
- 51.Ascaso J., Gonzalez Santos P., Hernandez Mijares A., Mangas Rojas A., Masana L., Millan J., Pallardo L.F., Pedro-Botet J., Perez Jimenez F., Pintó X., Plaza I., Rubiés J., Zúñiga M. Management of dyslipidemia in the metabolic syndrome: recommendations of the Spanish HDL-Forum. Am. J. Cardiovasc. Drugs Drugs Devices Interv. 2007;7:39–58. doi: 10.2165/00129784-200707010-00004. [DOI] [PubMed] [Google Scholar]
- 52.Genest J., Frohlich J., Fodor G., McPherson R. Working Group on Hypercholesterolemia and Other Dyslipidemias, Recommendations for the management of dyslipidemia and the prevention of cardiovascular disease: summary of the 2003 update. CMAJ Can. Med. Assoc. J. J. Assoc. Medicale Can. 2003;169:921–924. [PMC free article] [PubMed] [Google Scholar]
- 53.Westwood I.M., Kawamura A., Fullam E., Russell A.J., Davies S.G., Sim E. Structure and mechanism of arylamine N-acetyltransferases. Curr. Top. Med. Chem. 2006;6:1641–1654. doi: 10.2174/156802606778108979. [DOI] [PubMed] [Google Scholar]
- 54.McDonagh E.M., Boukouvala S., Aklillu E., Hein D.W., Altman R.B., Klein T.E. PharmGKB Summary: Very Important Pharmacogene information for N-acetyltransferase 2. Pharmacogenet. Genomics. 2014;24:409–425. doi: 10.1097/FPC.0000000000000062. [DOI] [PMC free article] [PubMed] [Google Scholar]
- 55.Zelber-Sagi S., Ivancovsky-Wajcman D., Fliss Isakov N., Webb M., Orenstein D., Shibolet O., Kariv R. High red and processed meat consumption is associated with non-alcoholic fatty liver disease and insulin resistance. J. Hepatol. 2018;68:1239–1246. doi: 10.1016/j.jhep.2018.01.015. [DOI] [PubMed] [Google Scholar]
- 56.Zhang Q.-H., Yin R.-X., Huang F., Yang D.-Z., Lin W.-X., Pan S.-L. Association between the PINX1 and NAT2 polymorphisms and serum lipid levels. Oncotarget. 2017;8:114081–114094. doi: 10.18632/oncotarget.23123. [DOI] [PMC free article] [PubMed] [Google Scholar]
- 57.Manning A.K., Hivert M.-F., Scott R.A., Grimsby J.L., Bouatia-Naji N., Chen H. A genome-wide approach accounting for body mass index identifies genetic variants influencing fasting glycemic traits and insulin resistance. Nat. Genet. 2012;44:659–669. doi: 10.1038/ng.2274. [DOI] [PMC free article] [PubMed] [Google Scholar]
- 58.Sclafani A., Gorman A.N. Effects of age, sex, and prior body weight on the development of dietary obesity in adult rats. Physiol. Behav. 1977;18:1021–1026. doi: 10.1016/0031-9384(77)90006-3. [DOI] [PubMed] [Google Scholar]
- 59.Schemmel R., Mickelsen O., Tolgay Z. Dietary obesity in rats: influence of diet, weight, age, and sex on body composition. Am. J. Physiol. 1969;216:373–379. doi: 10.1152/ajplegacy.1969.216.2.373. [DOI] [PubMed] [Google Scholar]
- 60.Huang K.-P., Ronveaux C.C., Knotts T.A., Rutkowsky J.R., Ramsey J.J., Raybould H.E. Sex differences in response to short-term high fat diet in mice. Physiol. Behav. 2020;221:112894. doi: 10.1016/j.physbeh.2020.112894. [DOI] [PMC free article] [PubMed] [Google Scholar]
- 61.Taraschenko O.D., Maisonneuve I.M., Glick S.D. Sex differences in high fat-induced obesity in rats: Effects of 18-methoxycoronaridine. Physiol. Behav. 2011;103:308–314. doi: 10.1016/j.physbeh.2011.02.011. [DOI] [PubMed] [Google Scholar]
- 62.Palmisano B.T., Zhu L., Eckel R.H., Stafford J.M. Sex differences in lipid and lipoprotein metabolism. Mol. Metab. 2018;15:45–55. doi: 10.1016/j.molmet.2018.05.008. [DOI] [PMC free article] [PubMed] [Google Scholar]
- 63.Mayes J.S., Watson G.H. Direct effects of sex steroid hormones on adipose tissues and obesity. Obes. Rev. Off. J. Int. Assoc. Study Obes. 2004;5:197–216. doi: 10.1111/j.1467-789X.2004.00152.x. [DOI] [PubMed] [Google Scholar]
- 64.Shi H., Strader A.D., Sorrell J.E., Chambers J.B., Woods S.C., Seeley R.J. Sexually different actions of leptin in proopiomelanocortin neurons to regulate glucose homeostasis. Am. J. Physiol. Endocrinol. Metab. 2008;294:E630–E639. doi: 10.1152/ajpendo.00704.2007. [DOI] [PubMed] [Google Scholar]
- 65.McQueen C.A., Chau B. Neonatal ontogeny of murine arylamine N-acetyltransferases: implications for arylamine genotoxicity. Toxicol Sci. 2003;73:279–286. doi: 10.1093/toxsci/kfg086. [DOI] [PubMed] [Google Scholar]
Associated Data
This section collects any data citations, data availability statements, or supplementary materials included in this article.