Summary
“Dysbiosis” of the maternal gut microbiome, in response to challenges such as infection1, altered diet2 and stress3 during pregnancy, has been increasingly associated with abnormalities in offspring brain function and behavior4. However, whether the maternal gut microbiome influences neurodevelopment during critical prenatal periods and in the absence of environmental challenge is poorly understood. Here we investigate how depletion and selective reconstitution of the maternal gut microbiome influences fetal neurodevelopment in mice. Embryos from antibiotic-treated and germ-free dams exhibit reduced expression of genes related to axonogenesis, deficient thalamocortical axons and impaired thalamic axon outgrowth in response to cell-extrinsic factors. Gnotobiotic colonization of microbiota-depleted dams with a limited consortium of bacteria prevents abnormalities in fetal brain gene expression and thalamocortical axonogenesis. Metabolomic profiling reveals that the maternal microbiota regulates numerous small molecules in the maternal serum and brains of fetal offspring. Select microbiota-dependent metabolites promote axon outgrowth from fetal thalamic explants. Moreover, maternal supplementation with the metabolites abrogates deficiencies in fetal thalamocortical axons. Manipulation of the maternal microbiome and microbial metabolites during pregnancy yields adult offspring with altered tactile sensitivity in two aversive somatosensory behavioral tasks, with no overt differences in many other sensorimotor behaviors. Altogether, these findings reveal that the maternal gut microbiome promotes fetal thalamocortical axonogenesis, likely by signaling of microbially modulated metabolites to neurons in the developing brain.
The microbiome is an important modulator of brain function and behavior4. Animals reared devoid of microbial colonization (germ-free, GF) or depleted of the microbiome (antibiotic-treated, ABX) exhibit altered neurophysiology and behavior compared to conventionally-colonized (specific pathogen-free, SPF) controls. Only a subset of phenotypes can be corrected by restoring the microbiome postnatally, suggesting a role for the maternal gestational microbiome in regulating developmental processes that impact brain function and behavior in adulthood. Indeed, the gut microbiome is required for mediating adverse effects of maternal challenges, such as immune activation1, high fat diet2 and psychosocial stress3, on neurobehavioral abnormalities in mice. It remains unclear, however, whether such microbial influences on neurodevelopment originate antenatally, via disrupted function of the maternal microbiota, and/or postnatally, via vertically transmitted alterations in the neonatal microbiota5. Moreover, while existing studies report that the maternal microbiome can modulate host responses to acute insults, whether it impacts offspring development in the absence of environmental challenges requires investigation. Herein, we examine roles for the maternal gut microbiome during homeostasis in regulating early embryonic brain development and later-life behavior of the offspring.
Maternal microbiota promote axonogenesis
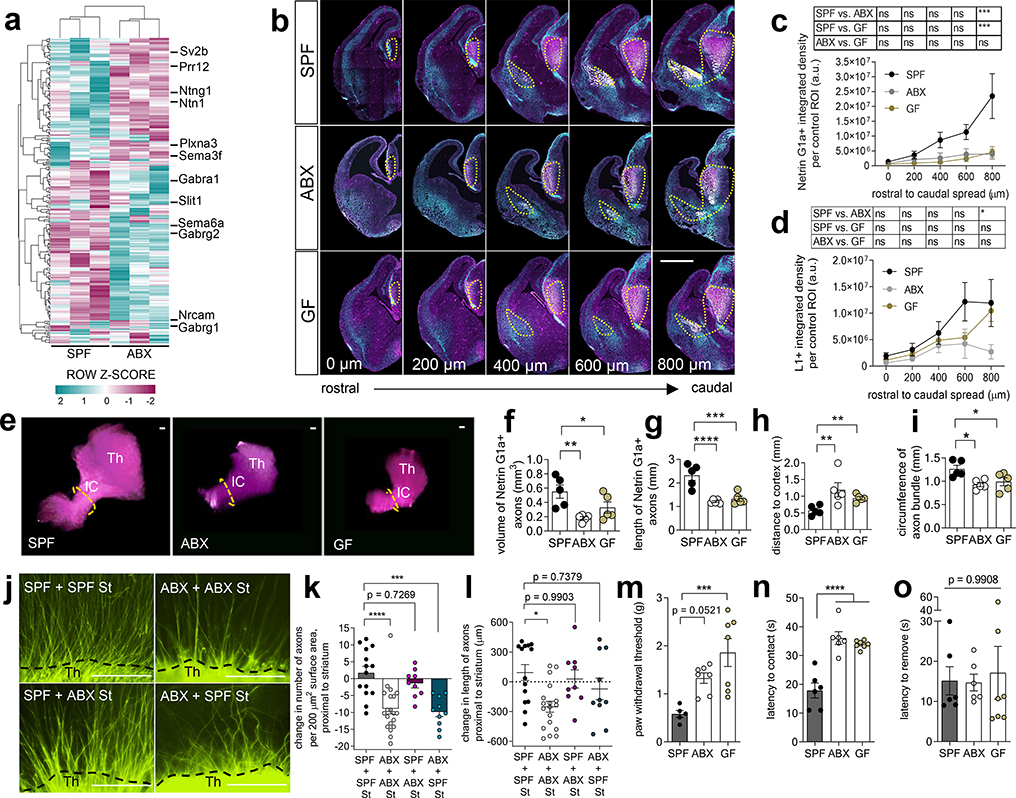
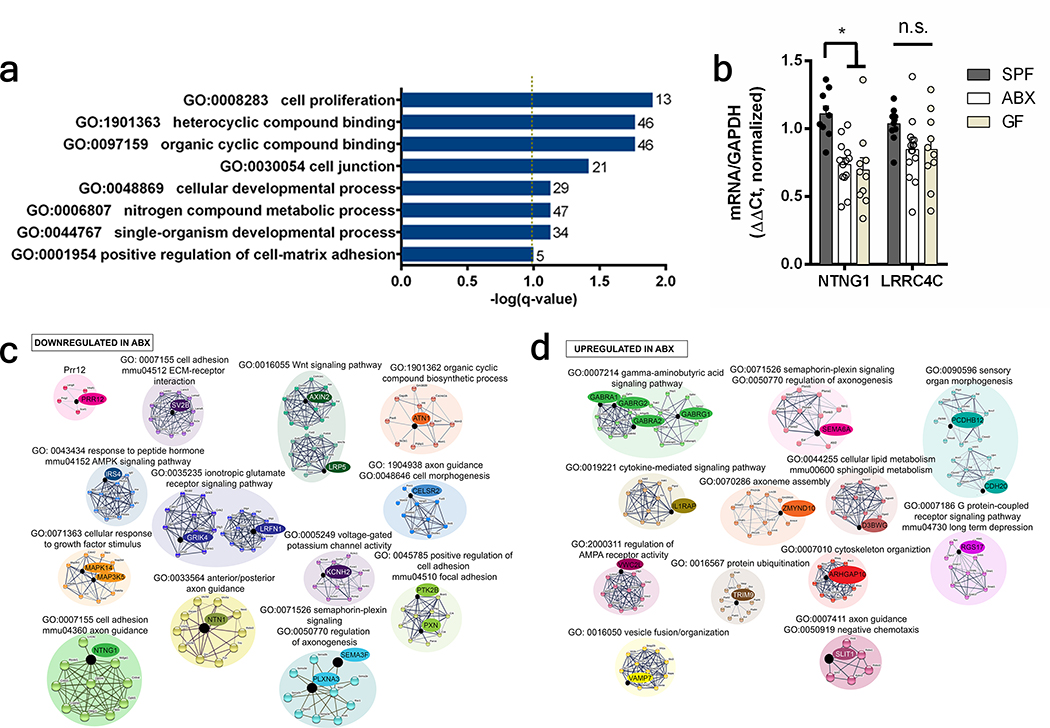
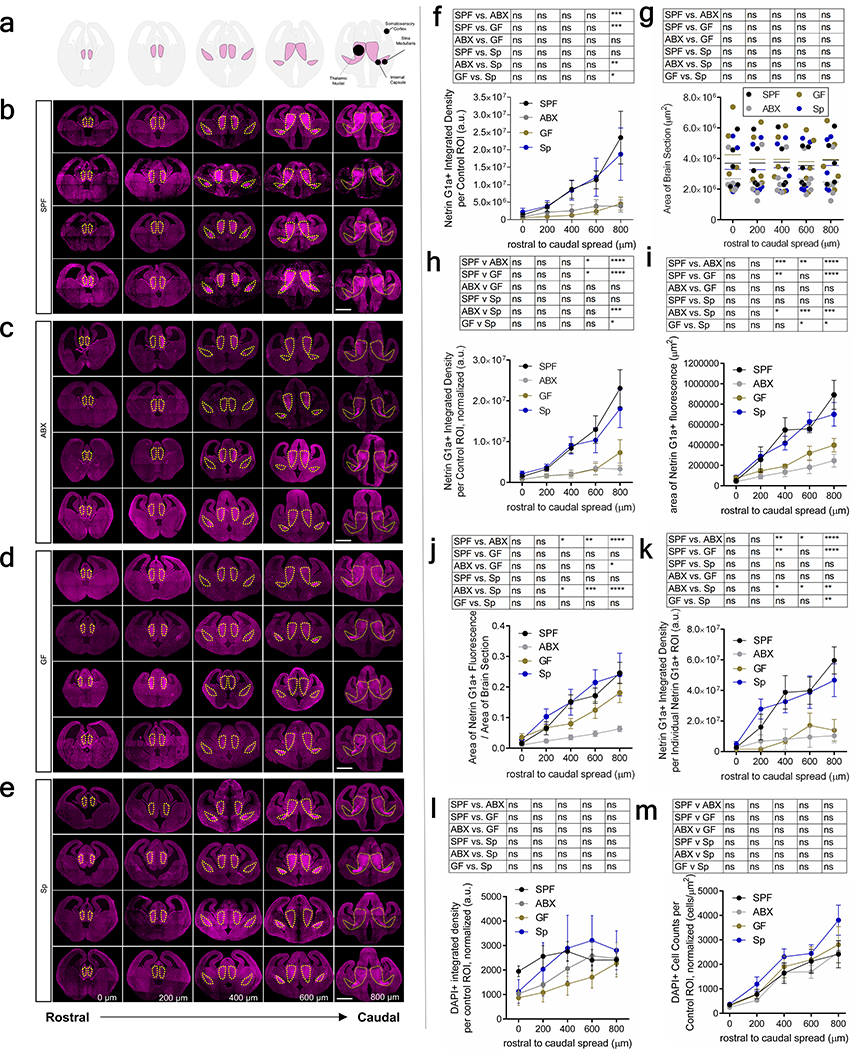
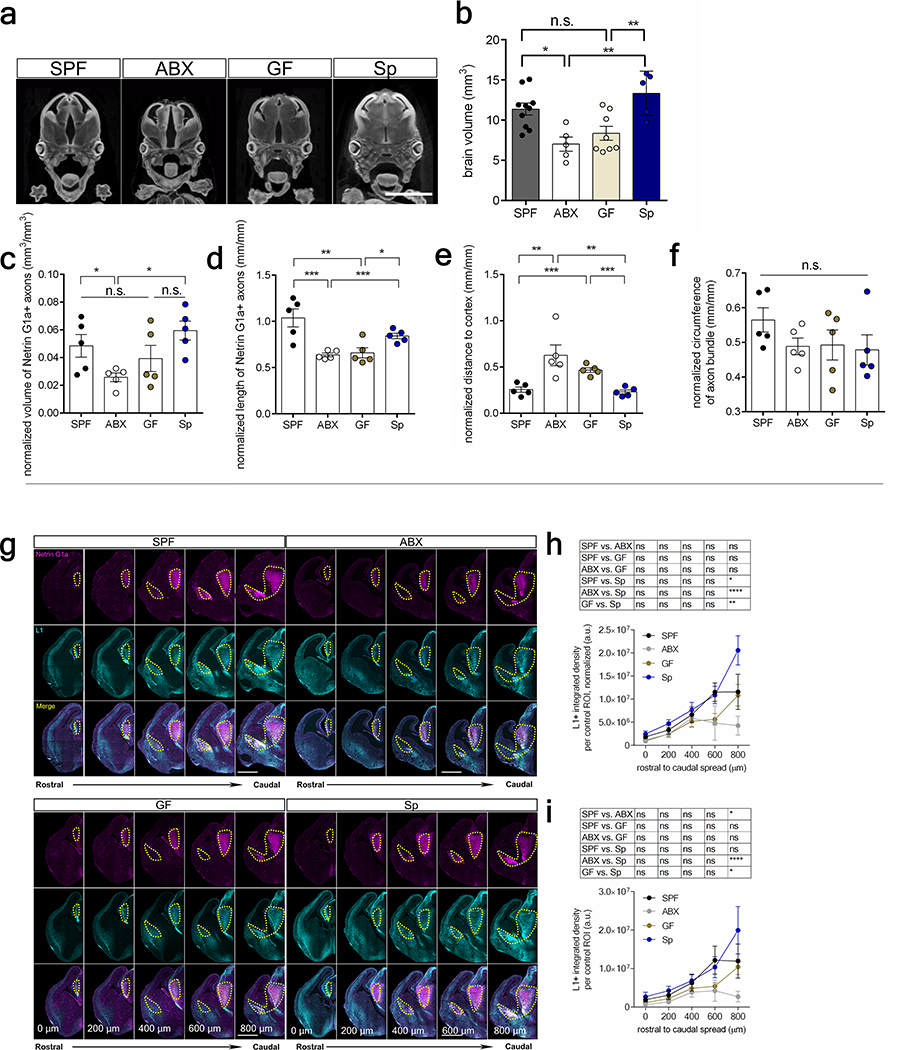
To determine whether the maternal microbiome influences fetal neurodevelopment, we first examined fetal brains from offspring of murine dams that were reared SPF, GF, or treated with ABX to deplete the maternal microbiome from pre-conception through midgestation. Depletion of the maternal microbiome altered the expression of 333 genes in fetal brains of E14.5 embryos, including many involved in axonogenesis (Fig. 1a, Supplementary Table 1, Extended Data Fig. 1a, c–d). Netrin-G1a (NTNG1), a glycosylphosphatidylinositol-tethered protein expressed by developing thalamocortical axons6, was downregulated in fetal brains from offspring of ABX and GF dams (Fig. 1a, Extended Data Fig. 1b). Consistent with reductions in NTNG1 transcript, fetal brains from E14.5 offspring of ABX and GF dams exhibited reduced Netrin-G1a+ immunoreactivity localized to thalamocortical axons (Fig. 1b–c, Extended Data Fig. 2a–k, Supplementary Discussion). Evaluation of Netrin-G1a+ thalamocortical axons in cleared whole brains similarly revealed decreased axonal volume and length in E14.5 offspring from microbiome-depleted dams (Fig. 1e–i). The alterations in Netrin-G1a+ were maintained after normalizing the data to observed reductions in whole brain volume, suggesting that decreases in Netrin-G1a are not solely a function of variations in brain size (Extended Data Fig. 3a–f, Supplementary Discussion). Fetal brains from ABX offspring also displayed decreased neural cell adhesion molecule L1, a pan-axonal marker (Fig. 1b, d, Extended Data Fig. 3g–i), with no significant differences in DAPI-positive cell counts in the thalamus (Extended Data Fig. 2l, m). This suggests that reductions in Netrin-G1a reflect decreases in thalamocortical projections, rather than diminished receptor expression on existing axons or the absence of thalamic neurons themselves. Overall, results from these experiments suggest that the maternal microbiome is required to support fetal thalamocortical axonogenesis in the developing mouse offspring.
Fig. 1|. Depletion of the maternal microbiome impairs fetal thalamocortical axonogenesis.
a, Differentially-expressed genes in E14.5 brains from SPF and ABX dams (Two-tailed Wald, p<0.05, n=3 dams). Axonogenesis-related genes are highlighted. b, Netrin-G1a (magenta) and L1 (cyan) in E14.5 brains from SPF, ABX and GF dams. Scale=500 μm. Yellow lines=control ROIs. c, Netrin-G1a fluorescence per matched control ROI in E14.5 brain sections. (Two-way ANOVA+Tukey’s, n=5 offspring from different dams). d, L1 fluorescence per matched control ROI in E14.5 brain sections (Two-way ANOVA+Tukey’s, n=5 offspring from different dams). e, Netrin-G1a in whole E14.5 brains. Scale=100μm. Th=thalamus, IC=internal capsule. Dotted line=axon bundle circumference. In whole E14.5 brains, Netrin-G1a+ axonal: f, volume, g, length, h, distance from rostral tip to cortex, and i, circumference of the bundle at internal capsule. (SPF-ABX: One-way ANOVA+Tukey’s, SPF-GF: one-tailed Mann-Whitney, n=5 offspring from different dams). j, TUJ1+ axons from i) SPF Th+SPF St, ii) ABX Th+ABX St, iii) SPF Th+ABX St, iv) ABX Th+SPF St. Scale=250 μm. k, Axons/200 μm2 surface area proximal to St, normalized to Th monoculture. (Two-way ANOVA+Tukey’s, n=14, 20, 9, 10). l, Length of thalamic axons proximal to St, normalized to Th monoculture. (Two-way ANOVA+Tukey’s, n=14, 20, 9, 10). Behavior in adult offspring of SPF, ABX, and GF dams: m, force filament to induce 50% paw withdrawal (One-way ANOVA+Tukey’s, n = 5, 7, 7 dams), n, latency to contact the adhesive (One-way ANOVA+Tukey’s, n = 6, 6, 7 dams), and o, latency to remove the adhesive after first contact (One-way ANOVA+Tukey’s, n = 6, 6, 7 dams). Mean±SEM, *p<0.05, **p<0.01, ***p<0.001, ****p<0.0001, n.s.=not statistically significant.
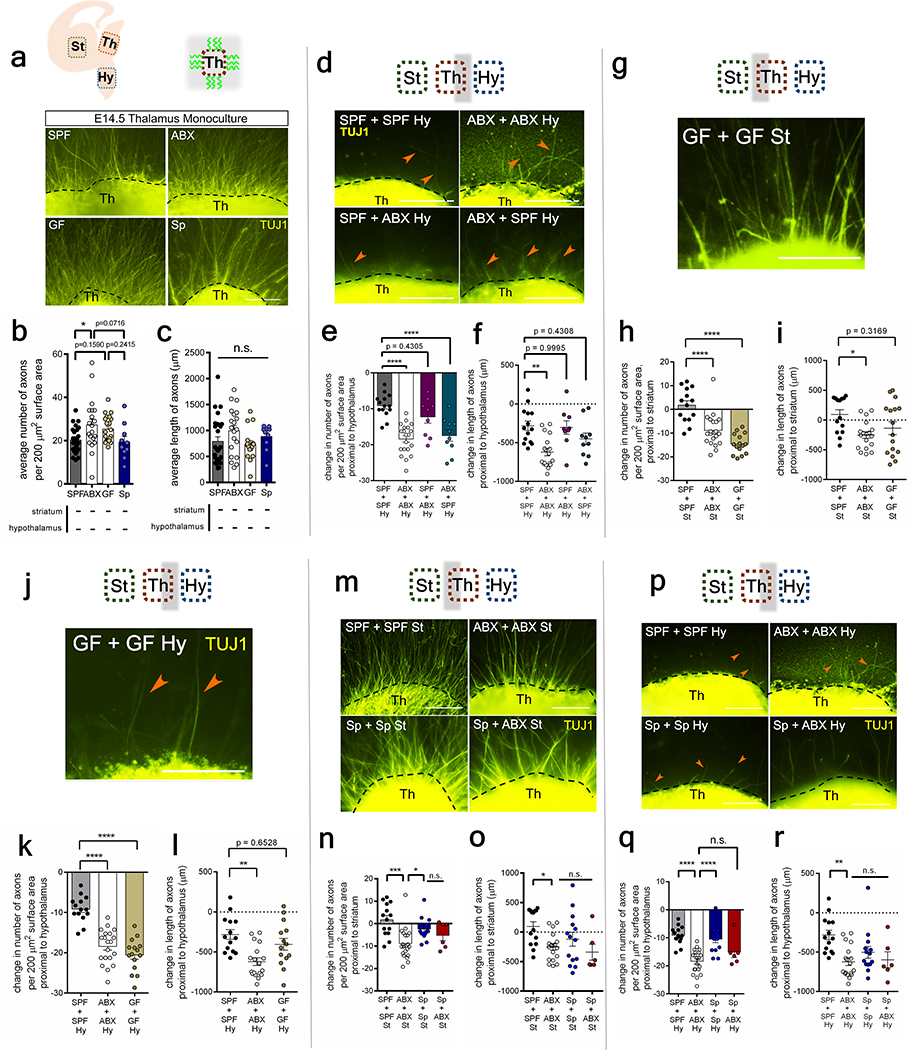
Axonogenesis involves cell intrinsic and extrinsic factors that work in concert to direct axon polarity, elongation and pathfinding. To determine whether the reductions in Netrin-G1a+ thalamocortical axons seen in response to maternal microbiome depletion were due to impaired axon formation, deficient axon guidance, or both, we cultured thalamic explants, either alone or in the presence of endogenous cues from striatal and hypothalamic explants7. Monoculture of thalamic explants from E14.5 offspring of either SPF or ABX dams resulted in substantial axon outgrowth (Extended Data Fig. 4a–c), suggesting that the reductions in Netrin-G1a+ axons seen in embryos of microbiome-depleted dams are not due to an intrinsic inability of the thalamus to form or elongate axons. Indeed, thalamic neurons from embryos of ABX dams generated increased numbers of axons, with no significant difference in axon length, as compared to SPF controls (Extended Data Fig. 4a–c); this suggests enhanced capacity for axon formation, but not elongation, in fetal thalamic neurons from ABX dams that are grown in rich media. However, in response to co-culture with fetal striatal and hypothalamic explants from ABX dams, fetal thalamic neurons from embryos of ABX dams exhibited impaired axon outgrowth, with decreased number and length of axons as compared to co-cultured control explants from SPF mothers (Fig. 1j–l, white vs. black). These abnormalities in cue-regulated axonal outgrowth were observed for thalamic axons proximal to the striatal explant (Fig. 1j–l, white vs. black), which produces growth-promoting and attractive guidance cues8, as well as axons proximal to the hypothalamic explant (Extended Data Fig. 4d–f, white vs. black), which produces growth-inhibiting and repulsive guidance cues9. Analogous deficits in the number of axons, but not length of axons, were seen in fetal thalamic explants from GF dams (Extended Data Fig. 4g–l). These discrepancies could be due to confounding effects of maternal GF rearing or ABX exposure. Taken together, these results indicate that fetal thalamic neurons from E14.5 offspring of microbiota-deficient dams display impaired axon outgrowth when co-cultured with corresponding striatal and hypothalamic explants, but not when grown alone in monoculture. This suggests that depletion of the maternal microbiome disrupts fetal thalamic responses to tissue-derived factors in mice.
To gain further insight into whether depletion of the maternal microbiome alters tissue-derived cues to impair axon outgrowth, fetal thalamic explants from embryos of SPF or ABX dams were co-cultured with striatal and hypothalamic explants from the contrasting experimental group. When thalamic explants from embryos of SPF dams were co-cultured with striatal and hypothalamic explants from embryos of ABX dams, there were no significant differences in the number or length of axons from SPF thalamic neurons (Fig. 1j–l; purple vs. black; Extended Data Fig. 4d–f). This suggests that ABX tissue-derived factors sufficiently support axon outgrowth from SPF thalamic neurons. In contrast, when thalamic explants from embryos of ABX dams were co-cultured with striatal and hypothalamic explants from embryos of SPF dams, ABX thalamic neurons exhibited deficiencies in axon outgrowth, at levels similar to those seen in response to co-culture with ABX tissues (Fig. 1j–l, Extended Data Fig. 4d–f; teal vs. white). This suggests that endogenous soluble factors from SPF explants are not sufficient to correct impairments in axon outgrowth from ABX thalamic neurons, and that ABX thalamic neurons display incorrect responses to factors from SPF tissues. Such thalamus-intrinsic alterations in responsivity to cues could be attributed to erroneously repulsive responses to attractive guidance cues10, hyperresponsiveness to repulsive cues11 and/or cue-induced disruptions in thalamic responses to neurotrophic factors present in the culture media12. Overall, these findings indicate that tissue-derived cues are necessary but not sufficient for mediating maternal microbiota-dependent reductions in thalamic axonogenesis and further suggest that depletion of the maternal microbiome impairs the complex interactions between intrinsic and extrinsic factors that regulate responses of fetal thalamocortical neurons to axonogenic cues in mice.
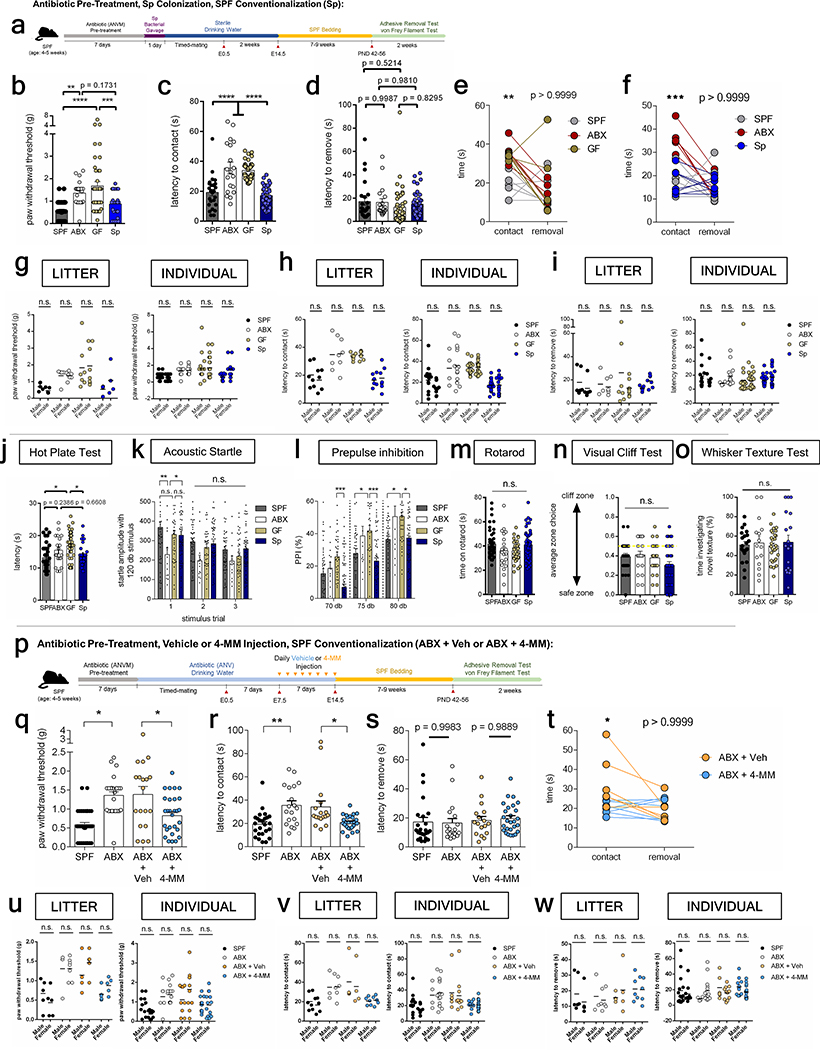
Thalamocortical axons are guided to the somatosensory cortex, where they form dense synaptic contacts with neurons to mediate sensory processing13. To gain insight into whether microbiome-induced alterations in fetal thalamocortical axonogenesis confer lasting influences on offspring behavior, SPF dams were treated with ABX or vehicle from pre-conception through E14.5, and then re-colonized with SPF microbiota for the remainder of gestation through postnatal development (Extended Data Fig. 5, Supplementary Table 2). Conventionalized adult offspring of GF, ABX- or vehicle- treated dams were tested in a battery of sensory behavioral tasks (Fig. 1m–o, Extended Data Fig. 6, Supplementary Table 3). In the von Frey filament test for hindpaw sensorimotor function14, adult offspring of ABX and GF dams required increased force thresholds for paw withdrawal in response to hindpaw stimulation compared to control offspring from SPF dams (Fig. 1m, Extended Data Fig. 6b, g), suggesting impaired tactile sensation. Consistent with this, in the adhesive removal test for forepaw sensorimotor function15, adult offspring of ABX and GF dams exhibited increased latency to detect and contact the forepaw stimulus compared to control offspring from SPF dams (Fig. 1n, Extended Data Fig. 6c, e, h). There was no difference in the time to remove the adhesive after first contact, suggesting that ABX and GF offspring exhibit deficient paw tactile sensation, but no disruption in motor response (Fig. 1o, Extended Data Fig. 6d–e, i). Adult offspring of GF dams also exhibited modest alterations in thermosensory behavior16 and acoustic sensorimotor behavior17 (Extended Data Figure 6j–l). The phenotypes were inconsistent between GF and ABX conditions, suggesting nuanced developmental effects that differ between chronic GF rearing and acute ABX exposure. Notably, there were no apparent differences between ABX, GF and control SPF offspring in tests for visual sensory behavior18, vibrissae sensory perception19 and motor coordination20 (Extended Data Fig. 6m–o). This suggests that there is some specificity of maternal microbial effects to adult tactile sensory circuits. This may be attributed to selective recovery of thalamocortical circuits for other sensory modalities, however there is need for more sensitive behavioral assays to adequately quantify abnormalities in other sensory modalities, and/or to test the possibility that the observed sensory behavioral phenotypes are due to microbiome-dependent defects elsewhere in the nervous system, aside from thalamocortical neurons. Altogether, these results demonstrate that depletion of the maternal gut microbiota during early to mid-gestation in mice impairs fetal thalamocortical axonogenesis and yields adult offspring with disrupted neurobehavioral responses to forepaw and hindpaw tactile stimuli.
Select bacteria prevent axonal defects
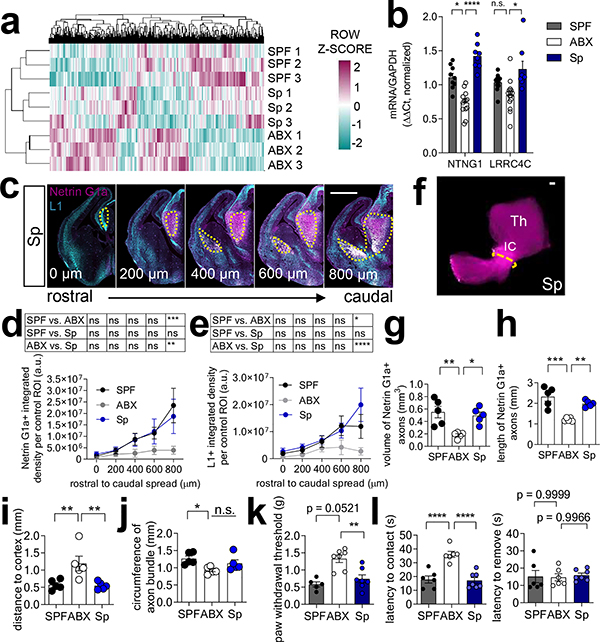
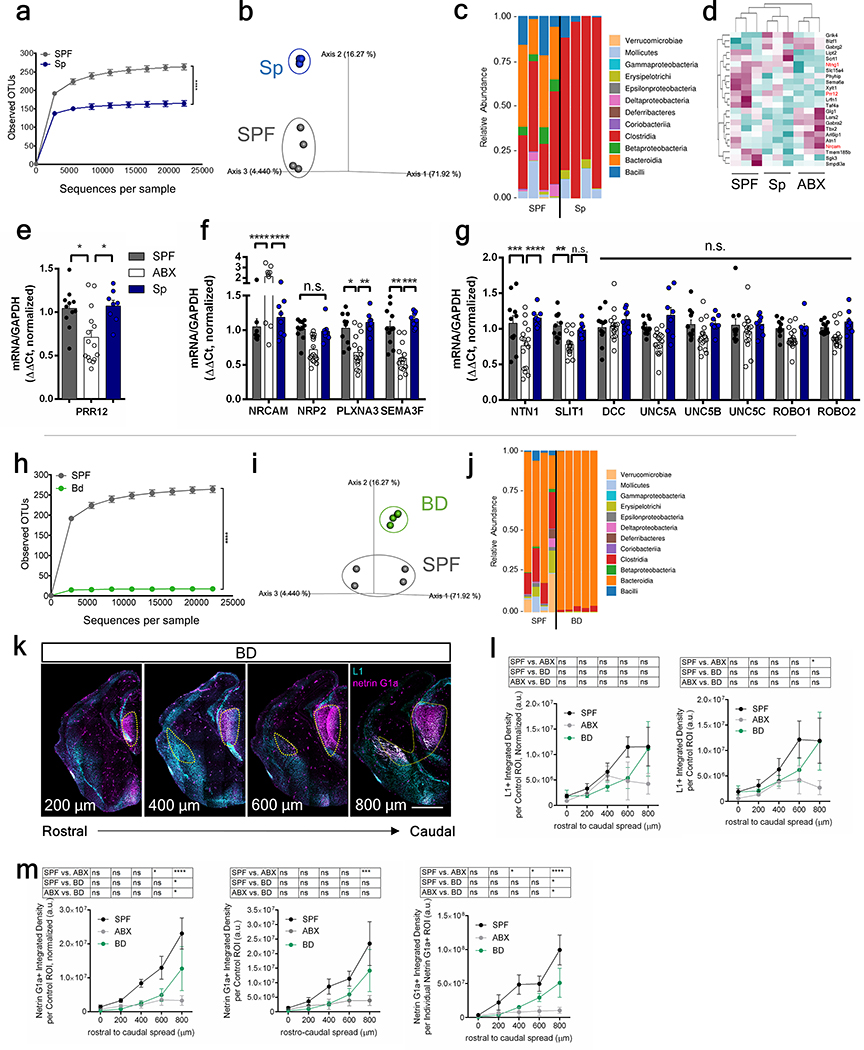
The gut microbiota is comprised of various microbial taxa that exhibit differential interactions with host physiology. To determine whether the effects of the maternal microbiota on offspring neurodevelopment and behavior are mediated by particular bacteria, we colonized ABX-treated dams during pre-conception with bacterial consortia representing the two dominant phyla--Firmicutes and Bacteroidetes (Extended Data Fig. 7a–c, h–j, Supplementary Tables 4 and 5). Colonization of ABX dams with Clostridia-dominant spore-forming bacteria (Sp) abrogated many adverse effects of maternal microbiota depletion on fetal brain gene expression and thalamocortical axonogenesis (Fig. 2a, Extended Data Fig. 7d–g, Supplementary Table 1). Reductions in NTNG1 expression and Netrin-G1a+ thalamocortical axons were prevented by maternal colonization with Sp (Fig. 2b–j, Extended Data Fig. 1). In contrast, maternal colonization with a consortium of Bacteroides species (BD) conferred only a modest increase in Netrin-G1a+ thalamocortical axons and no effect on L1+ thalamocortical axons (Extended Data Fig. 7k–m). Maternal BD colonization yielded fecal microbiota with ~95% relative abundance of Bacteroides spp. and ~5% of an OTU mapping to C. difficile, which may also contribute to this partial restoration (Extended Data Fig. 7h–m and Supplementary Table 5). Fetal thalamic explants from E14.5 embryos of Sp-colonized dams exhibited increased axon outgrowth compared to ABX controls (Extended Data Fig. 4m–r). Deficiencies in paw tactile sensory behavior were prevented by maternal colonization with Sp (Fig. 2k–l, Extended Data Fig. 6a–i). Overall, these findings suggest that certain bacterial taxa, including Sp in particular, are sufficient to prevent the adverse effects of maternal microbiome deficiency on fetal thalamocortical axonogenesis and offspring tactile sensory behavior in mice.
Fig. 2|. Colonization of the maternal microbiota prevents neurodevelopmental abnormalities induced by microbiome depletion.
a, Differentially expressed genes in E14.5 brains of SPF, ABX, and Sp dams (Two-tailed Wald, n=3 dams). b, NTNG1 and LRRC4C expression in E14.5 brains (Two-way ANOVA+Tukey’s, n=9, 13, 8 offspring from different dams). c, Netrin-G1a (magenta) and L1 (cyan) in E14.5 Sp brain sections. Scale=500μm. d, Netrin-G1a fluorescence per matched ROI in E14.5 brain sections. (Two-way ANOVA+Tukey’s, n=5 offspring from different dams). e, L1 fluorescence per matched ROI in E14.5 brain sections (Two-way ANOVA+Tukey’s, n= 5 offspring from different dams). f, Netrin-G1a in whole E14.5 brains from Sp dams. Scale=100μm. g, Volume of Netrin-G1a axons in whole E14.5 brains. (One-way ANOVA+Tukey’s; n= 5 offspring from different dams). h, Length of Netrin-G1a axons in whole E14.5 brains. (One-way ANOVA+Tukey’s; n= 5 offspring from different dams). i, Distance from distal tip of Netrin-G1a axons to cortex in whole E14.5 brains. (One-way ANOVA+Tukey’s; n= 5 offspring from different dams). j, Circumference of Netrin-G1a axonal bundle at the internal capsule (IC) in whole E14.5 brains. (One-way ANOVA+Tukey’s; n= 5 offspring from different dams). k, Force filament to induce 50% paw withdrawal in adult offspring (One-way ANOVA+Tukey’s, n = 5, 7, 7 dams). l, Forepaw sensitivity, as latency to contact the adhesive tape, in adult offspring (left) (One-way ANOVA+Tukey’s, n = 6, 6, 7 dams). Forepaw motor dexterity, as latency to remove the adhesive tape after first contact, in adult offspring (right) (One-way ANOVA+Tukey’s, n = 6, 6, 7 dams). Mean±SEM. SPF and ABX data are as displayed in Figure 1, 2 and Extended Figure 2, 3, 4. *p<0.05, **p<0.01, ***p<0.001, ****p<0.0001, n.s.=not statistically significant
Maternal microbes shape fetal metabolome
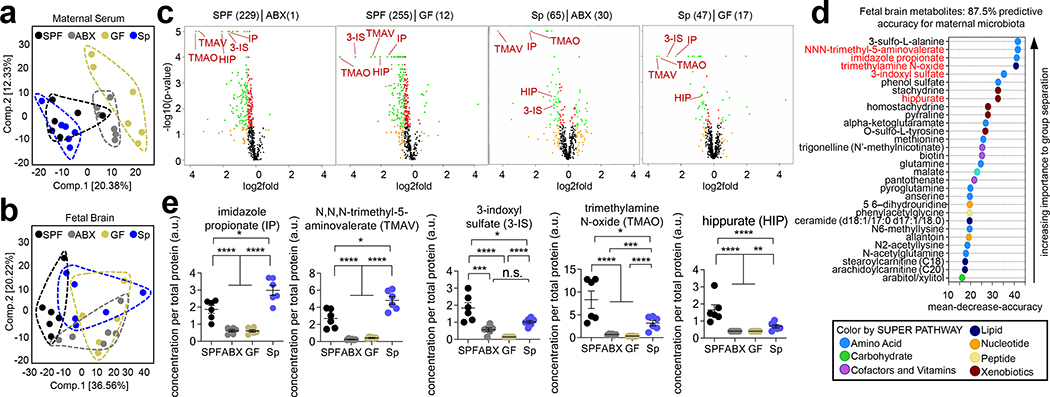
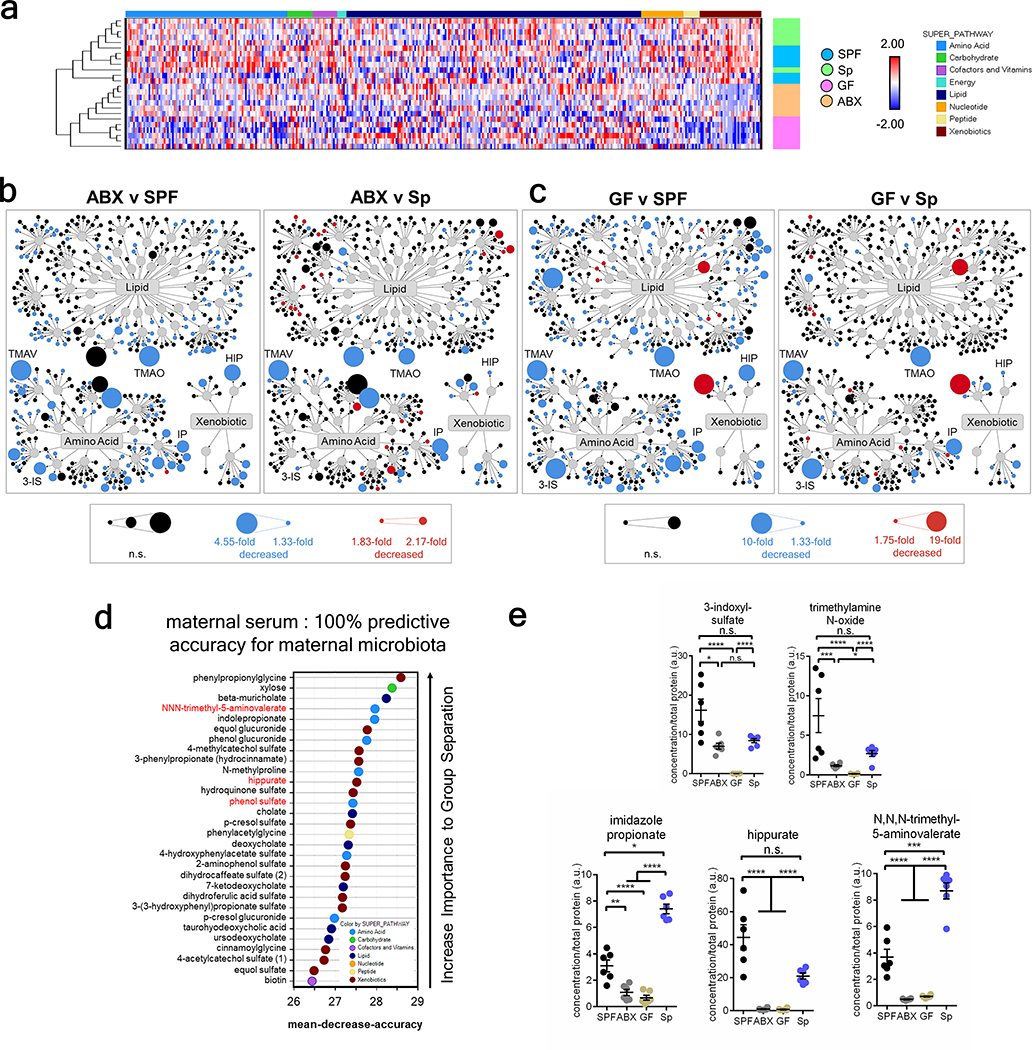
The gut microbiota modulates the bioavailability of hundreds of biochemicals in the circulating blood21. During pregnancy, nutrients and growth factors from the maternal blood nurture offspring growth, which is particularly important for the permeable22 and rapidly developing fetal brain23. Based on our finding that the maternal microbiome is important for regulating murine fetal neurodevelopment, we hypothesized that the maternal microbiota regulates circulating metabolites and thereby conditions metabolite profiles in the fetus. To investigate this, biochemicals were profiled in maternal sera and fetal brain lysates from SPF, ABX, GF and Sp dams on E14.5. 753 metabolites were identified in maternal sera and 567 in fetal brain lysates (Supplementary Tables 6 and 7). Maternal serum metabolomic profiles from SPF and Sp dams were more similar compared to those from GF and ABX dams (Fig. 3a, Extended Data Fig. 8a, d–e). This suggests that Sp colonization recapitulates many effects of the SPF microbiota on maternal biochemical profiles, and aligns with the phenotypic similarities between offspring of ABX and GF dams versus SPF and Sp dams in fetal axonogenesis and adult tactile sensory behavior. Brain lysates from E14.5 embryos of microbiome-depleted dams also exhibited altered metabolite profiles relative to those from SPF and Sp dams (Fig. 3b–e, Extended Data Fig. 8b–c, Supplementary Table 6). 30 fetal brain metabolites were predictive with 87.5% accuracy of maternal SPF and Sp versus ABX and GF microbiota status (Fig. 3d). 22 metabolites were similarly and significantly decreased in fetal brain lysates from ABX and GF dams relative to both SPF and Sp dams (Supplementary Table 7). Of these 22 fetal brain metabolites, 8 were similarly differentially regulated in maternal sera from ABX and GF dams compared to SPF and Sp controls (Supplementary Table 7), suggesting that the maternal microbiota modulates the bioavailability of these metabolites in maternal blood with direct effects on the bioavailability of the same metabolites in fetal brain. These findings reveal that the maternal microbiota regulates biochemical profiles and select metabolites in the fetal brains of developing offspring.
Fig. 3|. The maternal microbiota modulates maternal serum and fetal brain metabolites during pregnancy.
a, Principal component analysis of maternal serum metabolomes from SPF, ABX, GF, and Sp dams on E14.5 (n = 6 dams) b, Principal component analysis of 567 metabolites detected in fetal brain metabolomes from E14.5 offspring of SPF, ABX, GF, and Sp dams (n = 6 embryos from different dams). c, Significantly regulated E14.5 fetal brain metabolites. Orange=log2fold>0.5. Red=p<0.05. Green=log2fold>0.5 and p<0.05 (One-way ANOVA with FDR contrasts, n=6 embryos from different dams). d, Random Forest classification of top 30 metabolites in E14.5 fetal brain that discriminate between SPF and Sp dams vs. ABX and GF dams. Red= >2-fold decrease in ABX and GF vs. SPF and Sp (n=6 embryos from different dams). e, Select metabolites significantly decreased in E14.5 fetal brains from embryos of ABX and GF dams versus SPF and Sp dams. (One-way ANOVA with FDR contrasts, n=6 embryos from different dams). Mean±SEM. *q<0.05, **q<0.01, ***q<0.001, ****q<0.0001, n.s. = not statistically significant.
Select metabolites promote axonogenesis
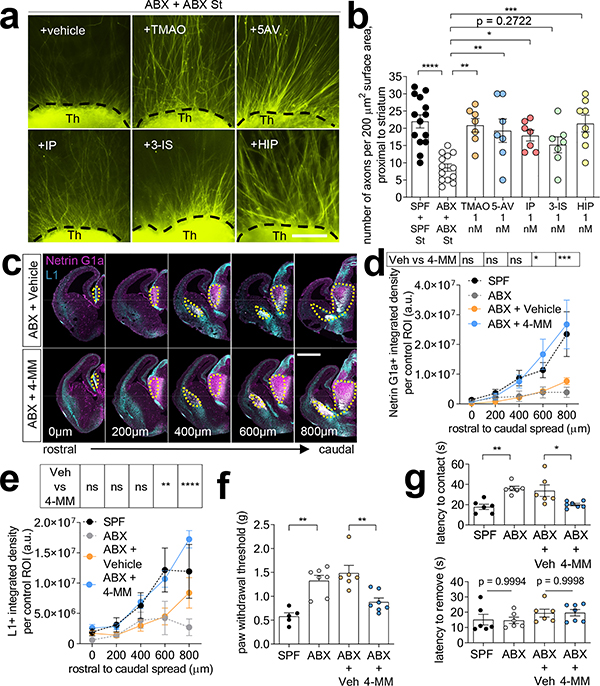
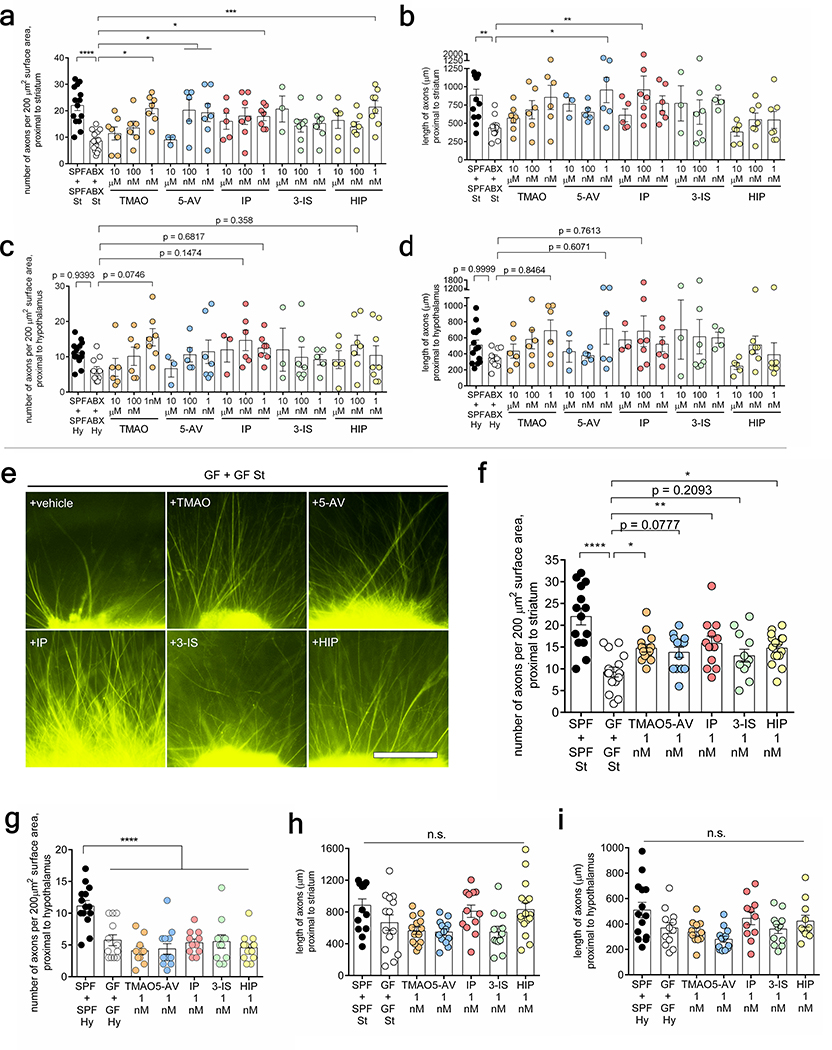
To determine whether particular metabolites mediate the ability of the maternal microbiome to promote fetal thalamocortical axonogenesis in mice, thalamic explants from E14.5 embryos of ABX-treated dams were exposed to select metabolites and evaluated for axon outgrowth. The metabolites trimethylamine-N-oxide (TMAO), N, N, N-trimethyl-5-aminovalerate (TMAV), imidazole propionate (IP), 3-indoxyl sulfate (3-IS) and hippurate (HIP) were selected based on their >2-fold reduction in both maternal blood and fetal brain from ABX and GF dams, relative to SPF controls, and their significant elevations by maternal colonization with Sp (Fig. 3e, Extended Data Fig. 10f). Additionally, each metabolite is regulated in adult stool, blood and/or prefrontal cortex by the gut microbiota21,24,25. Fetal thalamic explants harvested from E14.5 embryos of ABX dams exhibited impaired axonogenesis in response to co-culture with ABX striatal and hypothalamic explants (Fig. 1j–l). Exposure to murine concentrations of TMAO, 5-aminovalerate (5-AV, a reported precursor to TMAV), IP or HIP, but not 3-IS, significantly increased axon numbers to levels seen in fetal brain explants from embryos of SPF dams (Fig. 4a–b, Extended Data Fig. 9a). 5-AV and IP also increased axon length, whereas TMAO and 3-IS induced modest, but not statistically significant increases, and HIP had no effect (Extended Data Fig. 9b). Similar responses were seen with thalamic explants from GF dams, where TMAO, IP and HIP increased axon outgrowth (Extended Data Fig. 9e–i). No significant changes were found in number and length of ABX thalamic axons proximal to the hypothalamus (Extended Data Fig. 9c–d).
Fig. 4|. The maternal microbiota modulates metabolites that promote fetal thalamocortical axonogenesis.
a, Axon outgrowth from ABX thalamic explants proximal to ABX striatal explant, and supplemented with i) vehicle, ii) trimethylamine N-oxide (TMAO, 1 nM) iii) 5-aminovalerate (5-AV, 1 nM), iv) imidazole propionate (IP, 1 nM), v) 3-indoxyl-sulfate (3-IS, 1 nM) or vi) hippurate (HIP, 1 nM). Scale= 250μm. b, Number of axons per 200 μm2 surface area proximal to striatal explant (One-way ANOVA+Tukey’s, n=14, 13, 7, 7, 7, 7, 8). c, Netrin-G1a (magenta) and L1 (cyan) in E14.5 brain sections from ABX dams treated with vehicle or 4-microbial metabolites (4-MM: TMAO, 5-AV, IP, and HIP). Scale= 500 μm. d, Netrin-G1a per matched ROI (yellow lines) in E14.5 brain sections of vehicle- or 4-MM-treated ABX dams. (Two-way ANOVA+Tukey’s, n= 8 offspring from different dams). e, L1 per matched ROI in E14.5 brain sections from vehicle or 4-MM-treated ABX dams. (Two-way ANOVA+Tukey’s, n=8 offspring from different dams). f, Force filament to induce 50% paw withdrawal in adult offspring of SPF, ABX, ABX+Veh, and ABX+4-MM dams (One-way ANOVA+Tukey’s, n=5, 7, 6, 7 dams). g, Latency to contact the adhesive in adult offspring of SPF, ABX, ABX+Veh, ABX+4-MM dams (top) (One-way ANOVA+Tukey’s, n = 6, 6, 6, 7 dams). Latency to remove the adhesive after first contact in offspring of SPF, ABX, and ABX+Veh, ABX+4-MM dams (bottom) (One-way ANOVA+Tukey’s, n = 6, 6, 6, 7 dams). Behavioral data for SPF and ABX as reference controls are as in Figures 2 and 3. Mean±SEM. *p<0.05, **p<0.01, ***p<0.001, ****p<0.0001, n.s.=not statistically significant.
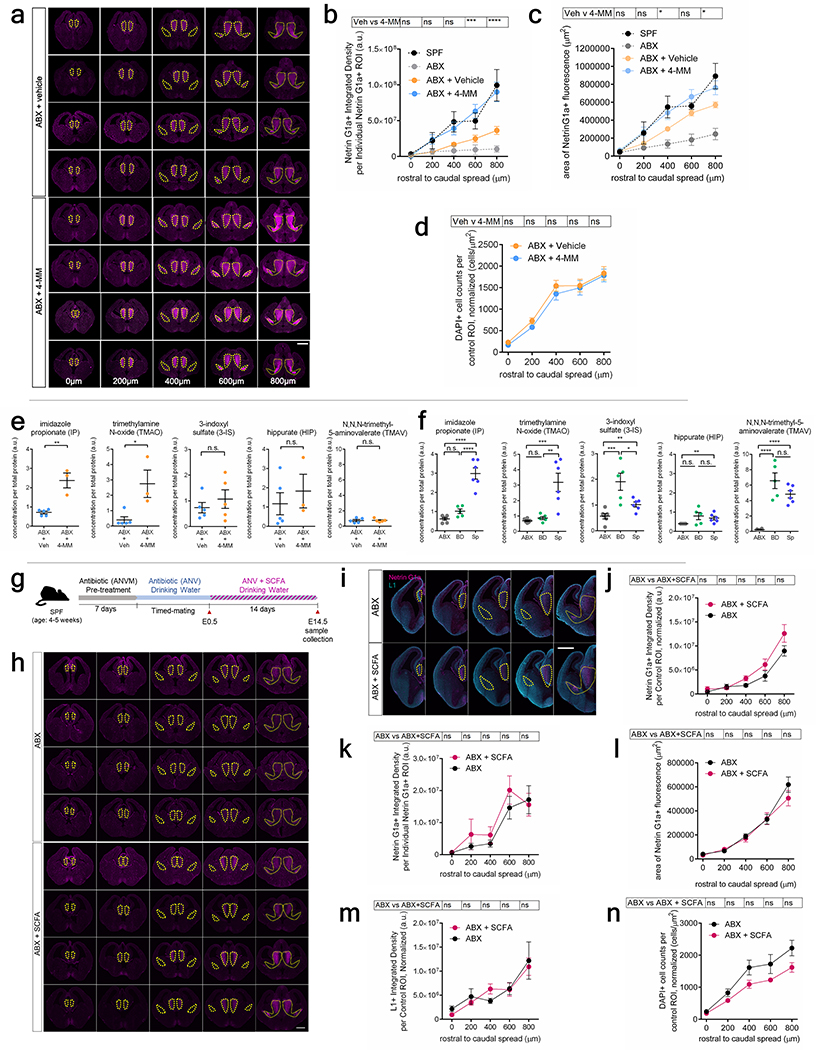
To further test whether maternal metabolite supplementation impacts fetal neurodevelopment in vivo, ABX-treated dams were injected intraperitoneally with TMAO, 5-AV, IP, and HIP (4-MM) or vehicle from E7–14 of gestation, the developmental time frame during which thalamocortical axonogenesis occurs26 (Fig. 6p). Maternal supplementation with 4-MM prevented the reductions in Netrin-G1a+ thalamocortical axons seen with maternal microbiome depletion (Fig. 4c–e, Extended Data Fig. 10a–d). In contrast, there was no significant effect of maternal supplementation with the short chain fatty acids propionate, butyrate and acetate on fetal thalamocortical axons (Extended Data Fig. 10g–n). Maternal supplementation with 4-MM significantly increased levels of TMAO and IP, but not TMAV, 3-IS or HIP, in the fetal brain, compared to vehicle-supplemented controls (Extended Data Fig. 10e). These results suggest that elevations in TMAO and IP, in particular, may mediate the effects of 4-MM on promoting thalamocortical axonogenesis in vivo. Consistent with this, maternal colonization with BD, which did not substantially promote Netrin-G1a+ thalamocortical axons (Extended Data Fig. 7k–m), had no overt effect on levels of TMAO and IP, but elevated TMAV and 3-IS in the fetal brain (Extended Data Fig. 10f). Furthermore, adult offspring of ABX dams that were supplemented with 4-MM exhibited improvements in tactile sensory behavior relative to vehicle-treated ABX controls (Fig. 4f–g, Extended Data Fig. 6p–w). Altogether, results from this study reveal that the maternal microbiome promotes fetal thalamocortical axonogenesis in mice, likely via microbiota-dependent biochemicals, such as TMAO and IP, in the fetal brain.
Discussion
The gut microbiota modulates numerous bioactive molecules in the intestine, serum and various extraintestinal organs27. Findings from this work reveal that during pregnancy, the maternal gut microbiota regulates metabolites, not only in the maternal compartment, but also in the fetus itself, including the fetal brain. Select fetal brain metabolites that are regulated by the maternal gut microbiota induce axon outgrowth from mouse thalamic explants and promote fetal thalamocortical axonogenesis in offspring of microbiome-depleted dams. While the molecular mechanisms underlying the effects of select microbial metabolites on neurons remain unclear, some metabolites, such as TMAO, TMAV and HIP, have been associated with neurological conditions and factors related to neurite outgrowth (Supplementary Discussion). In addition, findings from this study parallel evidence that malnutrition-induced alterations in the maternal microbiome were associated with reduced white matter in the brains of adolescent and adult offspring28–31, and that inflammation-induced alterations in the maternal gut microbiota disrupted somatosensory cortical architecture in adult mouse offspring32. Furthermore, a recent study of microbiomes in malnourished children reported dysregulation of several proteins associated with axonogenesis, which were ameliorated by treatment with microbiota-directed diets33. Several large epidemiological studies associate maternal infection and use of antibiotics with increased risk for neurodevelopmental complications in the offspring34,35. However, whether these effects in humans may be mediated by alterations in the maternal microbiome remain unclear. Results presented herein support an important role for the maternal microbiome in promoting offspring neurodevelopment, and further suggest that interactions between the microbiome and nervous system begin prenatally through influences of the maternal gut microbiota on fetal brain metabolomic profiles and gene expression. Altogether, findings from this study identify early to mid-gestation as a critical period during which the maternal microbiome promotes fetal neurodevelopment to support developmental processes that may underlie later-life behaviors in mice.
Methods
Data generated and analyzed during this study are included in this published article and its supplementary information files.
Mice
C57Bl/6J mice were purchased from Jackson Laboratories, reared as SPF or rederived as GF, and bred in flexible film isolators at the UCLA Center for Health Sciences barrier facility. Animals were maintained on a 12-h light-dark schedule in a temperature (22–25°C)- and humidity-controlled environment with autoclaved “breeder” chow (Lab Diets 5K52) and standard chow (Lab Diet 5010) and autoclaved water provided ad libitum.
Sample size determination
6–8 week-old mice were randomly assigned to experimental groups, which included age- and sex-matched cohorts of males and females for timed matings. Given that maternal microbiome status is the primary experimental variable across experiments, biological sample sizes reflect independent dams. Experiments evaluating fetal outcomes include at least 2 randomly selected embryos per dam, where data from offspring from a single dam were averaged to represent the dam as the biological “n”. For behavioral assays, all offspring were behaviorally tested and data from offspring from the same dam were averaged to represent the dam as the biological “n”. These data are presented in the main figures, whereas behavioral data per individual offspring are presented in supplementary figures. All experiments were performed in accordance with the NIH Guide for the Care and Use of Laboratory Animals using protocols approved by the Institutional Animal Care and Use Committee at UCLA.
Antibiotic treatment and conventionalization
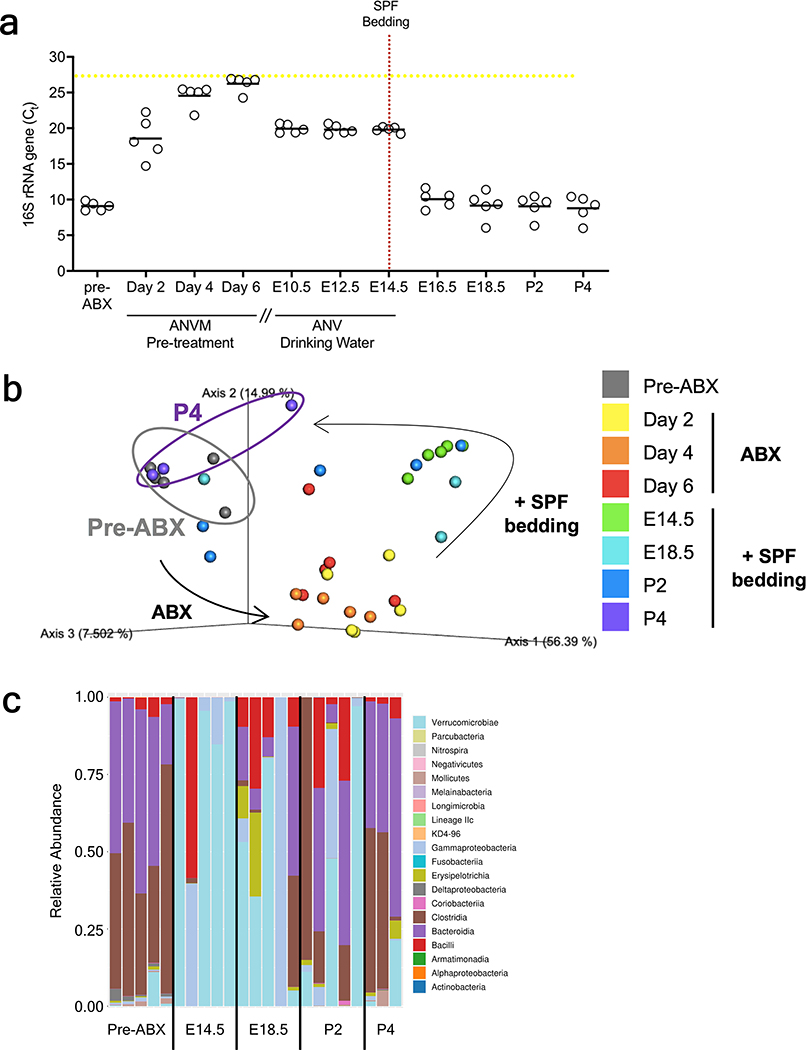
4–5 week old SPF mice were gavaged twice daily (08:00 and 17:00) for 1 week with a cocktail of neomycin (100 mg/kg), metronidazole (100 mg/kg), and vancomycin (50 mg/kg), based on methods previously described to mimic GF status36. Ampicillin (1 mg/ml) was provided ad libitum in drinking water. Breeders were then paired and time-mated, where up to 2 additional weeks were required to conception. Gestational day 0.5 was determined by observation of copulation plug. Dams were then separated and maintained on ABX drinking water until E14.5 to preclude the daily stress of oral gavage in pregnant dams (1 mg/ml ampicillin, 1 mg/ml neomycin, and 0.5 mg/ml vancomycin; metronidazole was excluded due to its confounding bitter taste). Fecal samples from ABX-treated dams were collected and plated anaerobically on Schaedler’s broth and tryptic soy agar to confirm bacterial clearance. For behavioral assays, pregnant dams were conventionalized at E14.5 with SPF bedding that was gathered from a male and female C57Bl/6J cage37. Pregnant dams were maintained in SPF bedding for the remainder of gestation, and offspring were reared with SPF bedding, added weekly, until behavioral testing. Conventionalization was validated by fecal 16S rRNA gene sequencing and qPCR quantification of 16S rRNA gene loads, as described below. This method of gestational conventionalization of the microbiota restored fecal bacterial loads to SPF levels within 2 days and restored taxonomic diversity of the microbiota to SPF conditions by P4.
Gnotobiotic colonization
Mice were treated with ABX as described in the “antibiotic treatment” section above, then given sterile water and orally gavaged 1 day later with Sp or BD bacteria. Sp-colonized mice were generated as previously described38. Briefly, fecal pellets from C57Bl/6J SPF mice were freshly suspended in a 10X volume of pre-reduced PBS in an anaerobic chamber. Chloroform was added to 3% (vol/vol), the sample was shaken vigorously and incubated at 37°C for 1 hr. Chloroform was removed by percolation with CO2 from a compressed cylinder. 200 ul of the resultant suspension was orally gavaged into adult GF C57Bl/6J “founder” mice housed in designated gnotobiotic isolators. Fecal samples were collected from the Sp mice at >2 weeks after gavage and suspended at 50 mg/ml in pre-reduced PBS. 200 ul of the suspension was orally gavaged to ABX-treated experimental mice. For the Bacteroides (BD) consortium, B. thetaiotaomicron (ATCC 29148), B. vulgatus (ATCC 8482) and B. uniformis (ATCC 8492), B. ovatus (ATCC 8483) and B. fragilis (NCTC 9343) were grown in Brain Heart Infusion media (BD Biosciences) supplemented with 5 μg/ml hemin (Frontier Scientific) and 0.5 μg/ml vitamin K1 (Sigma Aldrich) under anaerobic conditions. A 200 μl suspension of 1:1:1:1:1 OD of each strain was orally gavaged into ABX-treated mice. Colonization status was validated by 16S rRNA gene sequencing of fecal samples collected on E14.5, as described below.
Fetal brain RNA sequencing
Dams were sacrificed on E14.5 by cervical dislocation to preclude confounding effects of CO2 on maternal and fetal physiology. Embryonic brains were dissected from SPF, ABX, and Sp colonized mice and placed in Trizol (Invitrogen). RNA was extracted using the RNAeasy Mini kit with on-column genomic DNA-digest (Qiagen), and cDNA synthesis was performed using the qScript cDNA synthesis kit (Quantabio). RNA quality of RIN > 8.0 was confirmed using the 4200 Tapestation system (Agilent). RNA was prepared using the TruSeq RNA Library Prep kit and 2 × 69 bp paired-end sequencing was performed using the Illumina HiSeq 4000 platform by the UCLA Neuroscience Genomics Core. FastQC v0.11.8 and HiSAT2 2.1.039,40 were used for quality filtering and mapping. Reads were aligned to UCSC Genome Browser assembly ID: mm10. Differential expression analysis was conducted using DESeq2 1.24.041. Heatmaps were generated using the pheatmap v1.0.12 package for R. GO term enrichment analysis of differentially expressed genes with q < 0.05 was conducted using DAVID v6.842. Protein interaction networks were generated using STRING v10.5 using a minimum required interaction score of high confidence (0.700) and maximum number of interactions of no more than 10 interactors. Functional enrichments nodes were categorized by GO: biological process, molecular function, and cellular component and/or KEGG pathways using a false discovery rate (FDR) less than 0.05.
Quantitative RT-PCR
Dams were sacrificed on E14.5 by cervical dislocation to preclude confounding effects of CO2 on maternal and fetal physiology. Embryonic brains were dissected and sonicated in Trizol for RNA isolation using the RNAeasy Mini kit with on-column genomic DNA-digest (Qiagen). cDNA synthesis was performed using the qScript cDNA synthesis kit (Quantabio). qRT-PCR was performed on a QuantStudio 5 thermocycler (ThermoFisher Scientific) using SYBR green master mix with Rox passive reference dye and validated primer sets obtained from Primerbank (Harvard).
Immunofluorescence staining
E14.5 embryos were fixed in 4% paraformaldehyde for 24 hrs at 4°C, cryoprotected in 30% sucrose 24 hrs at 4°C and sectioned at 10 μm using a Leica CM1950 cryostat. Sections were blocked with 10% donkey serum for 1 hr. Primary antibodies were diluted in 3% donkey serum and incubated for 15–18 hrs at 4°C with Netrin-G1a anti-goat antibody (1:100, R&D Systems, AF1166) or Neural Cell Adhesion Molecule L1 anti-rat antibody (1:500, EMD Millipore, MAB5272). Sections were then incubated for 2 hrs at room temperature in their corresponding donkey anti-goat and anti-rat secondary antibodies conjugated to Alexa Fluor 568 or 488 (1:1000, Thermofisher Scientific). Images were acquired using the Zeiss Axio Examiner LSM 780 confocal microscope with 405nm (2%), 488nm (5%), and 561nm (8%) lasers. Rostral to caudal embryonic brain sections were scanned using Zen Blue and Black Edition 2012 software, 20X objective at 1.5X zoom with 5 × 1μm interval z-slices and 3 individual tracks for each fluorescent dye. Image acquisition settings included: scan mode set at frame, frame size set at 1024 X 1024, scan speed set at 7, averaging at 2 by line and mean, and bit depth set at 8 bit. Pinhole was set to 1AU.
Image analysis
All images of rostral to caudal embryonic brain sections were modified through the same procedures. Images were imported into Fiji, calibrated using a set scale, and adjusted by process > noise > despeckle, to remove non-specific staining, and brightness and contrast settings of 0 minimum and 255 maximum. Whole brain area was measured by manually tracing along the border of each rostral to caudal anatomical brain section (0, 200, 400, 600, and 800 μm). To quantify Netrin-G1a+ or L1+ integrated density per control ROI, a “control ROI” was defined as the median area of Netrin-G1a staining across SPF control samples for each rostral to caudal brain section (see Extended Figure 2a). Control ROIs for each rostral to caudal image were saved and superimposed onto corresponding rostral to caudal images from all other experimental groups. Integrated density was measured for Netrin-G1a, L1, and DAPI staining in each experimental group (SPF, ABX, GF, Sp, BD, ABX+Veh, ABX+4-MM, and ABX+SCFA). To address variation in imaging background, Netrin-G1a+ or L1+ integrated density was normalized by subtracting the average background integrated density, which was measured from four non-overlapping background ROIs of fixed area that were placed on matched NetrinG1a-negative cortical and hypothalamic areas in both brain hemispheres of the same section and scaled for size of control ROIs. To normalize Netrin-G1a+ or L1+ fluorescence to differences in brain area, a scaling factor was calculated for each image as the mean SPF brain area per rostral to caudal image divided by the brain area for corresponding images for each experimental group. Data for Netrin-G1a fluorescence intensity were multiplied by this scaling factor for each experimental group per rostral to caudal section to generate values normalized for differences in gross brain size. DAPI+ cells were manually counted within matched thalamic areas of the control ROI and similarly normalized to respective rostral to caudal area of brain section. To measure intensity of Netrin-G1a staining, localized areas of Netrin-G1a+ fluorescence were manually traced for each rostral to caudal image for each experimental group. The localized areas for each image were used as unique individual ROIs of Netrin-G1a+ staining to measure integrated density.
Tissue clearing and imaging
E14.5 embryos were collected and fixed in 4% paraformaldehyde for 48 hours at 4°C. Tissue was rendered transparent using methods for CLARITY-based clearing43 with the following modifications. Tissues were incubated in a hydrogel solution containing 4% paraformaldehyde, 4% acrylamide (Bio-Rad), 0.05% bis-acrylamide (Bio-Rad), 0.25% VA-044 (A4P4B0.05) for 3 days at 4°C. Prior to hydrogel polymerization, the solution was exchanged with new solution lacking bis-acrylamide and paraformaldehyde (A4P04) and polymerized at 37°C for 3 hrs. Samples were passively cleared in 8% SDS for 2 weeks at 42°C, and then incubated with primary antibodies (Netrin-G1a anti-goat (1:100, R&D Systems, AF1166) and L1 anti-rat (1:500, EMD Millipore, MAB5272)) for 1 week at 25°C. Samples were washed and then incubated in secondary antibodies (1:1000, Thermofisher Scientific) for 5 days at 25°C. Samples were equilibrated for 15–18 hrs in a histodenz-based refractive index matching solution (RI 1.47; Sigma Aldrich, D2158) and imaged on a Zeiss LSM 780 with 488 or 561 nm illumination using a 5× objective with 3 um z-slices. Image acquisition settings on the Zen Black 2012 software included: scan mode set at frame, frame size set at 512 X 512, scan speed set to 7, averaging of 2 by line and mean, and bit depth set to 8 bit. Pinhole was set to 1AU.
Images were adjusted for brightness and contrast post hoc with three automated image filter operations in Arivis Vision4D v3.0: 1) denoising to remove noise in the image based on a median filter with a smoothing radius of 2, 2) membrane enhancement to enhance the contrast of dimly labeled axons based on a target membrane width of 0.3 μm and a max gap size of 0.2 μm, and 3) automatic thresholding to segment axonal staining based on an intensity threshold, set by selecting range of low to high intensity pixels mapping to positively stained axonal structures. 3D reconstructions were optically z-sliced for manual 3D measurements. Quantification of stain volume was done by using the “draw objects tool” to segment and interpolate the stained area. The length of axons from the thalamus to the rostral axon tip, circumference of internal capsule and distance of rostral axon tip to cortical surface was measured by using the 3D polyline tool to track object in 2D and measure the entire length of object in 3D. Rostral axon tip was defined as the edge of Netrin-G1a staining and cortical surface was defined by the outermost edge of autofluorescence. Positively stained areas of interest were segmented and visualized using CTAn and CTVol software packages (Bruker Corporation), respectively. Netrin-G1a volume (mm3) was normalized to whole brain volume (mm3) determined by quantification from microcomputed tomography. Length of axons, circumference of internal capsule, and distance of rostral axon tip to cortical surface (mm) was normalized to cubic root of whole brain volume (mm).
Microcomputed tomography
Whole embryos were serially dehydrated in ethanol and incubated in 4% (w/v) phosphotungstic acid (EPTA) diluted in 70% EtOH for 4 days at 4°C. Embryos were scanned at 60kVp/150μA with a 1mm Al filter at a resolution of 8μm using a benchtop μCT scanner (SkyScan 1275, Bruker). 2-dimensional images were reconstructed following dynamic range adjustment using gaussian smoothing, a ring artefact reduction of 10, and a defect pixel mask of 8%. Regions of interest (ROI) for brain volume measurements were selected manually, and EPTA-stained tissue was segmented based on contrast to give a final brain volume measurement (mm3) within the ROI. Whole brain volumes reconstructed and measured using CTAn and CTVol software (Bruker Corporation).
Axon outgrowth assay
Dams were sacrificed on E14.5 by cervical dislocation to preclude confounding effects of CO2 on maternal and fetal physiology. Thalamic, striatal, and hypothalamic explants were isolated from E14.5 embryonic brains and transferred to ice-cold HBSS (Invitrogen). Explants were sliced to ~500 μm and placed on a thin layer of 50 μl BD Matrigel (Beckton Dickinson) on a 15 mm coverslip. Each coverslip contained a thalamic explant at the center and a striatal and hypothalamic explant on each side, at 1 mm equidistant from the thalamic explant. Explants were incubated in warmed neurobasal complete media containing 1X neurobasal medium (Thermofisher Scientific), 1X GlutaMax (Thermofisher Scientific), and 2% B-27 (Thermofisher Scientific) for 48 hrs at 37°C, and fed with fresh media every 24 hrs. After 48 hrs, media was gently aspirated and replaced with 4% PFA for 1 hr and processed for immunofluorescence staining with 1:500 β tubulin III anti-mouse antibody (EMD Millipore MAB1637). Axons were imaged using a Leica DMi8 epifluorescence microscope with LasX software and quantified using Fiji software44. Images were calibrated using a set scale. Fluorescence images were made binary (grayscale) and “skeletonized” to visualize axonal arbors. Axon numbers were manually counted per 200 μm of thalamus at a distance of 200 μm from the thalamus. Length of the 10 longest axons across a ~500 μm perimeter proximal to the striatum or the hypothalamus were manually traced from the soma to the furthest distal tip using the Fiji freehand tool. Values were averaged for each explant to report length of thalamic axons. Data for number and length of axons in the explant co-culture system were normalized by subtraction of data from monoculture of thalamic explants from the corresponding experimental group.
Metabolite supplementation
Thalamic, striatal, and hypothalamic explants from ABX-treated dams were harvested and cultured as described in the “axon outgrowth assay” section above. For metabolite treatment, BD Matrigel was supplemented with 10 μM, 100 nM, or 1 nM of trimethylamine-N-oxide (TMAO), 5-aminovalerate (5-AV), imidazole propionate (IP), 3-indoxyl-sulfate (3-IS), or hippurate (HIP)45–48. 5-aminovalerate is a precursor to N,N,N-trimethyl-5-aminovalerate (TMAV), which is not commercially available, and both are implicated in carnitine metabolism49,50. Metabolite concentrations were determined as physiologically relevant, based on reported concentrations detected in blood and/or cerebrum from the mouse multiple tissue metabolomic database (MMMDB), human metabolome database (HMDB) and existing literature45–48. Axons were stained, imaged and analyzed as described in the “axon outgrowth assay” section above. There were no overt differences in the pH of metabolite solutions.
In vivo metabolite supplementation
To test the effects of TMAO, 5-AV, IP, and HIP on fetal axonogenesis and behavior, physiological concentrations of metabolites were administered intraperitoneally as a single dose per each day in order to limit stress to pregnant dams. Controls were injected with vehicle. Metabolite dosages were calculated based on maternal serum metabolomic data and physiological concentrations reported in literature to reflect daily levels needed to achieve those observed in SPF dams (see Methods section). Metabolite concentrations were calculated based on physiological levels reported in mouse blood45–48, total blood volume of pregnant mouse dams (approximately 58.5 ml/kg51), and relative reductions observed in maternal sera of ABX dams compared to SPF dams (Supplementary Table 6 and 7). The metabolite mixture (4-MM): 121 ug (TMAO), 9 ug (5-AV), 92 ug (IP), and 2 ug (HIP) in 200 ul of 0.1 M PBS was injected intraperitoneally into E7.5 ABX dams once a day for 7 days. To assess fetal thalamocortical axon levels, dams treated with 4-MM or vehicle were sacrificed on E14.5, and fetal brains were harvested and processed as described in the “immunofluorescence staining” section below. To test for behavioral effects, E14.5 pregnant dams were taken off ABX water (ANV) on E14.5, transferred into cages with sterile water, and conventionalized as described in the “conventionalization” section above. Adult offspring (P42-P56) were tested in the von Frey filament test and adhesive removal test as described in the “behavioral assay” section below.
To test whether short-chain fatty acids (SCFAs) affect embryonic axon development, the SCFAs sodium propionate (25 mM), sodium butyrate (40 mM), and sodium acetate (67.5 mM) were supplemented into drinking water of pregnant ABX dams from E0-E14.5 following reported physiological concentrations52. Supplemented drinking water was sterile-filtered and made fresh every 4 days. ABX + SCFA dams were sacrificed at E14.5 and embryonic brains were isolated and processed for “immunofluorescence staining” as described above.
Behavioral Assays
For behavioral assays, investigators were blinded to experimental groups. Animals were tested in behavioral assays between 6–10 weeks of age, beginning with the least to most stress inducing behavioral task, in the order listed below. To prevent stress as a confounding factor, each behavioral assay was performed with a 2–3 day break in between. For each behavioral test, cages were brought to the testing room at least 30 minutes before testing to enable acclimation and reduce stress. Equipment and testing chambers were thoroughly cleaned with Accel disinfectant (Unimed) before and after each trial.
Visual Cliff Avoidance Test
To assess depth perception and visual impairment3, mice were placed in a 42.5 cm × 60 cm clear plexiglass testing chamber on top of a 3 ft × 4 ft rectangular table. One third of the chamber hung over the edge of the table to create a visual effect of a cliff drop-off at a height of 3 ft. Mice were placed in the middle of the chamber 10 times. Mice were given 5 minutes to either exit off the platform towards the table or toward the cliff side of the chamber. Each choice was recorded and averaged by an experimenter blinded to mouse experimental group.
Novel Whisker Texture Test
The whisker texture test was performed according to methods adapted from Wu et al., 20132. Mice were habituated in 50 cm × 50 cm white plexiglass testing chamber for 10 minutes for 2 consecutive days. On testing day, mice were first subjected to a learning phase in which they were placed in the testing chamber for 5 minutes with two objects of identical texture (aluminum oxide sand paper, 80 grit). Mice were then returned to home cage for 5 minutes. In the test phase, mice were placed back into chamber with two objects, one with the original texture (80 grit) and one with new texture (220 grit). The trials were recorded with an overhead video camera and Ethovision XT v11.5 software (Noldus) was used to analyze number of times and duration spent investigating the novel and familiar textures.
Adhesive Removal Test
The adhesive removal test was performed according to methods adapted from Bouet et al. 200915. Briefly, mice were acclimated to the testing cage for 5 min. A small adhesive tape (0.3 cm × 0.4 cm) was gently applied to both forepaws, and mice were returned to the testing cage. Mice were observed for contact time, as defined as the latency to which the mouse reacts to the presence of the adhesive tape, and for removal time, as defined as the latency to which the mouse removes both pieces of tape completely. Contact time and removal time were manually recorded using a standard lab multi-timer by experimenters blinded to the mouse experimental group.
von Frey filament test
The von Frey filament test was performed according to methods adapted from Dixon et al., 198053. Briefly, mice were placed on a wide gauge, wire mesh surface in a testing chamber and acclimated for 10 minutes daily for two consecutive days prior to testing day. On the testing day, mice were placed in the testing chamber, acclimated for 10 minutes, and von Frey filaments were applied from the underside of the mesh to the plantar surface of the hindpaw. The process is repeated with increasing gauges (0.4, 0.6, 1, 1.4, 2, 4, 6 grams of force) of von Frey filaments until stimulation elicits a hindpaw withdrawal, wherein the mouse responds by flicking its paw away from the stimulus. Upon paw withdrawal, the next weaker stimulus is defined as threshold. Responses of up-down paw stimulation were manually recorded and analyzed according to the Chaplan Method of 50% paw withdrawal threshold14.
Hot plate Test
To test for somatic pain response1, mice were acclimated to a clear plastic cylinder for 30s, then placed on an advanced hot plate (VWR) that was heated to 52°C. The latency to show nociceptive response as indicated by a paw lick, paw flick, vocalization, or a jump was recorded, and mouse was immediately returned to the home cage.
Rotarod Test
To test for motor coordination and balance4, mice were placed in one of 4 compartments in a rotarod apparatus (Rotamex, Columbus Instruments) consisting of a cylinder that rotates speeds accelerating from 5 rpm to 60 rpm in 300 seconds. On the first day, mice acclimated to the apparatus with no rotation for 2 minutes. On the testing day, mice were returned to the apparatus and rotation was initiated. Latency to fall and final speed achieved by the accelerating rod before falling was detected by an infrared sensor and recorded. Mice were tested three times and scores were averaged.
Prepulse inhibition test
The prepulse inhibition test was performed to measure sensorimotor gating54. Mice were placed in a restraint tube mounted on a startle measuring platform (San Diego Instruments) and acclimated to the testing chamber for 10 minutes. White noise is presented in the recording chamber for 5 minutes, followed by 6 startle presentations and a pseudorandomized prepulse inhibition phase, which consisted of either no startle, 120 db startle stimulus only, or 70 db prepulse with startle, 75 db prepulse with startle, or 80 db prepulse with startle. Acoustic startle was recorded with a pliezo-electric sensory, and the percent prepulse inhibition was defined as: [((the startle stimulus only – prepulse with startle)/startle stimulus only)*100].
16S rRNA gene sequencing
Bacterial genomic DNA was extracted from mouse fecal samples using the MoBio PowerSoil Kit. Quantification of 16S rRNA gene loads were performed by qPCR using the SYBR Green master mix (Thermo Fisher), universal 16S rRNA gene primers55 and the QuantStudio 5 thermocycler (cycling parameters: 2 minutes at 50°C, 10 minutes at 95°C, 40 cycles of 10 seconds at 95°C, and 45 seconds at 62°C). Sequencing libraries were generated according to methods adapted from Caporaso et al. 201156. The V4 regions of the 16S rRNA gene were PCR amplified using individually barcoded universal primers and 30 ng of the extracted genomic DNA. The PCR reaction was set up in triplicate, and the PCR product was purified using the Qiaquick PCR purification kit (Qiagen). 250 ng of purified PCR product from each sample were pooled and sequenced by Laragen, Inc. using the Illumina MiSeq platform and 2 × 250bp reagent kit for paired-end sequencing. Deblur was used for quality control57 and operational taxonomic units (OTUs) were chosen based on 99% sequence similarity to SILVA 132. Taxonomy assignment and rarefaction were performed using QIIME258. OTUs were ordered by relative abundance with phyloseq59 and taxa bar plots were generated using Fantaxtic R package.
Metabolomics
At E14.5 maternal serum was collected by cardiac puncture, separated using SST vacutainer tubes (Beckton Dickinson) and frozen at −80°C. Embryonic brains were collected and immediately snap frozen in liquid nitrogen. Each fetal brain sample consisted of 5 embryonic brains pooled from the same litter. Samples were prepared using the automated MicroLab STAR system (Hamilton Company) and analyzed on GC/MS, LC/MS and LC/MS/MS platforms by Metabolon, Inc. Protein fractions were removed by serial extractions with organic aqueous solvents, concentrated using a TurboVap system (Zymark) and vacuum dried. For LC/MS and LC-MS/MS, samples were reconstituted in acidic or basic LC-compatible solvents containing > 11 injection standards and run on a Waters ACQUITY UPLC and Thermo-Finnigan LTQ mass spectrometer, with a linear ion-trap frontend and a Fourier transform ion cyclotron resonance mass spectrometer back-end. For GC/MS, samples were derivatized under dried nitrogen using bistrimethyl-silyl-trifluoroacetamide and analyzed on a Thermo-Finnigan Trace DSQ fast-scanning single-quadrupole mass spectrometer using electron impact ionization. Chemical entities were identified by comparison to metabolomic library entries of purified standards. Following log transformation and imputation with minimum observed values for each compound, data were analyzed using one-way ANOVA to test for group effects. P and q-values were calculated based on two-way ANOVA contrasts. Principal components analysis was used to visualize variance distributions. Volcano plots were generated using R, with differentially regulated metabolites at q < 0.05. Supervised Random Forest analysis was conducted to identify metabolomic prediction accuracies based on a group of decision trees60. Briefly, randomly selected data from samples across all microbiota conditions were used to build trees. Remaining data were then passed down the trees to generate class prediction values of microbiota status for each sample. This process was performed thousands of times to generate the forest, and each sample’s microbiota status was determined by computing class prediction frequency of the remaining variables over the whole forest. Class predictions of microbiota status were then compared to true microbiota status for each sample, and this error rate served as a measure of prediction accuracy. The metabolites that contributed the most to the microbiota status classification were determined using the “Mean Decrease Accuracy” metric, or by randomly permuting a metabolite, running the observed values through the trees and reassessing the microbiota status prediction accuracy.
Statistics and Reproducibility
Statistical analysis was performed using Prism software (GraphPad v6). All statistical results are included as Supplementary Table 8. Data were assessed for normal distribution and plotted in the figures as mean ± SEM. For each figure, n = the number of independent maternal biological replicates. For assessments involving fetal brains, each maternal biological sample reflects an average of 2–5 embryo “technical” replicates. For behavioral assessments, all offspring were tested. Data for littermates from the same dam were averaged and presented in the main figures with n = independent maternal dams; individual data for each offspring are provided in supplementary figures. No samples or animals were excluded from the analyses. Quantitative RT-PCR, immunofluorescence staining, axon outgrowth assay, and behavioral experiments were replicated at least 3 times with similar results. Differences among > 2 groups with only one variable were assessed using one-way ANOVA with Tukey or Sidak post hoc test. Taxonomic comparisons from 16S rRNA gene sequencing analysis were analyzed by Kruskal-Wallis test with Tukey’s post hoc test. Two-way ANOVA with Tukey’s or Sidak’s post-hoc test was used for ≥ 2 groups with two variables. Significant differences emerging from the above tests are indicated in the figures by *p < 0.05, **p < 0.01, ***p < 0.001, ****p < 0.0001. Notable non-significant differences are indicated in the figures by “n.s.”.
Extended Data
Extended Data Fig. 1|. Network analysis and qPCR validation of fetal brain RNAseq data.
a, Gene ontology analysis of differentially expressed genes from E14.5 brains from ABX v.s. SPF dams (one-tailed Fisher exact, q= 0.012500, 0.017, 0.017, 0.03830902, 0.07449995, 0.07449995, 0.07449995, 0.1001733, n=3 dams). b, Quantitative RT-PCR for Ntng1 and LRRC4C expression in E14.5 brains from offspring of SPF, ABX or GF dams (Two-way ANOVA+Tukey’s, n=9, 15, 10 dams). c, Protein interaction network of genes downregulated in E14.5 brains from offspring of ABX vs. SPF dams (Benjamini-Hochberg, q<0.05, n=3 dams). d, Protein interaction networks of genes upregulated in E14.5 brains from offspring of ABX vs. SPF dams (Benjamini-Hochberg, q<0.05, n=3 dams). Mean±SEM. *p<0.05, n.s.=not statistically significant.
Extended Data Fig. 2|. Netrin-G1a thalamocortical axons in E14.5 brains of offspring from gnotobiotic dams.
a, Reference diagrams of coronal rostral to caudal E14.5 brain sections. b-e, Netrin-G1a in four independent E14.5 brains from offspring of SPF (b), ABX (c), GF (d), and Sp (e) dams. Scale=500 μm. Yellow lines= matched control ROI. f, Netrin-G1a fluorescence per control ROI in E14.5 brain sections of offspring from SPF, ABX, GF and Sp dams. SPF, ABX, GF and Sp data are as presented in Figure 1c and 3d. (Two-way ANOVA+Tukey’s, n=5 dams). g, Total brain area E14.5 brain section of offspring from SPF, ABX, GF and Sp dams. (Two-way ANOVA+Tukey’s, n=5 dams). h, Netrin-G1a per matched control ROI, normalized by total brain area in E14.5 brain sections of offspring from SPF, ABX, GF and Sp dams. (Two-way ANOVA+Tukey’s, n=5 dams). i, Area of Netrin-G1a in E14.5 brain sections of SPF, ABX, GF and Sp dams. (Two-way ANOVA+Tukey’s, n=5 dams). j, Area of Netrin-G1a+ staining normalized by total brain area in E14.5 brain sections of offspring from SPF, ABX, GF and Sp dams. (Two-way ANOVA+ Tukey’s, n=5 dams). k, Netrin-G1a fluorescence in area of Netrin-G1a+ staining of E14.5 brains from SPF, ABX, GF, and Sp dams. (Two-way ANOVA+Tukey’s, n=5 dams). l, DAPI per matched control ROI, normalized by total brain area in E14.5 brain sections from SPF, ABX, GF and Sp dams. (Two-way ANOVA+Tukey’s, n=5, 7, 4, 5 dams). m, DAPI+ cell per matched control ROI, normalized by total brain area in E14.5 brain sections from SPF, ABX, GF and Sp dams. (Two-way ANOVA+ Tukey’s, n=5, 7, 4, 5 dams). Mean±SEM. *p<0.05, **p<0.01, ***p<0.001, ****p<0.0001, n.s.=not statistically significant.
Extended Data Fig. 3|. Whole brain volume and L1+ thalamocortical axons in E14.5 brains of offspring from gnotobiotic dams.
a, Micro-computed tomography of E14.5 fetal brain. Scale bar=2 mm. b, Whole fetal brain volume of E14.5 offspring from SPF, ABX, GF and Sp dams. (One-way ANOVA+Tukey’s, n=10, 5, 8, 5 dams). c, Volume of Netrin-G1a axons, normalized to E14.5 SPF, ABX, GF, and Sp whole brain volume. (SPF v ABX: two-tailed Mann-Whitney, SPF v GF, GF v Sp, and ABX v Sp: One-way ANOVA+Tukey’s, n=5 offspring from different dams). d, Length of Netrin-G1a axons, normalized to the cubic root of E14.5 SPF, ABX, GF, and Sp whole brain volume. (SPF v ABX and SPF v GF: One-way ANOVA+Tukey’s, Sp v ABX and Sp v GF: two-tailed Mann-Whitney, n=5 offspring from different dams). e, Distance from rostral tip of Netrin-G1a axon to cortex, normalized to the cubic root of E14.5 SPF, ABX, GF, and Sp whole brain volume. (SPF v ABX and Sp v ABX: One-way ANOVA+Tukey’s, SPF v GF and Sp v GF: two-tailed Mann-Whitney, n=5 offspring from different dams). f, Circumference of Netrin-G1a axonal bundle at the internal capsule (IC), normalized to the cubic root of E14.5 SPF, ABX, GF, and Sp whole brain volume. (One-way ANOVA-Tukey’s, n=5 offspring from different dams). g, Netrin-G1a (magenta) and L1 (cyan) in E14.5 SPF, ABX, GF and Sp brain sections. Scale=500 μm. Yellow lines=matched control ROI. h, L1 per matched control ROI, normalized by total brain area in E14.5 SPF, ABX, GF and Sp brain sections. (Two-way ANOVA+Tukey’s, n=5 dams). i, L1 per matched control ROI in E14.5 brain sections of offspring from SPF, ABX, GF and Sp dams. SPF, ABX, GF, and Sp data are as in Figure 1d and 2e. (Two-way ANOVA+Tukey’s, n=5 dams). Mean±SEM, *p<0.05, **p<0.01, ****p<0.0001, n.s.=not statistically significant.
Extended Data Fig. 4|. Thalamic explant monocultures and co-cultures with striatal and hypothalamic explants.
a, Axon outgrowth from monoculture of thalamic explants (Th) from E14.5 offspring of SPF, ABX, GF and Sp dams. Scale=250 μm. In Th monocultures: b, axon number, and c, axon length (One-way ANOVA+Tukey’s, n=26, 20, 21, 10 explants). d, Axon outgrowth from i) SPF Th+SPF hypothalamic explant (Hy), ii) ABX Th+ABX Hy, iii) SPF Th+ABX Hy, iv) ABX Th+SPF Hy. Scale=250 μm. Proximal to Hy: e, axon number /200 μm2 surface area, normalized to Th monoculture, and f, axon length, normalized to Th monoculture. (One-way ANOVA+Tukey’s, n=14, 20, 9, 10 explants). g, Axon outgrowth from GF Th+GF St. Scale bar=250 μm. Proximal to St: h, axon number/200 μm2 surface area, normalized to Th monoculture, and i, axon length, normalized to Th monoculture. (One-way ANOVA+Tukey’s, n=16 GF explants). j, Axon outgrowth from GF Th+GF Hy. Scale bar=250 μm. Proximal to Hy: k, axon number/200 μm2 surface area, normalized to Th monoculture, and l, axon length, normalized to Th monoculture. (One-way ANOVA+Tukey’s, n=14 GF explants). m, Axon outgrowth from i) SPF Th+SPF St, ii) ABX Th+ABX St, iii) Sp Th+Sp St, iv) Sp Th+ABX St. Scale=250 μm. Proximal to St: n, axon number/200 μm2 surface area, normalized to Th monoculture, and o, axon length, normalized to Th monoculture. (One-way ANOVA+Tukey’s, n=14, 20, 14, 6 explants). p, Axon outgrowth from i) SPF Th+SPF Hy, ii) ABX Th+ABX Hy, iii) Sp Th+Sp Hy, iv) Sp Th+ABX Hy. Arrows=sparse short axons. Scale=250 μm. Proximal to Hy: q, axon number/200 μm perimeter, normalized to Th monoculture, and r, axon length, normalized to Th monoculture. (One-way ANOVA+Tukey’s, n=14, 20, 14, 6 explants). SPF and ABX data in g-i and m-o are in Figure 1l, 1m. Mean±SEM. *p<0.05, **p<0.01, ***p<0.001, ****p<0.0001, n.s.=not statistically significant.
Extended Data Fig. 5|. Effects of maternal antibiotic treatment and gestational conventionalization on the fecal microbiota.
a, Bacterial load of the maternal fecal microbiota in response to antibiotic (ANVM=ampicillin, neomycin, vancomycin, metronidazole) treatment and conventionalization with SPF microbiota. Yellow line=Ct of germ-free control. (n=5 cages). b, Principal coordinate analysis of 16S rRNA gene sequencing data (weighted Unifrac distances) for maternal fecal microbiota prior to antibiotic treatment (pre-ABX), on Day 2, 4, or 6 after ABX treatment, and on Day 0 (E14.5), 4 (E18.5), 6 (P2) and 8 (P4) after exposure to SPF bedding. (n=5, 5, 5, 5, 3 cages). c, Class-level taxonomic diversity of maternal fecal microbiota pre-ABX and on Day 0 (E14.5), 4 (E18.5), 6 (P2) and 8 (P4) after exposure to SPF bedding. (n=5, 5, 5, 5, 3 cages).
Extended Data Fig. 6|. Effects of the maternal microbiome on behaviors.
a, Maternal Sp colonization and SPF conventionalization. b, Force filament to induce 50% paw withdrawal (One-way ANOVA+Tukey’s, n=38, 24, 45, 25 offspring). c, Latency to contact the adhesive, and d, latency to remove adhesive after first contact (One-way ANOVA+Tukey’s, n=35, 19, 45, 38 offspring). e-f, Pairwise data for latency to contact and remove adhesive. (Two-way ANOVA+Sidak’s, n=6, 6, 7, 7 dams). g, Force filament to induce 50% paw withdrawal by sex, per litter or individual (Two-way ANOVA+Tukey’s, n=5, 7, 7, 7 dams). h, Latency to contact and i, remove adhesive after first contact (Two-way ANOVA+Tukey’s, n=6, 6, 7, 11 dams). j, Latency to withdraw from hot plate (One-way ANOVA+Tukey’s; n=37, 19, 45, 25 offspring). k, Habituation to acoustic tone (Two-way ANOVA+Tukey’s; n=45, 25, 45, 52 offspring). l, Inhibitory effect of prepulse on startle (Two-way ANOVA+Tukey’s; n=45, 25, 45, 52 offspring). m, Time on rotarod (One-way ANOVA+Tukey’s; n=45, 20, 45, 50 offspring). n, Visual depth discrimination. y=0.05, equal instances of exiting safe vs. cliff zone. (One-way ANOVA+Tukey’s; n=38, 19, 45, 52 offspring). o, Percent time investigating novel texture (One-way ANOVA+Tukey’s; n=20, 15, 29, 18 offspring). p, 4-MM treatment and SPF conventionalization. q, Force filament to induce 50% paw withdrawal (One-way ANOVA+Tukey’s, n=10, 23, 15, 21 offspring). r, Latency to contact and s, remove adhesive after first contact (One-way ANOVA+Tukey’s, n=25, 19, 15, 22 offspring). t, Pairwise data for latency to contact and remove adhesive. (Two-way ANOVA+Sidak’s, n = 5, 5 dams). u, Force filament to induce 50% paw withdrawal by sex, per litter or individual (Two-way ANOVA+Tukey’s, n=5, 7, 5, 5 dams). v, Latency to contact and w, remove adhesive after first contact. (Two-way ANOVA+Tukey’s, n=6, 6, 5, 5 dams). Data for SPF and ABX in u-w are as in g-i. *p<0.05, **p<0.01, ***p<0.001, ****p<0.0001. n.s.=not statistically significant. Number of dams, sex of offspring per group and behavioral task are detailed in Supplementary Table 3.
Extended Data Fig. 7|. Maternal gut microbiota and fetal thalamocortical axons in dams colonized with a consortium of spore-forming bacteria (Sp) or Bacteroides (BD).
Fecal microbiota of E14.5 SPF and Sp dams (n=4 dams): a, rarefaction curves of observed operational taxonomic units (OTUs). b, Principal coordinate analysis of weighted sequencing data, and c, order-level taxonomic diversity. d, Genes commonly differentially expressed in E14.5 brains from offspring of SPF and Sp vs. ABX dams (two-tailed Wald, n=3 dams). Data for SPF and ABX are as in Figure 1. Red indicates axonogenesis-related genes. e, PRR12 expression in E14.5 brains from offspring of SPF, ABX, and Sp dams (one-way ANOVA+Tukey’s; n = 11, 15, 8 offspring). f, g, Expression of axonogenesis-related genes in E14.5 brains from SPF, ABX, and Sp dams (Two-way ANOVA+Tukey’s; n=11, 16, 8 offspring). Fecal microbiota of E14.5 SPF and BD dams (n=4, 5 dams): h, rarefaction curves of the observed OTUs, i, principal coordinate analysis of weighted data, and j, order-level taxonomic diversity. k, Netrin-G1a (magenta) and L1 (cyan) in E14.5 brain sections of BD dams. Scale=500 μm. Yellow lines=matched control ROI. l, L1 per matched control ROI, un-normalized (right) and normalized (left) by total brain area of E14.5 brain sections of SPF, ABX, and BD dams. Data for SPF and ABX are as in Figures 1d and 2e, Extended Data Figure 3g–i. (Two-way ANOVA+Tukey’s, n=5 dams). m, Netrin-G1a per matched control ROI, un-normalized (middle) and normalized by total area of E14.5 brain sections (left). Netrin-G1a in area of Netrin-G1a+ staining in E14.5 brain sections (right). Data for SPF and ABX are as in Figures 1c and 2d, Extended Data Figure 2. (Two-way ANOVA+Tukey’s, n=5 dams). Mean±SEM. *p<0.05, **p<0.01, ***p<0.001, ****p<0.0001, n.s.=not statistically significant.
Extended Data Fig. 8|. Maternal serum and fetal brain metabolomic profiles from gnotobiotic dams.
a, Unsupervised hierarchical clustering of 753 maternal serum metabolites (n = 6 dams). b, Amino acid, lipid and xenobiotic metabolites dysregulated in E14.5 fetal brains of offspring from ABX vs. SPF dams (left) and ABX vs. Sp dams (right) (q<0.05; One-way ANOVA, n=6 embryos from different dams). c, Amino acid, lipid and xenobiotic metabolites significantly dysregulated in E14.5 fetal brains of offspring from GF dams vs. SPF controls (left) and GF dams vs. Sp dams (right) (q<0.05; One-way ANOVA, n=offspring from 6 dams per group). d, Random Forest classification of top 30 metabolites in maternal serum that discriminate between SPF and Sp vs. ABX and GF dams. (n=6 dams). e, Relative concentrations of N,N,N-trimethyl-5-aminovalerate (TMAV), trimethylamine N-oxide (TMAO), imidazole propionate (IP), hippurate (HIP), and 3-indoxyl-sulfate (3-IS) in maternal sera of SPF, ABX, GF, and Sp dams (One-way ANOVA with FDR contrasts; n=6 dams). Mean±SEM. *q<0.05, **q<0.01, ***q<0.001, ****q<0.0001, n.s.=not statistically significant.
Extended Data Fig. 9|. Effects of microbiome-dependent metabolites on thalamocortical axon outgrowth from GF explant co-cultures.
a, Axon number and b, axon length per 200 μm2 surface area proximal to striatal explant (St) and from i) SPF thalamic explant (Th)+SPF St ii) ABX Th+ABX St, and iii) ABX Th+ABX St, supplemented with 1 nM, 100 nM, 10 μM of metabolites: trimethylamine N-oxide (TMAO), 5-aminovalerate (5-AV), imidazole propionate (IP), 3-indoxyl-sulfate (3-IS) or hippurate (HIP). (One-way ANOVA+Tukey’s, n= 14, 13, TMAO: 7, 6, 7, 5-AV: 3, 5, 7, IP: 5, 7, 7, 3-IS: 3, 7, 7, HIP: 6, 7, 8 explants). c, Axon number, and d, axon length per 200 μm2 surface area proximal to hypothalamic explant (Hy) from i) SPF Th+SPF Hy), ii) ABX Th+ABX Hy, and iii) ABX Th+ABX Hy, supplemented with metabolites. (One-way ANOVA+Tukey’s, n=14, 10, TMAO: 6, 6, 7, 5-AV: 3, 5, 7, IP: 3, 6, 7, 3-IS: 3, 7, 5, HIP: 5, 7, 8 explants). e, E14.5 GF Th proximal to GF St treated with metabolites. Scale=250 μm. f, g, Axon number and h, i, axon length per 200 μm perimeter proximal to St (f, h) and Hy (g, i). (One-way ANOVA+Tukey’s, n=14, 15, 14, 13, 12, 12, 16 explants). Mean±SEM. *p<0.05, **p<0.01, ****p<0.0001
Extended Data Fig. 10|. Microbiome-dependent metabolites in E14.5 brains after maternal supplementation with 4-MM or SCFA and effects on netrin-G1a thalamocortical axons.
a, Netrin-G1a in four independent E14.5 brains from offspring of ABX+vehicle and ABX+4-MM dams. Scale=500 μm, b, Netrin-G1a in area of Netrin-G1a+ staining in E14.5 brains from ABX+vehicle and ABX+4-MM dams. (Two-way ANOVA+Tukey’s, n=8 dams). c, Area of Netrin-G1a+ staining in E14.5 brain sections. (Two-way ANOVA+Tukey’s, n=8 dams). d, DAPI counts per matched ROI (yellow lines) normalized by total brain area. (Two-way ANOVA+Tukey’s, n=4 dams). e, Levels of the metabolites i) imidazole propionate (IP), ii) trimethylamine oxide (TMAO), iii) 3-indoxyl-sulfate (3-IS), iv) hippurate (HIP) and v) N, N, N-trimethyl-5-aminovalerate (TMAV) in E14.5 brain lysates from antibiotic-treated dams supplemented with 4-MM or vehicle (One-way ANOVA, n=5 (ABX+vehicle), 3, 3, 5, 3, 5 (ABX+4-MM) dams). f, Levels of IP, TMAO, 3-IS, HIP, and TMAV in E14.5 brain lysates from BD dams. (One-way ANOVA+Tukey’s, n = 6, 6, 5 dams). g, SCFA administration. h, Netrin-G1a in four independent E14.5 brain sections from offspring of ABX and ABX+SCFA dams. Scale=500 μm, i, Netrin-G1a and L1 in E14.5 brain sections from offspring of ABX and ABX+SCFA dams. j, Netrin-G1a per matched control ROI, normalized by total brain area. (Two-way ANOVA+Tukey’s, n=4, 7 dams). k, Netrin-G1a in area of Netrin-G1a+ staining. (Two-way ANOVA+Tukey’s, n=4, 7 dams). l, Area of Netrin-G1a+ staining. (Two-way ANOVA+Tukey’s, n=4, 7 dams). m, L1 per matched control ROI, normalized by total brain area. (Two-way ANOVA+Tukey’s, n=4, 7 dams). n, DAPI count per matched ROI, normalized by total brain area. (Two-way ANOVA+Tukey’s, n=4, 7 dams). Mean±SEM. *p<0.05, **p<0.01, ***p<0.001, n.s.=not statistically significant.
Supplementary Material
Acknowledgments
We thank members of the Hsiao lab for their critical review of the manuscript; Trent Su, for RNA sequencing advice; Alon Oyler-Yaniv, Jennifer Oyler-Yaniv and Roy Wollman for assistance with initial light-sheet image acquisition; Abha Rajbhandari and Irina Zhuravka of the UCLA Behavioral Testing Core for behavioral assay training, Stephanie White for sharing ultrasonic vocalization equipment and Andres Collazo of the Caltech Beckman Institute Biological Imaging Facility for assistance with light-sheet image acquisition and analysis. Support for this research was provided by the Packard Fellowship in Science and Engineering and Klingenstein-Simons Award to E.Y.H., UPLIFT: UCLA Postdocs’ Longitudinal Investment in Faculty (Award # K12 GM106996) to H.E.V., the Ruth L. Kirschstein National Research Service Award (#F31 HD101270) to G.N.P. and (#F30 DE025172) to D.W.W, and the NSF Graduate Research Fellowship to E.J.L.C.. E.Y.H. is a New York Stem Cell Foundation – Robertson Investigator. This research was supported in part by the New York Stem Cell Foundation.
Footnotes
Competing Interests
Findings regarding the manipulation of the maternal microbiome to influence fetal development and sensory behavior reported in the manuscript are the subject of provisional patent application US 62/844,503, owned by UCLA. The authors declare no competing interests.
Additional Information
Supplementary information is available for this paper. Correspondence and requests for materials should be addressed to Helen E. Vuong hvuong2323@ucla.edu or Elaine Y. Hsiao ehsiao@g.ucla.edu. Reprints and permissions information is available at www.nature.com/reprints.
Data Availability
All data generated and analyzed during this study are included in this published article and its supplementary information files. Source data for all figures are provided with the paper. The 16S rRNA gene sequencing data that support the findings are have also been deposited to the Qiita database with study IDs 13099, 13106 and 13107. Transcriptomic data that support the findings of this study have also been deposited to the Gene Expression Omnibus (GEO) repository with accession number GSE147183.
References
- 1.Kim S et al. Maternal gut bacteria promote neurodevelopmental abnormalities in mouse offspring. Nature 549, 528–532, doi: 10.1038/nature23910 (2017). [DOI] [PMC free article] [PubMed] [Google Scholar]
- 2.Buffington SA et al. Microbial Reconstitution Reverses Maternal Diet-Induced Social and Synaptic Deficits in Offspring. Cell 165, 1762–1775, doi: 10.1016/j.cell.2016.06.001 (2016). [DOI] [PMC free article] [PubMed] [Google Scholar]
- 3.Jasarevic E et al. The maternal vaginal microbiome partially mediates the effects of prenatal stress on offspring gut and hypothalamus. Nat Neurosci 21, 1061–1071, doi: 10.1038/s41593-018-0182-5 (2018). [DOI] [PubMed] [Google Scholar]
- 4.Vuong HE, Yano JM, Fung TC & Hsiao EY The Microbiome and Host Behavior. Annu Rev Neurosci 40, 21–49, doi: 10.1146/annurev-neuro-072116-031347 (2017). [DOI] [PMC free article] [PubMed] [Google Scholar]
- 5.Ferretti P et al. Mother-to-Infant Microbial Transmission from Different Body Sites Shapes the Developing Infant Gut Microbiome. Cell Host Microbe 24, 133–145 e135, doi: 10.1016/j.chom.2018.06.005 (2018). [DOI] [PMC free article] [PubMed] [Google Scholar]
- 6.Nakashiba T et al. Netrin-G1: a novel glycosyl phosphatidylinositol-linked mammalian netrin that is functionally divergent from classical netrins. J Neurosci 20, 6540–6550 (2000). [DOI] [PMC free article] [PubMed] [Google Scholar]
- 7.Rennie S, Lotto RB & Price DJ Growth-promoting interactions between the murine neocortex and thalamus in organotypic co-cultures. Neuroscience 61, 547–564 (1994). [DOI] [PubMed] [Google Scholar]
- 8.Mitsogiannis MD, Little GE & Mitchell KJ Semaphorin-Plexin signaling influences early ventral telencephalic development and thalamocortical axon guidance. Neural Dev 12, 6, doi: 10.1186/s13064-017-0083-4 (2017). [DOI] [PMC free article] [PubMed] [Google Scholar]
- 9.Braisted JE, Ringstedt T & O’Leary DD Slits are chemorepellents endogenous to hypothalamus and steer thalamocortical axons into ventral telencephalon. Cereb Cortex 19 Suppl 1, i144–151, doi: 10.1093/cercor/bhp035 (2009). [DOI] [PMC free article] [PubMed] [Google Scholar]
- 10.Song H et al. Conversion of neuronal growth cone responses from repulsion to attraction by cyclic nucleotides. Science 281, 1515–1518, doi: 10.1126/science.281.5382.1515 (1998). [DOI] [PubMed] [Google Scholar]
- 11.Stevens A & Jacobs JR Integrins regulate responsiveness to slit repellent signals. J Neurosci 22, 4448–4455, doi: 10.1126/20026413 (2002). [DOI] [PMC free article] [PubMed] [Google Scholar]
- 12.Dontchev VD & Letourneau PC Nerve growth factor and semaphorin 3A signaling pathways interact in regulating sensory neuronal growth cone motility. J Neurosci 22, 6659–6669, doi: 10.1126/20026638 (2002). [DOI] [PMC free article] [PubMed] [Google Scholar]
- 13.Enriquez-Barreto L, Palazzetti C, Brennaman LH, Maness PF & Fairen A Neural cell adhesion molecule, NCAM, regulates thalamocortical axon pathfinding and the organization of the cortical somatosensory representation in mouse. Front Mol Neurosci 5, 76, doi: 10.3389/fnmol.2012.00076 (2012). [DOI] [PMC free article] [PubMed] [Google Scholar]
- 14.Chaplan SR, Bach FW, Pogrel JW, Chung JM & Yaksh TL Quantitative assessment of tactile allodynia in the rat paw. J Neurosci Methods 53, 55–63 (1994). [DOI] [PubMed] [Google Scholar]
- 15.Bouet V et al. The adhesive removal test: a sensitive method to assess sensorimotor deficits in mice. Nat Protoc 4, 1560–1564, doi: 10.1038/nprot.2009.125 (2009). [DOI] [PubMed] [Google Scholar]
- 16.Eddy NB & Leimbach D Synthetic analgesics. II. Dithienylbutenyl- and dithienylbutylamines. J Pharmacol Exp Ther 107, 385–393 (1953). [PubMed] [Google Scholar]
- 17.Valsamis B & Schmid S Habituation and prepulse inhibition of acoustic startle in rodents. J Vis Exp, e3446, doi: 10.3791/3446 (2011). [DOI] [PMC free article] [PubMed] [Google Scholar]
- 18.Fox MW The visual cliff test for the study of visual depth perception in the mouse. Anim Behav 13, 232–233 (1965). [DOI] [PubMed] [Google Scholar]
- 19.Wu HP, Ioffe JC, Iverson MM, Boon JM & Dyck RH Novel, whisker-dependent texture discrimination task for mice. Behav Brain Res 237, 238–242, doi: 10.1016/j.bbr.2012.09.044 (2013). [DOI] [PubMed] [Google Scholar]
- 20.Deacon RM Measuring motor coordination in mice. J Vis Exp, e2609, doi: 10.3791/2609 (2013). [DOI] [PMC free article] [PubMed] [Google Scholar]
- 21.Fujisaka S et al. Diet, Genetics, and the Gut Microbiome Drive Dynamic Changes in Plasma Metabolites. Cell Rep 22, 3072–3086, doi: 10.1016/j.celrep.2018.02.060 (2018). [DOI] [PMC free article] [PubMed] [Google Scholar]
- 22.Saunders NR, Liddelow SA & Dziegielewska KM Barrier mechanisms in the developing brain. Front Pharmacol 3, 46, doi: 10.3389/fphar.2012.00046 (2012). [DOI] [PMC free article] [PubMed] [Google Scholar]
- 23.Monk C, Georgieff MK & Osterholm EA Research review: maternal prenatal distress and poor nutrition - mutually influencing risk factors affecting infant neurocognitive development. J Child Psychol Psychiatry 54, 115–130, doi: 10.1111/jcpp.12000 (2013). [DOI] [PMC free article] [PubMed] [Google Scholar]
- 24.Olson CA et al. The Gut Microbiota Mediates the Anti-Seizure Effects of the Ketogenic Diet. Cell 174, 497, doi: 10.1016/j.cell.2018.06.051 (2018). [DOI] [PMC free article] [PubMed] [Google Scholar]
- 25.Matsumoto M et al. Cerebral low-molecular metabolites influenced by intestinal microbiota: a pilot study. Frontiers in systems neuroscience 7, 9, doi: 10.3389/fnsys.2013.00009 (2013). [DOI] [PMC free article] [PubMed] [Google Scholar]
- 26.Molnar Z, Garel S, Lopez-Bendito G, Maness P & Price DJ Mechanisms controlling the guidance of thalamocortical axons through the embryonic forebrain. Eur J Neurosci 35, 1573–1585, doi: 10.1111/j.1460-9568.2012.08119.x (2012). [DOI] [PMC free article] [PubMed] [Google Scholar]
- 27.Vernocchi P, Del Chierico F & Putignani L Gut Microbiota Profiling: Metabolomics Based Approach to Unravel Compounds Affecting Human Health. Front Microbiol 7, 1144, doi: 10.3389/fmicb.2016.01144 (2016). [DOI] [PMC free article] [PubMed] [Google Scholar]
- 28.Lu J et al. Microbiota influence the development of the brain and behaviors in C57BL/6J mice. PLoS One 13, e0201829, doi: 10.1371/journal.pone.0201829 (2018). [DOI] [PMC free article] [PubMed] [Google Scholar]
- 29.Ong IM et al. Gut microbiome populations are associated with structure-specific changes in white matter architecture. Transl Psychiatry 8, 6, doi: 10.1038/s41398-017-0022-5 (2018). [DOI] [PMC free article] [PubMed] [Google Scholar]
- 30.Indrio F et al. Epigenetic Matters: The Link between Early Nutrition, Microbiome, and Long-term Health Development. Front Pediatr 5, 178, doi: 10.3389/fped.2017.00178 (2017). [DOI] [PMC free article] [PubMed] [Google Scholar]
- 31.Keunen K, van Elburg RM, van Bel F & Benders MJ Impact of nutrition on brain development and its neuroprotective implications following preterm birth. Pediatr Res 77, 148–155, doi: 10.1038/pr.2014.171 (2015). [DOI] [PMC free article] [PubMed] [Google Scholar]
- 32.Shin Yim Y et al. Reversing behavioural abnormalities in mice exposed to maternal inflammation. Nature 549, 482–487, doi: 10.1038/nature23909 (2017). [DOI] [PMC free article] [PubMed] [Google Scholar]
- 33.Gehrig JL et al. Effects of microbiota-directed foods in gnotobiotic animals and undernourished children. Science 365, doi: 10.1126/science.aau4732 (2019). [DOI] [PMC free article] [PubMed] [Google Scholar]
- 34.Hamad AF, Alessi-Severini S, Mahmud SM, Brownell M & Kuo IF Prenatal antibiotics exposure and the risk of autism spectrum disorders: A population-based cohort study. PLoS One 14, e0221921, doi: 10.1371/journal.pone.0221921 (2019). [DOI] [PMC free article] [PubMed] [Google Scholar]
- 35.Atladottir HO, Henriksen TB, Schendel DE & Parner ET Autism after infection, febrile episodes, and antibiotic use during pregnancy: an exploratory study. Pediatrics 130, e1447–1454, doi: 10.1542/peds.2012-1107 (2012). [DOI] [PMC free article] [PubMed] [Google Scholar]
Supplementary References:
- 36.Reikvam DH et al. Depletion of murine intestinal microbiota: effects on gut mucosa and epithelial gene expression. PLoS One 6, e17996, doi: 10.1371/journal.pone.0017996 (2011). [DOI] [PMC free article] [PubMed] [Google Scholar]
- 37.McVey Neufeld KA, Perez-Burgos A, Mao YK, Bienenstock J & Kunze WA The gut microbiome restores intrinsic and extrinsic nerve function in germ-free mice accompanied by changes in calbindin. Neurogastroenterology and motility : the official journal of the European Gastrointestinal Motility Society 27, 627–636, doi: 10.1111/nmo.12534 (2015). [DOI] [PubMed] [Google Scholar]
- 38.Yano JM et al. Indigenous bacteria from the gut microbiota regulate host serotonin biosynthesis. Cell 161, 264–276, doi: 10.1016/j.cell.2015.02.047 (2015). [DOI] [PMC free article] [PubMed] [Google Scholar]
- 39.Kim D, Langmead B & Salzberg SL HISAT: a fast spliced aligner with low memory requirements. Nat Methods 12, 357–360, doi: 10.1038/nmeth.3317 (2015). [DOI] [PMC free article] [PubMed] [Google Scholar]
- 40.Pertea M, Kim D, Pertea GM, Leek JT & Salzberg SL Transcript-level expression analysis of RNA-seq experiments with HISAT, StringTie and Ballgown. Nat Protoc 11, 1650–1667, doi: 10.1038/nprot.2016.095 (2016). [DOI] [PMC free article] [PubMed] [Google Scholar]
- 41.Love MI, Huber W & Anders S Moderated estimation of fold change and dispersion for RNA-seq data with DESeq2. Genome Biol 15, 550, doi: 10.1186/s13059-014-0550-8 (2014). [DOI] [PMC free article] [PubMed] [Google Scholar]
- 42.Huang da W, Sherman BT & Lempicki RA Systematic and integrative analysis of large gene lists using DAVID bioinformatics resources. Nat Protoc 4, 44–57, doi: 10.1038/nprot.2008.211 (2009). [DOI] [PubMed] [Google Scholar]
- 43.Chung K et al. Structural and molecular interrogation of intact biological systems. Nature 497, 332–337, doi: 10.1038/nature12107 (2013). [DOI] [PMC free article] [PubMed] [Google Scholar]
- 44.Schindelin J et al. Fiji: an open-source platform for biological-image analysis. Nat Methods 9, 676–682, doi: 10.1038/nmeth.2019 (2012). [DOI] [PMC free article] [PubMed] [Google Scholar]
- 45.Koh A et al. Microbially Produced Imidazole Propionate Impairs Insulin Signaling through mTORC1. Cell 175, 947–961 e917, doi: 10.1016/j.cell.2018.09.055 (2018). [DOI] [PubMed] [Google Scholar]
- 46.Mishima E et al. Evaluation of the impact of gut microbiota on uremic solute accumulation by a CE-TOFMS-based metabolomics approach. Kidney Int 92, 634–645, doi: 10.1016/j.kint.2017.02.011 (2017). [DOI] [PubMed] [Google Scholar]
- 47.Soga T et al. Differential metabolomics reveals ophthalmic acid as an oxidative stress biomarker indicating hepatic glutathione consumption. J Biol Chem 281, 16768–16776, doi: 10.1074/jbc.M601876200 (2006). [DOI] [PubMed] [Google Scholar]
- 48.Soga T et al. Quantitative metabolome analysis using capillary electrophoresis mass spectrometry. J Proteome Res 2, 488–494 (2003). [DOI] [PubMed] [Google Scholar]
- 49.Karkkainen O et al. Whole grain intake associated molecule 5-aminovaleric acid betaine decreases beta-oxidation of fatty acids in mouse cardiomyocytes. Sci Rep 8, 13036, doi: 10.1038/s41598-018-31484-5 (2018). [DOI] [PMC free article] [PubMed] [Google Scholar]
- 50.Fothergill JC & Guest JR Catabolism of L-lysine by Pseudomonas aeruginosa. J Gen Microbiol 99, 139–155, doi: 10.1099/00221287-99-1-139 (1977). [DOI] [PubMed] [Google Scholar]
- 51.Diehl KH et al. A good practice guide to the administration of substances and removal of blood, including routes and volumes. J Appl Toxicol 21, 15–23 (2001). [DOI] [PubMed] [Google Scholar]
- 52.Erny D et al. Host microbiota constantly control maturation and function of microglia in the CNS. Nat Neurosci 18, 965–977, doi: 10.1038/nn.4030 (2015). [DOI] [PMC free article] [PubMed] [Google Scholar]
- 53.Deuis JR, Dvorakova LS & Vetter I Methods Used to Evaluate Pain Behaviors in Rodents. Front Mol Neurosci 10, 284, doi: 10.3389/fnmol.2017.00284 (2017). [DOI] [PMC free article] [PubMed] [Google Scholar]
- 54.Perry W, Minassian A, Lopez B, Maron L & Lincoln A Sensorimotor gating deficits in adults with autism. Biol Psychiatry 61, 482–486, doi: 10.1016/j.biopsych.2005.09.025 (2007). [DOI] [PubMed] [Google Scholar]
- 55.Barman M et al. Enteric salmonellosis disrupts the microbial ecology of the murine gastrointestinal tract. Infect Immun 76, 907–915, doi: 10.1128/IAI.01432-07 (2008). [DOI] [PMC free article] [PubMed] [Google Scholar]
- 56.Caporaso JG et al. Global patterns of 16S rRNA diversity at a depth of millions of sequences per sample. Proceedings of the National Academy of Sciences of the United States of America 108 Suppl 1, 4516–4522, doi: 10.1073/pnas.1000080107 (2011). [DOI] [PMC free article] [PubMed] [Google Scholar]
- 57.Amir A et al. Deblur Rapidly Resolves Single-Nucleotide Community Sequence Patterns. mSystems 2, doi: 10.1128/mSystems.00191-16 (2017). [DOI] [PMC free article] [PubMed] [Google Scholar]
- 58.Bolyen E et al. Reproducible, interactive, scalable and extensible microbiome data science using QIIME 2. Nat Biotechnol 37, 852–857, doi: 10.1038/s41587-019-0209-9 (2019). [DOI] [PMC free article] [PubMed] [Google Scholar]
- 59.McMurdie PJ & Holmes S phyloseq: an R package for reproducible interactive analysis and graphics of microbiome census data. PLoS One 8, e61217, doi: 10.1371/journal.pone.0061217 (2013). [DOI] [PMC free article] [PubMed] [Google Scholar]
- 60.Breiman L Random Forests. Machine Learning 45, 5–32 (2001). [Google Scholar]
Associated Data
This section collects any data citations, data availability statements, or supplementary materials included in this article.


