Abstract
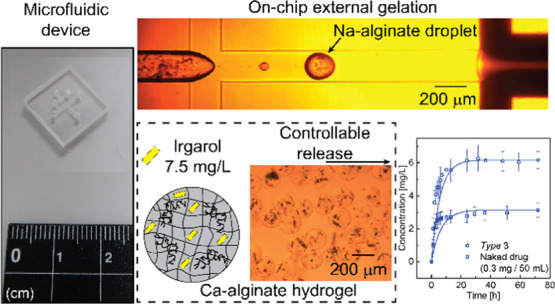
Microencapsulation of biocides is used in long-life antifouling coating paints for marine applications and building materials. Here, we report the microfluidic production of calcium alginate (Ca-alginate) hydrogel particles to modulate the release of the encapsulated drug Irgarol (N-cyclopropyl-N′-(1,1-dimethylethyl)-6-(methylthio)-1,3,5-triazine-2,4-diamine), which is a hydrophobic and specifically phytotoxic antifoulant that inhibits photosystem II in aquatic plant species. We first encapsulated the drug inside the highly spherical Ca-alginate hydrogels of an average diameter ∼160 μm with a coefficient of variation of less than 4% and an average roundness of more than 0.96. The release speeds of the encapsulated and nonencapsulated drugs in pure water were measured separately by ultraviolet–visible spectroscopy. A stable and controllable release rate of the loaded drug was achieved by hydrophilic encapsulation. In addition, cellulose fibers were incorporated to enhance the mechanical strength of the hydrogels. Finally, the antifouling effect of the encapsulated drug was demonstrated using water grass (Bacopa monnieri).
1. Introduction
The use of antifouling paints containing biocides (antifoulants) is the most common approach to prevent biofouling of surfaces in many industrial sectors and for the public community.1−4 The formulation of antifouling paints can be classified into three types (Figure S-1). First, antifoulants can be simply and molecularly dispersed in wet paints.5−7 This approach can be easily manipulated but often suffers from premature release or degradation of the active biocides.8,9 Excessive amounts of drugs are typically used in the paints to extend their effective time, but this usually causes environmental pollution10 and possibly leads to macroscopic phase separation in the coatings.8 Second, the biocides can be immobilized on objects like binders and pigments.9,11,12 Nevertheless, this method is limited to a small number of biocides that satisfy practical requirements or contain a suitable ligand. The issue of incompatibility prevents the combination of different kinds of biocides in a single paint formulation with high antifouling efficiency.13,14
Third, biocides can be microencapsulated, which has various advantages in the production of antifouling paints:8,15−18 (i) the release speed of the active compounds from painted surfaces can be considerably slower than the coatings with freely dispersed biocides; (ii) encapsulated biocides are protected from degradation; (iii) macroscopic phase separation is prevented; and (iv) the handling and application of biocides are much easier after encapsulation. To date, numerous microcapsules carrying antifouling biocides have been reported. Various biocides have been encapsulated in polymer particles consisting of polymeric urushiol,17 poly(l-lactide),19 poly(lacide-co-glycolide),20 melamine formaldehyde,21 and poly(methyl methacrylate).8,22−24 However, the size distribution and morphology of such particles are usually poorly controlled (Table S-1), which can cause difficulties in achieving a controllable dosage and highly reproducible sustained release of the encapsulated drug. It is also important that the microcapsule material is compatible with the wet paint to avoid heterogeneous dispersion, microcapsule agglomeration, and other undesirable issues.25 For example, the encapsulation of biocides in a hydrophilic material would be suitable for its combination with the waterborne paints and varnishes, offering benefits that include low viscosity and nonflammability.26 The microcapsule materials should also be biodegradable and environmentally acceptable to avoid possible pollution.
Alginate, a natural polysaccharide obtained from brown algae,27 is one of the ideal materials for controlled drug delivery because of its biocompatible, biodegradable, and nontoxic properties.28−31 Various microfluidic techniques for producing hydrogel microparticles of alginate have been devised to improve the manufacturing process in terms of monodispersity and production efficiency. However, the previous studies often dealt with problems, such as clogging issues and nonuniform formation of the hydrogels.32−36 Therefore, although alginate hydrogels might be potentially suitable for the encapsulation of biocides, to the best of our knowledge, the microencapsulation of antifouling biocides in alginate hydrogels has never been reported.
Here, we demonstrate the environment-friendly hydrophilic encapsulation of a hydrophobic antifouling biocide in calcium alginate (Ca-alginate) hydrogels by applying a microfluidic emulsion-based external gelation technique that we reported previously (Figure 1).37 In the present study, Irgarol (N-cyclopropyl-N′-(1,1-dimethylethyl)-6-(methylthio)-1,3,5-triazine-2,4-diamine), a hydrophobic and phytotoxic antifoulant that inhibits photosystem II and prevents the growth of aquatic plant species (Figure S-2),38,39 was successfully encapsulated in the hydrogel. We investigated the release rates of the encapsulated and nonencapsulated biocides. Cellulose fibers were then incorporated in the hydrogel capsules to enhance their mechanical strength. Finally, the antifouling effect of the encapsulated drug was evaluated using water grass (Bacopa monnieri).
Figure 1.
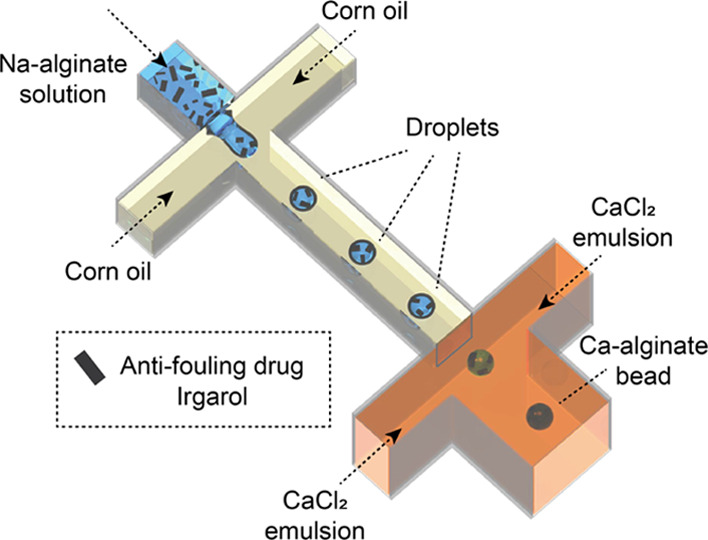
Schematic illustration of the microfluidic process to prepare hydrogel microspheres of calcium alginate (Ca-alginate) loaded with the antifouling drug Irgarol.
2. Results and Discussion
2.1. Microfluidic Generation of Na-Alginate Droplets Loaded with Drugs
First, the formation of Na-alginate droplets loaded with Iragrol was observed at the upstream cross-junction of the device. Figure 2 displays a typical process of formation of a Na-alginate droplet containing the drug particles. Similar sized droplets were generated one by one in a dripping regime; the break-off rate was ∼8 drops/s. The size of these Na-alginate droplets was calculated from the droplet production rate and disperse-phase flow rate (0.1 mL/h). The generated Na-alginate droplets loaded with the drug had a diameter of approximately 188 μm. Satellite droplets with a diameter of ∼49 μm were occasionally formed owing to the highly viscous Na-alginate aqueous solution (ca. 1500 mPa·s; Figure 2, t = 48 ms). The Na-alginate droplets reached the next junction where two streams of the fine water-in-oil CaCl2 emulsion were coflowing (Figure 2, t = 109 ms) to make Ca-alginate hydrogel microparticles via external ionic cross-linking.
Figure 2.
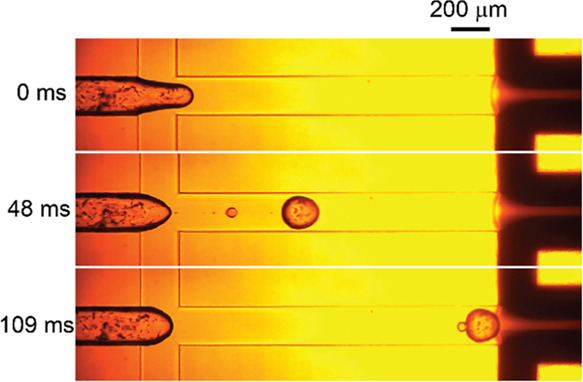
High-speed photomicrographs showing the break-off of a sodium alginate (Na-alginate) droplet containing the drug. Flow rates of the droplet phase, carrier oil phase, and reactant emulsion stream are 0.1 mL/h, 2.0 mL/h (=1.0 mL/h × 2), and 20.0 mL/h (=10.0 mL/h × 2), respectively.
This was in agreement with our previous study,37 in which we obtained pure Na-alginate droplets with a mean diameter of 190 μm and a coefficient of variation (CV) of 2.2% in the dripping mechanism, when the same flow rates were set for the continuous phase (Qc = 2.0 mL/h) and the disperse phase (Qd = 0.1 mL/h). This similarity in the experimental results suggests that the presence of the drug did not severely affect the mechanism of droplet generation and droplet sizes. During the experiments, the microfluidic chip did not experience gel clogging when operated normally.
2.2. Characterization of the Ca-Alginate Microcapsules Loaded with Drug
Figure 3a shows bright-field photomicrographs of the prepared hydrogel microparticles at different magnifications when the drug was dispersed in the disperse phase (Disperse #1). These images show that the particles had a highly spherical shape, and crystals of the drug were encapsulated in the hydrogel. The average roundness of these particles was ∼0.97. The average diameter of the particles was approximately 160 μm with a CV value of 3.5% (Figure 3b). In the scanning electron microscopy (SEM) image of the dried aerogel beads, we observed that the obtained microcapsules maintained a spherical shape with a smooth surface after drying. The deformation of the surface of some microgels indicated the presence of drug crystals inside the dried microcapsules (Figure 3c). The SEM images of their cross sections revealed that the particles had a densely packed gel matrix where Irgarol crystals were embedded (Figure S-3). Furthermore, the attenuated total reflection Fourier transform infrared (ATR-FTIR) spectra were measured to identify the prepared Ca-alginate microcapsules loaded with drug (Figure S-4).
Figure 3.
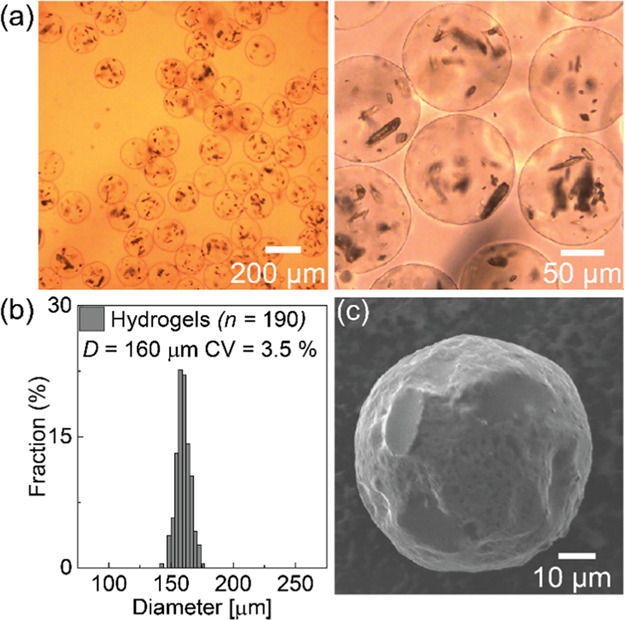
Generated Ca-alginate hydrogel microcapsules carrying drug particles. (a) Photomicrographs of the Ca-alginate hydrogels redispersed in pure water at different magnifications, (b) size distribution of the produced Ca-alginate hydrogels, and (c) SEM image of a dried microgel with drug inside.
In our previous study,37 monodisperse and highly spherical Ca-alginate hydrogel particles without any cargo inside were generated at the same flow rate (Qc = 2.0 mL/h, Qd = 0.1 mL/h, and Qe = 20.0 mL/h) with a mean diameter of 160 μm, CV value of 4.2%, and roundness of 0.96. Thus, we showed that the encapsulation of the drug did not significantly affect the size, size distribution, shrinkage ratio, or morphology of the obtained Ca-alginate microgels.
2.3. Release Rate of the Encapsulated Drug
We investigated the release rate of the encapsulated drug from four hydrogel samples loaded with only the drug. Pure water was chosen as the surrounding medium in this experiment for simplicity, although in practical applications, the synthesized hydrogel particles will be dispersed in paints for use in air, marine, and freshwater sites. By combining two types of disperse phase (Disperse #1 and Disperse #2) and two different collection times (30 and 60 min), we prepared four samples with three different encapsulated drug amounts me (Table S-5). Three parallel experiments were performed for each sample to produce an average value and standard deviation. The results of time-lapse ultraviolet–visible (UV–vis) measurements are shown in Figure 4a. The drug concentration in the tested solutions gradually increased with time. After 31 h, the drug concentration of the tested solution with type 2 hydrogels reached a plateau at approximately 1.3 mg/L. Then, after 41 h, the drug concentration of the solutions with type 1 and type 4 hydrogels hit a plateau at approximately 3.2 mg/L. Finally, after 50 h, the drug concentration of the tested solution with type 3 hydrogels reached a plateau at approximately 6.0 mg/L. During this experiment, we did not find any notable deformation or degradation of the hydrogel particles.
Figure 4.
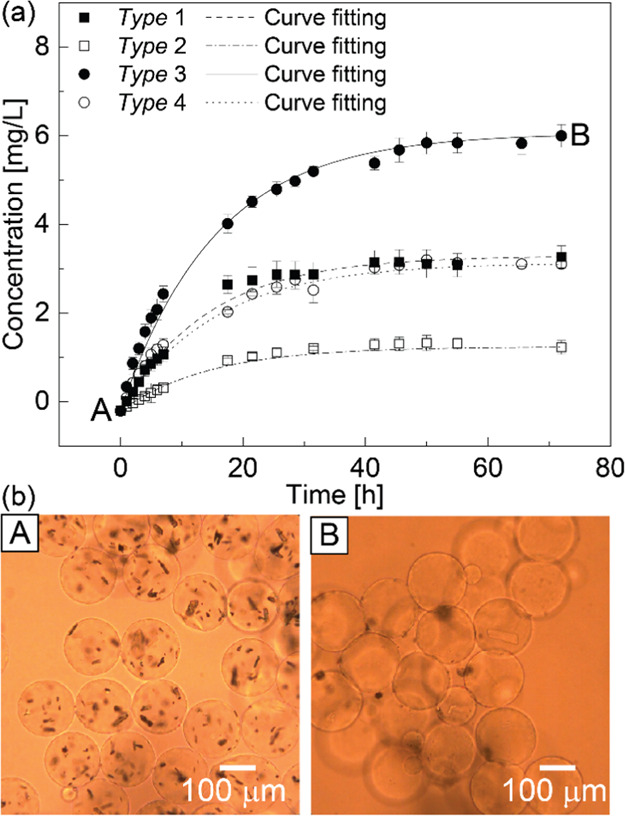
Measurement of the released amount of the drug over time. (a) Time vs concentration of the released drug from the prepared hydrogel particles and (b) micrographs of the prepared hydrogel particles loaded with drugs in pure water at (A) t = 0 h and (B) t = 72 h.
To further investigate the release rate and released amount of encapsulated drug, we carried out a curve fitting of the UV–vis measurement results using the Noyes–Whitney equation,40 in which the drug dissolution rate is directly proportional to the difference of dissolved drug concentration C at time x from the saturation concentration Cs
| 1 |
where k is the dissolution time constant. When the initial condition is C (0) = 0, the equation is
| 2 |
We used the released amount mr to represent the total amount of drug successfully released from the hydrogel particles in the measurements, which is equal to
| 3 |
where V is the total volume of the tested solution, which equals 0.05 L.
The parameter analysis of the curve fitting in Figure 4a is shown in Table 1. For type 1 hydrogels, the time constant of their release function was 14.23. The released amount of drug in type 1 hydrogels was 0.164 mg, which we consider as the amount of drug remaining in the hydrogels after filtration. Because the encapsulated amount was 0.250 mg, the encapsulation efficiency was calculated as 65.6%. For type 2 hydrogels, the time constant of the release function was 14.37 and the released amount of drug was 0.072 mg, whereas the encapsulated amount was 0.125 mg. Thus, 57.6% of the drug remained in the microcapsules after filtration. For type 3 hydrogels, the time constant of the release function was 15.39, the released amount of the drug was 0.303 mg, and the encapsulated amount was 0.500 mg, indicating that 60.6% of the drug was retained before the measurement. Finally, for type 4 hydrogels, the time constant of their release function was 15.31, the released amount of the drug was 0.157 mg, and the encapsulated amount was 0.250 mg. Therefore, 62.8% of the drug remained in the microcapsule before the measurement.
Table 1. Parameter Analysis of the Release of the Drug from Microgel Capsules.
| type 1 | type 2 | type 3 | type 4 | |
|---|---|---|---|---|
| function | C = Cs(1 – e–(x/k)) | |||
| Cs | 3.29 | 1.24 | 6.06 | 3.14 |
| k | 14.23 | 14.37 | 15.39 | 15.31 |
| released amount (mr), mg | 0.164 | 0.072 | 0.303 | 0.157 |
| encapsulated amount (me), mg | 0.250 | 0.125 | 0.500 | 0.250 |
| encapsulation efficiency (EE), % | 65.6 | 57.6 | 60.6 | 62.8 |
In the hydrogels loaded with only the drug (types 1–4), the average value of the time constants k of the four fitting curves was 14.83 ± 0.53. The small deviation in the amount of released drug at specific times and the small deviation in the time constant k suggested that the release rate of the encapsulated drug was stable. Furthermore, the released amount of the encapsulated drug can be easily estimated and controlled according to the Noyes–Whitney equation and the steady time constant k. The amount of the drug successfully released from the hydrogels during the measurement was always less than the encapsulated amount in the four samples. The average value of the drug encapsulation efficiency was 61.7 ± 2.9%. The decrease in the drug amount was probably owing to its dissolution and the loss of hydrogel particles during the filtration process.
The hydrogel particles loaded with the drug in pure water at 0 and 72 h are shown in Figure 4b. At first (0 h), the drug crystals were observed inside the gel particles (Figure 4b-A). However, after 72 h, most of the encapsulated drug crystals disappeared (Figure 4b-B), suggesting that the drug dissolved in the surrounding aqueous solution.
In the practical fabrication of antifouling coating paints,25 the aqueous medium in both microcapsule suspension and wet coating paints should be largely removed to avoid possible undesirable problems (e.g., heterogeneous dispersion and agglomeration), forming a polymeric coating matrix for the final products. We consider that drug release from our alginate capsules to the surrounding dried coating matrix would be significantly slower than that from the capsules exposed directly to the aqueous environment in this study. In addition, the release of the biocide from the coating matrix to the surrounding aqueous environment would be controlled by several factors, such as the coating layer thickness, diffusion coefficient in the coating, and coating/water distribution coefficients.25 Thus, the controlled release of biocides from the coating formulated with our alginate microcapsules would be achieved by considering the permeation through both the microcapsule barrier and dried coating matrix.
2.4. Comparison of the Release Speed of Encapsulated and Nonencapsulated Drugs
The release speeds of the drug with and without encapsulation were compared (Figure 5). We prepared two nonencapsulated drug samples with different drug concentrations. Three parallel experiments were performed for each sample to produce an average value and standard deviation. After 7 h, the drug concentration of the tested solution with nonencapsulated drug sample 2 reached a plateau at approximately 3.2 mg/L. After 25 h, the drug concentration of the tested solution with nonencapsulated drug sample 1 reached a plateau at approximately 6.0 mg/L.
Figure 5.
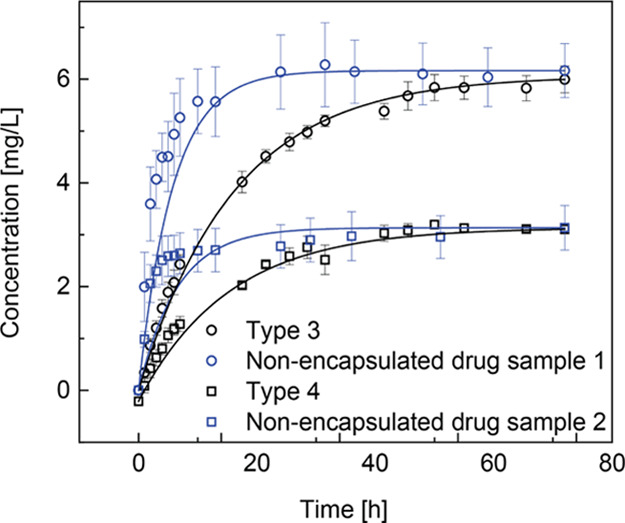
Time vs concentration of the dissolved nonencapsulated drug compared with the released drug from the prepared hydrogel particles.
The parameter analysis of the curve fitting in Figure 5 is shown in Table 2. For the nonencapsulated drug sample 1, the time constant of their release function was 5.73 and the actual released amount of drug was 0.309 mg. For the nonencapsulated drug sample 2, the time constant of their release function was 6.54 and the actual released amount of drug was 0.157 mg.
Table 2. Parameter Analysis of the Release of the Encapsulated and Nonencapsulated Samples.
| type 3 | nonencapsulated drug sample 1 | type 4 | nonencapsulated drug sample 2 | |
|---|---|---|---|---|
| function | C = Cs (1 – e–(x/k)) | |||
| Cs | 6.06 | 6.17 | 3.14 | 3.14 |
| k | 15.39 | 5.73 | 15.31 | 6.54 |
| released amount (mr), mg | 0.303 | 0.309 | 0.157 | 0.157 |
| encapsulated amount (me), mg | 0.500 | 0.500 | 0.250 | 0.250 |
| encapsulation efficiency (EE), % | 60.6 | 61.8 | 62.8 | 62.8 |
By comparing the results of nonencapsulated samples with the encapsulated samples of the same saturated concentration (types 3 and 4), we observed two important differences. First, the release speed of the nonencapsulated drug sample was faster than that of the encapsulated one. The average dissolution time constant increased from 6.14 to 14.83 after encapsulation. The alginate hydrogel is not an ideal material for the sustained release of low-molecular-weight drugs owing to its relatively large pore size.41 Therefore, the sustained release from the hydrogel particles in this study was probably caused by partial coverage of a polymer network on the drug crystals and the resultant delayed dissolution. Second, the deviation of the released amount of the nonencapsulated drug at each specific time was larger than that of the encapsulated drug. We suppose that this smaller deviation was partially owing to the hydrophilic coatings of alginate microcapsules, which provided a uniform contact area of the hydrophobic drug crystals with the aqueous surrounding.
2.5. Ca-Alginate Microcapsules Containing Both Cellulose Fibers and Drug
The prepared hydrogel microcapsules loaded with the antifouling drug are intended to be mixed into the wet coating paints. To prevent the possible break of hydrogel microcapsules during the fabrication process, we added cellulose fibers into the hydrogel beads to enhance their mechanical strength.
We encapsulated both the drug and cellulose fibers together in the Na-alginate droplets (Disperse #3, Figure S-5). Similar sized droplets were formed in the dripping regime at a production rate close to that of the droplets loaded with only the drug (∼8 drops/s). The production rate of the droplets suggested that the generated Na-alginate droplets loaded with both the drug and cellulose fibers had a diameter of approximately 188 μm. Satellite droplets with a diameter of ∼39 μm were occasionally generated following the main droplet (Figure S-5, t = 36 ms). The droplet reached the second junction for gelation in the coflowing CaCl2 emulsion (Figure S-5, t = 117 ms).
The generated hydrogels were filled with cellulose fibers and had a spherical shape with a roundness of approximately 0.93 (Figure 6a). These particles had a mean diameter of 163 μm with a CV value of 3.9% (Figure 6b). The SEM image of the dried beads, carrying both the drug and fiber, suggests that these microcapsules retained a spherical shape after drying. However, compared with the surface of the dried gel beads loaded with only the drug, the surfaces were wrinkled with a fiberlike structure (Figure 6c).
Figure 6.
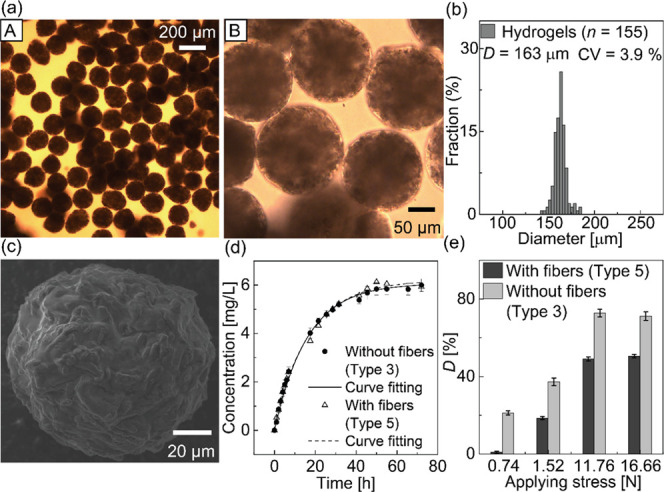
Generated Ca-alginate hydrogel microcapsules of drugs and cellulose fibers. (a) Photomicrographs of the Ca-alginate hydrogels redispersed in pure water observed at different magnifications: (A) 10× and (B) 40×. (b) Size distribution of the produced Ca-alginate hydrogels. (c) SEM image of a dried microgel with drugs and fibers. (d) Time vs concentration of the released drug from Ca-alginate microcapsules with or without cellulose fibers. (e) Deformation percentage of the hydrogels with or without cellulose fibers inside under the external applied force.
The roundness of the obtained hydrogels with fibers was lower, from 0.97 to 0.93, whereas the average diameter and CV value were higher, from 160 to 163 μm and from 3.5 to 3.9%, respectively, than those without fibers. We speculate that these variations were a consequence of the presence of cellulose fibers, which decreased the fraction of Na-alginate solution in a single Na-alginate droplet, causing insufficient gelation at the downstream channel. These poorly cross-linked Na-alginate droplets could form hydrogel microparticles with larger sizes and deformed shapes (Figure 6a).
The average drug release rates, measured by UV–vis spectroscopy in three repeated experiments, are shown in Figure 6d. The drug concentration in the tested solutions with hydrogels loaded with both the drug and fibers gradually increased with time and reached a plateau at approximately 6.0 mg/L after 50 h. The parameter analysis of the curve fitting in Figure 6d is shown in Table 3. In the hydrogel particles encapsulating both the drug and cellulose fibers, the time constant of the release function was 15.34, the released amount of the drug was 0.309 mg, and the encapsulated amount was 0.500 mg, suggesting that approximately 61.0% of the drug remained encapsulated before the measurement. The hydrogels loaded with the drug and fiber and the hydrogels loaded with only the drug (type 3) had similar time constants of the fitting curve (15.34) and encapsulation efficiencies (61.0%), suggesting that the encapsulation of the cellulose fiber did not affect the release rate and released amount of the encapsulated drug.
Table 3. Parameter Analysis of the Release of the Drug from the Hydrogels Loaded with Cellulose Fibers.
| with fiber (type 5) | |
|---|---|
| function | C = Cs (1 – e–(x/k)) |
| Cs | 6.17 |
| k | 15.34 |
| released amount (mr), mg | 0.309 |
| encapsulated amount (me), mg | 0.500 |
| encapsulation efficiency (EE), % | 61.0 |
The mechanical strength of the hydrogel particles was largely enhanced owing to the cellulose fibers. Figure 6e shows the deformation percentage of two hydrogel layers under different external stress values. We represented the deformation percentage of the hydrogel layer between the two glass slides using the following equation
| 4 |
Here, D is the deformation percentage, ΔT is the deformation amount, and T0 is the original thickness of the prepared hydrogel layer. Three parallel experiments were performed for each sample to produce an average value and standard deviation.
When 0.74 N of force was applied, the average deformation percentage of the hydrogel layers with and without fibers was 0.93 and 21.21%, respectively. When the force was increased to 1.52 N, the deformation of hydrogel layers increased. The hydrogel layer containing cellulose fibers had an average deformation percentage of 18.52% and the hydrogel layer with no fibers inside had an average deformation percentage of 37.27%. When the force was further increased to 11.76 and 16.66 N, the deformation of tested hydrogel layers reached a maximum value. The hydrogel layer containing cellulose fibers had a maximum deformation percentage of approximately 50%, whereas the hydrogel layer without fibers inside had a maximum deformation percentage of approximately 71%.
The mechanical strength of the hydrogel microcapsules could be improved by adding the cellulose fibers. We believe that this higher mechanical strength might have the potential for the dispersion of microcapsules into a coating system, which could ensure that microcapsules maintain an intact structure with a controlled release function.
2.6. Antifouling Effect of the Encapsulated Drug
Algae, mussels, and bacteria are the common objects used for the evaluation of antifouling effects in the marine applications. In our study, however, we demonstrated the antifouling effect of the encapsulated Irgarol, which is known as an effective inhibitor of the photosynthesis of a large number of marine and freshwater plant species, using water grass (B. monnieri) (Figure 7). First, all of the water grass samples were alive with green leaves. However, after 4 days of culture, in the beaker with type 3 hydrogels, most of the water grass leaves had become shriveled. Moreover, the color of the water in the beaker turned black with a rotten smell, indicating that the water grass almost died off. In contrast, in the beaker with type 4 hydrogels, the water grass was still alive with green leaves, although the water in the beaker became turbid. No strange smell could be noted. Then, after 6 days of culture, most of the water grass samples in the beakers containing the antifouling drug were withered and the color of the water inside the beaker became darker with a strong rotten smell.
Figure 7.
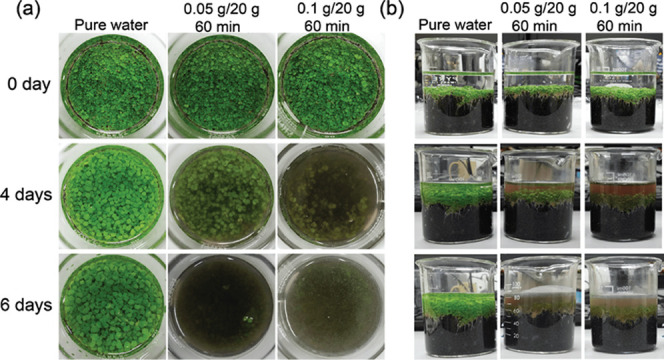
Photographs of cultured water grass (B. monnieri) from (a) top and (b) side views.
We consider that the photosynthesis of water grass was inhibited by the antifouling drug, resulting in the withering and rotting of the samples. Thus, we showed that the encapsulated drug could be released from the hydrogel beads over time and could exhibit its antifouling effect. In addition, according to Table 1, the total released drug amounts of type 3 and type 4 hydrogels were 0.303 and 0.157 mg, respectively. Therefore, we speculate that the water grass with type 3 hydrogels withered faster than the water grass with type 4 hydrogels because of the higher drug concentration.
3. Conclusions
A microfluidic method was used for the synthesis of hydrophilic Ca-alginate hydrogel microcarriers loaded with an antifouling biocide. We produced Irgarol-encapsulated monodisperse hydrogel beads with an average diameter of 160 μm, CV of 3.8%, roundness of 0.97, and the encapsulation efficiency of 61.7 ± 2.9%. Using UV–vis spectroscopy, we observed a stable and controlled release through encapsulation. Cellulose fibers incorporated into the biocide enhanced the mechanical strength of the monodisperse microcapsules having an average diameter of 163 μm, CV of 3.7%, and roundness of 0.93. Finally, the antifouling effect of the drug released from the hydrogel beads was demonstrated with water grass (B. monnieri).
For practical applications, it will be important to formulate water-based and/or solvent-based paints with our alginate capsules and to evaluate the release rates of the biocide from the coated surfaces. It is also needed to demonstrate the scaled-up production of the particles via the parallelization of many channels on a chip42 because the production throughout in our present setup was very low (∼8 particles/s). We believe that this study suggests a promising route for manufacturing hydrogel microcapsules of hydrophobic herbicides that will be potentially suitable for the formulation of antifouling coating paints.
4. Experimental Section
4.1. Microfluidic Device
A microfluidic device comprising two serially connected cross-junctions was designed: the first junction for generating droplets of an aqueous sodium alginate (Na-alginate) solution containing drugs in coflowing corn oil and the second junction in which two streams of the fine water-in-oil CaCl2 emulsion coflow for external gelation (Figure 1). The upstream channels were 200 μm wide and 200 μm deep. As for the downstream junction, the two input channels were 200 μm wide, the drain channel was 400 μm wide, and these channels were 400 μm deep. We fabricated these channels in a chip (15 × 15 × 3.5 mm3) of quartz glass, according to our previously published protocol.37
4.2. Chemicals
Sodium alginate (80–120 mPa s for 10 g/L, 20°C), corn oil, calcium chloride (>95%, CaCl2), hexane (>95%), and ehylenediamine-N,N,N,N′-tetraacetic acid disodium salt dihydrate (>99.5%) were purchased from Fujifilm Wako Pure Chemical Corporation (Osaka, Japan). We prepared the disperse phase by mixing a 3 wt % aqueous Na-alginate solution with Irgarol 1071 (Ciba) or with both the drug and cellulose fibers (Arbocel UFC 100, JRS, MI, Figure S-6) using a disperser (T10 basic ULTRA-TURRAX, IKA, Königswinter, Germany). The contents of the disperse phase used in the experiments are shown in Table S-2. Corn oil was used as the continuous phase. As for the CaCl2 emulsion, corn oil containing a surfactant (SY-Glyster CRS-75, Sakamoto Yakuhin Kogyo, Osaka, Japan) at 0.1 wt % was mixed with a 30 wt % aqueous CaCl2 solution via homogenization at 30,000 rpm for 3 min. The weight fraction of aqueous solution in this emulsion was set as 0.26. The formulation of the materials other than the drug and fibers was based on our previous work,34 while we set the concentrations of the drug and fibers so that they would not clog the tubes and microchannels. The flow rates of the continuous phase (Qc), disperse phase (Qd), and emulsion phase (Qe) in all experiments were set at 2.0, 0.1, and 20.0 mL/h, respectively. Hexane and deionized water (Merck Direct-Q UV, Tokyo, Japan) were chosen for washing the collected hydrogel microparticles. In case of accidental clogging due to gelation in the device, an aqueous solution of ethylenediaminetetraacetic acid (5 wt %) was used to dissolve the clogs.
4.3. Preparation of Ca-Alginate Microcapsules
Gastight syringes (1000 series, Hamilton Company, NV) filled with solutions were linked to a stainless supporting holder assembled with the glass chip via poly(tetrafluoroethylene) tubes (inner diameter, 0.5 mm; outer diameter, 1.58 mm). Infusion of the solutions into the channels was controlled by syringe pumps (Legato 200 and KDS 200, KD Scientific, MA). The mixture that leaves the output tube (inner diameter, 0.8 mm; outer diameter, 1.58 mm) was poured on a nylon mesh (mesh size: 42 μm × 42 μm, Tokyo Screen, Tokyo, Japan) to collect the microcapsules. Deionized water was poured on these capsules to wash the CaCl2 emulsion away. Hexane was then used to flush out the residual corn oil. Finally, deionized water was added to wash out the hexane.
4.4. Ultraviolet–Visible (UV–vis) Spectroscopy
The released amount of encapsulated drug was measured by UV–vis spectroscopy. The setup for the UV–vis spectroscopy consisted of a light source (DT-Mini-2, Ocean Optics, Oxford, UK), a spectrometer (USB2000+, Ocean Optics), and a cuvette holder and a glass cuvette (9/Q/10/UM, Starna, London, UK). According to the Beer–Lambert law, the absorbance is defined as
| 5 |
where A is the measured absorbance, I0 is the transmitted intensity of UV–vis light after passing through the pure water, and I is the transmitted intensity of light passing through the tested solution. For the UV–vis measurement, the hydrogel microcapsules were collected on the nylon mesh. Then, they were flushed into the glass beaker with 50 mL of pure water. Next, 1.5 mL of the solution was transferred to the glass cuvette for measurement. The solution was poured back into the beaker (Figure S-7).
4.5. Relationship between UV–vis Light Absorbance and Drug Concentration
We demonstrated the relationship between the measured UV–vis light absorbance and drug concentration of the tested solution. Five samples with the drug concentration at approximately 7.5 mg/L were prepared. The five samples are detailed in Table S-3. We diluted each prepared sample by 1/6, 1/4, 1/3, 1/2, 2/3, and 5/6. Irgarol had only one peak value of absorbance (∼224 nm) in the wavelength range from 195 to 527 nm (Figure S-8). A graph of the relationship between the peak absorbance value (at 224 nm) and the drug concentration of the tested solution was prepared (Figure S-9a), and the linear fitting of scattering points was carried out (Figure S-9b). The relationship between the peak absorbance value and drug concentration was based on the following equation
| 6 |
where A is the peak UV–vis light absorbance value and Ca is the drug concentration of the tested solution. This linear fitting is detailed in Table S-4.
4.6. Preparation of Ca-Alginate Hydrogels and Nonencapsulated Drug Samples for UV–vis Spectroscopy
We prepared four Ca-alginate hydrogel particles loaded with only the drug and one type of hydrogel particle containing both the drug and cellulose fibers for the UV–vis spectroscopy. The details of the prepared hydrogels are shown in Table S-5. For type 1 hydrogels, 0.1 g of Irgarol was added in 20 g of 3 wt % Na-alginate solution as the disperse phase (Disperse #1) and we collected the particles for 30 min. For type 2 hydrogels, 0.05 g of the drug was added in 20 g of 3 wt % Na-alginate solution as the disperse phase (Disperse #2) and we also collected the particles for 30 min. Type 3 hydrogels had the same content as type 1 hydrogels, but we collected the particles for 60 min. Type 4 hydrogels had the same content as type 2 hydrogels, while the collection time was 60 min. Type 5 hydrogels were loaded with 0.1 g of the drug and 1.0 g of cellulose fibers, which were mixed in 3 wt % Na-alginate solution as the disperse phase (Disperse #3) and the collection time was set as 60 min. In addition, we defined the encapsulated amount me, which is the amount of encapsulated drug predicted from the drug concentration in the original disperse phase, the disperse phase flow rate, and the collection time, as follows:
| 7 |
where CD is the original concentration of drug in Na-alginate solution, Qd is the flow rate of the Na-alginate solution phase, and t means the collection time.
As for the nonencapsulated drug samples, we dissolved 3.0 or 6.0 mg of Irgarol in 20 mL of methanol. Then, 1 mL of the prepared solution was transferred into the glass beaker and evaporated at 80 °C for 3 h. Finally, 50 mL of pure water was added to the beaker to achieve a final concentration of 6.0 mg/L (nonencapsulated drug sample 1) or 3.0 mg/L (nonencapsulated drug sample 2).
4.7. Measurement of Deformation of Ca-Alginate Hydrogels
We used two Ca-alginate hydrogel particles loaded with only the drug or both the drug and fibers to compare their mechanical strength. We chose type 3 hydrogels for the sample without fibers and type 5 hydrogels for the sample with fibers. These hydrogel particles were sandwiched separately between a pair of glass slides (S1112, Matsunami Glass, Osaka, Japan), and we applied stress from the top side (Figure S-10). The deformation of the hydrogel layer was recorded using a digital camera (Power Shot G7X, Canon, Tokyo, Japan) and analyzed using ImageJ (NIH, MD).
4.8. Culturing of Water Grass
We cultured 0.5 g of water grass seeds (B. monnieri, Balai, Japan) in a glass beaker with 80 g of aquarium functional soil (Sunsun, Zhoushan, Zhejiang, China) and 20 mL of pure water. After 1 week of culture, the Ca-alginate microcapsules were collected and dried on the nylon mesh and flushed into glass beakers filled with water grass using 30 mL of pure water. The glass beakers were put in the normal outdoor environment with sufficient sunlight.
4.9. General Equipment
A high-speed camera (FASTCAM Mini AX50, Photron, Tokyo, Japan) was mounted on an upright microscope (BX-51, Olympus, Tokyo, Japan) to monitor the flow inside the microfluidic device. ImageJ was used to calculate the size and roundness of hydrogel microparticles. We obtained the particle diameter D and roundness R from the following equations
| 8 |
| 9 |
where S is the projected area and L is the perimeter of a hydrogel microparticle measured by ImageJ. More than 150 samples were measured to calculate a coefficient of variation (CV). Software Origin Pro 2016 (OriginLab, MA) was used for linear and curve fitting. The collected hydrogels were dried for 1 day at room temperature (∼23 °C). Then, we observed the dried particles using a scanning electron microscope (SEM, JSM-6610LA, JEOL, Tokyo, Japan). The ATR-FTIR spectra were measured by an FTIR spectrophotometer (IRAffinity-1, Shimadzu, Tokyo, Japan). The spectra were collected in the range from 4000 to 400 cm–1 with a resolution of 2 cm–1 at 32 scans.
Acknowledgments
This work was supported by the Japan Society for the Promotion of Science [Grant numbers 16K04916 and 20H02512].
Supporting Information Available
The Supporting Information is available free of charge at https://pubs.acs.org/doi/10.1021/acsomega.0c02971.
SEM images of the antifouling biocide and cellulose fiber; the UV–vis measurement process and its results; tables for materials composition (PDF)
The authors declare no competing financial interest.
Supplementary Material
References
- Shirakawa M. A.; Tavares R. G.; Gaylarde C. C.; Taqueda M. E. S.; Loh K.; John V. M. Climate as the most important factor determining anti-fungal biocide performance in paint films. Sci. Total Environ. 2010, 408, 5878–5886. 10.1016/j.scitotenv.2010.07.084. [DOI] [PubMed] [Google Scholar]
- Viitanen H.; Ritschkoff A. C.. Strategies-Remediation: Coating and Surface Treatment of Wood. In Fundamentals of Mold Growth in Indoor Environments and Strategies for Healthy Living; Adan O. C. G.; Samson R. A., Eds.; Wageningen Academic Publisher: Nertherlands, 2011; pp 463–484. [Google Scholar]
- Faÿ F.; Gouessan M.; Linossier I.; Rehel K. Additives for efficient biodegradable antifouling paints. Int. J. Mol. Sci. 2019, 20, 361 10.3390/ijms20020361. [DOI] [PMC free article] [PubMed] [Google Scholar]
- Kyei S. K.; Darko G.; Akaranta O. Chemistry and application of emerging ecofriendly antifouling paints: a review. J. Coat. Technol. Res. 2020, 17, 315–332. 10.1007/s11998-019-00294-3. [DOI] [Google Scholar]
- Almeida E.; Diamantino T. C.; Sousa O. Marine paints: The particular case of antifouling paints. Prog. Org. Coat. 2007, 59, 2–20. 10.1016/j.porgcoat.2007.01.017. [DOI] [Google Scholar]
- Bergek J.Evaluation of Biocide Release from Modified Microcapsules. Ph.D. Thesis; Chalmers University of Technology, 2017. [Google Scholar]
- Watermann B.; Eklund B. Can the input of biocides and polymeric substances from the antifouling paints into the sea be reduced by the use of non-toxic hard coatings. Mar. Pollut. Bull. 2019, 144, 146–151. 10.1016/j.marpolbul.2019.04.059. [DOI] [PubMed] [Google Scholar]
- Kamtsikakis A.; Kavetsou E.; Chronaki K.; Kiosidou E.; Pavlatou E.; Karana A.; Papaspyrides C.; Detsi A.; Karantonis A.; Vouyiouka S. Encapsulation of antifouling organic biocides in poly(lactic acid) nanoparticles. Bioengineering 2017, 4, 81–99. 10.3390/bioengineering4040081. [DOI] [PMC free article] [PubMed] [Google Scholar]
- Han X.; Wu J.; Zhang X.; Shi J.; Wei J.; Yang Y.; Wu B.; Feng Y. Special issue on advanced corrosion-resistance materials and emerging applications. The progress on antifouling organic coating: from biocide to biomimetic surface. J. Mater. Sci. Technol. 2021, 61, 46–62. 10.1016/j.jmst.2020.07.002. [DOI] [Google Scholar]
- Paijens C.; Bressy A.; Frere B.; Moilleron R. Biocide emissions from building materials during wet weather: identification of substances, mechanism of release and transfer to the aquatic environment. Environ. Sci. Pollut. Res. 2020, 27, 3768–3791. 10.1007/s11356-019-06608-7. [DOI] [PubMed] [Google Scholar]
- Trojer M. A.; Movahedi A.; Blanck H.; Nydén M. Imidazole and triazole coordination chemistry for antifouling coatings. J. Chem. 2013, 2013, 946739 10.1155/2013/946739. [DOI] [Google Scholar]
- Urbanczyk M. M.; Bester K.; Borho N.; Schoknecht U.; Bollmann U. E. Influence of pigments on phototransformation of biocides in paints. J. Hazard. Mater. 2019, 364, 125–133. 10.1016/j.jhazmat.2018.10.018. [DOI] [PubMed] [Google Scholar]
- Andersson M.Imidazole Containing Polymers Complexed with Cu2+ and Zn2+: Materials Properties and Coordination Chemistry As Studied Using Vibrational Spectroscopy, DSC and EPR. Ph.D. Thesis; Chalmers University of Technology, 2009. [Google Scholar]
- Dahlberg G.; Jansson P.; Lindblad L.; Arrhenius A.; Backhaous T.; Blanck H.; Granmo A.; Hilvarsson A.; Nordstierna L.; Nyden M.. et al. Marine Paint: Final Report; Chalmers University of Technology, University of Gothenburg: Gothenburg, 2012.
- Kavouras P.; Trompeta A. F.; Larroze S.; Maranhao M.; Teixeira T.; Beltri M.; Koumoulos E. P.; Charitidis C. A. Correlation of mechanical properties with antifouling efficacy of coatings containing loaded microcapsules. Prog. Org. Coat. 2019, 136, 105249 10.1016/j.porgcoat.2019.105249. [DOI] [Google Scholar]
- Bergek J.; Trojer M. A.; Mok A.; Nordstierna L. Controlled release of microencapsulated 2-n-octyl-4-isothiazolin-3-one from coatings: Effect of microscopic and macroscopic pores. Colloids Surf., A 2014, 458, 155–167. 10.1016/j.colsurfa.2014.02.057. [DOI] [Google Scholar]
- Zheng L.; Lin Y.; Wang D.; Chen J.; Yang K.; Zheng B.; Bai W.; Jian R.; Xu Y. Facile one-spot synthesis of silver nanoparticles encapsulated in natural polymetic urushiol for marine antifouliong. RSC Adv. 2020, 10, 13936–13943. 10.1039/D0RA02205E. [DOI] [PMC free article] [PubMed] [Google Scholar]
- Li Y.; Wang G.; Guo Z.; Wang P.; Wang A. Preparation of microcapsules coating and the study of their bionic anti-fouling performacne. Materials 2020, 13, 1669 10.3390/ma13071669. [DOI] [PMC free article] [PubMed] [Google Scholar]
- Faÿ F.; Linossier I.; Legendre G.; Vallée-Réhel K. Micro-encapsulation and antifouling coatings: development of poly(lactic acid) microspheres containing bioactive molecules. Macromol. Symp. 2008, 272, 45–51. 10.1002/masy.200851205. [DOI] [Google Scholar]
- Pisani E.; Ringard C.; Nicolas V.; Raphael E.; Rosilio V.; Moine L.; Fattal E.; Tsapis N. Tuning microcapsules surface morphology using blends of homo- and copolymers of PLGA and PLGA-PEG. Soft Matter 2009, 5, 3054–3060. 10.1039/b902042j. [DOI] [Google Scholar]
- Long Y.; Vincent B.; York D.; Zhang Z.; Preece J. A. Organic-inorganic double shell composite microcapsules. Chem. Commun. 2010, 46, 1718–1720. 10.1039/b911266a. [DOI] [PubMed] [Google Scholar]
- Trojer M. A.; Mohamed A.; Eastoe J. A highly hydrophobic anionic surfactant at oil-water, water-polymer and oil-polymer interfaces: Implications for spreading coefficients, polymer interactions and microencapsulation via internal phase seperation. Colloid Surf., A 2013, 436, 1048–1059. 10.1016/j.colsurfa.2013.08.005. [DOI] [Google Scholar]
- Nordstierna L.; Movahedi A.; Nydén M. New route for microcapsule synthesis. J. Dispersion Sci. Technol. 2011, 32, 310–311. 10.1080/01932691003659387. [DOI] [Google Scholar]
- Lavergne F. M.; Cot D.; Ganachaud F. Polymer microcapsules with “foamed” membranes. Langmuir 2007, 23, 6744–6753. 10.1021/la070149p. [DOI] [PubMed] [Google Scholar]
- Trojer M. A.; Nordstierna L.; Bergek J.; Blanck H.; Holmberg K.; Nyden M. Use of microcapsules as controlled release devices for coatings. Adv. Colloid Interface Sci. 2015, 222, 18–43. 10.1016/j.cis.2014.06.003. [DOI] [PubMed] [Google Scholar]
- Cunningham M. F.; Campbell J. D.; Fu Z.; Bohling J.; Leroux J. G.; Mabee W.; Robert T. Future green chemistry and sustainability needs in polymeric coatings. Green Chem. 2019, 21, 4919–4926. 10.1039/C9GC02462J. [DOI] [Google Scholar]
- Wang B.; Wan Y.; Zheng Y.; Lee X.; Liu T.; Yu Z.; Huang J.; Ok Y. S.; Chen J.; Gao B. Alginate-based composites for environmental applications: a critical review. Crit. Rev. Environ. Sci. Technol. 2019, 49, 318–356. 10.1080/10643389.2018.1547621. [DOI] [PMC free article] [PubMed] [Google Scholar]
- Song B. Lotus leaf-inspired design of calcium alginate particles with superhigh drug encapsulation efficiency and pH responsive release. Colloids Surf., B 2018, 172, 464–470. 10.1016/j.colsurfb.2018.09.001. [DOI] [PubMed] [Google Scholar]
- Chen Z.; Wang T.; Yan Q. Building a polysaccharide hydrogel capsule delivery system for control release of ibuprofen. J. Biomater. Sci., Polym. Ed. 2018, 29, 309–324. 10.1080/09205063.2017.1415583. [DOI] [PubMed] [Google Scholar]
- Chen J.; Tao N.; Fang S.; Chen Z.; Liang L.; Sun X.; Li J.; Liu Y. Incorporation of Fmoc-Y nanofibers into Ca-alginate hydrogels for improving their mechanical properties and the controlled release of small molecules. New J. Chem. 2018, 42, 9651–9657. 10.1039/C8NJ00729B. [DOI] [Google Scholar]
- Uyen N. T. T.; Hamid Z. A. A.; Tram N. X. T.; Ahmad N. Fabrication of alginate microspheres for drug delivery: A review. Int. J. Biol. Macromol. 2020, 153, 1035–1046. 10.1016/j.ijbiomac.2019.10.233. [DOI] [PubMed] [Google Scholar]
- Shintaku H.; Kuwabara T.; Kawano S.; Suzuki T.; Kanno I.; Kotera H. Micro cell encapsulation and its hydrogel-beads production using microfluidic device. Microsyst. Technol. 2007, 13, 951–958. 10.1007/s00542-006-0291-z. [DOI] [Google Scholar]
- Sugiura S.; Oda T.; Izumida Y.; Aoyagi Y.; Satake M.; Ochiai A.; Ohkohchi N.; Nakajima M. Size control of calcium alginate beads containing living cells using micro-nozzle array. Biomaterials 2005, 26, 3327–3331. 10.1016/j.biomaterials.2004.08.029. [DOI] [PubMed] [Google Scholar]
- Boggione D. M. G.; Batalha L. S.; Gontijo M. T. P.; Lopez M. E. S.; Teixeira A. V. N. C.; Santos I. J. B.; Mendonca R. C. S. Evaluation of microencapsulation of the UFV-AREG1 bacteriophage in alginate-Ca microcapsules using microfluidic devices. Colloids Surf., B 2017, 158, 182–189. 10.1016/j.colsurfb.2017.06.045. [DOI] [PubMed] [Google Scholar]
- Velasco D.; Tumarkin E.; Kumacheva E. Microfluidic encapsulation of cells in polymer microgels. Small 2012, 8, 1633–1642. 10.1002/smll.201102464. [DOI] [PubMed] [Google Scholar]
- Lee K. Y.; Mooney D. J. Alginate: Properties and biomedical applications. Prog. Polym. Sci. 2012, 37, 106–126. 10.1016/j.progpolymsci.2011.06.003. [DOI] [PMC free article] [PubMed] [Google Scholar]
- Liu Y.; Tottori N.; Nisisako T. Microfluidic synthesis of highly spherical calcium alginate hydrogels based on external gelation using an emulsion reactant. Sens. Actuators, B 2019, 283, 802–809. 10.1016/j.snb.2018.12.101. [DOI] [Google Scholar]
- Ur Rehman S. W.; Wang H.; Yao W.; Deantes-Espinosa V. M.; Wang B.; Huang J.; Deng S.; Yu G.; Wang Y. Ozonation of the algaecide irgarol: kinetics, transformation products, and toxicity. Chemosphere 2019, 236, 124374 10.1016/j.chemosphere.2019.124374. [DOI] [PubMed] [Google Scholar]
- Zhang A. Q.; Zhou G.; Lam M. H. W.; Leung K. M. Y. Toxicities of the degraded mixture of Irgarol 1051 to marine organisms. Chemosphere 2019, 225, 565–573. 10.1016/j.chemosphere.2019.03.038. [DOI] [PubMed] [Google Scholar]
- Noyes A.; Whitney W. The rate of solution of solid substances in their own solutions. J. Am. Chem. Soc. 1897, 19, 930–934. 10.1021/ja02086a003. [DOI] [Google Scholar]
- Utech S.; Prodanovic R.; Mao A. S.; Ostafe R.; Mooney D. J.; Weitz D. A. Microfluidic generation of monodisperse, structurally homogeneous alginate microgels for cell encapsulation and 3D cell culture. Adv. Healthcare Mater. 2015, 4, 1628–1633. 10.1002/adhm.201500021. [DOI] [PMC free article] [PubMed] [Google Scholar]
- Nisisako T. Recent advances in microfluidic production of Janus droplets and particles. Curr. Opin. Colloid Interface Sci. 2016, 25, 1–12. 10.1016/j.cocis.2016.05.003. [DOI] [Google Scholar]
Associated Data
This section collects any data citations, data availability statements, or supplementary materials included in this article.


