

Abstract
Musculoskeletal conditions such as rheumatoid arthritis (RA) and symptomatic osteoarthritis (OA) were the leading cause of disability in developed countries and disproportionately affects older adults. Frailty is an emerging concept in rheumatology, which represents an important construct to aid in the identification of individuals who are vulnerable to adverse events and less favourable outcomes. The prevalence of frailty among the community-dwelling population increases with age: it ranges from 7% to 10% in those aged over 65 years and to 20–40% among octogenarians. Among patients with RA, the prevalence of frailty is comparable to, or even greater, that of older geriatric cohorts and pre-frailty, a condition including a major health vulnerability between robust and frail, is much more prevalent in RA than in geriatric cohorts. Clinical OA is also associated with frailty and pre-frailty in older adults in European countries. The overall prevalence of clinical OA at any site was 30.4%; frailty was present in 10.2% and pre-frailty in 51.0 %. The diagnosis of frailty is usually clinical and based on specific criteria, which are sometimes inconsistent. Therefore, there is an increasing need to identify and validate robust biomarkers for this condition. In the literature, different criteria have been validated to identify frail older subjects, which mainly refer to two conceptual models: the Physical Frailty (PF) phenotype proposed by Fried and the cumulative deficit approach proposed by Rockwood. The purpose of this review was to quantitatively synthesize published literature on the prevalence of frailty in RA and OA and summarize current evidence on the validity and practicality of the most commonly used screening tools for frailty. (www.actabiomedica.it)
Keywords: rheumatoid arthritis, osteoarthritis, frailty, ageing population, outcome
Introduction
In recent years, frailty, often defined as “a biologic syndrome of decreased reserve and resistance to stressors, resulting from cumulative declines across multiple physiologic systems, and causing vulnerability to adverse outcomes” (1) has emerged as a significant area of research in rheumatology (1-5). It affects the quality of life, morbidity, and mortality and results in considerable medical and public expense such that it is now seen as one of the major challenges for health services (6-9). Pre-frailty occurs at an earlier stage of the frailty spectrum and is associated with the later development of frailty. Thus, pre-frailty might be a better target of screening and implementation of early interventions (10,11). In the literature, different criteria have been validated to identify frail subjects, which mainly refer to two conceptual models: the Physical Frailty (PF) phenotype proposed by Fried (1), and the cumulative deficit approach proposed by Rockwood (10-12).
Both models have received empirical validation, Fried et al. suggested that whilst each dysfunction on its own might be minor, it was the summation and interactive effects that created the syndrome (1). Frailty in community-dwelling adults, in geriatric medicine (13), and increasingly in other disciplines (14-16) was first characterised as a physical phenotype based on five physical components: weight loss, exhaustion, weakness, slow gait speed, and low levels of physical activity (1). People who meet none of these criteria are classified as “robust”, those who meet one or two criteria as pre-frail, and those who meet three or more criteria as frail. In contrast, frailty can also be diagnosed using models counting deficits across multiple domains such as the Frailty Index (12,17). Rockwood et al. defined frailty as a complex, multidimensional disorder related to accumulated deficits, involving the loss of reserves, including energy, physical ability, cognition, and health, increasing the individual’s vulnerability to adverse outcomes (18). Individuals with few deficits are considered relatively fit, while those with a greater number of health problems are considered increasingly frail and thus more vulnerable to adverse outcomes.
Prevalence of frailty at the population level
The prevalence of frailty varied more than fivefold, from 4.9 to 27.3 % (19). It was the lowest in Taiwan (4.9%), Switzerland (5.8 %), Ireland (6.0 %), and the USA (6.9 %) and the highest in southern European countries, Spain (27.3 %), Italy (23.0 %), France (15.0 %), and Greece (14.7 %). An European-wide study, the Survey of Health, Aging and Retirement in Europe (SHARE) which included more than 85,000 individuals aged over 65 years reported an average prevalence of 17 % (range 5.8–27.3 %) (20). A systematic review of frailty prevalence in a community population (21) reported the range to be 4.0%, independently mobile men over 65 (22), to 59.1%, community-dwelling Dutch older than 70 (23). According to another review, the mean prevalence of frailty in Latin America and Caribbean older people is even higher, 22–35% in men and 30–48% in women (24). In Japan, the prevalence of frailty in a community-dwelling older people was 24.3% for men and 32.4% for women, and increased for age > 80 years to 45.3 % for men and 50 % for women (25). In a study of 6 Canadian intensive care unit (ICUs), nearly 33% of patients met criteria for frailty (26). Observed in-hospital and 1-year mortality was significantly higher in those who were frail (32% vs 16% and 48% vs 25%, respectively) (26). The prevalence of frailty in those over 85 years of age was 26.1 %. Women were almost twice as likely as men to be frail (21).
In Italy, pooled prevalence in community studies was 15% for ten studies that included patients aged ≥ 65 years (Table I). It has been demonstrated the close relationship between frailty and psychosocial factors, suggesting the need to take into account simultaneously physical and psychosocial components of human functioning (27). As expected we found significant heterogeneity between studies in keeping with marked differences in the inclusion criteria; this has importance given that no single consensus definition of frailty is as yet accepted and the two most commonly used methods to define the syndrome, the Frailty Index and the Frailty Phenotype, while complementary, are not interchangeable, given that they measure different constructs.
Table I.
Characteristics of studies reporting prevalence rates of frailty at population level in ADVANTAGE Joint Action (JA) in Italy. Adapted from O’Caoimh R et al. “Prevalence of frailty at population level in European ADVANTAGE Joint Action Member States: a systematic review and meta-analysis” Ann Ist Super Sanita. 2018
| Source | Frailty prevalence | Number of participant | Setting | Frailty definition | Age (Years) | Women (%) |
| Ble et al. | 6.5 | 827 | Community | CHS | ≥65 | 54.0 |
| Gallucci et al. | 16.3 | 668 | Community | Other | ≥70 | 53.4 |
| Bilotta et al. | 38.0 | 302 | Geriatric Clinic, Hospital | SOF | ≥65 | 71.0 |
| Solfrizzi et al. | 7.6 | 2581 | Community | CHS | 65-84 | 45.2 |
| Forti et al. | 7.2 | 766 | Community | SOF | ≥65 | 53.4 |
| Roppollo et al. | 12.7 | 267 | Community | CHS | ≥65 | 59.9 |
| Veronese et al. | 10.0 | 1754 | Community | CHS | ≥65 | 64.0 |
| Santos Eggiman et al. | 23.0 | 833 | Community | SHARE-FI | ≥65 | Not reported |
| Liotta et al. | 21.5 | 1331 | Community | Other | ≥65 | 54.2 |
| Mulasso et al. | 14.0 | 210 | Community | Other | ≥65 | 66.0 |
Abbreviations: Cardiovascular Health Study (CHS); Study of Osteoporotic Fractures (SOF) Index; Survey of Health, Ageing and Retirement in Europe Frailty Instrument (SHARE-FI)
Insights from the epidemiology of frailty and musculoskeletal disorders
Frailty is closely linked to musculoskeletal health. Musculoskeletal functioning is a key component on quantification of frailty, at the same time, frailty is associated with the most common age-related disease conditions such as rheumatoid arthritis (RA) and osteoarthritis (OA) (28-29). Many published studies on frailty in multiple rheumatic disorders have provided insight into the overlap between frailty and musculoskeletal health, including proposed pathogenic mechanisms and recommended interventions to prevent or ameliorate frailty (2,3,22,30,31). The overall prevalence and knowledge of factors that influence frailty in musculoskeletal disorders (MSD), however, are reported with considerable inconsistency across studies and have not been effectively synthesized through prior narrative reviews. Additionally, recent scientific statements have recommended a formal frailty assessment as a critical element in determining the care of adults with rheumatic diseases.
Rheumatoid arthritis
The overall prevalence of RA, in a large sample of the Italian population, is estimated to be of 0.46% (28,29). Its incidence continues to increase with age at least into the seventh decade of life and possibly beyond (32,33). It was reported that the cumulative lifetime risk of developing RA is <1% before 50 years of age, but greatly increases for both genders starting at approximately 60 years of age and then plateaus after 80 years of age.
There have been few reports of the prevalence of frailty in patients with RA (4). Broadening understanding of the determinants of frailty in RA are necessary because, even as the therapeutic armamentarium for RA continues to grow, individuals with RA continue to commonly experience physical disability and reduced health-related quality of life (32,33,35-37). Disease severity, functional disability, age, and socioeconomic status are the most relevant predictors of cost increase in RA (35). RA is a systemic autoimmune disease characterized by chronic synovial joint inflammation, with restriction of the joint mobility and deformities by leading to cartilage destruction, bone erosion, and impairment in joint integrity and, consequently, reduction in physical function and patient’s quality of life (38,39). RA predisposes individuals to many of the factors that comprise the Fried definition of frailty (40), including sarcopenia, fatigue, and low activity (4,41-45). Sarcopenic obesity, the combination of low lean mass and high-fat mass, is associated with frailty in older adults (46). In RA, sarcopenic obesity is common and is associated with worse physical function (41). Thus, in chronic inflammatory conditions such as RA, it is possible that other definitions of frailty, accounting for both obesity and sarcopenia, may have greater relevance and stronger associations with clinical outcomes. The odds ratio for frailty or pre-frailty was 3.1-fold higher with sarcopenia than without sarcopenia. The prevalence of frailty among this RA cohort is comparable to, if not greater than, that of older geriatric cohorts (2,4,22,47). It was reported to be just 23.4% by Barile-Fabris et al. (48), 12.9% by Andrews et al. (2) 15% by Haider et al (3) and 16.6% by Salaffi et al. (4). More recently, Tada et al (49) reported that prevalences of frailty, pre-frailty and normal in RA patients were 18.9%, 38.9% and 42.2%. Pre-frailty is more prevalent (69%) in RA cohorts than in geriatric cohorts (40–55%) (22,31). Among the RA cohort studied by Andrews et al. (2), the prevalence of frailty was 13%, compared with an average prevalence of 4–11% in geriatric cohorts that are at least 10 years older (22,31). The prevalence of frailty observed in an RA cohort is greater than those observed in elderly patients with OA (10%) (50), and is comparable to that observed in patients with chronic obstructive pulmonary disease (COPD) (51). In our cohort, with an average age of 60 years old, the prevalence of frailty was 16.6%, and pre-frailty was also comparable (32.4%) to that of geriatric cohorts (4,22,31). Our investigation of the individual components of frailty in RA has demonstrated an association with age, disease activity and comorbidity burden (4).
Symptomatic osteoarthritis (OA)
OA is the most prevalent chronic joint disease in the world and one of the most common sources of pain and disability in the elderly (52). OA of the knee and hip, affected 7.5–40% of the population by the age of 65 years (28,53-56). They are a major cause of pain and disability among the elderly (9,54), and pose a significant economic burden on the community (53-55). Some studies have found a relationship between OA and frailty, using different diagnostic criteria in both processes (57,58), and knee OA has been shown to be associated with a greater prevalence and risk of developing frailty (58). The results from the European Project on OSteoArthritis (EPOSA) across six European countries shown that the frailty was present in 10.2 % of the population, ranging across countries from a prevalence of 5.6 % in Germany and Sweden to 15.4 % in the UK (p < 0.001). The overall prevalence of pre-frailty was 51.0 %. Both frailty and pre-frailty were higher in women and increased with age in both sexes, with frailty reaching 26.1 % in women aged 80 and over. The Survey of Health, Ageing and Retirement in Europe (SHARE) (58), which compared frailty across 10 European countries, found a much higher prevalence in the Mediterranean countries (Italy and Spain) and a lower prevalence in Nordic countries like Sweden.
A cross-sectional analysis in the Canadian Study of Health and Aging-Wave found that with the presence of knee pain compared with mild or no knee pain, the risk of developing prefrailty or frailty was higher by two-fold and five-fold, respectively, in community-dwelling older adults (59). The recognition that frailty and pain coexist has the potential to improve patient care for both conditions. Lee et al. examined the frailty status and associated factors in older Chinese adults (60). The study suggested that age and knee OA were strongly associated with frailty status. Another study revealed that the incidence of frailty was significantly influenced by marital status (61). Recently, Bindawas et al. (31), showed that knee pain (particularly bilateral knee pain) is associated with an increased risk of developing prefrailty and frailty over time. After adjusting for age, sex, race, education, marital status, smoking status, comorbidities, and body mass index, unilateral knee pain at baseline was associated with an increased odds of developing pre-frailty (OR = 1.14) and frailty (OR = 1.89), and bilateral knee pain at baseline was also associated with an increased risk of pre-frailty (OR = 1.41) and frailty (OR = 2.21) over time, in comparison with no knee pain. A larger proportion, i.e. 22.4% of persons with hip or knee OA, was considered frail using Fried’s Frailty Phenotype in a Brazilian study (57). Highly effective treatment for end-stage OA is arthroplasty surgery (62). At present, 83% of the patients receiving total hip arthroplasties (THA) and 79% of patients receiving total knee arthroplasties (TKA) are older than 60 years of age. As frailty is highly prevalent in the elderly, a considerable proportion of patients are likely undergoing THA or TKA (11). It is generally acknowledged that frailty hampers the ability to resist stressors, leading to vulnerability for adverse outcomes after surgery (63,64). One-third (33.3%) of the patients undergoing THA and a quarter (24.1%) of those undergoing TKA are frail (65).
Overlaps between frailty and sarcopenia
Sarcopenia is a very common, but frequently overlooked and undertreated geriatric disease, defined as the as a syndrome characterized by progressive and generalized loss of skeletal muscle mass and strength with a risk of adverse outcomes such as physical disability, poor quality of life and death (66,67). The term ‘‘sarcopenic obesity’’ has been used to describe a subgroup of sarcopenic individuals with a high percentage of body fat (68). Similar to the frailty phenotype, the European Working Group on Sarcopenia in Older People (EWGSOP) recommend categorizing sarcopenia into pre-sarcopenia, sarcopenia, and severe sarcopenia, depending on the presence of certain criteria. They suggest that the pre-sarcopenia stage is characterised by a low muscle mass with preserved muscle strength (grip strength) and normal physical performance (gait speed). The sarcopenia stage is defined as low muscle mass and either diminished grip strength or gait speed, whereas severe sarcopenia adds up all three factors (66). Even conservative estimations suggest that sarcopenia affects more than 50 million people today and will affect more than 200 million people in the next 40 years (66). Progressive loss of muscle mass begins as early as 40 years of age and has been estimated at about 8.0% per decade until the age of 70 years. Applying the EWGSOP definition of sarcopenia in a community-dwelling population (the UK-based Hertfordshire Cohort Study), researchers reported that sarcopenia was present in 4.6% of men and 7.9% of women at a mean age of 67 years (69). After reaching 70, this loss increases to 15.0% every decade (70) and can eventually result in a 50.0% loss in muscle mass by the age of 80 (71). Musculoskeletal disorders, such as osteoporosis, RA and OA, are closely associated with sarcopenia (47,72). Muscle changes that occur over time are associated with considerable risk of falls, loss of independence in these patients and hospitalization with poorer health outcomes, this condition is therefore associated with increased morbidity and health care costs (73).
The relationship between frailty and sarcopenia is not yet fully characterised but these conditions share many of the same clinical outcomes, associations and suggested pathophysiology. While the two conditions, sarcopenia and frailty, are closely related, it may be seen that sarcopenia is a key component of frailty; most frail older people exhibit sarcopenia, and some older people with sarcopenia are also frail. The EWGSOP consensus discussed the frailty concept and its overlap with sarcopenia. It recognized that frailty is a multidimensional concept characterised by deficits in multiple organ systems, i.e. psychological, cognitive, and/or social support and other environmental factors, as well as physical limitations (66). Both conditions may be considered as being geriatric syndromes with multifactorial causes, both increasing the risk of serious disability with consequent and strong impact on healthcare costs. Sarcopenia is reported to be twice as common as frailty in the general population (74). The prevalence of both conditions is dependent on population and definition. Thus, one of the major challenges of geriatric medicine is to recognize these conditions as soon as possible and to halt (or slow) the downward spiral of increasing comorbidity and frailty.
Frailty screening tools
Several instruments have been developed to measure frailty as part of a stepwise assessment of vulnerability. To identify studies reporting frailty measurements in musculoskeletal disorders, EMBASE and PubMed databases were consulted. Search terms were broadly set as: ‘frail elderly’, and ‘Rheumatologic Assessment/methods’. The initial search was performed in November 2019 and was restricted to studies published between January 2010 and November 2019. Studies prior to 2009 were not included, because it was considered that if a frailty measurement had not been discussed in the literature in the past five years, then it was unlikely to have been recently used. The search was limited to English language articles. Titles and abstracts were screened against the inclusion criteria. Only full research papers and review articles were considered.
In the literature, different criteria have been validated to identify frail older subjects, which mainly refer to two conceptual models: PF phenotype proposed by Fried (1), and cumulative “Index Method” proposed by Rockwood (12). These two instruments are indeed very different and should rather be considered as complementary (Table II). Both models have received empirical validation and there is no agreement on how to best measure it. Therefore, compared with the phenotypic approach, the cumulative deficit approach is more time-consuming. Besides, weighting items often improves the (retrospective) predictive power of a frailty index within any given dataset, but specific weightings preclude generalizability to other populations (75). At the population level, PF has been applied to data from large-scale health surveys in Canada (18), the United States (76) and Hong Kong (77).
Table II.
Main characteristics of the frailty phenotype and the frailty Index of accumulative deficits.
| Frailty phenotype | Frailty index of accumulative deficit |
| Signs, symptoms | Diseases, activities of daily living, results of a clinical evaluation |
| Possible before a clinical assessment | Doable only after a comprehensive clinical assessment |
| Categorical variable | Continuous variable |
| Pre-defined set of criteria | Unspecified set of criteria |
| Frailty ass a pre-disability syndrome | Frailty as an accumulation of deficits |
| Meaningul results potentially restricted to non-disabled lder persons | Meaningful results in every individual, independently of functional status or age |
Frailty Phenotype
Frailty Phenotype is a popular measurement of frailty. It is based on a pre-defined set of five criteria exploring the presence/absence of signs or symptoms (i.e. involuntary weight loss, exhaustion, slow gait speed, poor handgrip strength, and sedentary behaviour). The number of criteria (a 6-level ordinal variable ranging from 0 to 5) is categorised into a 3-level variable depicting robustness (none of the criteria), pre-frailty (one or two criteria) and frailty (three or more criteria). The frailty phenotype can be applied at the first contact with the subject and does not need a preliminary clinical evaluation. Therefore, it may serve for the initial risk stratification of the population according to different profiles (i.e. robust, pre-frail and frail). Yet, the frailty phenotype does not provide any indication about preventive or therapeutic interventions to put in place. By being composed of very general signs or symptoms, it can mainly rise an ‘alert’ about a possible problem. Such alert cannot generate immediate preventive or therapeutic interventions because no information is available about the underlying causes of the condition of risk. For example, it would be improper to treat involuntary weight loss or slow gait speed without knowing the underlying causal conditions. Some of the examples of these tools are the following: the Fried’s phenotype method (FRAIL) Questionnaire (1), the Survey of Health, Ageing and Retirement in Europe Frailty Instrument (SHARE-FI) (17), the Short Performance Physical Battery (SPPB) (78), and the Gérontopôle Frailty Screening Tool (GFST) (79).
Fried’s phenotype method (FRAIL) Questionnaire
The Fried’s phenotype method (FRAIL) questionnaire screening tool classifies older adults as frail, pre-frail or non-frail based on five criteria (which encompasses general weight loss and sarcopenia), weakness, exhaustion/endurance, slowness, and low physical activity (1) (Table III). For each of the criteria, the participant was classified as frail or not frail, using the following cut-offs: 1) weight loss: more than 10 lbs lost unintentionally in the last year; 2) exhaustion: participants stating that they felt that everything they did was an effort or that they could not get going (from the CES-D Depression Scale) a moderate amount of the time or most of the time; 3) physical activity (Minnesota Leisure Time Activity Questionnaire): energy expenditure <383 kcal per week for men and <270 kcal per week for women; 4) walk time (15-ft walk): ≥7 sec (men height ≤ 173 cm, women height ≤ 159 cm) or ≥6 sec (men height >173 cm, women height >159 cm); 5) grip strength (Jamar Dynamometer, Layfayette Instruments, USA) (average of three trials): ≤29– 32 kg for men (stratified by BMI classifications) and ≤17– 21 kg for women (stratified by BMI classifications) (1). If the participant is unable to answer any questions due to memory problems, the accompanying legally authorized representative provided an answer, which is the approach used in other studies (80). Participants were instructed to use an assistive ambulatory aid for the walk test if aid was used in their normal routine. Frail participants scored below the cut-offs for three or more criteria, pre-frail participants scored below the cut-offs for one or two criteria, and non-frail participants did not score below the cut-offs for any criteria (1).
Table III.
Characteristics of the Simple FRAIL Questionnaire.
| Screening tool | Measurement method | Criteria for frailty |
| Simple FRAIL Questionnaire | 1. Fatigue: are you fatigued? | Frail: ≥3 |
| 2. Resistance: cannot walk up 1 flight of stairs? | Pre-frail: 1or 2 | |
| 3. Aerobic: cannot walk 1 block? | ||
| 4. Illness: do you have more than 5 illness? | ||
| 5. Loss of weight: have you lost more than 5% of your weight in the past 6 months? |
Survey of Health, Ageing and Retirement in Europe Frailty Instrument (SHARE-FI)
The Survey of Health, Ageing and Retirement in Europe Frailty Instrument (SHARE-FI) was created as per the standard procedure (17). In SHARE-FI, the frailty score and the cut-offs for the definition of the frailty categories (i.e. non-frail, pre-frail and frail) are based on latent variable modelling, and not on Fried et al.’s rule (also in use by Santos-Eggimann et al.) based on the number of criteria met: ≥ 3 criteria: frail; 1 or 2 criteria: pre-frail; 0 criteria: non-frail. The variables previously selected by Santos-Eggimann et al. were used (11). In particular, exhaustion was identified with the question: “In the last month, have you had too little energy to do the things you wanted to do?”. A positive answer coded as 1, a negative answer as 0. The weight loss criterion was identified by reporting a “Diminution in desire for food” in response to the question: “What has your appetite been like?” or, in the case of a non-specific or uncodeable response to this question, by responding “Less” to the question: “So, have you been eating more or less than usual?”. The presence of the criterion was coded as 1, its absence as 0. Weakness was assessed by handgrip strength using a grip device. Slowness was defined as a positive answer to either of the following two items: “Because of a health problem, do you have difficulty [expected to last more than 3 months] walking 100 metres?” or “... climbing one flight of stairs without resting?”. One or two positive answers were scored 1, and two negative answers were scored 0. The low activity criterion was evaluated by the question: “How often do you engage in activities that require a low or moderate level of energy such as gardening, cleaning the car, or doing a walk?”. This variable was kept ordinal: 1 = “More than once a week”; 2 = “Once a week”; 3 = One to three times a month” and 4 = “Hardly ever or never”. The parameters above mentioned allowed the calculation of the SHARE Frailty Instrument (SHARE-FI), its calculators (one for each sex) are freely accessible on web. The SHARE-FI calculators (one for each sex) are freely accessible on BMC Geriatrics (http://www.biomedcentral.com/1471-2318/10/57/additional), and translated versions can be accessed on https://sites.google.com/a/tcd.ie/share-frailtyinstrument-calculators/. When data is entered into the calculator, the tool provides a continuous frailty score (i.e. the predicted discrete factor score, whose formulae are in the paper) and enables automatic classification into phenotypic frailty categories: non-frail, prefrail and frail. SHARE-FI may contribute to quality in primary care by offering a quick and reliable way to assess and monitor frailty in community dwelling individuals over the age of 50 and prioritise their access to resources, and it serves as a novel tool for audit and research (81).
Short Performance Physical Battery (SPPB)
The Short Performance Physical Battery (SPPB) consists of three assessments: 1) repeated chair stands; 2) balance tests (side-by-side, semi-tandem and tandem balance tests); 3) an eight-foot walk test (78). Similar to Fried’s phenotype method, the participant’s scores on each component of the battery were compared to normative data and a score between zero and four was determined for each component. If participants were unable to complete a component of the test, a score of zero was given for that component. A final summary performance score out of 12 is calculated, with higher scores indicating superior lower extremity function (78). Regarding the threshold score for frailty, community-dwelling older adults who score ≤ 9 on the SPPB are most likely to be classified as frail (82) and are at risk of losing the ability to walk 400 m (83) (predictive validity). An SPPB score of ≤9 has the most desirable sensitivity (92%), specificity (80%) and the greatest area under the curve (AUC =0.81) for identifying frail adults (84). To classify participants as frail, pre-frail and non-frail, the following cut-offs were used: SPPB zero–six (frail), SPPB seven– nine (pre-frail), SPPB 10–12 (non-frail) (85).
Gérontopôle Frailty Screening Tool (GFST)
The Gérontopôle Frailty Screening Tool (GFST) is designed for early recognition of frailty in community-dwelling older people and shows good potential as a frailty screening tool (85). It comprises two steps: a questionnaire is performed first, followed by a clinician’s judgement of frailty status. The questionnaire includes six components: living alone, involuntary weight loss, fatigability, mobility, memory complaints and slow gait speed (≥4 s for 4 m), with all questionnaire components having three potential answers: yes/no/unknown (85). (Table IV). No reliability studies have yet been performed on the GFST and its predictive ability has not yet been established. Validation studies of the GFST also need to be performed cross-culturally.
Table IV.
The Gérontopôle Frailty Screening Tool (GFST).
| Question | Yes | No | Unknown |
| Is your patient living alone? | o | o | o |
| Involountary weight loss in the past 3 months? | o | o | o |
| Fatigability during the last 3 months? | o | o | o |
| Mobility difficulties for the last 3 months? | o | o | o |
| Memory complaints? | o | o | o |
| Slow gait speed (+4s for 4 meters?) | o | o | o |
Frailty index of accumulative deficits
The Frailty Index (FI) of Accumulative Deficits (FI-CD) was first proposed by Rockwood and Mitnitski as a way to incorporate the multidimensional nature of frailty into an operational definition (86). The FI-CD is composed of a long checklist of clinical conditions and diseases. The conceptual design of this index deems as more important the deficit accumulation. It has been reported that estimates of risk are robust when a minimum of 50 items are considered, but shorter versions (as low as 20 conditions) have also been explored. Although the FI has sometimes been categorised to mirror dichotomous conditions (e.g. robustness versus frailty), its major distinctive trait resides in its continuous nature. It is evident that the FI-CD is inapplicable at the first contact with an individual because it can only be generated after (or in parallel with) a comprehensive geriatric assessment. Once completed, the FI then becomes extremely informative for the continuous follow-up of the subject. In fact, the FI-CD is likely more sensitive to modifications than the categorical frailty phenotype. Thus, the FI may be a more useful tool to ascertain the effectiveness of any intervention and to describe the health status trajectories over time. Despite its many positive attributes, the FI-CD does have its limitations: it can be time consuming to calculate and its mathematical nature, although simple, renders it unpopular clinically (87).
Among the many FI-CD that are included in this category of instruments are the following: the Groningen Frailty Indicator (GFI) (88), the Edmonton Frail Scale (EFS) (89), the Comprehensive Geriatric Assessment (CGA) (90), the Canadian Community Health Survey-based frailty index (CCHS) (91), the Tilburg Frailty Indicator (TFI) (92), the PRISMA-7 questionnaire (93), the Frailty Index for Elders (FIFE) (94), the Vulnerable Elders Survey (VES) (95), the Frailty and Autonomy Scoring Instrument of Leuven (FRAIL) (96), the Frailty Staging System (FSS) (97), the Comprehensive Frailty Assessment Instrument (CFAI) (98), the Maastricht Frailty Screening Tool for Hospitalised Patients (MFST-HP) (99), the Kihon Checklist (KCL) (100), the Short screening instrument (FRESH-screening) (101), and QFrailty score (6).
Groningen Frailty Indicator (GFI)
The Groningen Frailty Indicator (GFI) is a widely used frailty measurement developed in the Netherlands, with moderate internal consistency and adequate discriminative ability (88). It contains 15 dichotomous self-reported items, comprising of: physical factors (independence in shopping, walking, dressing, toileting; physical fitness, vision, hearing; weight loss and polypharmacy); a cognitive component (memory issues); social factors (emptiness, missing others, feeling abandoned); and a psychological component (feeling downhearted or sad; feeling nervous or anxious) (Table V). Frailty by GFI is classified on a spectrum ranging from a score of 0 (normal activity without restriction) to 15 (completely disabled), with scores ≥4 indicative of frailty (102). The GFI shows good feasibility and reliability as a frailty measurement (102). Studies of the GFI have been predominantly been confined to the Netherlands, and cross-cultural validation studies are required.
Table V.
The Groningen Frailty Indicator (GFI).
| Are you able to carry out these tasks single-handed without any help? (The use of aids such as a walking stick, walking frame, wheelchair, is considered as independent) |
| 1. Shopping, |
| 2. Walking around outside (around the house or to the neighbours) |
| 3. Dressing and undressing |
| 4. Going to the toilet |
| 5. What score do you give yourself for physical fitness? (scale 0 to 10) |
| 6. Do you experience problems in daily life due to poor vision? |
| 7. Do you experience problems in daily life due to poor hearing? |
| 8. During the last 6 months (6 kg) have you lost a lot of weight unwillingly? (or 3 kg in 1 month) |
| 9. Do you take 4 or more different types of medicine? |
| 10. Do you have any complaints about your memory? |
| 11. Do you sometimes experience an emptiness around you? |
| 12. Do you sometimes miss people around you? |
| 13. Do you sometimes have the feeling of being left alone? |
| 14. Have you recently felt downhearted or sad? |
| 15. Have you recently felt nervous or anxious? |
| Scoring: |
| Independent=0; dependent=1 |
| 0–6=1; 7–10=0 |
| No=0; Yes=1 |
| No or sometimes=0; Yes=1 |
| No=0; sometimes or Yes=1 |
Edmonton Frail Scale (EFS)
The Edmonton Frail Scale (EFS) is a valid and reliable measurement tool for the identification of frailty in the hospital setting (89). The EFS is scored out of 17, and contains nine components: cognition, general health status, self-reported health, functional independence, social support, polypharmacy, mood, continence and functional performance (89) (Table VI). Component scores are summed, and the following cut-off scores used to classify frailty severity: not frail (0–5); apparently vulnerable (6–7); mildly frail (8–9); moderately frail (10–11) and severely frailty (12–17) (95). A frailty state was assigned to participants with scores of 8 or greater (103). In a community-based sample, it was a valid measure compared to the clinical impression of geriatric specialists (89). The EFS has been shown to predict complications and adverse outcomes among elderly patients undergoing elective surgery and admitted to the hospital for the acute coronary syndrome (104).
Table VI.
The Edmonton Frail Scale (EFS) for the identification of frailty.
| Frailty Domain | Item | 0 Point | 1 Point | 2 point |
| Cognition | Please imagine that this pre-dawn circle is a clock. I would like you to place the numbers in the correct positions then place the hands to indicate a time of “ten after eleven” | No errors | Minor spacing errors | Other errors |
| General health status | In the past year, how many times have you been admitted to a hospital? | 0 | 1-2 | ≥2 |
| In general, how would you describe your health? | Excellent/Very good/Good | Fair | Poor | |
| Functional independence | With how many of the following activities do you require help: meal preparation, shopping, transportation, telephone, housekeeping, laundry, managing money, taking medications? | 0-1 | 2-4 | 5-8 |
| Social support | When you need help, can you count on someone who is willing and able to meet your needs? | Always | Sometimes | Never |
| Medication use | Do you use five or more different prescription medications on a regular basis? | No | Yes | |
| At times, do you forget to take your prescription medications? | No | Yes | ||
| Nutrition | Have you recently lost weight such that your clothing has become looser? | No | Yes | |
| Mood | Do you often feel sad or depressed? | No | Yes | |
| Continence | Do you have a problem with losing control of urine when you don’t want to? | No | Yes | |
| Functional performance | I would like you to sit in this chair with your back and arms resting. Then when I say “Go”, please stand up and walk at a safe and comfortable pace to the mark on the floor (approximately 3m away), return to the chair and sit down | 0-10 seconds | 11-20 s econds | >20 seconds, patient unwilling or requires assistance |
| Total | Final score is the sum of column totals | /17 |
Scoring the Reported Edmonton Frail Scale (…./17):
Not Frail 0-5; Apparently vulnerable 6-7; Mild Frailty 8-9; Moderate frailty 10-11; Severe frailty 12-17
Comprehensive Geriatric Assessment (CGA)
The Comprehensive Geriatric Assessment (CGA) is a multidisciplinary and multidimensional assessment (90). CGA is designed as both a diagnostic tool and a tool to develop treatment plans. CGA is more than an assessment process of an individual; it is an intensive interdisciplinary process to assess the functional status of the elderly; it is used to develop a coordinated plan to maximize their overall health. It consists of 15 questions covering three domains: functional status (seven questions on ADL and IADL); cognitive status (four questions from the Mini-Mental State Examination (MMSE); and depression (four questions from the Geriatric Depression Scale (GDS)-15) (Table VII). A cut-off value for each domain was identified to indicate whether a more elaborate assessment was needed: namely, scores of ≥1 for ADL and IADL; ≤6 for the MMSE; and ≥2 for the GDS-4. The information from these assessments forms the management plan which involves specific treatment goals that are patient and carer focused. Further assessment of frailty was needed if a positive score was identified in one of the aCGA domains (105). A meta-analysis of CGA in hospitals in 2011 identified 22 randomised trials with a total of 10,315 older patients included. This reported that older patients receiving CGA in hospital increased the chance of being alive or in their own home at six months by 25% (106).
Table VII.
Main characteristics of Comprehensive Geriatric Assessment (CGA).
| Test | Evaluated issue | Current way of Assessment | Score’s range |
| Functional Tests | |||
| Barthel index | Performance on the basic activities | Face to face interview | 0-100 |
| Lawton index | Performance on instrumental activities (more complex than basic activities) | Face to face interview | 0-8 (F) 0-5 (M) |
| Time Up and Go test | Gait and balance | Visual observation | Time (seconds) |
| Tinetti test Gait | Gait | Visual observation | 0-9 |
| Tinetti test Balance | Balance | Visual observation | 0-26 |
| Mental Tests | |||
| Pfeiffer test | Screening test for dementia | Face to face interview | 0-10 |
| MMSE TEST | Screening test for dementia | Face to face interview | 0-30 |
| Yesavage test | Screening test for depression | Face to face interview | 0-15 |
| Social Test | |||
| Zarit test | Caregiver’s emotional burden | Face to face interview | 0-88 |
| Clinical Tests | |||
| Face Pain Scale | Pain intensity | Face to face interview | 0-6 |
| Analalogic Visual Scale | Pain intensity | Face to face interview | 0-10 |
Canadian Community Health Survey-based frailty index (CCHS)
The original Canadian Community Health Survey-based frailty index (CCHS) contained 30 deficits and a scoring algorithm for different levels of each deficit. Deficits included self-rated health, body mass index, change in health status, and function related to vision, hearing, mobility, cognition, pain, and so on among other items (91). The index was created according to established criteria for creating frailty indices from existing survey data (17). CCHS is a frailty rating score and ranges from very fit to severely frail. The original validation exercise determined that “frail” was defined as a score above 0.21. An additional “pre-frail” category emerged between scores 0.10 and 0.21 (91).
Tilburg Frailty Indicator (TFI)
The Tilburg Frailty Indicator (TFI) is a self-administered questionnaire developed in the Netherlands during 2010 (92). Three domains of frailty are assessed (Table VIII). The physical domain is evaluated by asking questions about physical health, weight loss, walking, balance, hearing, vision, strengths in hands and tiredness. The psychological domain contains memory, feeling down, anxiety or nervousness and coping with problems. The social domain is assessed by living alone, missing people and receiving enough support. The total score of the TFI is calculated by adding all scores of the items, resulting in a total score ranging from 0 to 15. The score of the subscales ranges from 0 to 8 for the physical domain, from 0 to 4 for the psychological domain and from 0 to 3 for the social domain. Presence of frailty is determined if scores are ≥5 out of 15. The TFI shows good validity and reliability for community-dwelling older people. The physical components of the TFI have been found to show good predictive ability of adverse outcomes, as opposed to its social components (92).
Table VIII.
The Tilburg Frailty Indicator (TFI).
| Part B-Frailty components | Yes | Sometimes | No |
| B1 Physical components | |||
| 11. Do you feel physically healthy? | o | o | |
| 12. Have you lost a lot of weight recently without wishing to do so? | o | o | |
| (A lot is: 6 kg or more during the last six months, or 3 kg or more during the last month) | |||
| Do you experience problems in your daily life due to: | |||
| 13. … Difficulty in walking | o | o | |
| 14. … Difficulty maintaining your balance? | o | o | |
| 15. … Poor hearing? | o | o | |
| 16. … Poor vision? | o | o | |
| 17. … Lack of strength in your hands | o | o | |
| 18. … Physical tiredness | o | o | |
| B2 Psychological components | |||
| 19. Do you have problems with your memory? | o | o | o |
| 20. Have you felt down during the last month? | o | o | o |
| 21. Have you felt nervous or anxious during the last month? | o | o | o |
| 22. Are you able to cope with problems well? | o | o | |
| B3 Social components | |||
| 23. Do you live alone? | o | o | |
| 24. Do you sometimes miss having people around you? | o | o | o |
| 25. Do you receive enough support from other people? | o | o | |
PRISMA-7 questionnaire
The PRISMA-7 questionnaire, validated in French in 2007, was developed from the Program on Research for Integrating Services for the Maintenance of Autonomy (PRISMA Project) (93). It is a self-administered questionnaire taking 3 minutes for administration. It uses seven simple items to explore the following: gender, autonomy, close circle and walking (Table IX). In the validation study, 594 subjects aged 75-years or over were recruited randomly from electoral lists. Each subject then underwent a geriatric assessment using the SMAF scale (Système de Mesure de l’Autonomie Fonctionnelle), a scale comprising 29 complex items (107).
Table IX.
PRISMA-7 Questionnaire.
| PRISMA -7 QUESTIONNAIRE | ||
| Patient questions | Yes | No |
| Are you older than 85 years? | o | o |
| Are you male? | o | o |
| In general, do you have any health problems that require you to limit your activities? | o | o |
| Do you need someone to help you on a regular basis? | o | o |
| In general, do you have any health problems that require you to stay at home? | o | o |
| If you need help, can you count on someone close to you? | o | o |
| Do you regularly use a stick, walker or wheelchair to move about? | o | o |
| Total checked: | ||
SCORING: If the respondent had 3 or more “yes” answers, this indicates an increased risk of frailty and the need for further clinical review (Raîche, M., R. Hébert, M-F. Dubois, and the PRISMA partners. User guide for the PRISMA-7 questionnaire to identify elderly people with severe loss of autonomy. In Integrated service delivery to ensure persons’ functional autonomy, ed. R. Hébert, A. Tourigny, and M. Gagnon, 147-65. Quebec: Edisem).
Frailty Index for Elders (FIFE)
The Frailty Index for Elders (FIFE) was developed to assess for frailty risk in older adults using items collected in existing nursing datasets (94). This maximizes the use of data collected during nursing assessment and reduces testing fatigue for the patient, family, and nurse. FIFE is a 10-item assessment instrument with scores ranging from 0-10 (Table X). A score of 0 indicates no frailty, a score of 1-3 indicates frailty risk, and a score of 4 or greater indicates frailty. The major strength of the FIFE is the rigorous scientific inquiry utilized for instrument development and items that support the multidimensional nature of frailty and human health. All items were developed through a triangular process involving standard procedures for assessing and evaluating reliability and validity.
Table X.
The Frailty Index for Elders (FIFE).
| Item | Yes | No |
| Do you need help getting in or out of bed? | o | o |
| Do you need help with washing or bathing? | o | o |
| Without wanting to, have you lost or gained 10 pounds in the last 6 months? | o | o |
| Do you have tooth or mouth problems that make it hard to eat? | o | o |
| Do you have poor appetite and quickly feel full when you eat? | o | o |
| Did your physical health or emotional problems interfere with your social activities? | o | o |
| Would you say your health is fair or poor? | o | o |
| Do you get tired easily? | o | o |
| Were you hospitalized in the last 3 months? | o | o |
| Did you visit an emergency room for a health problem in the past 3 months? | o | o |
A score of 0 indicates no frailty, 1-3 indicates frailty risk and a score of 4 or greater indicates frailty
Vulnerable Elders Survey (VES)
The Vulnerable Elders Survey (VES) was specifically developed to identify community-dwelling vulnerable elderly at risk for functional decline. The VES can be administered also by phone. This tool includes questions about age, self-rated health, physical fitness and the need for assistance with activities. It consists of 13 questions and has a maximum score of 10 points. The age score is given according to the age range, with 0 points for people between 65–74 years old, 1 point for ages between 75–84, and 3 points for age equal to or greater than 85 years. The cut-off value of ≥3 as an indication of frailty (95). The VES can be used without charge by researchers, health care professionals, and provider organizations.
Frailty and Autonomy Scoring Instrument of Leuven (FRAIL)
The Frailty and Autonomy Scoring Instrument of Leuven (FRAIL) has been developed as a case-finding tool to be used without the patient being present (96). The clinician is asked to score the level of dependency concerning 12 items, grouped in a physical and a psychosocial cluster. The maximum score is 48, indicating a high level of frailty. It has proved to be valid and consistent and able to be used in a stepwise procedure for the diagnosis of dementia (96).
Frailty Staging System (FSS)
The Frailty Staging System (FSS) is a simple approach that can be used by clinicians to screen the functional status of older patients in community practice (97). The approach relies on checking a limited number of domains that are commonly dysfunctional but often unappreciated when conventional histories and physical examinations are undertaken. The focus is on carefully selected tests of vision, hearing, upper and lower limb function, urinary incontinence, mental status, instrumental and basic activities of daily living, environmental hazards, and social support systems. Brief questions and easily observed tasks are used to obtain the information needed for a suitable, effective screening while minimising the time for the administration. The score is 0 when the function is preserved and 1 when the function is lost (108).
Comprehensive Frailty Assessment Instrument (CFAI)
The Comprehensive Frailty Assessment Instrument (CFAI) was developed and validated to approach frailty in a multidimensional way. It is a self-reported frailty instrument, with a higher score indicating more frailty. It includes four components: (i) physical (one domain); (ii) psychological (two domains: mood and emotion); (iii) social (two domains: social loneliness and social support); and (iv) environmental (one domain) (98). The physical domain includes four items about physical capacity representing the building blocks of daily function. The mood domain includes five items about depressive disorders and distress, and the emotion domain includes three items about feeling empty, lonely or rejected by others. The social loneliness domain includes three items about relationships with others and feeling like one has enough social support. The social support domain includes three items about social resources that an individual can access for help. The environmental domain includes five items about housing and neighbourhood conditions. The total score of the CFAI is calculated by summing the scores on each indicator, resulting in a score ranging from 19 to 97. The scores for the subscales are calculated by adding the scores of the specific items (98). As a consequence, the physical subscale ranges from 4 to 12, the psychological subscale from 4 to 20, the emotional and social subscale from 3 to 15, the environmental subscale from 5 to 25 and the social support subscale from 0 to 10.
Maastricht Frailty Screening Tool for Hospitalised Patients (MFST-HP)
The Maastricht Frailty Screening Tool for Hospitalised Patients (MFST-HP) is an existing short 15 item multi-domain screening tool (with yes-no answer options) for older hospitalised patients. The advantage of this specific tool is that is fully integrated into the initial nursing assessment (99). The tool assesses frailty in three domains: physical (items 1-9), psychological (items 10-13) and social (items 14-15). In a previous study, the MFST-HP showed to be a reliable and feasible tool for screening. Inter-rater and intra-rater reliability was good (99). In patients with a low score on the MFST-HP (i.e., <6) there is less need for additional attention from geriatric teams or further geriatric assessment. Patients with a higher score on the MFST-HP could benefit from a more substantial geriatric evaluation, to screen the patient on probable unmasked geriatric syndromes that could be taken into account in the treatment or nursing plan (99).
Kihon Checklist (KCL)
The Kihon Checklist (KCL) is a reliable tool for predicting general frailty and frailty aspects in older adults (100). The KCL consists of 25 items (yes/no) divided into seven categories: physical strength, nutrition, eating, socialization, memory, mood and lifestyle (questions 1–20); each category is rated on a pass (0)/fail (1) basis, and the sum of all indices range from 0 (no frailty) to 25 (severe frailty); a higher score indicates worse functioning. The time required for older adults to answer the KCL is approximately 15 min. The KCL is a reliable tool for predicting general frailty and aspects of frailty, such as functional disability, IADL limitations, depressive mood and others, in older adults and is adequate for cross-cultural studies to address frailty demands among both elderly individuals who are community dwelling and those that use daycare centres (100).
Short screening instrument (FRESH-screening)
The Short screening instrument (FRESH-screening) includes five short questions (101). The first four questions regarding mobility, tiredness, fatigue, risk or fear of falling, and dependence in shopping were extracted from the “Continuum of care for frail elderly people” study questionnaire and were identified as early indicators of change in frailty by the research group. The four questions were as follows: 1) “Do you get tired when taking a short (15–20 min) walk outside?” (positive answers included both “yes,” and “can’t do it”) ; 2) “Have you suffered any general fatigue or tiredness over the last 3 months?” 3) “Have you fallen these last 3 months?” and “Are you afraid of falling?” (positive answers included “yes, a bit,” “yes,” and “yes, very afraid”); and 4) “Do you need assistance in either getting to the store, managing obstacles (such as staircases) to and from the store, or in choosing, paying for, or bringing home groceries?”. The fifth question pertained to having had three or more emergency department (ED) visits over the last 12 months, which was considered clinically important by the healthcare service. The total number of healthcare visits was collected for each participant through registers. Subjects were considered to be at risk of frailty by answering “yes” to two or more of these five questions (101).
QFrailty score
Recent National Institute for Clinical Excellence (NICE) guidance on multiple morbidities highlighted the need to develop new robust equations to identify patients in primary care with reduced life expectancy so that relevant assessments and interventions can be targeted appropriately (109). Hippisley-Cox and Coupland therefore developed and validated equations to predict absolute risk of death over the next year in men and women aged 65-100 years (6). QFrailty has been developed for the UK population and is intended for use in the UK. All medical decisions need to be taken by a patient in consultation with their doctor. The equation can be used in conjunction with the QAdmissions equation to classify patients into four QFrailty groups to enable their identification for focused assessments and interventions. The electronic frailty index (EFI) (https://qfrailty.org) is a simple unweighted count of the number of “deficits” a patient has out of a total of 36, where a deficit is a physical disability or social vulnerability as identified by a consensus panel (110). The EFI has also been used to predict mortality in a UK community based population (based on standard definitions) (110,111).
Development and validation of Comprehensive Rheumatologic Assessment of Frailty (CRAF) algorithm to assess frailty in RA patients
Recently, we develop and validate in a preliminary way a tool to assess frailty, dedicated to RA patients and easy to use in clinical practice, called Comprehensive Rheumatologic Assessment of Frailty (CRAF) (112). The cumulative deficits approach to determining CRAF index, similarly a Frailty Index (FI) developed by Rockwood and colleagues (16,113), uses data from existing clinical records and therefore holds promise for use in rheumatological care. The variables included in the CRAF were generated using a Delphi procedure, ten major frailty domains of CRAF were identified: nutritional status, weakness, falls, comorbidity, polypharmacy, social activity, pain, fatigue, physical function, and depression (Figure 1)
Figure 1.
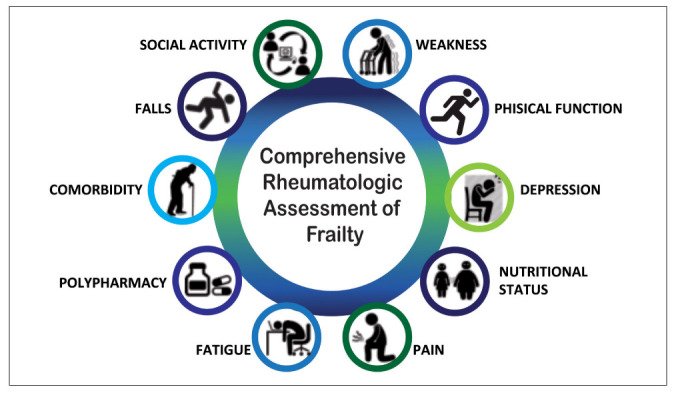
Domains evaluated in CRAF index.
Some variables (nutritional status, polypharmacy, and social activity) were considered as trichotomous levels (0, 0.5, 1.0); while other variables, such as comorbidity and those related to the patient’s perspective (pain, fatigue, physical function, and depression) were assigned five levels (0, 0.25, 0.5, 0.75 and 1.0) to six levels (0, 0.2, 0.4, 0.6, 0.8 and 1.0), to reflect differences in severity. Regarding the nutritional status, overweight and normal weight were combined and coded 0, based on evidence that some excess weight can be protective (114). In line with previous studies, obesity was coded 0.5 (115) while underweight was 1.0 (17). The ten scores were added and divided by the total number of deficits evaluated to produce a CRAF index between 0.0 to 1.0. Table XI shows the CRAF deficit variables and cut-off points.
Table XI.
Deficits included in the Comprehensive Rheumatologic Assessment of Frailty (CRAF) index*
| Concept/variable | Description | CRAF Value |
| 1. Nutritional status | Normal/overweight: BMI 25-30 Kg/m2 Obese: BMI > 30 Kg/m2 Underweight: BMI < 18,5 Kg/m2 |
0.00 0.50 1.00 |
| 2. Weakness | Handgrip strength (in Kg) in men <27 T-score -2.5 or below ≤32 T-score -2 or below >32 Normal Grip Handgrip strength (in Kg) in women <16 T-score -2.5 or below ≤19 T-score -2 or below >19 Normal Grip |
1.00 0.50 0.00 1.00 0.50 0.00 |
| 3. Falls | Falls less than twice in the last 12 months Falls between two and five times in the last 12 months Falls more than five times in the last 12 months |
0.00 0.50 1.00 |
| 4. Comorbidity | RDCI score 0 – 1 RDCI score 2 – 3 RDCI score 4 – 5 RDCI score 6 – 7 RDCI score > 7 |
0.00 0.25 0.50 0.75 1.00 |
| 5. Polypharmacy | Patient uses less than two different medications Patient uses between three and four different medications Patient uses 5 or more different medications |
0.00 0.50 1.00 |
| 6. Social activity | Not at all/slightly Moderately Quite a bit/extremely |
0.00 0.50 1.00 |
| 7. Pain | Extreme pain Very severe pain Severe pain Moderate pain Mild pain No pain |
1.00 0.80 0.60 0.40 0.20 0.00 |
| 8. Fatigue | Extreme fatigue Very severe fatigue Severe fatigue Moderate fatigue Mild fatigue No fatigue |
1.00 0.80 0.60 0.40 0.20 0.00 |
| 9. Physical function | Extreme limitation Very severe limitation Severe limitation Moderate limitation Mild limitation No limitation |
1.00 0.80 0.60 0.40 0.20 0.00 |
| 10. Depression | Extreme depression Very severe depression Severe depression Moderate depression Mild depression No depression |
1.00 0.80 0.60 0.40 0.20 0.00 |
Abbreviations: RDCI= Rheumatic Disease Comorbidity Index; BMI=Body Mass Index
*CRAF score of 0 to 0.12=non frailty, >0.12 to ≤0.24=mild frailty, >0.24 to ≤0.36=moderate frailty, >0.36=severe frailty.
In 2013, experts from international organizations recommended that it is imperative to screen for older people who are over 70 years old or have lost more than 5% of body weight due to chronic diseases (116). Weakness was assessed by handgrip strength (HGs), using an electronic grip device (Figure 2). Two consecutive measurements were recorded from the left and right hands. The highest of the four was selected (this variable was considered as continuous). The measurement of HGs has been recommended as an indicator of overall muscle strength and as a biomarker of general health status (117). In RA patients it has been demostrated that joint deformity and joint tenderness were strongly influenced by grip strength, which was an objective functional measurement of upper limb ability (118-120).
Figure 2.
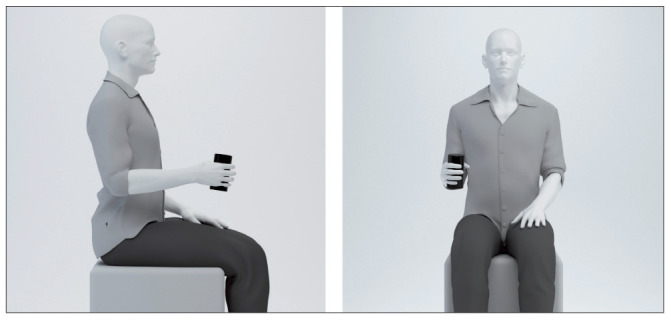
The HGs was measured in the dominant hand two times, and the mean of the two measurement values was used. The subjects were tested while sitting in a standardized position with the elbow flexed at an angle of 90. Standardized instructions were given.
Falls have been defined as unintentional events, with the result that the person is lying on the floor, the ground or other lower level. The number of falls during the last 12 months was registered. Although the literature suggests that RA patients, regardless of age, are at high risk of falls (121), a higher prevalence of falls in elderly RA patients (≥65 years) compared to younger RA patients (<65 years) has been demonstrated (122). Fall incidences within 1 year range between 27–54% in RA patients with a mean age of 59 years (SD 14.2) (123). Additionally, about 68% of patients have an increased risk of falling (123), and almost 20% of RA patients experience multiple falls over a one year follow-up period (124). Among RA patients a 95% excess risk of death due to falls has been observed compared to the general Italian population using age- and gender-specific mortality rates (125). The Rheumatic Diseases Comorbidity Index (RDCI) was used to identify the load of comorbidities (126). Polypharmacy is associated with adverse outcomes including frailty, mortality, falls, adverse drug reactions increased length of stay in hospital and readmission to hospital soon after discharge (127,128). In line with previous studies, polypharmacy was defined as five medications or more frailty (129), scored 1, while the use of three or four medications was scored 0.5. To assess the social activities, the item number 20 of the 36-Item Short Form Health Survey (SF36) (130) were rescaled to three (0, 0.5 and 1) levels. Pain, fatigue, physical function, and depression are also recognized as contributors to frailty by both patients and the group of experts (131). These variables are strongly recommended measures both of Outcome Measures in Rheumatology (OMERACT) Patient Perspective Workshop and of American College of Rheumatologists (ACR)/European League Against Rheumatism classification criteria (EULAR) task force (132,133). Patients rate their pain, fatigue, physical disability, and depression over the last week, with 0 indicating no pain, fatigue, physical disability, and depression, and 10 indicating worst possible pain, fatigue, physical disability, and depression (134). Chronic pain among community-dwelling older adults is a risk factor for worsening frailty (135), fatigue is prevalent (40–80% of patients) (136,137) and disabling in RA (138), functional disability remains a significant problem for people with RA, with the prevalence remaining at least 15% higher over time than in individuals without the disease (139). Comorbid depression negatively impacts RA patients’ health-related quality-of-life, physical function, mental function, mortality, and experience of pain and symptom severity (140,141). These four measures, in which participants mark their subjective status on a graphic thermometer scale, afford a simple and rapid administration and increased comprehension and completion rates (142) (Figure 3). In the CRAF, the rating of all these four variables has been assigned in six levels (0, 02, 0.4, 0.6, 0.8 and 1).
Figure 3.
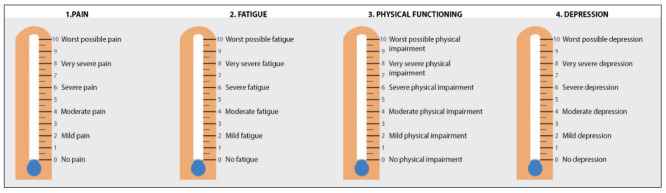
The Patient-Reported Outcomes Thermometer–4-item scale (4T-PROs).
Finally, the calculation of the CRAF is based on the sum of the ten variables, divided by ten: the score ranges between 0.0 (no deficit present) to 1.0 (all deficits present). The CRAF cut-off points have been established using Clegg’s criteria (3), as follow: score ≤0.12 represents patients without frailty; score >0.12 and ≤0.24 represents patients with mild frailty; score >0.24 and ≤0.36 represent patients with moderate frailty; score >0.36 represent patients with severe frailty.
Conclusions and perspectives
Several published studies on frailty in rheumatic patients and several systematic reviews have provided insight into the overlap between frailty and musculoskeletal disorders, including proposed pathogenic mechanisms and recommended interventions to prevent or ameliorate frailty. The overall prevalence and knowledge of factors that influence frailty in rheumatic diseases, however, are reported with considerable inconsistency across studies and have not been effectively synthesized through prior narrative reviews. The need to develop measures of frailty and to include frail RA patients in future clinical studies of drug effects are now recognised and should greatly facilitate the development of evidence-based guidelines (133). There are still questions unanswered. In particular, the choice of components to be included in the frailty definition continues to be a contentious issue with important implications. For example, although some authors have included disability and functional decline as a component of frailty (41,51), others regard disability and functional decline as an outcome (101). We believe that evaluating frailty through deficit accumulation provides a holistic approach to prognostication among rheumatic patients, incorporating aspects of disease activity, organ damage, and Health-Related Quality of life into a single measure. That is why we have proposed and validated the CRAF index. The cumulative deficits approach to determining CRAF index, similarly a FI developed by Rockwood and colleagues (50,52), uses data from existing clinical records and therefore holds promise for use in rheumatological care.
Key points
Frailty is defined as “a biologic syndrome of decreased reserve and resistance to stressors, resulting from cumulative declines across multiple physiologic systems, and causing vulnerability to adverse outcomes”
Presence of frailty in the geriatric population correlates with higher risks of hospitalization and institutionalization after discharge and overall higher risk of mortality
The frailty phenotype may be more suitable for immediate identification of non-disabled elders at risk of negative events. The Frailty Index may summarise the results of a comprehensive rheumatologic assessment providing a marker of deficits accumulation. The two instruments have different purposes and are to be considered complementary in the evaluation of the older person with rheumatic diseases.
We have developed and externally validated a frailty index, namely Comprehensive Rheumatologic Assessment of Frailty (CRAF), using routine data. The CRAF has robust validity and good discriminant accuracy.
Identification of predictors of the highest frailty trajectories along with the assessment of changes in frailty over time may offer ways to target ageing individuals at high risk of hospitalization or death for therapeutic or preventive interventions.
Conflict of interest:
Each author declares that he or she has no commercial associations (e.g. consultancies, stock ownership, equity interest, patent/licensing arrangement etc.) that might pose a conflict of interest in connection with the submitted article
References
- 1.Fried LP, Tangen CM, Walston J, et al. Frailty in older adults: evidence for a phenotype. J Gerontol A Biol Sci Med Sci. 2001;56(3):M146–M56. doi: 10.1093/gerona/56.3.m146. [DOI] [PubMed] [Google Scholar]
- 2.Andrews JS, Trupin L, Yelin EH, Hough CL, Covinsky KE, Katz PP. Frailty and reduced physical function go hand in hand in adults with rheumatoid arthritis: a US observational cohort study. Clin Rheumatol. 2017;36(5):1031–1039. doi: 10.1007/s10067-017-3541-9. [DOI] [PMC free article] [PubMed] [Google Scholar]
- 3.Haider S, Grabovac I, Berner C, et al. Frailty in seropositive rheumatoid arthritis patients of working age: a cross-sectional study. Clin Exp Rheumatol. 2019;37(4):585–592. [PubMed] [Google Scholar]
- 4.Salaffi F, Di Carlo M, Farah S, Di Donato E, Carotti M. Prevalence of frailty and its associated factors in patients with rheumatoid arthritis: a cross-sectional analysis. Clin Rheumatol. 2019;38(7):1823–1830. doi: 10.1007/s10067-019-04486-5. [DOI] [PubMed] [Google Scholar]
- 5.Walston J, Hadley EC, Ferrucci L, et al. Research agenda for frailty in older adults: toward a better understanding of physiology and etiology: summary from the American geriatrics society/national institute on aging research conference on frailty in older adults. J Am Geriatr Soc. 2006;54:991–1001. doi: 10.1111/j.1532-5415.2006.00745.x. [DOI] [PubMed] [Google Scholar]
- 6.Hippisley-Cox J, Coupland C. Development and validation of QMortality risk prediction algorithm to estimate short term risk of death and assess frailty: cohort study. BMJ. 2017;20:358. doi: 10.1136/bmj.j4208. j4208. [DOI] [PMC free article] [PubMed] [Google Scholar]
- 7.Auyeung TW, Lee JS, Kwok T, et al. Physical frailty predicts future cognitive decline: A four-year prospective study in 2737 cognitively normal older adults. J Nutr Health Aging. 2011;15:690–694. doi: 10.1007/s12603-011-0110-9. [DOI] [PubMed] [Google Scholar]
- 8.Mitnitski A, Fallah N, Rockwood MR, et al. Transitions in cognitive status in relation to frailty in older adults: A comparison of three frailty measures. J Nutr Health Aging. 2011;15:863–867. doi: 10.1007/s12603-011-0066-9. [DOI] [PubMed] [Google Scholar]
- 9.Hastings SN, Purser JL, Johnson KS, et al. Frailty predicts some but not all adverse outcomes in older adults discharged from the emergency department. J Am Geriatr Soc. 2008;56:1651–1657. doi: 10.1111/j.1532-5415.2008.01840.x. [DOI] [PMC free article] [PubMed] [Google Scholar]
- 10.Wick JY. Understanding frailty in the geriatric population. Consult Pharm. 2011;26(9):634–45. doi: 10.4140/TCP.n.2011.634. [DOI] [PubMed] [Google Scholar]
- 11.Santos-Eggimann B, Cuénoud P, Spagnoli J, Junod J. Prevalence of frailty in middle-aged and older community-dwelling Europeans living in 10 countries. J Gerontol A Biol Sci Med Sci. 2009;64(6):675–681. doi: 10.1093/gerona/glp012. [DOI] [PMC free article] [PubMed] [Google Scholar]
- 12.Moorhouse P, Rockwood K. Frailty and its quantitative clinical evaluation. The journal of the Royal College of Physicians of Edinburgh. 2012;42(4):333–340. doi: 10.4997/JRCPE.2012.412. [DOI] [PubMed] [Google Scholar]
- 13.Clegg A, Young J, Iliffe S, Rikkert MO, Rockwood K. Frailty in elderly people. Lancet. 2013;381:752–762. doi: 10.1016/S0140-6736(12)62167-9. [DOI] [PMC free article] [PubMed] [Google Scholar]
- 14.Muscedere J, Waters B, Varambally A, et al. The impact of frailty on intensive care unit outcomes: a systematic review and meta-analysis. Intensive Care Med. 2017;43:1105–1122. doi: 10.1007/s00134-017-4867-0. [DOI] [PMC free article] [PubMed] [Google Scholar]
- 15.O’Caoimh R, Galluzzo L, Rodríguez-Laso Á, et al. Prevalence of frailty at population level in European ADVANTAGE Joint Action Member States: a systematic review and meta-analysis. Ann Ist Super Sanita. 2018;54(3):226–238. doi: 10.4415/ANN_18_03_10. [DOI] [PubMed] [Google Scholar]
- 16.Partridge JSL, Harari D, Dhesi JK. Frailty in the older surgical patient: a review. Age Ageing. Biogerontology. 2012, 2010;41, 11:142, 547–147, 563. doi: 10.1093/ageing/afr182. [DOI] [PubMed] [Google Scholar]
- 17.Searle SD, Mitnitski A, Gahbauer EA, Gill TM, Rockwood K. A standard procedure for creating a frailty index. BMC Geriatr. 2008;8:24. doi: 10.1186/1471-2318-8-24. [DOI] [PMC free article] [PubMed] [Google Scholar]
- 18.Rockwood K, Mitnitski A. Frailty defined by deficit accumulation and geriatric medicine defined by frailty. Clin Geriatr Med. 2011;27:17–2614. doi: 10.1016/j.cger.2010.08.008. [DOI] [PubMed] [Google Scholar]
- 19.Choi J, Ahn A, Kim S, Won CW. Global prevalence of physical frailty by Fried’s criteria in community-dwelling elderly with national population based surveys. J Am Med Dir Assoc. 2015;16(7):548–50. doi: 10.1016/j.jamda.2015.02.004. [DOI] [PubMed] [Google Scholar]
- 20.Michel JP, Cruz-Jentoft AJ, Cederholm T. Frailty, exercise and nutrition. Clin Geriatr Med. 2015;31(3):375–87. doi: 10.1016/j.cger.2015.04.006. [DOI] [PubMed] [Google Scholar]
- 21.Collard RM, Boter H, Schoevers RA, Oude Voshaar RC. Prevalence of frailty in community-dwelling older persons: a systematic review. J Am Geriatr Soc. 2012;60(8):1487–1492. doi: 10.1111/j.1532-5415.2012.04054.x. [DOI] [PubMed] [Google Scholar]
- 22.Cawthon PM, Marshall LM, Michael Y, et al. Frailty in older men: prevalence, progression, and relationship with mortality. J Am Geriatr Soc. 2007;55(8):1216–1223. doi: 10.1111/j.1532-5415.2007.01259.x. [DOI] [PubMed] [Google Scholar]
- 23.Metzelthin SF, Daniels R, van Rossum, et al. The psychometric properties of three self-report screening instruments for identifying frail older people in the community. BMC PublicHealth. 2010;10:176. doi: 10.1186/1471-2458-10-176. [DOI] [PMC free article] [PubMed] [Google Scholar]
- 24.Alvarado BE, Zunzunegui MV, Beland F, Bamvita JM. Life course social and health conditions linked to frailty in Latin American older men and women. J Gerontol A Biol Sci Med Sci. 2008;63(12):1399–406. doi: 10.1093/gerona/63.12.1399. [DOI] [PubMed] [Google Scholar]
- 25.Shinkai S, Yoshida H, Taniguchi Y, et al. Public health approach to preventing frailty in the community and its effect on healthy aging in Japan. Geriatr Gerontol Int. 2016;(16 Suppl 1):87–97. doi: 10.1111/ggi.12726. [DOI] [PubMed] [Google Scholar]
- 26.Reddy M, Gill SS, Rochon PA. Preventing pressure ulcers: a systematic review. JAMA. 2006;296(8):974–984. doi: 10.1001/jama.296.8.974. [DOI] [PubMed] [Google Scholar]
- 27.Mulasso A, Roppolo M, Giannotta F, Rabaglietti E. Associations of frailty and psychosocial factors with autonomy in daily activities: a cross-sectional study in Italian community-dwelling older adults. Clin Interv Aging. 2016;11(11):37–45. doi: 10.2147/CIA.S95162. [DOI] [PMC free article] [PubMed] [Google Scholar]
- 28.Salaffi F, De Angelis R, Grassi W MArche Pain Prevalence; INvestigation Group (MAPPING) study. Prevalence of musculoskeletal conditions in an Italian population sample: results of a regional community-based study. I. The MAPPING study. Clin Exp Rheumatol. 2005;23(6):819–28. [PubMed] [Google Scholar]
- 29.Cimmino MA, Salaffi F. The fate of the patient with musculoskeletal disorders in Italy: an epidemiological insight. Clin Exp Rheumatol. 2007;25(6):803–805. [PubMed] [Google Scholar]
- 30.Bandeen-Roche K, Xue QL, Ferrucci L, et al. Phenotype of frailty: characterization in the women’s health and aging studies. J Gerontol A Biol Sci Med Sci. 2006;61(3):262–266. doi: 10.1093/gerona/61.3.262. [DOI] [PubMed] [Google Scholar]
- 31.Bindawas SM, Vennu V, Stubbs B. Longitudinal Relationship Between Knee Pain Status and Incident Frailty: Data from the Osteoarthritis Initiative. Pain Med. 2018 Nov 1;19(11):2146–2153. doi: 10.1093/pm/pnx296. [DOI] [PMC free article] [PubMed] [Google Scholar]
- 32.Salaffi F, De Angelis R, Stancati A, Grassi W MArche Pain; Prevalence INvestigation Group (MAPPING) study. Health-related quality of life in multiple musculoskeletal conditions: a cross-sectional population based epidemiological study. II. The MAPPING study. Clin Exp Rheumatol. 2005;23(6):829–39. [PubMed] [Google Scholar]
- 33.Salaffi F, Di Carlo M, Carotti M, Farah S, Ciapetti A, Gutierrez M. The impact of different rheumatic diseases on health-related quality of life: a comparison with a selected sample of healthy individuals using SF-36 questionnaire, EQ-5D and SF-6D utility values. Acta Biomed. 2019;89(4):541–557. doi: 10.23750/abm.v89i4.7298. [DOI] [PMC free article] [PubMed] [Google Scholar]
- 34.Furneri G, Mantovani LG, Belisari A, et al. Systematic literature review on economic implications and pharmacoeconomic issues of rheumatoid arthritis. Clin Exp Rheumatol. 2012;30(4 Suppl 73):S72–S84. [PubMed] [Google Scholar]
- 35.Leardini G, Salaffi F, Montanelli R, Gerzeli S, Canesi B. A multicenter cost-of-illness study on rheumatoid arthritis in Italy. Clin Exp Rheumatol. 2002;20(4):505–515. [PubMed] [Google Scholar]
- 36.Curtis JR, Shan Y, Harrold L, Zhang J, Greenberg JD, Reed GW. Patient perspectives on achieving treat-to-target goals: a critical examination of patient-reported outcomes. Arthritis care & research. 2013;65(10):1707–1712. doi: 10.1002/acr.22048. [DOI] [PubMed] [Google Scholar]
- 37.Katz PP, Radvanski DC, Allen D, et al. Development and validation of a short form of the valued life activities disability questionnaire for rheumatoid arthritis. Arthritis Care & Research. 2011;63(12):1664–1671. doi: 10.1002/acr.20617. [DOI] [PMC free article] [PubMed] [Google Scholar]
- 38.Harris ED., Jr Rheumatoid arthritis. Pathophysiology and implications for therapy. N Engl J Med. 1990;322:1277–1289. doi: 10.1056/NEJM199005033221805. [DOI] [PubMed] [Google Scholar]
- 39.Choi SJ, Rho YH, Ji JD, Song GG, Lee YH. Genome scan meta-analysis of rheumatoid arthritis. Rheumatology (Oxford) 2006;45:166–170. doi: 10.1093/rheumatology/kei128. [DOI] [PubMed] [Google Scholar]
- 40.Fried LP, Tangen CM, Walston J, et al. Cardiovascular Health Study Collaborative Research G Frailty in older adults: evidence for a phenotype. The journals of Gerontology Series A, Biological sciences and medical sciences. 2001;56(3):M146–156. doi: 10.1093/gerona/56.3.m146. [DOI] [PubMed] [Google Scholar]
- 41.Baker JF, Von Feldt J, Mostoufi-Moab S, et al. Deficits in muscle mass, muscle density, and modified associations with fat in rheumatoid arthritis. Arthritis Care & Research. 2014;66(11):1612–1618. doi: 10.1002/acr.22328. [DOI] [PMC free article] [PubMed] [Google Scholar]
- 42.Giles JT, Bartlett SJ, Andersen RE, Fontaine KR, Bathon JM. Association of body composition with disability in rheumatoid arthritis: impact of appendicular fat and lean tissue mass. Arthritis Rheum. 2008;59(10):1407–1415. doi: 10.1002/art.24109. [DOI] [PMC free article] [PubMed] [Google Scholar]
- 43.Kramer HR, Fontaine KR, Bathon JM, Giles JT. Muscle density in rheumatoid arthritis: associations with disease features and functional outcomes. Arthritis Rheum. 2012;64(8):2438–2450. doi: 10.1002/art.34464. [DOI] [PMC free article] [PubMed] [Google Scholar]
- 44.Roubenoff R. Rheumatoid cachexia: a complication of rheumatoid arthritis moves into the 21st century. Arthritis Research & Therapy. 2009;11(2):108. doi: 10.1186/ar2658. [DOI] [PMC free article] [PubMed] [Google Scholar]
- 45.Katz P, Margaretten M, Trupin L, Schmajuk G, Yazdany J, Yelin E. Role of sleep disturbance, depression, obesity, and physical inactivity in fatigue in rheumatoid arthritis. Arthritis Care & Research. 2016;68(1):81–90. doi: 10.1002/acr.22577. [DOI] [PMC free article] [PubMed] [Google Scholar]
- 46.Hirani V, Naganathan V, Blyth F, et al. Longitudinal associations between body composition, sarcopenic obesity and outcomes of frailty, disability, institutionalisation and mortality in community-dwelling older men: The Concord Health and Ageing in Men Project. Age and ageing. 2016;46(3):413–420. doi: 10.1093/ageing/afw214. [DOI] [PubMed] [Google Scholar]
- 47.Beenakker KG, Ling CH, Meskers CG, et al. Patterns of muscle strength loss with age in the general population and patients with a chronic inflammatory state. Ageing Res Rev. 2010;9:431–436. doi: 10.1016/j.arr.2010.05.005. [DOI] [PMC free article] [PubMed] [Google Scholar]
- 48.Barile-Fabris LA, Perez-Cristobal M, Merlos-Lopez RJ, Xibille-Friedman D. Frailty syndrome in patients with rheumatoid arthritis. Rev Med Inst Mex Seguro Soc. 2016;54(Suppl 2):S210–S215. [PubMed] [Google Scholar]
- 49.Tada M, Yamada Y, Mandai K, Hidaka N. Correlation between frailty and disease activity in patients with rheumatoid arthritis: Data from the CHIKARA study. Geriatr Gerontol Int. 2019;19(12):1220–1225. doi: 10.1111/ggi.13795. [DOI] [PubMed] [Google Scholar]
- 50.Castell MV, van der Pas S, Otero A, et al. Osteoarthritis and frailty in elderly individuals across six European countries: results from the European Project on OSteoArthritis (EPOSA) BMC Musculoskelet Disord. 2015;16:359. doi: 10.1186/s12891-015-0807-8. [DOI] [PMC free article] [PubMed] [Google Scholar]
- 51.Maddocks M, Kon SS, Canavan JL, et al. Physical frailty and pulmonary rehabilitation in COPD: a prospective cohort study. Thorax. 2016;71(11):988–995. doi: 10.1136/thoraxjnl-2016-208460. [DOI] [PMC free article] [PubMed] [Google Scholar]
- 52.Li Y, Wei X, Zhou J, Wei L. The age-related changes in cartilage and osteoarthritis. Biomed Res Int. 2013;2013:916530. doi: 10.1155/2013/916530. [DOI] [PMC free article] [PubMed] [Google Scholar]
- 53.Leardini G, Salaffi F, Caporali R, Canesi B, Rovati L, Montanelli R. Italian Group for Study of the Costs of Arthritis. Direct and indirect costs of osteoarthritis of the knee. Clin Exp Rheumatol. 2004;22(6):699–706. [PubMed] [Google Scholar]
- 54.Salaffi F, Carotti M, Stancati A, Grassi W. Health-related quality of life in older adults with symptomatic hip and knee osteoarthritis: a comparison with matched healthy controls. Aging Clin Exp Res. 2005;17(4):255–63. doi: 10.1007/BF03324607. [DOI] [PubMed] [Google Scholar]
- 55.Van Saase JLCM, van Romunde LKJ, Cats A, Vandenbroucke JP, Valkenburg HA. Epidemiology of osteoarthritis: Zoetermeer survey. Comparison of radiological osteoarthritis in a Dutch population with that in 10 other populations. Ann Rheum Dis. 1989;48:271–280. doi: 10.1136/ard.48.4.271. [DOI] [PMC free article] [PubMed] [Google Scholar]
- 56.Felson DT, Naimark A, Anderson J, Kazis L, Castelli W, Meenan RF. The prevalence of knee osteoarthritis in the elderly. The Framingham Osteoarthritis Study. Arthritis Rheum. 1987;30:914–918. doi: 10.1002/art.1780300811. [DOI] [PubMed] [Google Scholar]
- 57.Miguel Rde C, Dias RC, Dias JM, et al. Frailty syndrome in the community-dwelling elderly with osteoarthritis. Rev Bras Reumatol. 2012;52(3):331–47. [PubMed] [Google Scholar]
- 58.Misra D, Felson DT, Silliman RA, et al. Knee osteoarthritis and frailty: Findings from the multicenter osteoarthritis study and osteoarthritis initiative. J Gerontol A Biol Sci Med Sci. 2015;70(3):339–449. doi: 10.1093/gerona/glu102. [DOI] [PMC free article] [PubMed] [Google Scholar]
- 59.Shega JW, Dale W, Andrew M, et al. Persistent pain and frailty: A case for homeostenosis. J Am Geriatr Soc. 2012;60(1):113–117. doi: 10.1111/j.1532-5415.2011.03769.x. [DOI] [PMC free article] [PubMed] [Google Scholar]
- 60.Lee JS, Auyeung TW, Leung J, Kwok T, Woo J. Transitions in frailty states among community-living older adults and their associated factors. J Am Med Dir Assoc. 2014;15(4):281–286. doi: 10.1016/j.jamda.2013.12.002. [DOI] [PubMed] [Google Scholar]
- 61.Trevisan C, Veronese N, Maggi S, et al. Marital status and frailty in older people: Gender differences in the Progetto Veneto Anziani Longitudinal Study. J Womens Health (Larchmt) 2016;25(6):630–637. doi: 10.1089/jwh.2015.5592. [DOI] [PubMed] [Google Scholar]
- 62.Harris WH, Sledge CB. Total hip and total knee replacement (2) N Engl J Med. 1990;323(12):801–807. doi: 10.1056/NEJM199009203231206. [DOI] [PubMed] [Google Scholar]
- 63.Xue QL. The frailty syndrome: definition and natural history. Clin Geriatr Med. 2011;27(1):1–15. doi: 10.1016/j.cger.2010.08.009. [DOI] [PMC free article] [PubMed] [Google Scholar]
- 64.Gobbens RJ, van Assen MA, Luijkx KG, Schols JM. Testing an integral conceptual model of frailty. J Adv Nurs. 2012;68(9):2047–2060. doi: 10.1111/j.1365-2648.2011.05896.x. [DOI] [PubMed] [Google Scholar]
- 65.Meessen JMTA, Leichtenberg CS, Tilbury C, et al. Frailty in end-stage hip or knee osteoarthritis: validation of the Groningen Frailty Indicator (GFI) questionnaire. Rheumatol Int. 2018;38(5):917–924. doi: 10.1007/s00296-017-3868-1. [DOI] [PMC free article] [PubMed] [Google Scholar]
- 66.Cruz-Jentoft AJ, Baeyens JP, Bauer JM, et al. Sarcopenia: European consensus on definition and diagnosis: report of the European working group on sarcopenia in older people. Age Ageing. 2010;39(4):412–23. doi: 10.1093/ageing/afq034. [DOI] [PMC free article] [PubMed] [Google Scholar]
- 67.Walston JD. Sarcopenia in older adults. Current opinion in rheumatology. 2012;24(6):623–7. doi: 10.1097/BOR.0b013e328358d59b. [DOI] [PMC free article] [PubMed] [Google Scholar]
- 68.Stenholm S, Harris TB, Rantanen T, Visser M, Kritchevsky SB, Ferrucci L. Sarcopenic obesity: definition, cause and consequences. Curr Opin Clin Nutr Metab Care. 2008;11:693–700. doi: 10.1097/MCO.0b013e328312c37d. [DOI] [PMC free article] [PubMed] [Google Scholar]
- 69.Patel HP, Syddall HE, Jameson K, et al. Prevalence of sarcopenia in community dwelling older people in the UK using the European Working Group on Sarcopenia in Older People (EWGSOP) definition: findings from the Hertfordshire Cohort Study (HCS) Age Ageing. 2013;42:378–84. doi: 10.1093/ageing/afs197. [DOI] [PMC free article] [PubMed] [Google Scholar]
- 70.Grimby G, Saltin B. The ageing muscle. Clinical Physiology. 1983;3:209–18. doi: 10.1111/j.1475-097x.1983.tb00704.x. [DOI] [PubMed] [Google Scholar]
- 71.Faulkner JA, Larkin LM, Claflin DR, Brooks SV. Age-Related Changes In The Structure And Function Of Skeletal Muscles. 2007:1091–6. doi: 10.1111/j.1440-1681.2007.04752.x. [DOI] [PubMed] [Google Scholar]
- 72.Verschueren S, Gielen E, O’Neill TW, et al. Sarcopenia and its relationship with bone mineral density in middleaged and elderly European men. Osteoporos Int. 2013;24:87–98. doi: 10.1007/s00198-012-2057-z. [DOI] [PubMed] [Google Scholar]
- 73.Cooper C, Dere W, Evans W, et al. Frailty and sarcopenia: definitions and outcome parameters. Osteoporos. Int. 2012;23:1839–48. doi: 10.1007/s00198-012-1913-1. [DOI] [PubMed] [Google Scholar]
- 74.von Haehling S, Morley JE, Anker SD. An overview of sarcopenia: factsand numbers on prevalence and clinical impact. J. Cachexia Sarcopenia Muscle. 2010;1:129–133. doi: 10.1007/s13539-010-0014-2. [DOI] [PMC free article] [PubMed] [Google Scholar]
- 75.Song X, Mitnitski A, MacKnight C, et al. Assessment of individual risk of death using self-report data: An artificial neural network compared with a frailty index. J Am Geriatr Soc. 2004;52:1180–1184. doi: 10.1111/j.1532-5415.2004.52319.x. [DOI] [PubMed] [Google Scholar]
- 76.Yang Y, Lee LC. Dynamics and heterogeneity in the process of human frailty and aging: Evidence from the U.S. older adult population. The Journals of Gerontology Series B: Psychological Sciences and Social Sciences. 2010;65B(2):246–255. doi: 10.1093/geronb/gbp102. [DOI] [PMC free article] [PubMed] [Google Scholar]
- 77.Woo J, Goggins W, Sham A, et al. Public health significance of the Frailty Index. Disability and Rehabilitation. 2006;28(8):515–521. doi: 10.1080/09638280500215867. [DOI] [PubMed] [Google Scholar]
- 78.Guralnik JM, Simonsick EM, Ferrucci L, et al. A short physical performance battery assessing lower extremity function: association with self-reported disability and prediction of mortality and nursing home admission. J Gerontol. 1994;49(2):M85–94. doi: 10.1093/geronj/49.2.m85. [DOI] [PubMed] [Google Scholar]
- 79.Subra J, Gillette-Guyonnet S, Cesari M, Oustric S, Vellas B. The integration of frailty into clinical practice: preliminary results from the Gerontopole. J Nutr Health Aging. 2012;16(8):714–720. doi: 10.1007/s12603-012-0391-7. [DOI] [PubMed] [Google Scholar]
- 80.Baldwin MR, Reid MC, Westlake AA, et al. The feasibility of measuring frailty to predict disability and mortality in older medical intensive care unit survivors. J Crit Care. 2014;29(3):401–408. doi: 10.1016/j.jcrc.2013.12.019. [DOI] [PMC free article] [PubMed] [Google Scholar]
- 81.Romero-Ortuno R, O’Shea D, Kenny RA. The SHARE frailty instrument for primary care predicts incident disability in a European population-based sample. Qual Prim Care. 2011;19(5):301–309. [PubMed] [Google Scholar]
- 82.Bandinelli S, Lauretani F, Boscherini V, et al. A randomized, controlled trial of disability prevention in frail older patients screened in primary care: the FRASI study. Design and baseline evaluation. Aging Clin Exp Res. 2006;18(5):359–366. doi: 10.1007/bf03324831. [DOI] [PMC free article] [PubMed] [Google Scholar]
- 83.Vasunilashorn S, Coppin AK, Patel KV, et al. Use of the short physical performance battery score to predict loss of ability to walk 400 meters: analysis from the InCHIANTI study. J Gerontol A Biol Sci Med Sci. 2009;64(2):223–239. doi: 10.1093/gerona/gln022. [DOI] [PMC free article] [PubMed] [Google Scholar]
- 84.Camara SM, Alvarado BE, Guralnik JM, Guerra RO, Maciel AC. Using the short physical performance battery to screen for frailty in young-old adults with distinct socioeconomic conditions. Geriatr Gerontol Int. 2013;13(2):421–428. doi: 10.1111/j.1447-0594.2012.00920.x. [DOI] [PubMed] [Google Scholar]
- 85.Soler V, Sourdet S, Balardy L, et al. Visual Impairment Screening at the Geriatric Frailty Clinic for Assessment of Frailty and Prevention of Disability at the Gérontopôle. J Nutr Health Aging. 2016;20(8):870–877. doi: 10.1007/s12603-015-0648-z. [DOI] [PubMed] [Google Scholar]
- 86.Mitnitski AB, Mogilner AJ, Rockwood K. Accumulation of deficits as a proxy measure of aging. Scientific World Journal. 2001;1:323–336. doi: 10.1100/tsw.2001.58. [DOI] [PMC free article] [PubMed] [Google Scholar]
- 87.Hubbard RE, O’Mahony MS, Woodhouse KW. Characterising frailty in the clinical setting—a comparison of different approaches. Age Ageing. 2009;38(1):115–119. doi: 10.1093/ageing/afn252. [DOI] [PubMed] [Google Scholar]
- 88.Steverink N, Slaets J, Schuurmans H, Van Lis M. Measuring frailty: developing and testing of the Groningen frailty indicator (GFI) Gerontologist. 2001;41(1):236–237. [Google Scholar]
- 89.Rolfson DB, Majumdar SR, Tsuyuki RT, Tahir A, Rockwood K. Validity and reliability of the Edmonton frail scale. Age Ageing. 2006;35(5):526–529. doi: 10.1093/ageing/afl041. [DOI] [PMC free article] [PubMed] [Google Scholar]
- 90.Stuck AE, Iliffe S. Comprehensive geriatric assessment for older adults. BMJ. 2011:343. doi: 10.1136/bmj.d6799. [DOI] [PubMed] [Google Scholar]
- 91.Hoover M, Rotermann M, Sanmartin C, Bernier J. Validation of an index to estimate the prevalence of frailty among community-dwelling seniors. Health Rep. 2013;24(9):10–17. [PubMed] [Google Scholar]
- 92.Gobbens RJ, Krans A, van Assen MA. Validation of an integral conceptual model of frailty in older residents of assisted living facilities. Arch Gerontol Geriatr. 2015;61(3):400–10. doi: 10.1016/j.archger.2015.06.001. [DOI] [PubMed] [Google Scholar]
- 93.Raîche M, Hébert R, Dubois M-F. PRISMA-7: a casefinding tool to identify older adults with moderate to severe disabilities. Arch Gerontol Geriatr. 2008;47(1):9–18. doi: 10.1016/j.archger.2007.06.004. [DOI] [PubMed] [Google Scholar]
- 94.Tocchi C, Dixon J, Naylor M, Sangchoon J, McCorkle R. Development of a frailty index measure for older adults: The Frailty Index for Elders. Journal of Nursing Measurement. 2014;22(2):223–240. doi: 10.1891/1061-3749.22.2.223. [DOI] [PubMed] [Google Scholar]
- 95.Saliba D, Elliott M, Rubenstein LZ, et al. The vulnerable elders survey: a tool for identifying vulnerable older people in the community. J Am Geriatr Soc. 2001;49(12):1691–1699. doi: 10.1046/j.1532-5415.2001.49281.x. [DOI] [PubMed] [Google Scholar]
- 96.De Lepeleire J, Ylieff M, Stessens J, et al. The validity of the Frail instrument in general practice. Arch Public Health. 2004;62:185–196. [Google Scholar]
- 97.Lachs MS, Feinstein AR, Cooney LM, Jr, et al. A simple procedure for general screening for functional disability in elderly patients. Ann Intern Med. 1990;112(9):699–706. doi: 10.7326/0003-4819-112-9-699. [DOI] [PubMed] [Google Scholar]
- 98.De Witte N, Gobbens R, De Donder L, et al. Validation of the comprehensive frailty assessment instrument against the Tilburg frailty indicator. Eur Geriatr Med. 2013;4:248–254. [Google Scholar]
- 99.Warnier RMJ, van Rossum E, van Leendert J, et al. Screening for frailty in older hospitalized patients: Reliability and feasibility of the Maastricht frailty screening tool for hospitalized patients (MFST-HP) Res Gerontol Nurs. 2016;9:243–251. doi: 10.3928/19404921-20160906-01. [DOI] [PubMed] [Google Scholar]
- 100.Sewo Sampaio PY, Sampaio RAC, Yamada M, Ogita M, Arai H. Validation and Translation of the Kihon Checklist (frailty index) into Brazilian Portuguese. Geriatr Gerontol Int. 2013;14(3):561–569. doi: 10.1111/ggi.12134. [DOI] [PubMed] [Google Scholar]
- 101.Kajsa E, Katarina W, Sten L, Synneve ID. Screening for frailty among older emergency department visitors: Validation of the new FRESH-screening instrument. BMC Emerg Med. 2016;16(1):27. doi: 10.1186/s12873-016-0087-0. [DOI] [PMC free article] [PubMed] [Google Scholar]
- 102.Peters LL, Boter H, Buskens E, Slaets JP. Measurement properties of the Groningen frailty indicator in home-dwelling and institutionalized elderly people. J Am Med Dir Assoc. 2012;13(6):546–51. doi: 10.1016/j.jamda.2012.04.007. [DOI] [PubMed] [Google Scholar]
- 103.Hilmer SN, Perera V, Mitchell S, et al. The assessment of frailty in older people in acute care. Australas J Ageing. 2009;28:182–188. doi: 10.1111/j.1741-6612.2009.00367.x. [DOI] [PubMed] [Google Scholar]
- 104.Graham MM, Galbraith PD, O’Neill D, et al. Frailty and outcome in elderly patients with acute coronary syndrome. Can J Cardiol. 2013;29:1610–5. doi: 10.1016/j.cjca.2013.08.016. [DOI] [PubMed] [Google Scholar]
- 105.Overcash JA, Beckstead J, Extermann M, Cobb S. The abbreviated comprehensive geriatric assessment (aCGA): a retrospective analysis. Crit Rev Oncol Hematol. 2005;54(2):129–36. doi: 10.1016/j.critrevonc.2004.12.002. [DOI] [PubMed] [Google Scholar]
- 106.Leng SX, Cappola AR, Andersen RE, et al. Serum levels of insulin-like growth factor-I (IGF-I) and dehydroepiandrosterone sulfate (DHEA-S), and their relationships with serum interleukin-6, in the geriatric syndrome of frailty. Aging Clin Exp Res. 2004;16(2):153–7. doi: 10.1007/BF03324545. [DOI] [PubMed] [Google Scholar]
- 107.Hebert R, Carrier R, Bilodeau A. The Functional Autonomy Measurement System (SMAF): description and validation of an instrument for the measurement of handicaps. Age Ageing. 1988;17(5):293–302. doi: 10.1093/ageing/17.5.293. [DOI] [PubMed] [Google Scholar]
- 108.Cacciatore F, Abete P, Mazzella F, et al. Frailty predicts long-ter mortality in elderly subjects with chronic heart failure. Eur J Clin Invest. 2005;35(12):723–730. doi: 10.1111/j.1365-2362.2005.01572.x. [DOI] [PubMed] [Google Scholar]
- 109.National Institute for Clinical Excellence. NICE, ed. London: 2016. Multimorbidity: clinical assessment and management, NICE guidelines NG56; p. 443. [Google Scholar]
- 110.Clegg A, Bates C, Young J, et al. Development and validation of an electronic frailty index using routine primary care electronic health record data. Age Ageing. 2016;358:353–60. doi: 10.1093/ageing/afw039. [DOI] [PMC free article] [PubMed] [Google Scholar]
- 111.Safari S, Baratloo A, Elfil M, Negida A. Evidence Based Emergency Medicine; Part 5 Receiver Operating Curve and Area under the Curve. Emerg (Tehran) 2016;358:111–3. [PMC free article] [PubMed] [Google Scholar]
- 112.Salaffi F, Di Carlo M, Farah S, Carotti M. Development and validation of a multidimensional frailty screening instrument in a cohort of patients with rheumatoid arthritis: the Comprehensive Rheumatologic Assessment of Frailty (CRAF) index. Clin Exp Rheumatol. 2019 (in press) [PubMed] [Google Scholar]
- 113.Rockwood K, Song X, MacKnight C, et al. A global clinical measure of fitness and frailty in elderly people. Canadian Medical Association Journal. 2005;173(5):489–495. doi: 10.1503/cmaj.050051. [DOI] [PMC free article] [PubMed] [Google Scholar]
- 114.Weiss A, Beloosesky Y, Boaz M, et al. Body mass index is inversely related to mortality in elderly subjects. J Gen Intern Med. 2008;23:19–24. doi: 10.1007/s11606-007-0429-4. [DOI] [PMC free article] [PubMed] [Google Scholar]
- 115.Garner RE, Feeny DH, Thompson A, et al. Bodyweight, gender, and quality of life: a population-based longitudinal study. Qual Life Res. 2012;21:813–825. doi: 10.1007/s11136-011-9989-1. [DOI] [PMC free article] [PubMed] [Google Scholar]
- 116.Morley JE, Vellas B, van Kan GA, et al. Frailty consensus: a call to action. J Am Med Dir Assoc. 2013;14:392–e397. doi: 10.1016/j.jamda.2013.03.022. [DOI] [PMC free article] [PubMed] [Google Scholar]
- 117.Bohannon RW. Is it legitimate to characterize muscle strength using a limited number of measures. J Strength Cond Res. 2008;22:166–e173. doi: 10.1519/JSC.0b013e31815f993d. [DOI] [PubMed] [Google Scholar]
- 118.Spiegel TM, Spiegel JS, Paulus HE. The joint alignment and motion scale: a simple measure of joint deformity in patients with rheumatoid arthritis. J Rheumatol. 1987;14(5):887–892. [PubMed] [Google Scholar]
- 119.Wolfe F, Catley MA. The assessment and prediction of functional disability in rheumatoid arthritis. J Rheumatol. 1991;18(9):1298–1306. [PubMed] [Google Scholar]
- 120.Adams J, Burridge J, Mullee M, Hammond A, Coopper C. Correlation between upper limb functional ability and structural hand impairment in an early rheumatoid population. Clin Rehabil. 2004;18(4):405–413. doi: 10.1191/0269215504cr732oa. [DOI] [PubMed] [Google Scholar]
- 121.Stanmore EK, Oldham J, Skelton DA, et al. Risk factors for falls in adults with rheumatoid arthritis: a prospective study. Arthritis Care Res (Hoboken) 2013;65:1251–8. doi: 10.1002/acr.21987. [DOI] [PMC free article] [PubMed] [Google Scholar]
- 122.Yamagiwa K, Iijima S, Furuya T, et al. Incidence of falls and fear of falling in Japanese patients with rheumatoid arthritis. Mod Rheumatol. 2011;21:51–6. doi: 10.1007/s10165-010-0351-1. [DOI] [PubMed] [Google Scholar]
- 123.Bohler C, Radner H, Ernst M, et al. Rheumatoid arthritis and falls: the influence of disease activity. Rheumatology (Oxford) 2012;51:2051–7. doi: 10.1093/rheumatology/kes198. [DOI] [PubMed] [Google Scholar]
- 124.Brenton-Rule A, Dalbeth N, Menz Hb, Bassett S, Rome K. Are foot and ankle characteristics associated with falls in people with rheumatoid arthritis? a prospective study. Arthritis Care Res (Hoboken) 2017;69:1150–5. doi: 10.1002/acr.23131. [DOI] [PubMed] [Google Scholar]
- 125.Ometto F, Fedeli U, Schievano E, Botsios C, Punzi L, Corti MC. Cause-specific mortality in a large population-based cohort of patients with rheumatoid arthritis in Italy. Clin Exp Rheumatol. 2018;36(4):636–642. [PubMed] [Google Scholar]
- 126.Michaud K, Wolfe F. Comorbidities in rheumatoid arthritis. Best Pract Res Clin Rheumatol. 2007;21:885–906. doi: 10.1016/j.berh.2007.06.002. [DOI] [PubMed] [Google Scholar]
- 127.Milton JC, Hill-Smith I, Jackson SHD. Prescribing for older people. BMJ. 2008;336:606–609. doi: 10.1136/bmj.39503.424653.80. [DOI] [PMC free article] [PubMed] [Google Scholar]
- 128.Gutiérrez-Valencia M, Izquierdo M, Cesari M, Casas-Herrero Á, Inzitari M, Martínez-Velilla N. The relationship between frailty and polypharmacy in older people: A systematic review. Br J Clin Pharmacol. 2018;84(7):1432–1444. doi: 10.1111/bcp.13590. [DOI] [PMC free article] [PubMed] [Google Scholar]
- 129.Herr M, Robine JM, Pinot J, Arvieu JJ, Ankri J. Polypharmacy and frailty: prevalence, relationship, and impact on mortality in a French sample of 2350 old people. Pharmacoepidemiol Drug Saf. 2015;24:637–646. doi: 10.1002/pds.3772. [DOI] [PubMed] [Google Scholar]
- 130.McHorney CA, Ware JE, Jr, Lu JF, Sherbourne CD. The MOS 36-item Short-Form Health Survey (SF-36): III. Tests of data quality, scaling assumptions, and reliability across diverse patient groups. Med Care. 1994;32:40–66. doi: 10.1097/00005650-199401000-00004. [DOI] [PubMed] [Google Scholar]
- 131.Moreh E, Jacobs JM, Stessman J. Fatigue, function, and mortality in older adults. J Gerontol A Biol Sci Med Sci. 2010;65:887–895. doi: 10.1093/gerona/glq064. [DOI] [PubMed] [Google Scholar]
- 132.Aletaha D, Landewe R, Karonitsch T, et al. Reporting disease activity in clinical trials of patients with rheumatoid arthritis: EULAR/ACR collaborative recommendations. Arthritis Rheum. 2008;59:1371–1377. doi: 10.1002/art.24123. [DOI] [PubMed] [Google Scholar]
- 133.Pincus T, Sokka T. Quantitative measures for assessing rheumatoid arthritis in clinical trials and clinical care. Best Pract Res Clin Rheumatol. 2003;17(5):753–781. doi: 10.1016/s1521-6942(03)00077-9. [DOI] [PubMed] [Google Scholar]
- 134.Lillegraven S, Kvien TK. Measuring disability and quality of life in established rheumatoid arthritis. Best Pract Res Clin Rheumatol. 2007;21(5):827–840. doi: 10.1016/j.berh.2007.05.004. [DOI] [PubMed] [Google Scholar]
- 135.Wade KF, Lee DM, Mcbeth J, et al. Chronic widespread pain is associated with worsening frailty in European men. Age Ageing. 2016;45:268–274. doi: 10.1093/ageing/afv170. [DOI] [PMC free article] [PubMed] [Google Scholar]
- 136.Soubrier M, Dougados M. Selecting criteria for monitoring patients with rheumatoid arthritis. Joint Bone Spine. 2005;72:129–134. doi: 10.1016/j.jbspin.2004.05.007. [DOI] [PubMed] [Google Scholar]
- 137.Prevoo ML, van ‘t Hof MA, Kuper HH, van Leeuwen MA, van de Putte LB, van Riel PL. Modified disease activity scores that include twenty-eight-joint counts. Development and validation in a prospective longitudinal study of patients with rheumatoid arthritis. Arthritis Rheum. 1995;38:44–4. doi: 10.1002/art.1780380107. [DOI] [PubMed] [Google Scholar]
- 138.van der Heijde DM. Radiographic imaging: the ‘gold standard’ for assessment of disease progression in rheumatoid arthritis. Rheumatology (Oxford) 2000;39:9–16. doi: 10.1093/oxfordjournals.rheumatology.a031496. [DOI] [PubMed] [Google Scholar]
- 139.Hawley DJ, Wolfe F. Pain, disability, and pain/disability relationships in seven rheumatic disorders: a study of 1,522 patients. J Rheumatol. 1991;18:1552–1557. [PubMed] [Google Scholar]
- 140.Li N, Chan E, Peterson S. The economic burden of depression among adults with rheumatoid arthritis in the United States. J Med Econ. 2019;5:1–7. doi: 10.1080/13696998.2019.1572015. [DOI] [PubMed] [Google Scholar]
- 141.Ní Mhaoláin AM, Fan CW, Romero-Ortuno R, et al. Frailty, depression, and anxiety in later life. Int Psychogeriatr. 2012;24(8):1265–74. doi: 10.1017/S1041610211002110. [DOI] [PubMed] [Google Scholar]
- 142.Salaffi F, Di Carlo M, Carotti M, Farah S. The Patient-Reported Outcomes Thermometer-5-Item Scale (5T-PROs): Validation of a New Tool for the Quick Assessment of Overall Health Status in Painful Rheumatic Diseases. Pain Res Manag. 2018;2018:3496846. doi: 10.1155/2018/3496846. [DOI] [PMC free article] [PubMed] [Google Scholar]