Abstract
Glioblastoma is a universally lethal form of brain cancer that exhibits an array of pathophysiological phenotypes, many of which are mediated by interactions with the neuronal microenvironment1,2. Recent studies have shown that increases in neuronal activity play an important role in glioblastoma proliferation and progression3,4. Whether there is reciprocal cross-talk between glioblastoma and neurons remains poorly defined, as the mechanisms underlying how these tumors remodel the neuronal milieu towards increased activity are unknown. Using a native model of glioblastoma, we developed a high throughput in vivo screening platform and discovered several novel driver variants of PIK3CA. Here we show that tumors driven by these variants have divergent molecular properties that manifest in selective initiation of brain hyperexcitability and remodeling of the synaptic constituency. We found that secreted glypican (GPC) family members are selectively expressed in these tumors and that GPC3 drives gliomagenesis and hyperexcitability. Together, our studies illustrate the importance of functionally interrogating diverse tumor phenotypes driven by individual, yet related, variants and reveals how glioblastoma alters the neuronal microenvironment.
In the pursuit of cataloging the spectrum of somatic mutations for all tumor types, cancer genomics is rapidly approaching a state of saturation mutagenesis5. These critical advances promise to usher in a new era of personalized medicine, where patient-specific genomic information is applied in the clinic. One major obstacle in achieving this goal is decoding driver and passenger mutations from these cohorts, as not all mutations impact malignancy, while others exert context-specific functions. Mutation “hotspots” represent variants in key driver genes that occur with high frequency and are found across different types of cancer6. While widely accepted as the convention for prospective selection of driver mutations, this approach overlooks the majority of mutations and, critically, does not account for how cellular context influences variant function7–12. Indeed, it remains unknown whether related variants exert differential effects on both tumor and microenvironmental phenotypes. These limitations illustrate the need for high-throughput, functional and phenotypic screening of individual variant cohorts in contextually appropriate, in vivo systems.
Identifying PIK3CA driver variants
The RTK/RAS/PI3K pathway is a key driver of tumorigenesis across all cancers, with 90% of Glioblastoma (GBM) tumors exhibiting alterations in this pathway13,14. Among the specific genes in this pathway, mutations in the PI3K catalytic subunit, PIK3CA, are found in 11% of GBM tumors13. Sequencing of GBM samples revealed several known hotspot mutations that drive tumorigenesis in several cancer lineages (E545K, H1047R), as well as a series of 63 in frame mutations (as indexed in COSMIC) that remain largely unclassified (Fig.1a; Supplemental Table 1). To decode which of these PIK3CA variants function as drivers of GBM, we established an in vivo complementation screening platform for GBM. Our mouse GBM model relies on in utero electroporation (IUE) and CRISPR-Cas9 mediated knockout of NF1, p53, and PTEN (termed 3xCr), with 50% of the mice succumbing to tumors by P84 (Fig.1d, black line; Extended Data Table)15. Removing the PTEN gRNA (termed 2xCr) extends median survival to P20316, providing ample dynamic range to screen for factors complementing loss of PTEN (Fig. 1d, grey line; Extended Data Table). Because PTEN catalyzes the reverse reaction of PIK3CA, phosphorylation of PIP2 to PIP3, we complemented PTEN loss with overexpression of E545K or H1047R, two bona fide hotspot driver mutations of PIK3CA12. Both of these variants accelerated tumor growth, demonstrating that known PIK3CA drivers complement PTEN loss in our system (Fig.1d, red and green lines; Extended Data Table; Extended Data Fig. 1a–b).
Figure 1. In vivo screening identifies novel driver PIK3CA variants in glioma.
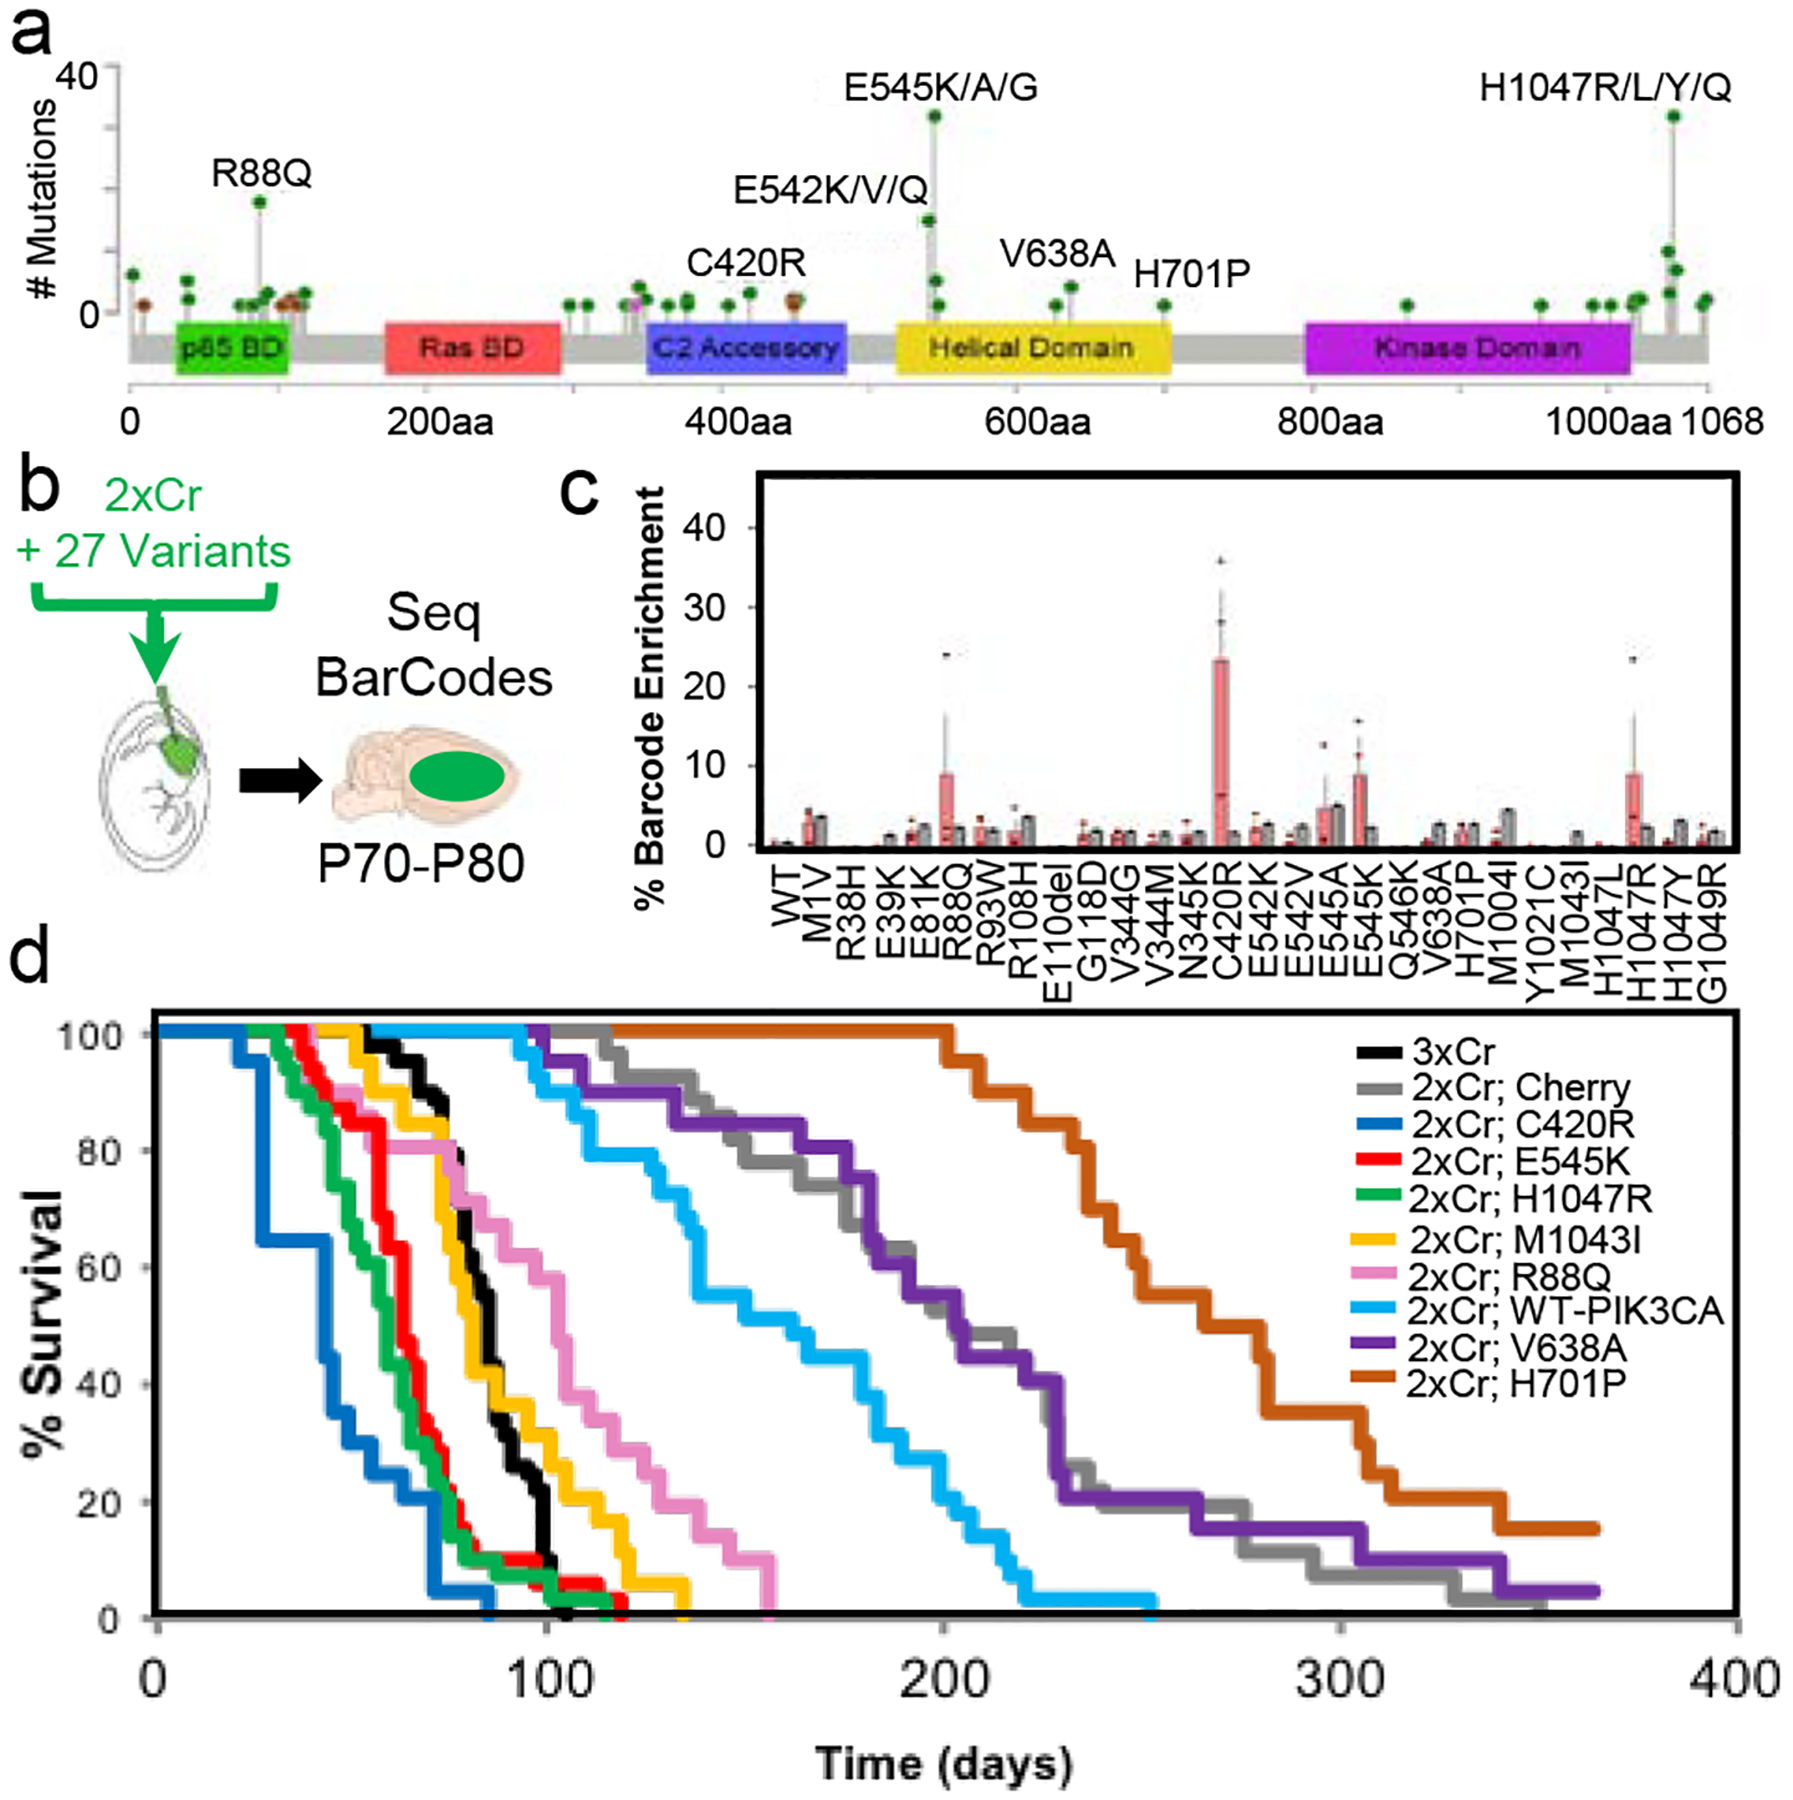
a) GBM associated PIK3CA mutations indexed in COSMIC (by 6/2019): missense (green), in frame deletion/insertions (brown), or nonsense (pink); see Supplemental Table 1. b) In vivo competition assay schematic whereby NF1 and p53 are deleted (2xCr) and 27 uniquely barcoded PIK3CA alleles are co-electroporated. N = 3 tumors. Bars are set at average; error bars denoting standard error from mean. c) Next generation sequencing for barcode amplification, each allele’s (red) BC and the input signal (black). Error bars = standard error from mean. d) Kaplan-Meier curve of all tested variants. N3xCr = 42; NCherry = 28; NPIK3CA-WT = 29; NR88Q = 21; NC420R = 20; NE545K = 32; NV638A = 20; NH701P = 20; NM1043I = 19; NH1047R = 30. Full survival statistics listed in Extended Data Table.
Our finding that established PIK3CA hotspots can drive in vivo tumorigenesis, led us to screen a cohort of PIK3CA variants found in human GBM (Fig. 1a; Supplemental Table 1). To achieve this we used DNA barcoding in combination with a pooled screening strategy (see methods)17,18 in our sensitized 2xCr model (Fig. 1b; Extended Data Fig 2). Upon glioma formation, we used targeted sequencing of tumors for barcodes as a surrogate for variant enrichment within the tumors. This analysis demonstrated that established hotspots (E545K and H1047R) are enriched along with other variants (R88Q and C420R) that have not been characterized in glioma (Fig. 1c). To confirm driver function of these variants, we individually expressed them in the 2xCr model, finding that they all complement loss of PTEN and drive tumorigenesis, while also pathologically resembling GBM (Fig. 1d, Extended Data Figs. 1a–b, 3, Extended Data Table). These data indicate that our approach can identify established hotspots, as well as novel PIK3CA driver variants in glioma.
PIK3CA tumors exhibit synaptic profiles
While the tested driver variants accelerated tumor associated death compared to the WT-PIK3CA control, they did so to varying degrees (Fig. 1d). To understand a molecular basis for differences in tumorigenic potential between these variants, we performed Reverse Phase Protein Array (RPPA) analysis on lysates collected from tumors driven by each variant, finding differential activation of PI3K-pathway components (Fig. 2a). C420R and H1047R demonstrated the highest PI3K activity and were also the strongest drivers of tumorigenesis (Fig.1d), whereas E545K, R88Q, and M1043I exhibited less activation. These differences in PI3K tone and survival suggests that individual variants promote tumorigenesis through distinct mechanisms, which we examined via RNA-Sequencing on end-stage tumors driven by these variants. Principle component analysis (PCA) of the transcriptomes revealed that tumors driven by E545K, M10431, R88Q, WT-PIK3CA, and 2XCr control are highly correlated (Fig. 2b). Strikingly, PCA revealed that the transcriptomes of tumors driven by H1047R and C420R are vastly different from this core set of variants and from one another (Fig. 2b, circles). Focusing on the molecular differences manifest in H1047R- and C420R-driven tumors, we performed Gene Ontology analysis of the transcriptome data, finding that genes associated with proliferation and synapses are differentially expressed (Fig. 2c; Supplemental Table 2). While C420R tumors demonstrated a notable increase in proliferative genes, we found two distinct patterns of synaptic gene dysregulation, with C420R tumors showing suppression of one subgroup of synaptic genes, while H1047R tumors revealed robust upregulation of an entirely different set of synaptic genes (Fig. 2d). Together, these molecular analyses reveals that gliomas driven by different PIK3CA variants are endowed with distinct molecular features that can be uncoupled from PI3K-activation (i.e. C420R and H1047R). Moreover, these findings highlight how driver variants endowed with single amino acid differences, exhibiting seemingly similar phenotypic effects, can have distinct underlying molecular properties.
Figure 2. Tumors driven by PIK3CA variants exhibit diverse molecular properties.
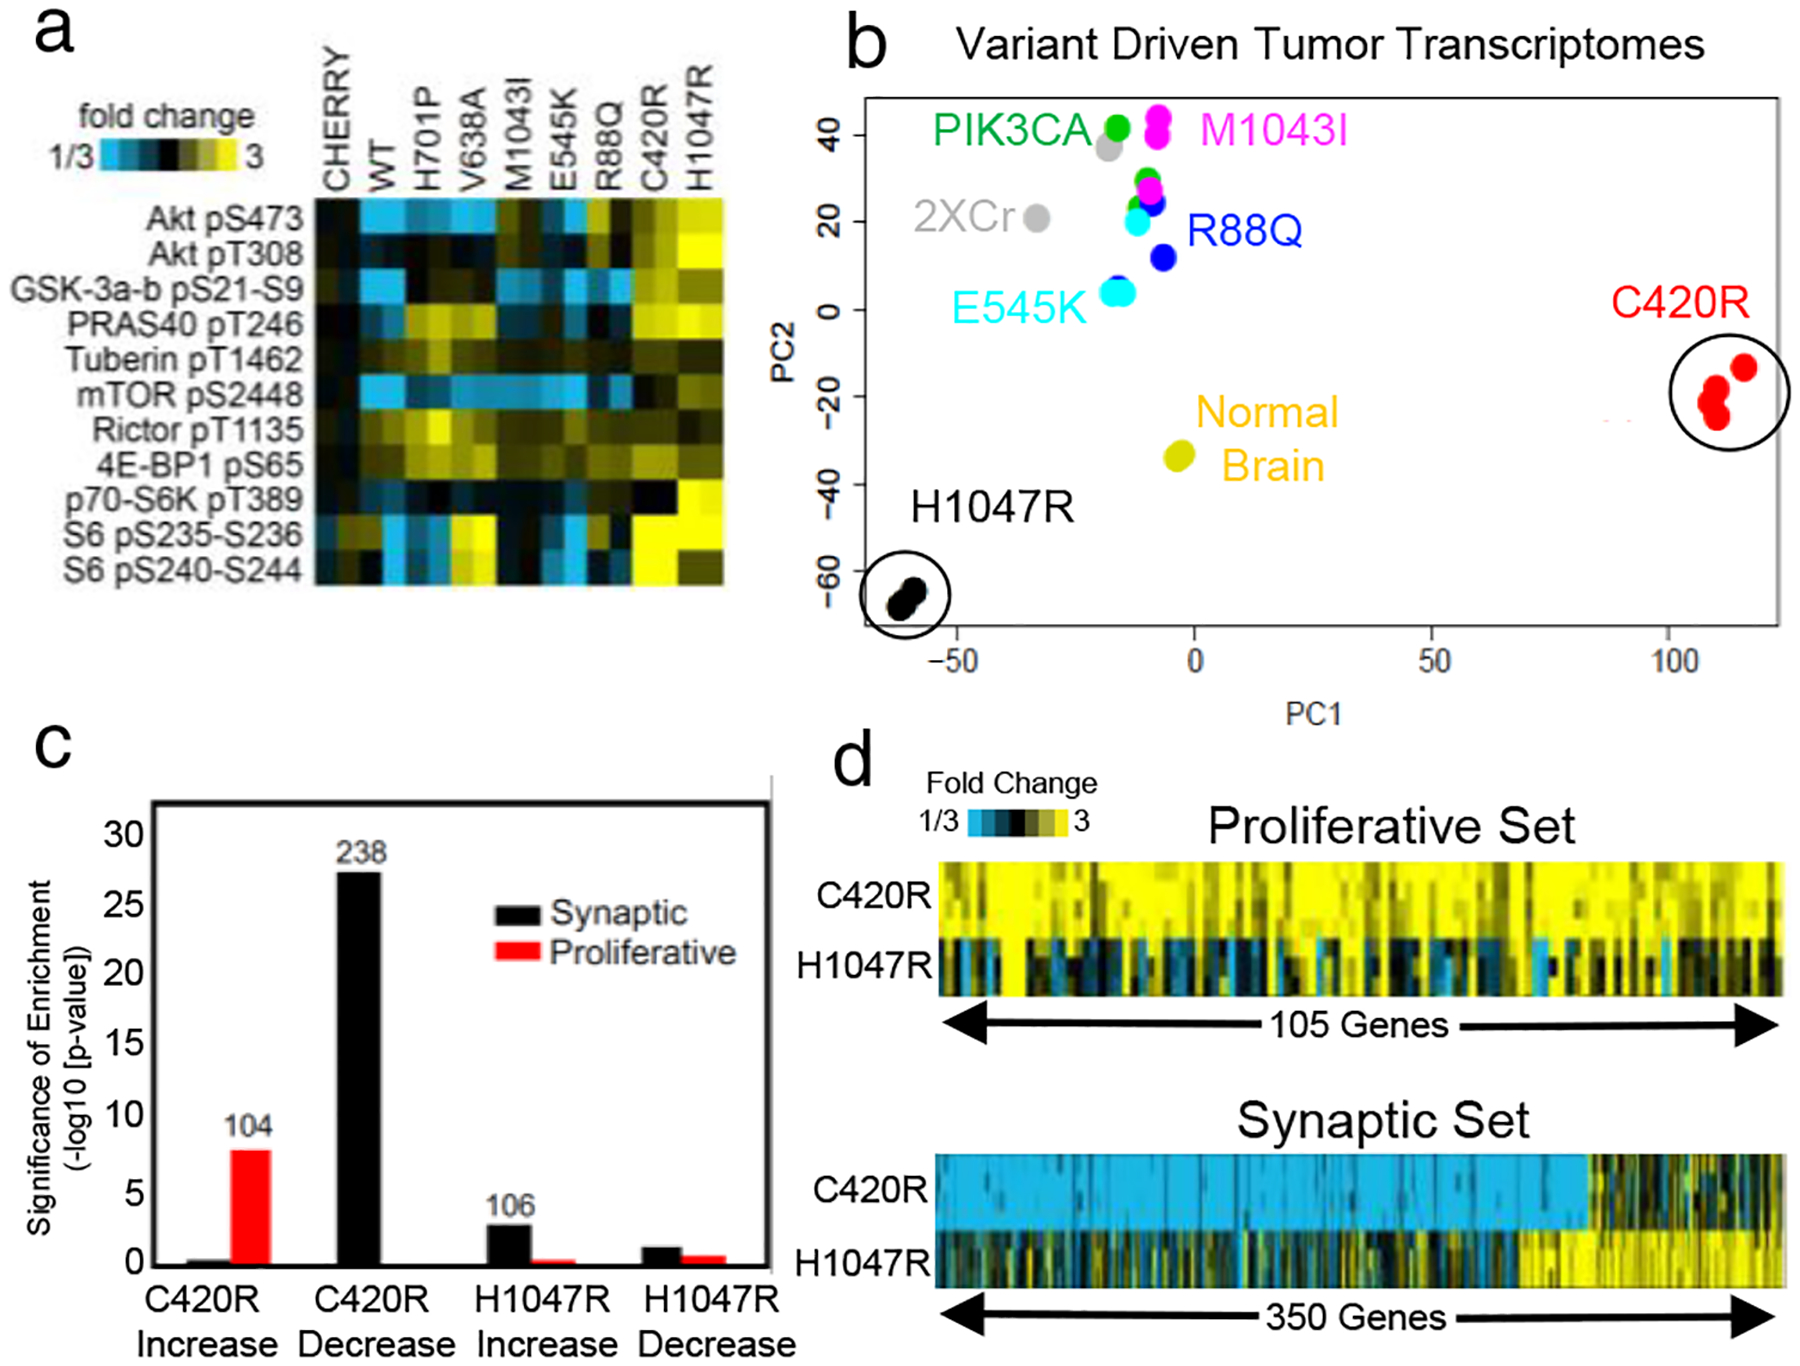
a) Tumor lysate RPPA for PI3K-AKT-MTOR pathway proteins12; N = 2 per variant. b) Principle components (PC) analysis against top 2000 variable genes across variant tumors from RNA-Seq. NNormal Brain = 2; NC420R = 4; all other variants N = 3. c) Taking the top genes increased or decreased in C420R and H1047R variants (p<.01 for both WT and Cherry control comparisons, by linear model), enrichment analysis for gene sets associated with synapse function or proliferation. Number above bars represent genes from each set involved in observed significant overlap. p-values by one-sided Fisher’s exact test; NC420R = 4; NH1047R = 3. d) Differential gene expression patterns (relative to average of WT and cherry controls) for C420R and H1047R driven tumors for proliferative or synapse genes.
Selective induction of hyperexcitability
Given the distinct molecular features of C420R and H1047R driven tumors, we next determined whether these tumors exhibit unique biological properties. Because tumors driven by C420R display a pronounced increase in genes associated with proliferation (Fig. 2c–d) and cause shorter median survival time in mice when compared to H1047R driven tumors (44 days vs. 59 days), we evaluated tumor growth and proliferation during early tumorigenesis. Using BrdU labeling and MRI imaging (Extended Data Fig. 1c–e) we found that C420R driven tumors exhibit an enhanced proliferative phenotype compared to H1047R and R88Q, thus corroborating the underlying molecular features of these variants. The other defining molecular feature of C420R- and H1047R-driven tumors is dysregulation of distinct cohorts of synapse-associated genes (Fig. 2c–d). It is well established that synaptic imbalance can result in extensive changes in network excitability, which in some cases culminates in seizure activity19,20. Critically, seizures are an early pathophysiological hallmark of malignant glioma that are recapitulated in our mouse model of glioma15,21–23. Therefore, we determined whether mice bearing tumors driven by C420R and H1047R exhibit pronounced network hyperexcitability during the early stages of tumor progression (Fig. 3a). We performed serial video electroencephalography (EEG) recordings every five days during the P30-P60 interval (Extended Data Fig. 4), finding that mice bearing tumors driven by H1047R show an earlier onset of seizures (50% of the cohort exhibiting convulsive seizures at P30) than mice bearing tumors driven by C420R (seizures first appear at P45) (Fig. 3b). EEG recordings of these mice during this interval revealed significant increases in network hyperexcitability, with both groups of mice demonstrating similar increases in spiking frequency as early as P30-P35 (Fig. 3b). In contrast, mice bearing R88Q driven tumors did not demonstrate convulsive seizures or changes in EEG activity during the P30-P60 interval (Fig. 3b). These variant specific increases in hyperexcitability trend with the relative changes in synaptic gene cohorts of C420R and H1047R, suggesting that tumors driven by these variants result in early synaptic imbalance during the formative stages of tumor progression.
Figure 3. C420R- and H1047R-tumors promote hyperexcitability and synaptic imbalance across tumor models.
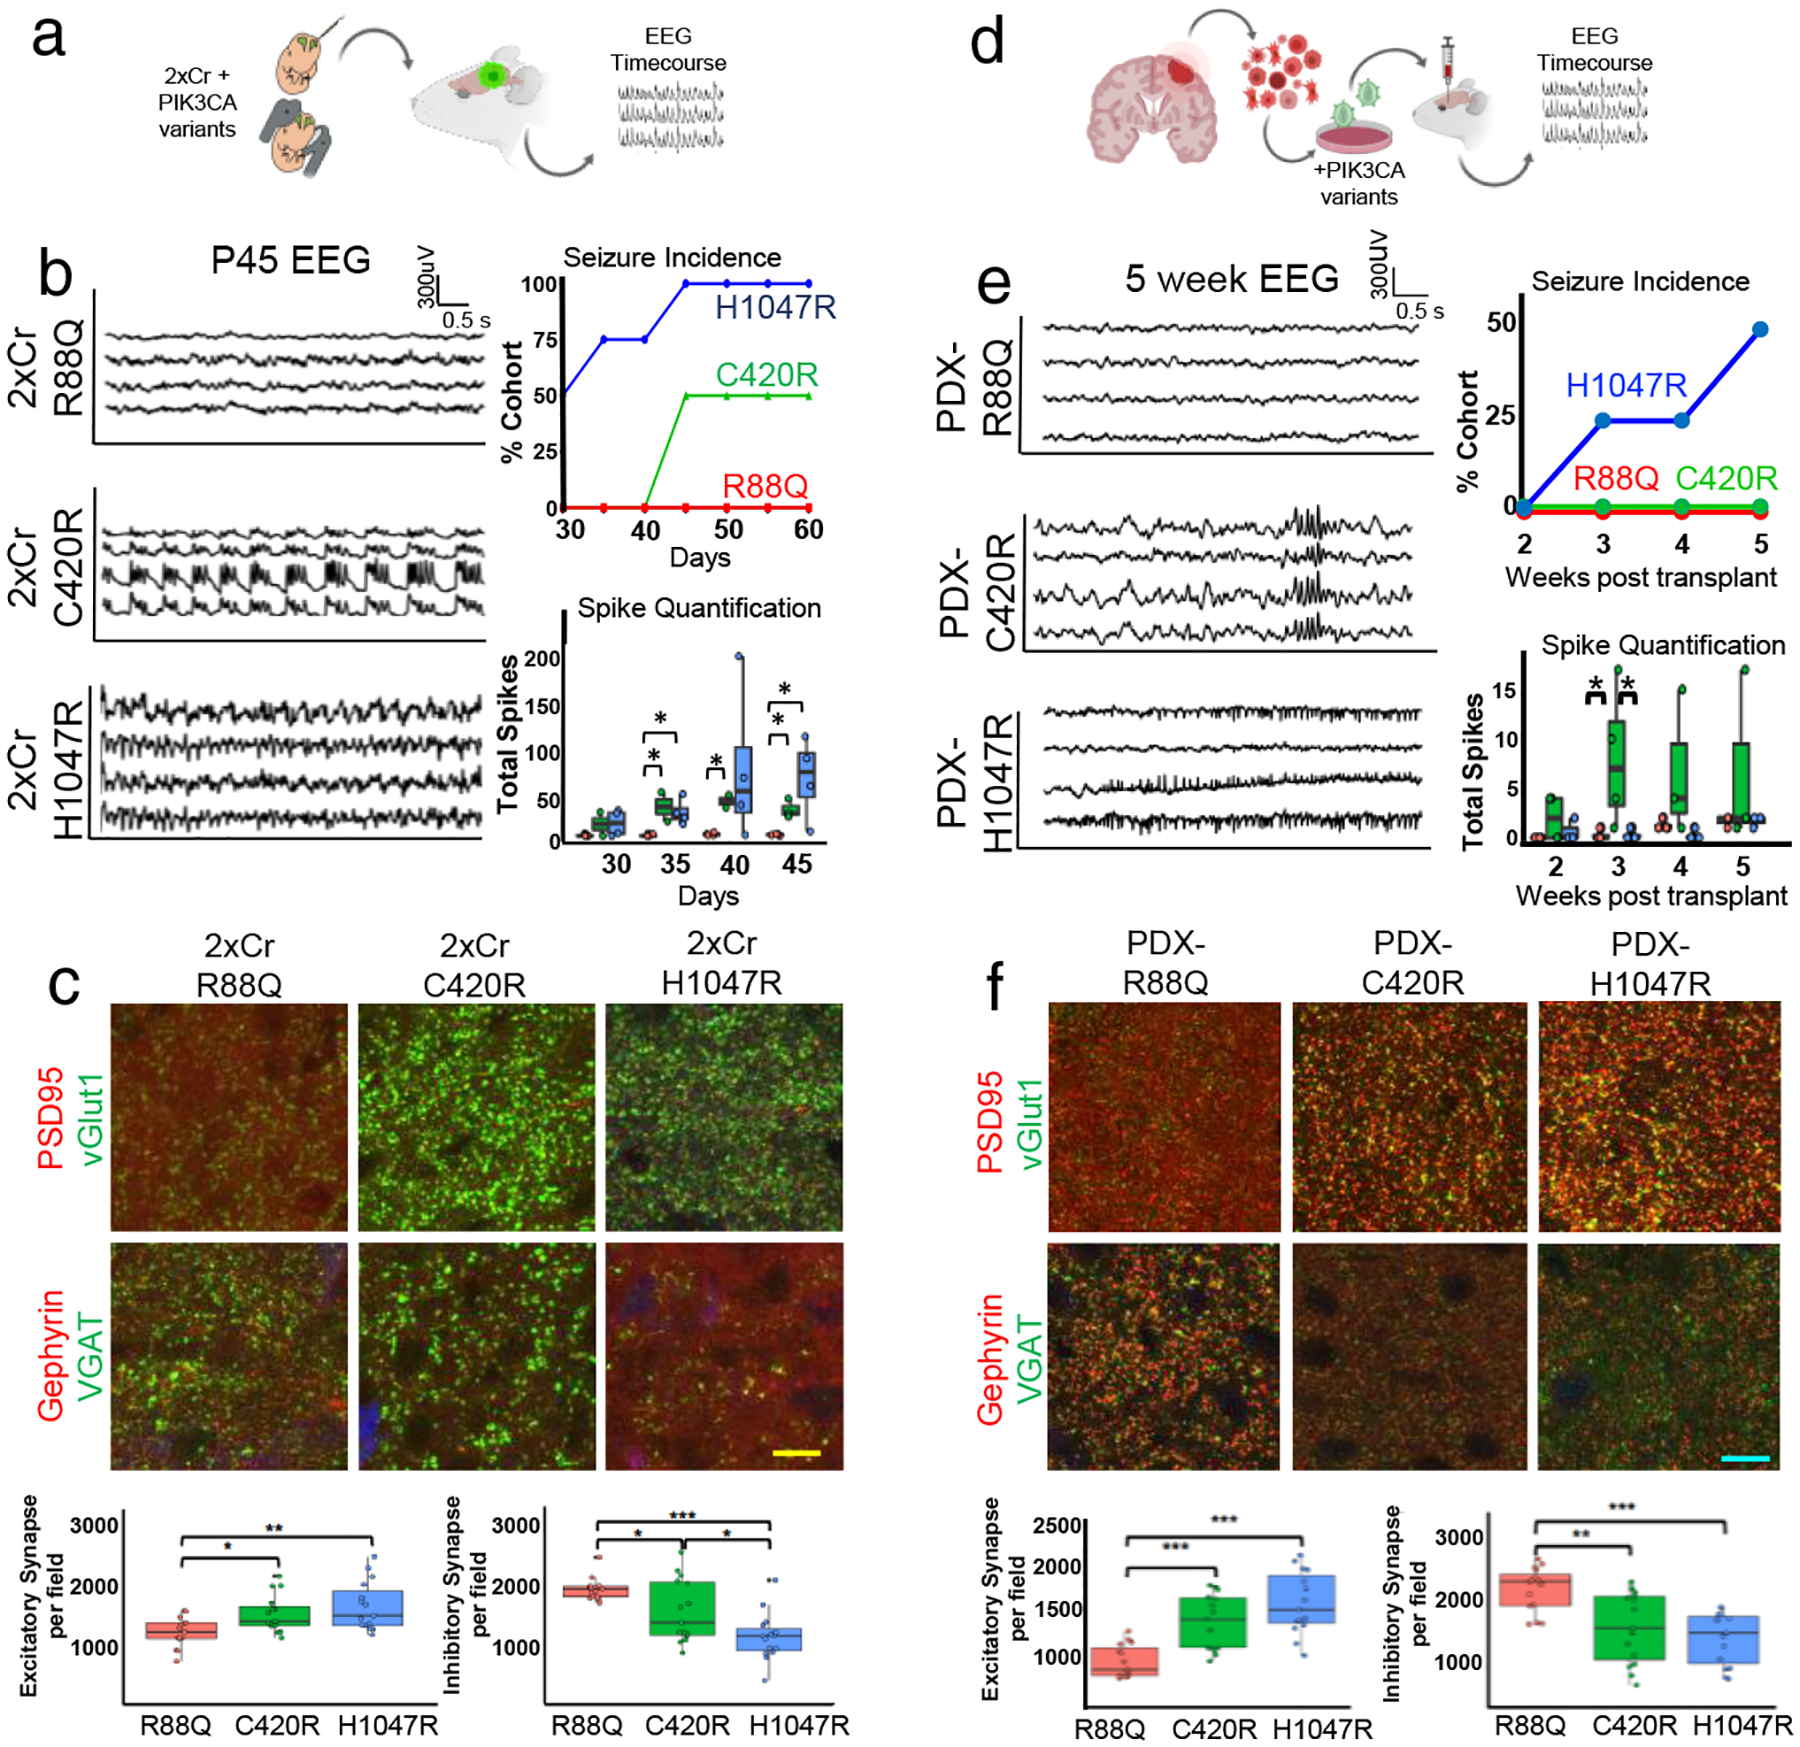
a) Schematic of experimental plan for IUE model. b) EEG traces of select variant tumor mice at P45 and quantification of EEG analyses. Traces for C420R and H1047R occurred during seizures. Seizure incidence and total spike activity quantifications; N = 4 mice per variant. Plots are centered on mean, boxing the interquartile range (25th-75th percentiles), with whiskers extending to 1.5 times the interquartile range above and below. p-values: * p<.05; calculated by One-way ANOVA. c) Antibody staining of excitatory and inhibitory synapses in P30 mouse brains at peritumoral margins and quantification. GFP signal (blue, not labeled) denotes tumor. Yellow scale bar = 12.5μm. Quantifications from 34,000μm2 field. Nbiological = 3 mice; Ntechnical = 5 repeats. Plots centered on mean, boxing the interquartile range (25th-75th percentiles), with whiskers extending to 1.5 times the interquartile range above and below. p-values: * p<.05; ** p<.01; *** p<.001; calculated by One-way ANOVA. d) Schematic of PDX model experiments e) EEG traces of mice bearing PDX tumors expressing PIK3CA variants 5 weeks after transplantation and quantification. Trace for PDX-C420R mice demonstrates aberrant EEG patterns without associated seizures; trace for PDX-H1047R was during an electrographic, non-convulsive seizure. For quantifications, N = 4 mice per variant. Plots are centered on mean, boxing the interquartile range (25th-75th percentiles), with whiskers extending to 1.5 times the interquartile range above and below. p-values: * p<.05; calculated by One-way ANOVA. f) Antibody staining of excitatory and inhibitory synapses from peritumoral margins of PDX brains and quantification. Blue scale bars = 10μm. Quantifications from 34,000μm2 field. Nbiological = 3 mice; Ntechnical = 5 repeats. Plots are centered on mean, boxing the interquartile range (25th-75th percentiles), with whiskers extending to 1.5 times the interquartile range above and below. p-values: * p<.05; ** p<.01; *** p<.001; calculated by One-way ANOVA. Color legend denoting variant on bottom of figure.
To determine whether C420R and H1047R tumors exhibit changes in synaptic phenotypes in the tumor microenvironment during early tumorigenesis, we isolated C420R- and H1047R-driven tumors from P30 mice and stained for makers of excitatory (vGLUT1/PSD95) and inhibitory (vGAT/Gephyrin) synapses at the peritumoral margins (Extended Data Fig. 5). These studies revealed significant increases in excitatory synapses at the peritumoral margins of both C420R and H1047R tumors compared to R88Q tumors (Fig. 3c). Strikingly, analysis of inhibitory synapses revealed a decrease in their numbers surrounding C420R and H1047R tumors, compared to R88Q (Fig. 3c). These changes in synaptic constituency, increases in excitatory and decreases inhibitory, in neurons adjacent to C420R and H1047R driven tumors further indicate that the observed increases in network hyperexcitability result, in part, from synaptic imbalance. Next, we extended these functional studies to patient-derived xenograft models (PDX), by generating glioma stem cell lines24 that individually overexpress H1047R, C420R, and R88Q (Fig. 3d). These lines were subsequently transplanted into the brains of SCID mice, where we assessed the onset of hyperexcitability via EEG, finding that mice bearing PDX-H1047R exhibit early onset of seizures, while mice bearing PDX-C420R exhibit early onset of network hyperexcitability (Fig. 3e). Critically, PDX-R88Q did not demonstrate early onset of either seizures or hyperexcitability (Fig. 3e). Moreover, cellular analysis of the peritumoral synaptic constituency revealed that both PDX-H1047R and PDX-C420R tumors provoke an increase in excitatory synapses, coupled with a decrease in inhibitory synapses compared to PDX-R88Q tumors (Fig. 3f). These alterations in synaptic constituency are met with congruent changes in cell proliferation, as PDX-H1047R and PDX-C420R exhibit increased BrdU incorporation (Extended Data Fig 1f). Together, these functional studies in PDX models reinforce our conclusion that these variants selectively promote changes in network hyperexcitability and synaptic constituency.
Variant-specific synaptogenic mechanisms
The synaptic changes at the peritumoral margin in both the native and PDX models suggest that these variants function via cell non-autonomous mechanisms. However, several PIK3CA variants are associated with monogenic pediatric overgrowth syndromes and can promote hyperexcitability on their own, including H1047R, suggesting that they may also function cell autonomously25–27. To address this, we performed individual IUE, outside the tumorigenic context, with H1047R, C420R, and R88Q, in conjunction with serial EEG recordings every five days during the P30-P60 interval (Extended Data Fig. 4). Mice expressing H1047R exhibited increased hyperexcitability as early as P30, coupled with seizures at P40, while mice expressing C420R and R88Q did not demonstrate any changes across this interval (Fig.4a); we did not observe any changes in cell proliferation. (Extended Data Fig 1g–i). These data indicate that H1047R promotes hyperexcitability on its own, whereas C420R cannot, suggesting that these variants employ different mechanisms to alter synaptic constituency. Next, we utilized an established neuron-glial co-culture system15, which enables us to directly assess the cell non-autonomous contributions of these variants to synaptogenesis (Fig. 4b). We overexpressed C420R and H1047R in astrocytes, co-cultured with neurons, finding that C420R promotes synapse formation between neurons as measured by expression of synaptic markers (Fig. 4c). Whole cell recordings revealed increased frequency of excitatory (EPSC) and inhibitory (IPSC) postsynaptic currents in neurons when co-cultured with astrocytes expressing C420R (Fig. 4d–e). Conversely, H1047R overexpression in astrocytes did not enhance synapse formation on neurons (Fig. 4d–e). Together, these results illustrate mechanistic differences between H1047R and C420R. H1047R promotes brain hyperexcitability on its own, through cell autonomous mechanisms, whereas C420R promotes brain hyperexcitability specifically in the context of a glial tumor, through cell non-autonomous mechanisms.
Figure 4. C420R and H1047R differentially promote synaptic imbalance.
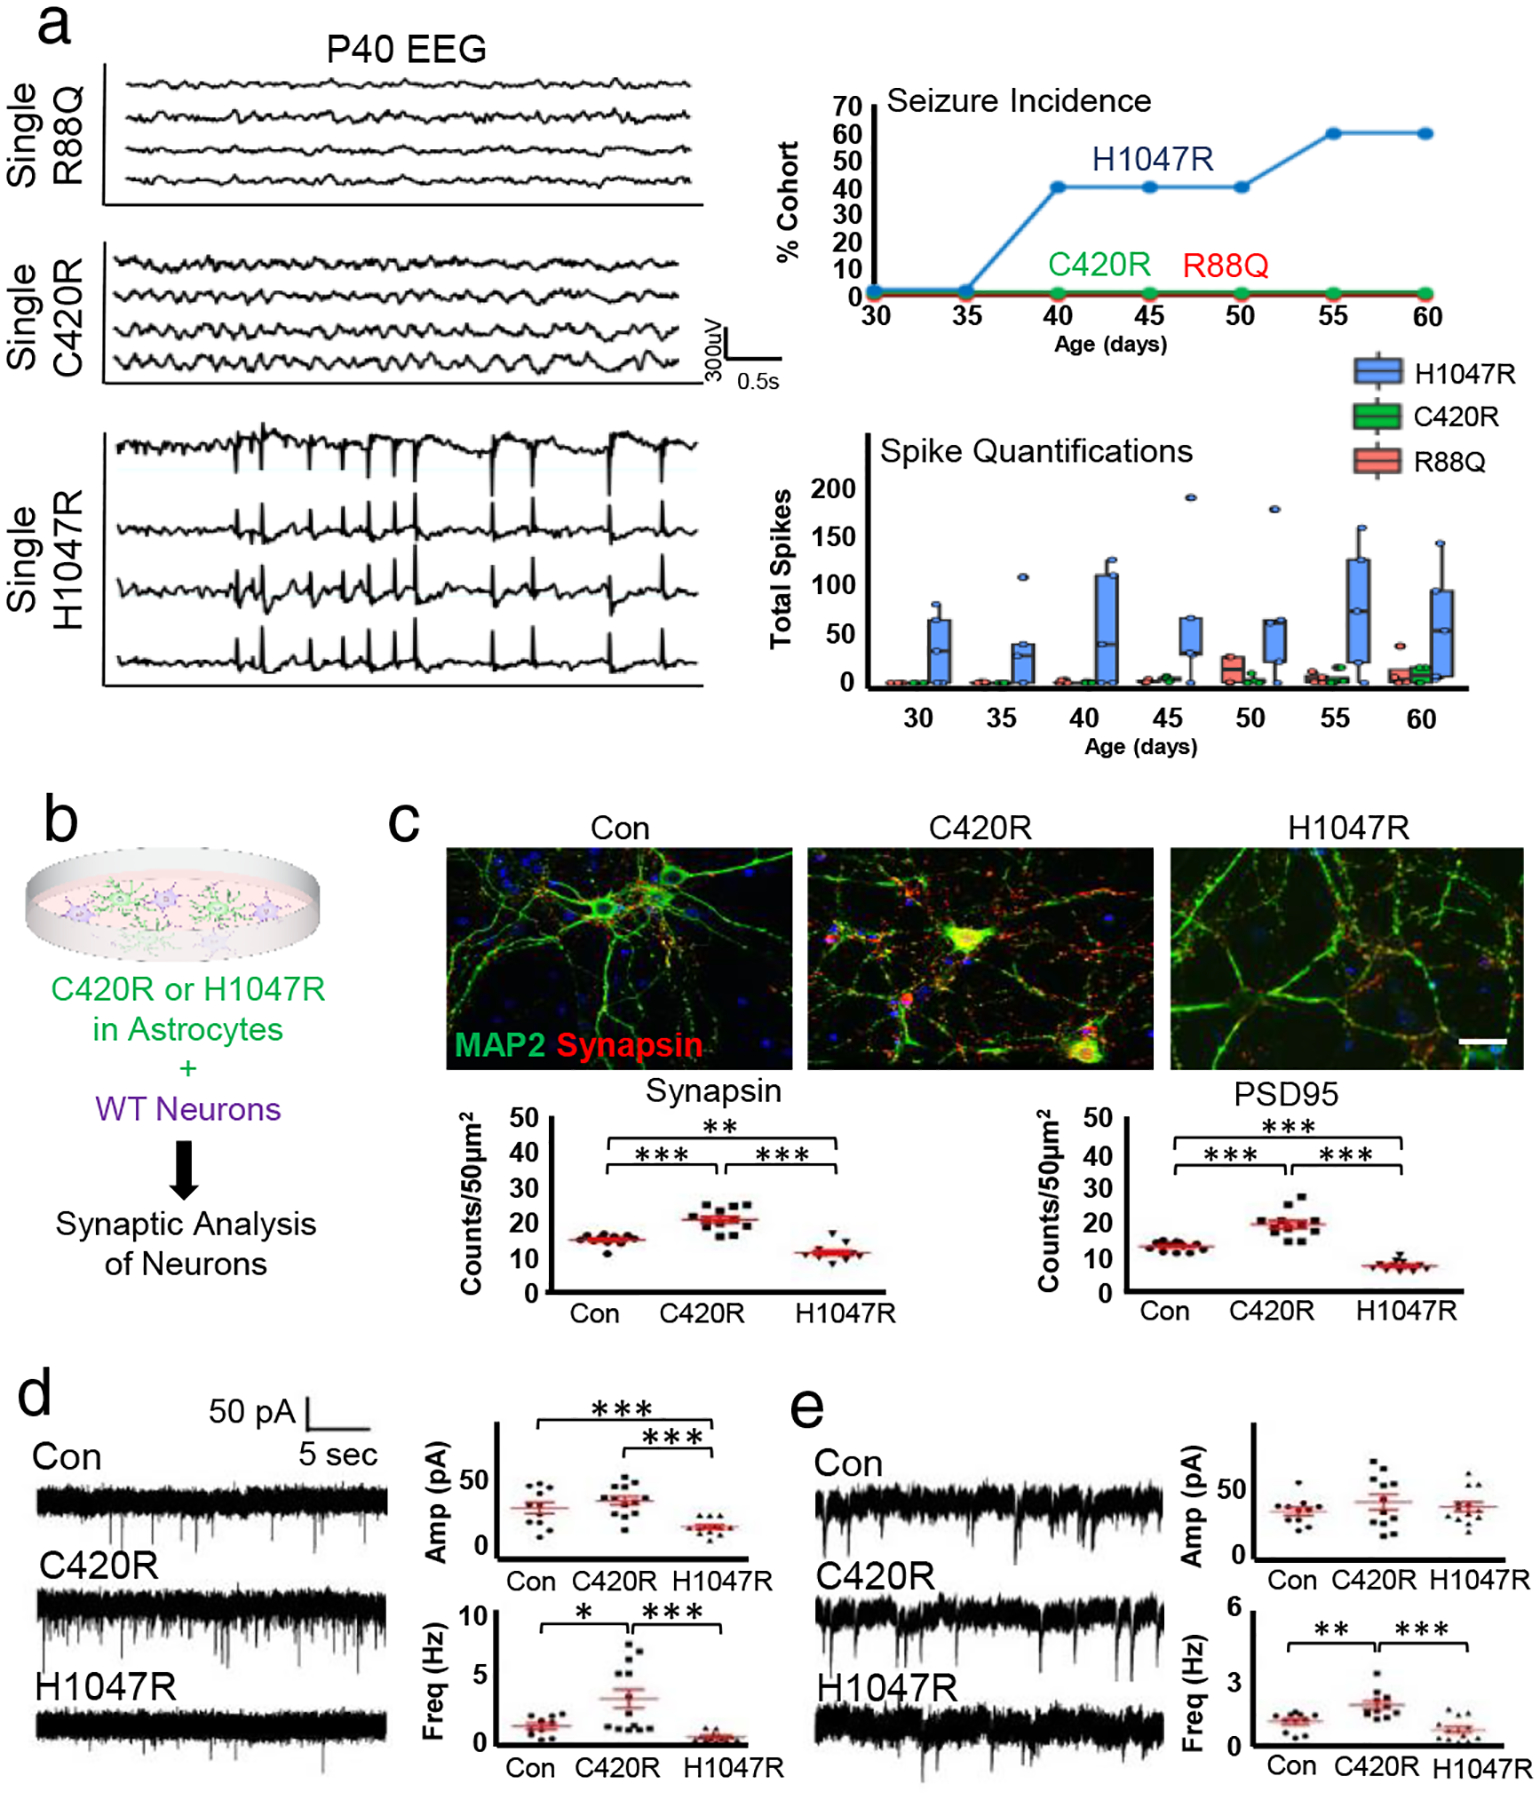
a) EEG traces of variants overexpressed in mouse brains at P40 and quantification. Trace for H1047R was during seizure. Seizure incidence and total spike activity quantifications; N = 4 mice per variant. Plots centered on mean, boxing the interquartile range (25th-75th percentiles), with whiskers extending to 1.5 times the interquartile range above and below. No significant (<.05) p-values were calculated by One-way ANOVA. b) Astrocyte-neuron co-culture schematic. c) Antibody staining for Synapsin1 (red) and Map2 (green) of astrocyte-neuron co-cultures; astrocytes infected with control (Con), C420R, or H1047R viruses. Quantification of PSD95 and Synapsin1 staining. Ntechnical = 12 each condition. Plots are centered on mean, boxing the interquartile range (25th-75th percentiles), with whiskers extending to 1.5 times the interquartile range above and below. p-values: ** p<.01; *** p < .001; calculated by one-tail independent T-test; Tukey’s test was used to compare individual mean. White scale bar = 50μm. d) Representative traces of excitatory postsynaptic current from whole-cell recording of neurons co-cultured on astrocytes infected with control (Con), C420R, or H1047R viruses, with quantification. Ntechnical = 12 each condition. Plots are centered on mean, boxing the interquartile range (25th-75th percentiles), with whiskers extending to 1.5 times the interquartile range above and below. p-values: * p<.05; *** p < .001; calculated by one-tail independent T-test; Tukey’s test was used to compare individual mean. e) Analysis of inhibitory postsynaptic current. Ntechnical = 12 each condition. Plots are centered on mean, boxing the interquartile range (25th-75th percentiles), with whiskers extending to 1.5 times the interquartile range above and below. p-values: * p<.05; *** p < .001; calculated by one-tail independent T-test; Tukey’s test was used to compare individual mean.
Glypican 3 promotes tumorigenesis
To understand how C420R exerts a cell non-autonomous effect on synaptogenesis, we further analyzed the RNA-Seq data from the variant driven tumors, focusing on a set of genes that are secreted from glia and promote synapse formation onto neurons28. Amongst this group, we found that members of the Glypican-family are selectively upregulated in tumors driven by C420R (Extended Data Fig. 6a). Analysis of The Cancer Genome Atlas (TCGA) data for glioma revealed that Glypican3 (GPC3) is more highly expressed in human glioblastoma tumors versus lower grade glioma (Extended Data Fig. 6b). We confirmed protein expression using immunohistochemistry on primary human glioma samples and detected elevated GPC3 expression in C420R-driven mouse tumors (Fig. 5a; Extended Data 6c). Together, these data suggest that GPC3 may contribute to glioma tumorigenesis and downstream synaptic remodeling. Critically, how secreted synaptogenic proteins expressed in glioma influence: i) tumorigenesis, ii) the surrounding neuronal microenvironment, and iii) key neurological features of glioma pathophysiology remain largely undefined. Therefore, examining GPC3 function in this context provides an opportunity to understand how these facets of glioma biology are regulated.
Figure 5. GPC3 promotes gliomagenesis and synaptic imbalance.
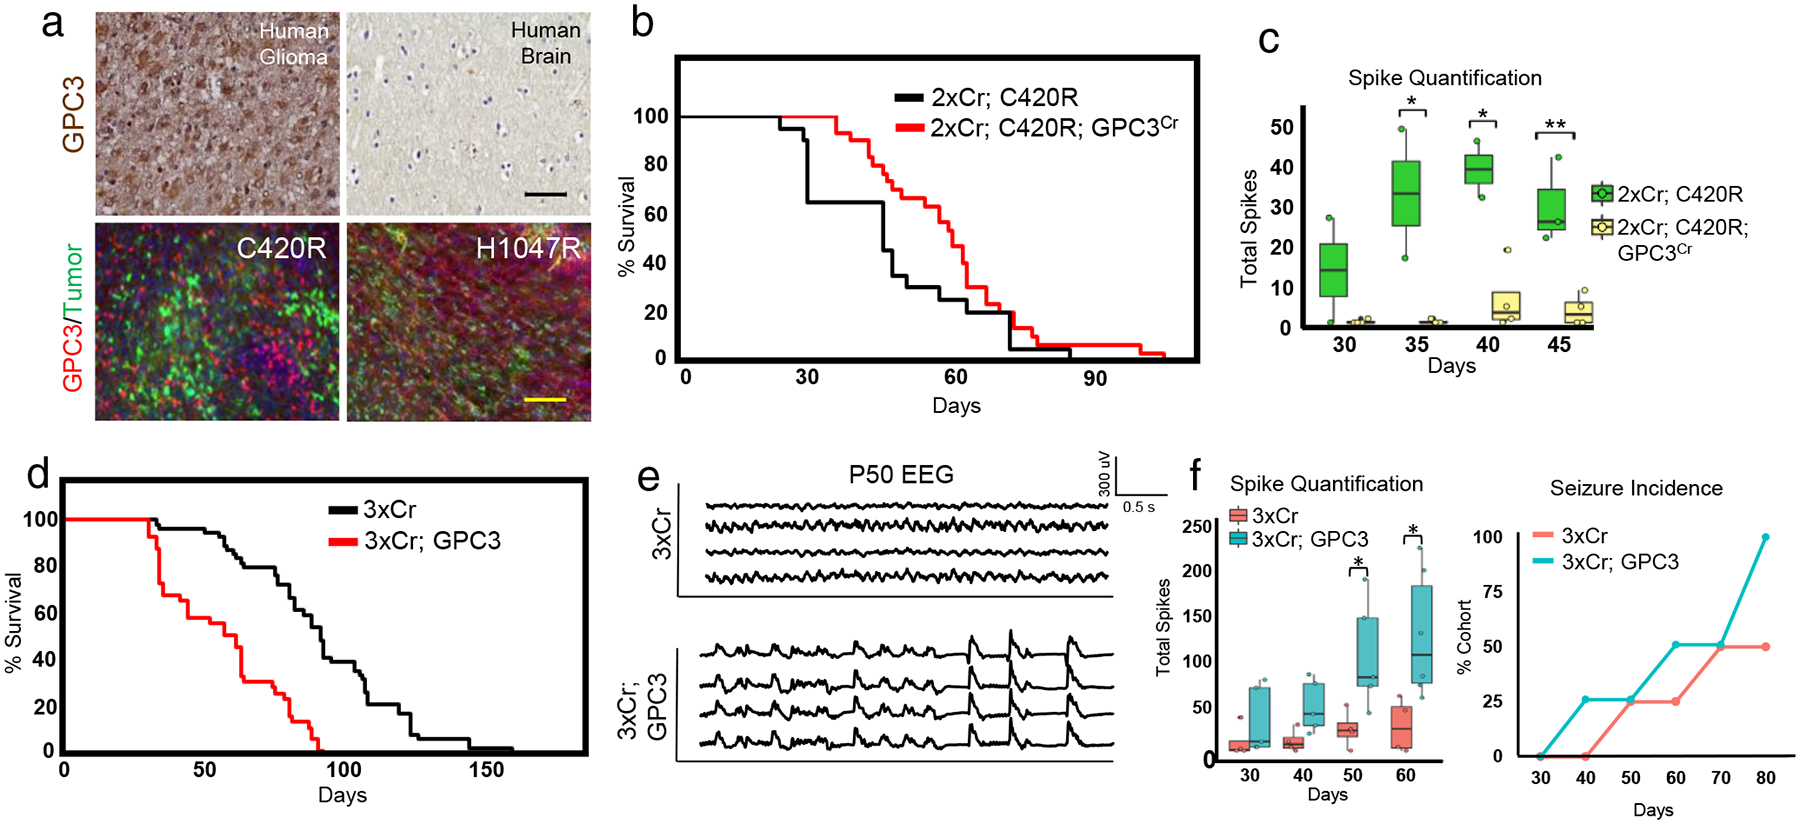
a) GPC3 staining of human GBM and normal human brain control. Black scale bar = 50μm. Human tissue staining was not independently repeated. GPC3 antibody staining of P30 mouse C420R and H1047R tumor brains. N = 4 mice for each variant. Yellow scale bar = 100μm. These experiments were independently repeated 4 times. b) Kaplan-Meier curve comparing GPC3Cr in 2xCr; C420R tumors. NC420R = 20; NC420R;GPC3CR = 30; statistics in Extended Data Fig. 8b. c) EEG spike activity decreases with GPC3Cr. Seizure incidence and total spike activity quantifications; N = 4 mice per variant. Plots are centered on mean, boxing the interquartile range (25th-75th percentiles), with whiskers extending to 1.5 times the interquartile range above and below. p-values: * p<.05; ** p<.01; calculated by One-way ANOVA. N = 4 mice each. d) Kaplan-Meier curve comparing GPC3 overexpression in 3xCr tumors. N3xCr = 55; N3xCr; GPC3 = 41; full statistics in Extended Data Fig 8b. e) EEG traces of GPC3 overexpression in 3xCr tumors at P50. f) Quantification of total spike activity and seizure incidence; N3xCr = 4 mice and N3xCr;GPC3 = 5 for spike quantifications. Plots are centered on mean, boxing the interquartile range (25th-75th percentiles), with whiskers extending to 1.5 times the interquartile range above and below. p-values: * p<.05; calculated by One-way ANOVA.; N = 4 mice per condition for seizure incidence.
To determine whether GPC3 contributes to C420R-driven tumors, we used CRISPR-Cas9 approaches to delete GPC3 (GPC3Cr) in C420R-driven mouse tumors, finding that loss of GPC3 extended median survival (Fig. 5b, P44 vs. P60; Extended Data Fig 7). Strikingly, serial EEG recordings of mice bearing 2xCr; C420R; GPCCr tumors revealed a loss of early onset hyperexcitability compared to C420R-driven controls (Fig.5c). Having established that GPC3 is necessary for key pathophysiology properties of C420R-driven tumors, we next evaluated whether it is sufficient to drive glioma tumorigenesis independent of PIK3CA variants. Towards this, we combined PiggyBac mediated GPC3-overexpression with our 3xCr system; survival analysis revealed that GPC3-overexpressing mice exhibited significantly shorter median survival than 3xCr controls (P59 vs. P91) (Fig.5d; Extended Data Fig. 7). Next, we examined seizure phenotypes via video EEG in 3xCr tumors overexpressing GPC3, finding that mice bearing GPC3 overexpressing tumors exhibited early onset of convulsive seizures and heightened network hyperexcitability as early as P40 (Fig. 5d–f). Together, these studies indicate GPC3 functions as a driver of glioma tumorigenesis, that accelerates the onset of seizures and hyperexcitability.
The robust effects of GPC3-overexpression on these key tumor pathophysiological properties, led us to examine the cellular phenotypes in these tumors. First, we evaluated cellular proliferation, finding an increase in BrdU-labeling in GPC3-driven tumors (Extended Data Fig. 8). Next, we probed the peritumoral synaptic constituency, identifying increases in both excitatory- and inhibitory- synapses in these tumors (Extended Data Fig. 8), suggesting that GPC3 promotes the aberrant formation of both excitatory- and inhibitory- synapses. Previous studies demonstrated that other members of the glypican family promote synapse formation onto neurons through secretion from adjacent glial cells29,30, suggesting that GPC3 may act via a similar mechanism. To test this, we overexpressed GPC3 in astrocytes, co-cultured with neurons, finding that GPC3 overexpression in astrocytes dramatically increases synapse formation onto neurons, measured by synaptic marker expression and whole cell recordings from these neurons (Extended Data Fig. 9). Conditioned media from these astrocytes promoted heightened SPSC frequency on neurons (Extended Data Fig. 9), indicating that GPC3 acts via non-cell autonomous mechanisms. These studies identify GPC3 as a key factor in glioma-induced neosynaptogenesis that manipulates the neuronal microenvironment during tumor progression.
Discussion
Decoding variant function in cancer has become an increasingly critical requirement for developing personalized therapeutics. In this study, we describe a new, in vivo complementation screening platform that enables the rapid identification of driver mutations in a native model of glioma. Using this system, we identified several new driver variants of PIK3CA that are active in glioma. Critically, a subset of these variants (C420R, M1043I, R88Q) appear to function in a glioma-relevant manner, as studies in other cancer models did not identify these variants or their relative oncogenic potential varies7,17. Together these studies illustrate that variant function is context-specific and highlight the importance of decoding cell lineage and genetic relationships7,31–33. Furthermore, amongst the PIK3CA variants that operate as drivers in our glioma system, transcriptome analysis identified striking molecular differences in the tumors driven by these variants. These findings demonstrate that similar variants can engender a diverse range of molecular properties in glioma tumors, reinforcing the importance of deciphering the selective functions of each driver variant.
Our identification of proliferative- and synaptic gene dysregulation amongst tumors driven by H1047R and C420R served as an entry point for demonstrating phenotypic differences amongst these tumors. Using both native mouse- and PDX- models, we found that tumors driven by these variants selectively alter the neuronal microenvironment towards heightened network hyperexcitability and seizure onset, two key features of glioma pathophysiology22. Furthermore, H1047R and C420R utilize different mechanisms to engender these common physiological phenotypes. Nevertheless, these findings further illustrate that crosstalk between glioma tumors and the surrounding neuronal microenvironment is a key contributor to malignant growth. Several recent studies have shown that increases in neuronal activity promotes glioma tumor proliferation1,2 and when put together with our findings, indicate a vicious cycle between glioma cells and adjacent neurons, where glioma cells promote network hyperexcitability, and these increases in neuronal activity promote tumor growth. To understand how these variant-driven tumors promote neuronal activity, we identified GPC3 as a driver of glioma tumorigenesis, network hyperexcitability, and synapse formation. Because GPC3 promotes synapse formation through cell non-autonomous mechanisms, a model emerges where secreted proteins from glioma stimulates neuronal activity by triggering synaptogenesis during early tumorigenesis, working in concert with neurons to orchestrate both network hyperexcitability and growth.
Methods and materials
All mouse gliomas were generated in the CD-1 IGS mouse background as previously described15. In utero electroporation (IUE) was performed on embryonic day 15. Previously generated CRISPR constructs were used to knockout NF1, PTEN, and p53 (each at 1.5μg per μl)15. PIK3CA alleles were genomically integrated and overexpressed through the piggyBac (PB) transposase (PBase) system. The pGlast-PBase plasmid (at 2.0μg per μl)34 was co-electroporated with a PBCAG-PIK3CA* construct (1.0μg per μl) (see below). Additionally the PBCAG-GFPt2aLuc (1.0μg per μl) was co-electroporated to allow for fluorescent and bioluminescent visualization.
In vivo functionalization studies of GPC3 were performed by co-electroporating a PBCAG-GPC3 construct (at 1.0μg per μl), generated through the HiTMMob approach (see below), into the 3xCr model15. Loss-of-function studies were performed by co-electroporating a CRISPR construct targeting the third exon of the mouse GPC3 gene. The gRNA sequence (5’-CTTGGGTTCTGATATCAACG-3’ was generated through Broad Institute GPP portal (https://portals.broadinstitute.org/gpp/public/analysis-tools/sgrna-design)35. Candidate gRNA sequence was validated through the mismatch-cleavage SURVEYOR assay (IDT, 706020) on genomic DNA (gDNA) harvested from tumor tissue (Extended Data Fig 8c). Primer sequences for validation are listed in Extended Data Fig 8d. All procedures were approved by the Institutional Animal Care and Use Committee (IACUC) at Baylor College of Medicine and conform to the US Public Health Service Policy on Human Care and Use of Laboratory Animals.
In vivo barcode (BC) enrichment competition assay
A PB transposable vector (PBCAG-EGFP-T2A-GWR1R4) was engineered from the PBCAG-EGFP construct34. The EGFP STOP codon was removed and an inframe T2A sequence followed by attR1/attR4 Gateway cloning sites were inserted. These attR sites flanked chloramphenicol and ccdB selection cassettes. A V5 tag sequence was also inserted downstream of the attR4 site. PIK3CA alleles and BC sequences were cloned in using the HiTMMoB approach17,18. The list of tested PIK3CA variants and associated mutational information are in Supplemental Table 1. PIK3CA variant constructs were generously provided in collaboration with GBM, KLS, and the CTD2 (https://ocg.cancer.gov/programs/ctd2).
Pooled injection cocktails were assembled such that the pool of tested variants totaled 1.0μg per μl rather than a single PIK3CA variant. Briefly, equal moles of each plasmid were mixed together, ethanol precipitated, and redissolved/concentrated in ddH2O. This pooled plasmid mixture was diluted to 1.0μg per μl in the final IUE injection cocktail.
After IUE of the pooled cocktail (with 2xCr, PBase, and GFPt2aLuc), mice were born and observed for symptoms suggestive of brains tumors (see below). Upon demonstration of symptoms, the animal was euthanized and tumors dissected with the aid of the fluorescence reporter. Subsequently, gDNA was prepped with the EZNA® Tissue DNA Kit (Omega Bio-tek, D3396), according to manufacturer’s instructions. Samples were prepared in biological and technical replicates (3 ≤ Nbiological ≤ 5; Ntechnical = 3). Additionally, the IUE injection cocktail was used for input, prepared in technical duplicates.
Following gDNA isolation, BC libraries were prepared as previously reported17,18. PCR reactions amplified the BC pools from 50ng gDNA (experimental samples) or 2ng of plasmid pool (input control) using Platinum Super Mix (ThermoFisher, 12532016) with primers targeting the T3 promoter site (directly upstream of the BC) (5’-CAATTAACCCTCACTAAAGG-3’) and the V5 tag (5’-ACCGAGGAGAGGGTTAGGGAT-3’). Amplification parameters were as follows: 1 × [94°C-4’]; 35 × [94°C-1’, 54°C-1’, 68°C-1’]; 1 × [68°C-10’]; 10°C-hold. PCR products were purified with the PureLink PCR Purification Kit (ThermoFisher, K310001), processed using the Ion Plus Library Kit (ThermoFisher, 4471252), subsequently purified, and ligated to unique Ion Xpress Barcode Adaptors (ThermoFisher, 4474517). The resulting Ion Xpress barcoded libraries were amplified, purified, and pooled for PGM sequencing (318 V2 Chip) following the manufacturer’s recommendations. Raw data were concatenated into one ‘reference’ file and indexed using burrows-wheeler alignment tool40 for alignment of BC sequences (with parameters ‘-l7 -t12 -N -n3’) for counting the occurrence of each BC. BC enrichment was assessed by quantitating the number of occurrences for each BC sequence as a ratio to total number of BC reads in each sample. Standard error was calculated across replicates and plotted as error bars on the BC enrichment graphs.
Bioluminescence imaging
150μg D-Luciferin (PerkinElmer, 122799) per gram body weight was delivered through intraperitoneal injection. 10 minutes after injection, bioluminescence signal was acquired for 5 minutes, followed by a 10 second X-ray exposure for skeletal imaging. Bioluminescence scan were initiated at postnatal day 60 and performed every, subsequent 30 days thereafter.
Brain Tumor collection for histology
Unless a time point was specified, tumor bearing mice were observed for symptoms suggestive of tumors including but not limited to lethargy, hunched posture, decreased appetite, decreased grooming, trembling/shaking, squinting eyes, partial limb paralysis, and abnormal gate, denoting the IACUC permitted endpoint. Upon symptom demonstration, mice were humanely euthanized and fixed through intracardial perfusion of 4% paraformaldehyde (PFA) in phosphate buffered saline (PBS). Following perfusion and dissection, the brain was further fixed overnight in fresh 4% PFA solution overnight and then preserved in 70% ethanol for eventual paraffin embedding. For frozen preservation, following perfusion and dissection, brains were sunk in 20% sucrose in PBS overnight and frozen into Tissue-Tek® OCT Compound (Sakura Finetek, 4583) and stored at −80°C until cryostat sectioning.
Histological analysis
For hematoxylin and eosin staining, 10μm paraffin embedded sections were process as follows: 3 × 3 minutes in xylene, 3 × 3 minutes 100% EtOH, 3 × 3 minutes 95% EtOH, 3 minutes 80%EtOH, 5 minute 70% EtOH, 5 minutes ddH2O, 2.5 minutes Harris Hematoxylin (Poly Scientific R&D Corp, S212A), running tap water wash, 30 seconds 95% EtOH, 2.5 minutes Eosin (Poly Scientific R&D Corp, S176), 2 × 2 minute 95% EtOH, 2 × 2 minutes 100% EtOH, and 2 × 2 minutes xylene. Staining was preserved with Permount Mounting Media (Electron Microscope Sciences, 17986–01) under a coverslip. Histological diagnoses of mouse-IUE generated tumors was validated across N ≥ 6 tumors per variant.
For immunohistology, frozen brains were sectioned to 20–40μm thickness. Sections were subject to antigen retrieval (when needed), blocking, and primary antibody incubation overnight at 4°C. The following primary antibodies were used: rat anti-BrdU (BU1/75 (ICR1), 1:200; ABCAM, ab6326), mouse anti-Gephyrin (1:500; Synaptic Systems, 147011), rabbit anti-GFP (1:1000; ThermoFisher, A-11122), goat anti-GPC3 (W-18, 1:100; Santa Cruz Biotechnology, SC-10455), rabbit anti-human HLA A (EP1395Y, 1:100, ABCAM, ab52922), mouse anti-PSD95 (7E3–1B8, 1:500; ThermoFisher, MA1–046), guinea pig anti-vGAT (1:500; Synaptic Systems, 131004), guinea pig anti-vGlut1 (1:2000; Millipore, AB5905). We used species specific secondary antibodies tagged with Alexa Fluor 488, 568, or 647 (1:1000, ThermoFisher) for immunohistofluorescence. Following Hoechst nuclear counter staining (ThermoFisher, H3570, 1:50,000), coverslips were mounted with VECTASHIELD antifade mounting medium (Vector Laboratories, H-1000). DAB (horseradish) peroxidase (HRP) (Vector Laboratories, SK-4100) was used for chemical colorimetric detection following species specific, HRP-conjugated secondary antibody labeling.
To assay in vivo cell proliferation, 4 hour prior to harvesting, 100μg BrdU (in PBS) per gram body mass was delivered through intraperitoneal injection. Mouse brains were collected, frozen, and sectioned as described above. Prior to blocking, sections were incubated in 2N HCl at 37°C for 30 minutes and neutralized with 3.8% Sodium Borate for 10 minutes at room temperature.
Excitatory and inhibitory synapses were quantified with the Synapse Counter plugin for ImageJ36. The images were taken with the Leica SP8 confocal microscope at 0.31μm intervals over a 5μm depth (15 optical sections) across replicates (Ntechnical = 5; Nbiological = 3).
The human tumors tissue arrays (US Biomax, Inc, T175a) contained a spectrum of brain tumors which included high grade gliomas, meningiomas, and T-cell lympohoma. Non-disease brain sections were present in the array as well. Sections were rehydrated similar to paraffin embedded sections above, stained, and dehydrated-preserved similar to our hematoxylin and eosin staining protocol.
Reverse phase protein array (RPPA)
GFP-positive tumor samples were homogenized with lysis buffer (1% Triton X-100, 50mM HEPES, pH 7.4, 150mM NaCl, 1.5mM MgCl2, 1mM EGTA, 100mM NaF, 10mM Na pyrophosphate, 1mM Na3VO4, 10% glycerol, protease inhibitor (Roche 05056489001), and phosphatase inhibitors (Roche, 04906837001) on ice. Cellular debris was removed by centrifugation (4°C, 14,000 rpm, 10 minutes). The lysates were mixed with 4X SDS buffer and diluted to a final protein concentration of 1–1.5 ug/ul. Samples were prepared in biological duplicates (N = 2). Samples were probed with 287 antibodies through the Functional Proteomics RPPA Core Facility at MD Anderson Cancer Center. The full list of tested antibodies, source, and working dilution are available at: https://www.mdanderson.org/research/research-resources/core-facilities/functional-proteomics-rppa-core/antibody-information-and-protocols.html10.
RNA-Seq
Similar to above descriptions, tissue samples were harvested with the aid of fluorescence microscopy from end stage tumors. Total RNA was isolated using the RNeasy Plus Mini Kit (Qiagen, 74134) according to the manufacturer’s protocol. Samples were prepared in biological replicates, N ≥ 3 per variant genotype. RNA integrity (RIN ≥ 8.0) was confirmed using the High Sensitivity RNA Analysis Kit (AATI, DNF-472–0500) on a 12-Capillary Fragment Analyzer. Illumina sequencing libraries with 6-bp single indices were constructed from 1 μg total RNA using the TruSeq Stranded mRNA LT kit (Illumina, RS-122–2101). The resulting library was validated using the Standard Sensitivity NGS Fragment Analysis Kit (AATI, DNF-473–0500) on a 12-Capillary Fragment Analyzer. Equal concentrations (2nM) of libraries were pooled and subjected to sequencing of approximately 20 million reads per sample using the Mid Output v2 kit (Illumina, FC-404–2001) on a Illumina NextSeq550 following the manufacturer’s instructions.
Bioinformatics
Sequencing alignment and transcript abundance estimation (Fragments Per Kilobase Million, or FPKM) was performed using HISAT and Cufflinks. Combat software37 was used to alleviate any potential batch effects due to significant time between sequencing runs. In the downstream RNA-seq analysis, we compared each experimental (variant) group with wild type group and with Cherry control group (two separate comparisons) by contrasts using linear models on log-transformed (base 2) expression values, where all samples are used to estimate the variance of each gene when using the full model (linear model) in design, providing greater statistical power. For each experimental group, genes significant versus both control and WT groups were defined, using p<0.01 and fold change in the same direction for both comparisons. Expression heat maps were generated using JavaTreeView38.
The data discussed in this publication have been deposited in NCBI’s Gene Expression Omnibus and are accessible through GEO Series accession number GSE123519. (https://www.ncbi.nlm.nih.gov/geo/query/acc.cgi?acc=GSE123519).
MRI
Animals were imaged at the Small Animal MR Imaging Core at Baylor College of Medicine using a 9.4 T horizontal bore magnet with a 60 mm inner diameter (ID) microgradient and a 35 mm ID radiofrequency volume resonator (Bruker BioSpin MRI Gmbh, Ettlingen, Germany) once a week starting at 4 weeks of age. Once anesthetized (induction at 3–4% iosflurane, maintenance at 2–3% in 100% oxygen at 3 L/min), mice were placed on an animal bed head first in the prone position and inserted into the bore of the magnet. Normal body temperature was maintained during the imaging sessions. The respiration rate of the animals (typical range, 30–40 breaths/min) was monitored throughout the entire experiment with an abdominal pneumatic pillow (SA Instruments, Inc., Stony Brook, NY).
For in vivo brain imaging of each mouse, three low resolution scans (axial, sagittal and coronal slice orientations) and one high resolution scan (axial orientation) were acquired in succession in a single imaging session. T2-weighted images were obtained using a fast spin echo pulse sequence with excitation and refocusing flip angles of 90 and 180° respectively at a rare factor of 8. In each low-resolution brain scan (TR/TE = 2500/33 ms), 10–12 slices per brain volume were scanned in a field of view (FOV) of 4.0 × 4.0 cm2, with a matrix size of 256 × 256 pixels yielding a spatial resolution of 0.156 × 0.156 mm2 with a slice thickness of 1.0 mm and an interslice distance of 1.5 mm, taking two averages per slice with a scan time per brain volume of 2 min 40s. Each high-resolution brain scan (TR/TE = 2500/36 ms) was taken with 14–18 slices per brain volume, scanned in a field of view (FOV) of 3.5 × 3.5 cm2, with a matrix size of 384 × 384 pixels yielding a spatial resolution of 0.091 × 0.091 mm2 with a slice thickness of 0.75mm and interslice distance of 1.0mm, taking 10 averages per slice with a scan time per brain volume of 8 min.
Relative tumor area was calculated as the product of the height and width of the tumor along the dorsal-ventral and medial-lateral axis, respectively. The plane (along the rostral-caudal axis) which contained the largest tumor section at the last scan was used for analysis.
In vivo video-electroencephalography (EEG) recording
Similar to previous descriptions15, IUE mice at 3 weeks of age were anesthetized by isoflurane vaporization pump (induction at 3–4%, maintenance at 2–3% in 100% oxygen at 1 L/min) and surgically implanted with a bilateral silver wire electrode (0.005-inch diameter) attached to a microminiature connector. Electrodes were placed in the left and right, frontal and parietal regions. EEG and behavioral activity in freely moving mice were analyzed using simultaneous video-EEG monitoring (Haramonie software version 6.1c, Stellate systems). All EEG signals were filtered using a 60-Hz notch filter, 0.3-Hz high-pass filter and 70-Hz low-pass filter. Mice EEG monitoring was initiated at 30 days of age and continued at 5 or 10 day intervals a 24 hour period per recording session. Seizure activity was quantified by visual inspection of the EEG waveform and corresponding video-recorded behavior. The frequency of interictal spike activity was calculated from EEG waveform data of each 24 hour recording period using Matlab scripts. At least N = 4 mice were analyzed for each condition.
Astrocyte-neuron co-culture and immunocytochemistry
Cortical astrocyte cultures were prepared from P1-P3 newborn wild-type mice. The cortex was dissected, removing the meninges, and coarsely chopped with surgical scissors, followed by enzymatic dissociation of Papain supplemented with DNase I (Worthington Biochemical Corporation, LK003150) at 37°C for 15 minutes. Enzymatic dissociation was neutralized with 10% fetal bovine serum (FBS; ThermoFisher, 16000044) supplemented DMEM/F12 (ThermoFisher, 11320033). After two centrifugation and PBS washes, cells were suspended in astrocyte culture media (DMEM/F12, 10% FBS, 1% P/S; ThermoFisher, 15140122), filtered through a cell strainer, and plated onto poly-D-Lysine coated T75 flask. Once confluent, flasks were mechanically agitated to enrich for astrocytes.
Astrocytes were virally infected selected through antibiotics. After selection, ~8×10⁴ astrocytes were seeded on poly-D-Lysine coated 12mm coverslip in a 24 wells culture dish. ~24 hours later, ~ 6×10⁴ of cortical neurons were seeded on the top of the astrocytes and maintained in neuronal culture media (Neurobasal medium (ThermoFisher, 21103049) supplemented with B27 (ThermoFisher, 17504044), Gentamicin (ThermoFisher, 15750060), and GlutaMAX (ThermoFisher, 35050061)).
For immunocytochemistry, similar to previous descriptions15, co-cultures were washed and fixed with 4% PFA for 15 minutes, then rinsed with PBS, blocked, and stained with primary antibodies overnight at 4 °C. The following antibodies were used: chicken anti-MAP2 (1:1,000; EnCor Biotech. Inc., CPCA-MAP2), rabbit anti-synapsin-I (1:1,000; Millipore, AB1543) and mouse anti-PSD95 (K28/43, 1:1,000; UC Davis/NIH NeuroMab Facility, 75–028). Similar to the above immunohistochemistry, species specific Alexa Fluor 488 or 568 were used for secondary antibodies, followed by nuclear counter staining, and coverslip mounting.
Electrophysiology
Whole-cell recordings were performed on neurons co-cultured with astrocytes (after viral infection and selection) in parallel at DIV 7 (days in vitro) and DIV 14, similar to previous description15. Neurons were recorded in a chamber with continuous flow of external solution at a fixed flow rate controlled by a flow valve. For each recording, data were filtered with a 60-Hz notch filter and analyzed with template-based event detection algorithms in Clampfit 10.6 (Molecular Devices).
Standard artificial cerebral spinal fluid (ACSF) (140mM NaCl, 2.4mM KCl, 10mM HEPES, 10mM glucose, 4mM MgCl2, 2mM CaCl2; pH 7.3; osmolarity ~300 mOsm) was used as the external solution. The internal solution contained 136mM KCl, 17.8mM HEPES, 1mM EGTA, 0.6mM MgCl2, 4mM ATP, 0.3mM GTP, 12mM creatine phosphate, and 50 units per ml phosphocreatine kinase. The recording pipettes used in the experiment had a resistance of 3–6MΩ. Antagonists (3mM kynurenic acid and 20μM bicuculline) were applied sequentially with 3 min of washing in between. All the chemicals used were purchased from Sigma-Aldrich.
To determine the glutamatergic or GABAergic identities of the spontaneous activities recorded, the spontaneous synaptic potential was first recorded for 2 minutes for baseline activities, as well as activities under the treatment of 3mM kynurenic acid and 20μM bicuculline (2 minutes for each treatment with 3 minutes of no treatment in between application of the two antagonists). An event with a rise time ~0.5msec and decay time <20msec were considered to be a glutamatergic event, whereas an event with a rise time ~0.5msec and decay time >20msec were considered to be a GABAergic response.
For the GPC3 condition media study, as previously described29 COS-7 cells (ATCC, CRL-1651) cultured in neuronal culture media (see above) were transfected with PBCAG-GPC3 (PBCAG-GFP as control) using Lipofectamine 2000 Transfection Reagent (ThermoFisher, 11668019) according to manufacturer’s instructions. The condition medias were collected and concentrated with Spin-X UF concentrator columns (Corning, CLS431482). After protein concentration was quantified by a standard Bradfor assay, the protein was diluted into neuronal culture media to 80μg per ml. This media was added onto cortical neuron cultures DIV 1. Whole-cell recordings and immunocytochemistry were done DIV 9. Whole-cell recordings were done with any antagonists to measure total spontaneous postsynaptic potential. Neurons co-cultured onto wild-type primary astrocytes were used as a positive control.
Patient Derived Xenograft Model
Patient-derived primary GBM cell lines were maintained in neurosphere media (DMEM/F12 (ThermoFisher, 11320082), supplemented with B27 (1X, ThermoFisher, 17504001), bFGF (20ng/mL, Peprotech, 100–18B), and EGF (20ng/mL, Peprotech, 100–47)). Cells were lentivirally infected with different PIK3CA mutants (or a mCherry control reporter). After 48 hours infection, cells were selected for by puromycin (1μg/mL, ThermoFisher, A1113803). 50,000 live cells were stereotaxically transplanted into the brains of 6 week old male ICR-SCID (Taconic, ICRSC-M) mouse brains (from bregma, cells were injected 1.0mm lateral, 2.0mm caudal, 2.5mm ventral). Similar to previously described approaches39, a week after transplant, EEG recording electrodes were implanted and recorded from once a week for the subsequent 4 weeks.
Statistical analyses
Log-rank was used to compare survival differences across groups for Kaplan-Meier survival analysis. These values are listed in supplement. One-way ANOVA was used to compare BrdU proliferation (across technical replicates), MRI tumor growth, EEG spike quantification, and synapse quantification differences between group means, followed by Tukey’s test to compare individual means. Independent t-test was used to compare differences across groups for EPSC and IPSC frequency and amplitude quantifications. Significant differences are reported as black asterisks in associated graphs. Absence of asterisks denotes no significant difference unless otherwise stated. Data distribution was assumed to be normal, but this was not formally tested. Randomization of animal studies was used in the data analysis. No data points were excluded from analyses. Animal were excluded from analyses if they did not demonstrate reporter (GFP) activity after IUE, signifying unsuccessful electroporation.
Data Availability
RNA sequencing of PIK3CA variant driven tumors is available on Gene Expression Omnibus (GEO) under accession GSE123519. All other data in this article are available from the corresponding author upon reasonable request.
Extended Data
Extended Data Figure 1. Differential tumor growth across PIK3CA variants tumors.
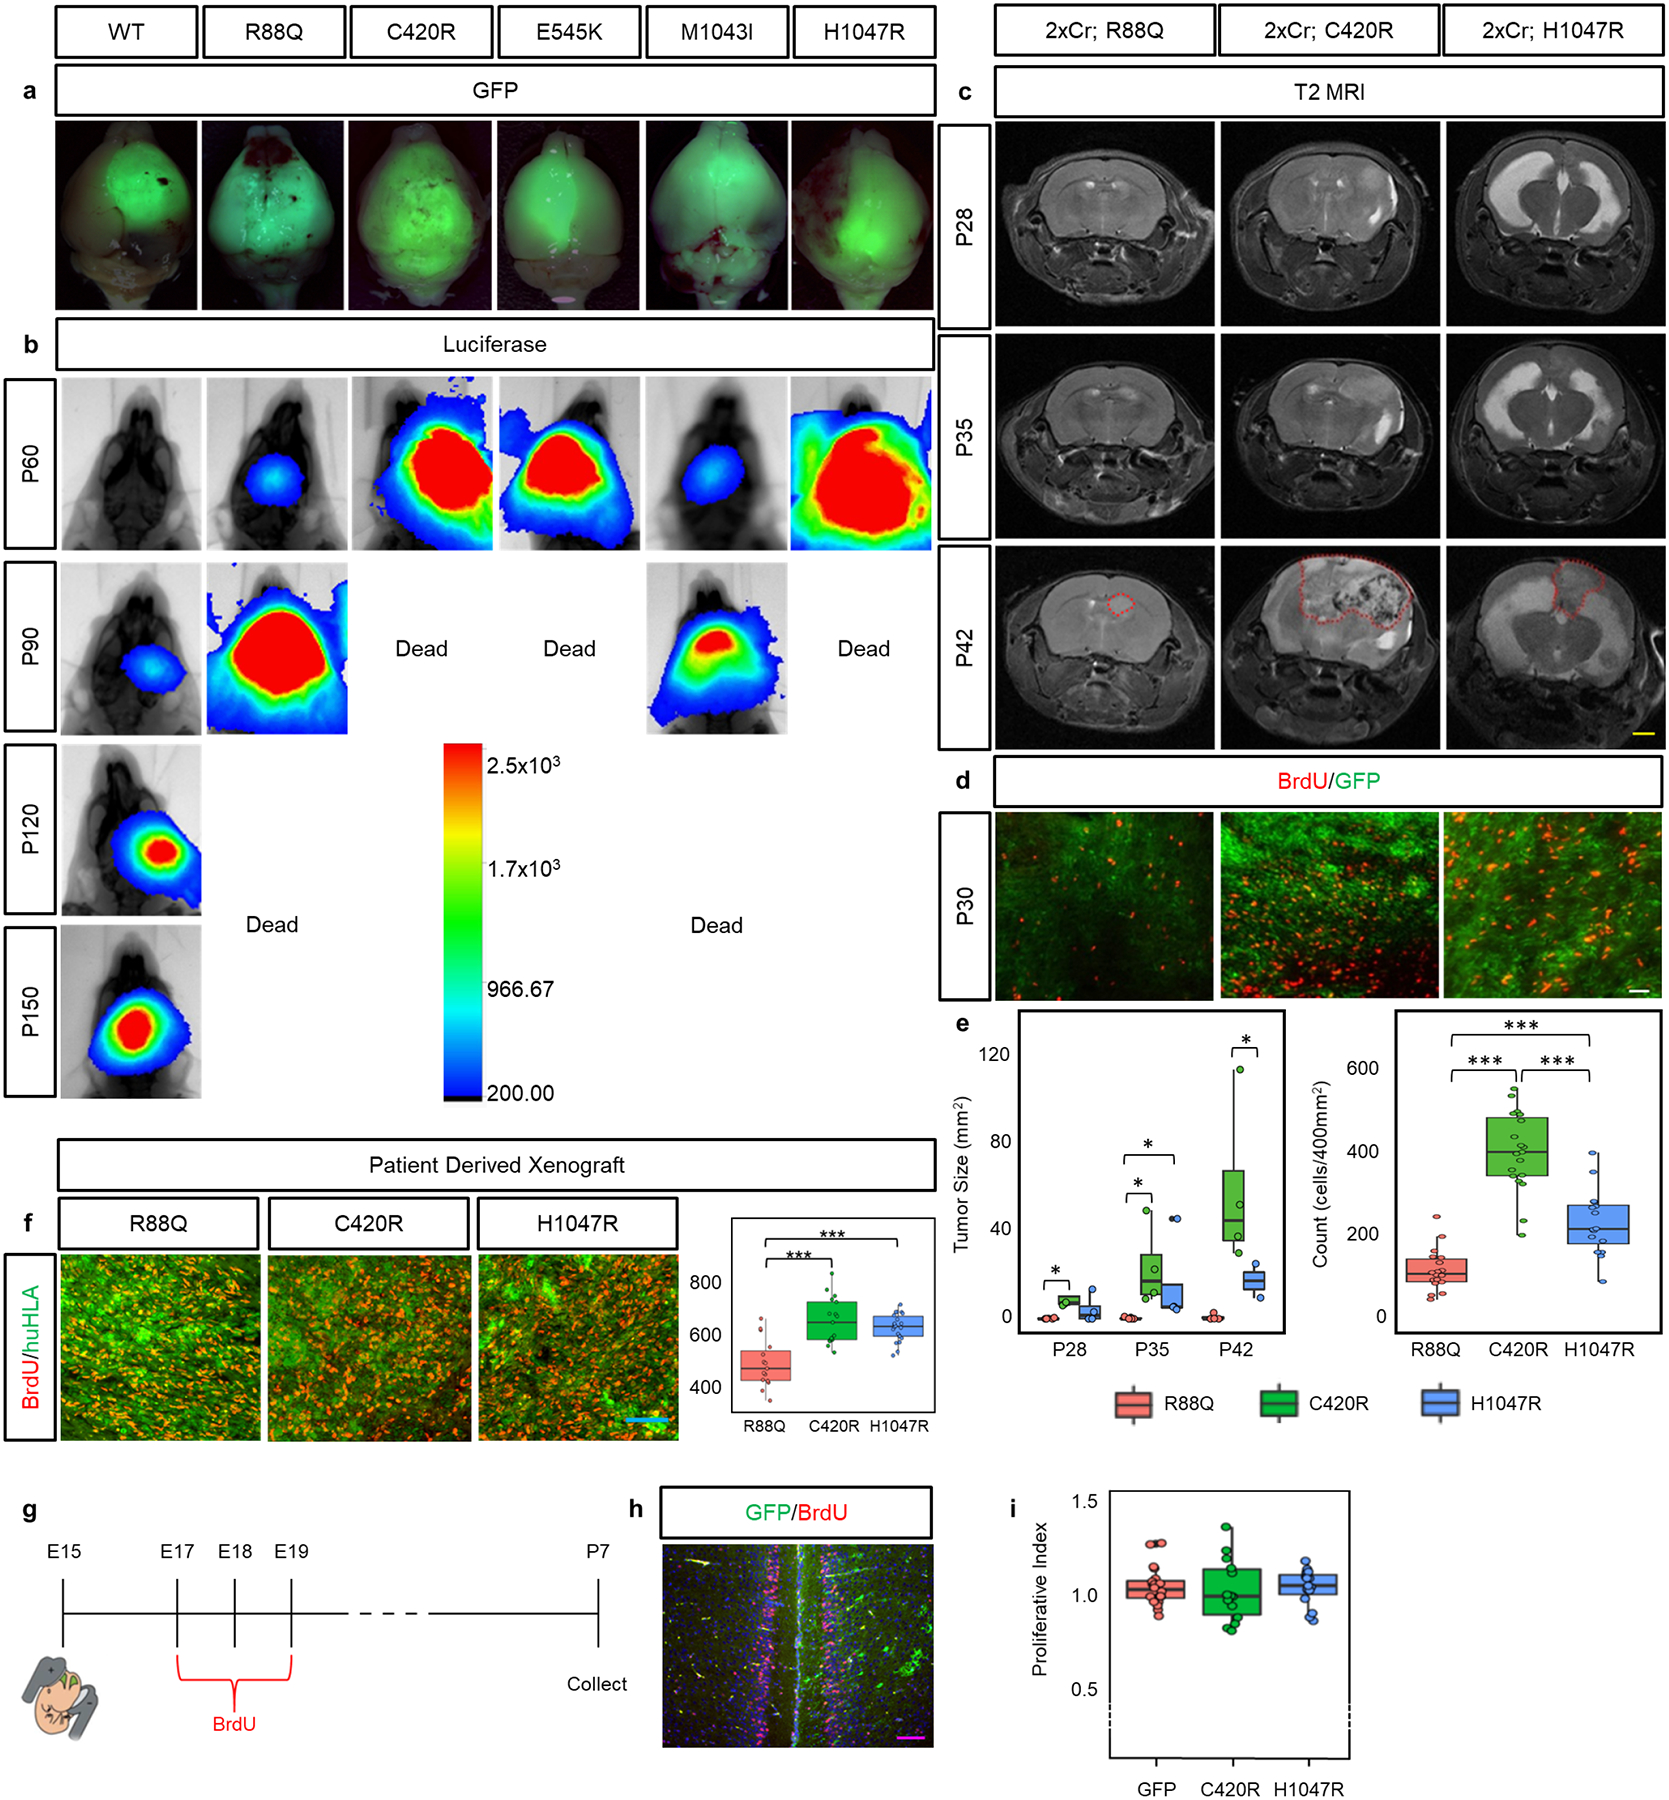
a) Whole brain GFP fluorescence image overlaid atop a brightfield image representing characteristic tumors at time of death. b) Representative bioluminescence intensity images taken at one month intervals starting at 2 months of age, reflective of median survival trend. Scale bar for bioluminescence intensity quantifying photon counts over the 5 minutes of IVIS recording. Experiments were independently repeated 3 times with similar results for each variant. c) Longitudinal T2 MRI of variant tumors. Reading were started at 4 weeks of age and taken at 1 week intervals. All images are spatially match along the rostral-caudal axis. Red dotted outline at P42 denotes tumor boundary. Yellow scale bar = 2.5mm. N = 4 mice for each variant. These experiments were not independently repeated. d) BrdU antibody staining on 30 day old mouse brains. White scale bar = 40μm. N = 4 mice for each variant. Ntechnical-R88Q = 18; Ntechnical-C420R = 19; Ntechnical-H1047R = 16. e) Associated quantification for relative tumor area from MRI analysis and BrdU incorporation. Plots are centered on mean, boxing the interquartile range (25th-75th percentiles), with whiskers extending to 1.5 times the interquartile range above and below. p-values: * p<.05; *** p<.001; calculated by One-way ANOVA. f) Immunohistofluorescence analysis for BrdU incorporation (red) on PDX tumor sections. Human tissue was identified through staining for human HLA (green). Blue scale bar = 100μm. Accompanying quantifications of BrdU incorporation in a 2000μm2 area. Nbiological = 4 mice; Ntechnical = 5 repeats. Plots are centered on mean, boxing the interquartile range (25th-75th percentiles), with whiskers extending to 1.5 times the interquartile range above and below. p-values: *** p<.001; calculated by One-way ANOVA. g) Schematic illustrating experimental approach and timeline. h) Representative image of control GFP IUE. Proliferative index was calculated by dividing the number of BrdU+ cells on the electroporated side (marked by GFP) by the number of BrdU+ cells on the non-electroporated, contralateral side. Purple scale bar = 100μm. i) Quantification of proliferative index for activating variants C420R and H1047R along with control (GFP) demonstrating no significant difference in proliferation. Nbiological = 3 mice; Ntechnical = 5 repeats. Plots are centered on mean, boxing the interquartile range (25th-75th percentiles), with whiskers extending to 1.5 times the interquartile range above and below. No significant p-values (<.05) were calculated by One-way ANOVA.
Extended Data Figure 2. In vivo competition assay identified PIK3CA driver variants.
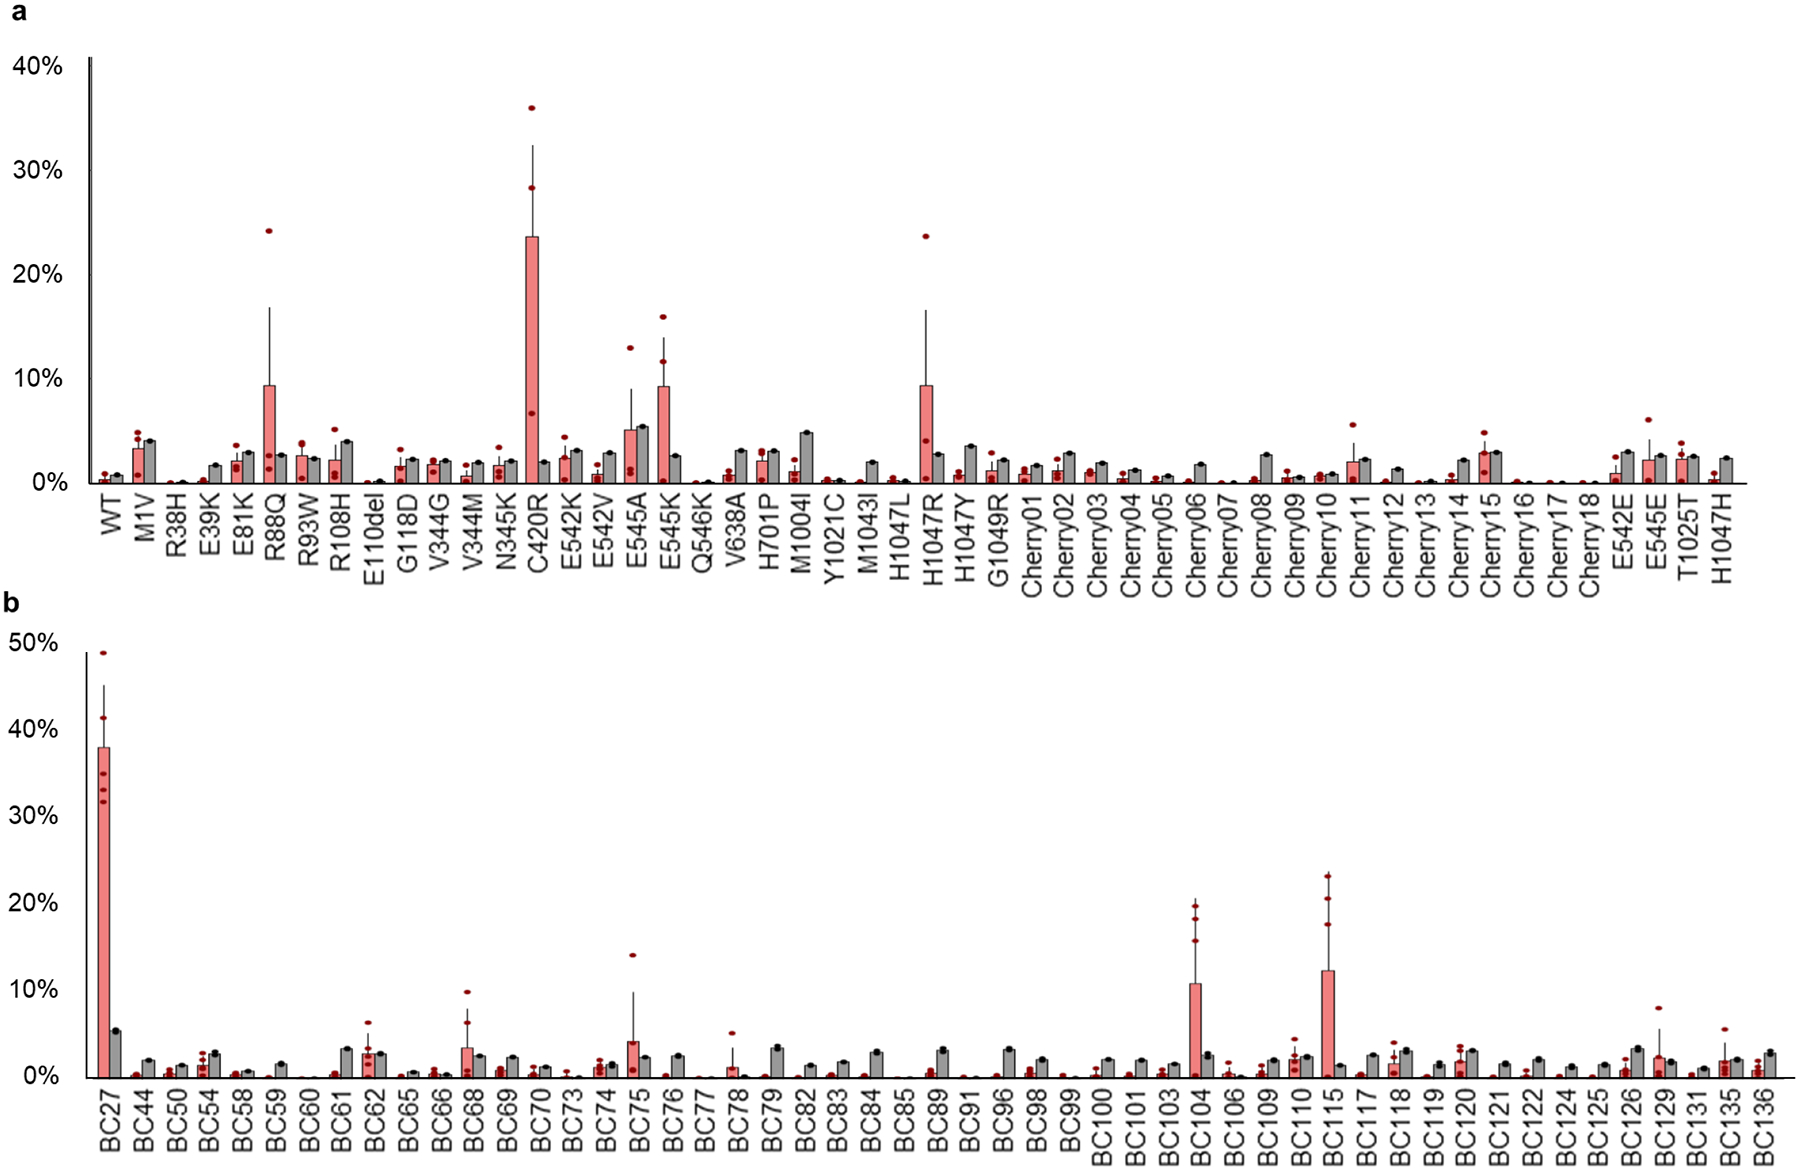
a) Results of next generation barcode sequencing from tumor tissue from 2xCr co-electroporated with all tested alleles pooled together. Pool includes listed variants along with WT, 4 silent mutant, and 18 uniquely barcoded Cherry constructs as controls. N = 3 tumors. Bars are set at average with error bars denoting standard error from mean. b) Barcode sequencing for 2xCr tumors co-electroporated with the H1047R allele (tagged with barcode sequence 27) demonstrated single amplification when diluted with 50 different passenger barcodes (uniquely barcoded Cherry constructs). N = 2 tumors with 2–3 replicates; red bars – tumor samples; gray bars – input; bars are set at average with error bars denoting standard error from mean.
Extended Data Figure 3. PIK3CA variants did not alter tumor histopathology.
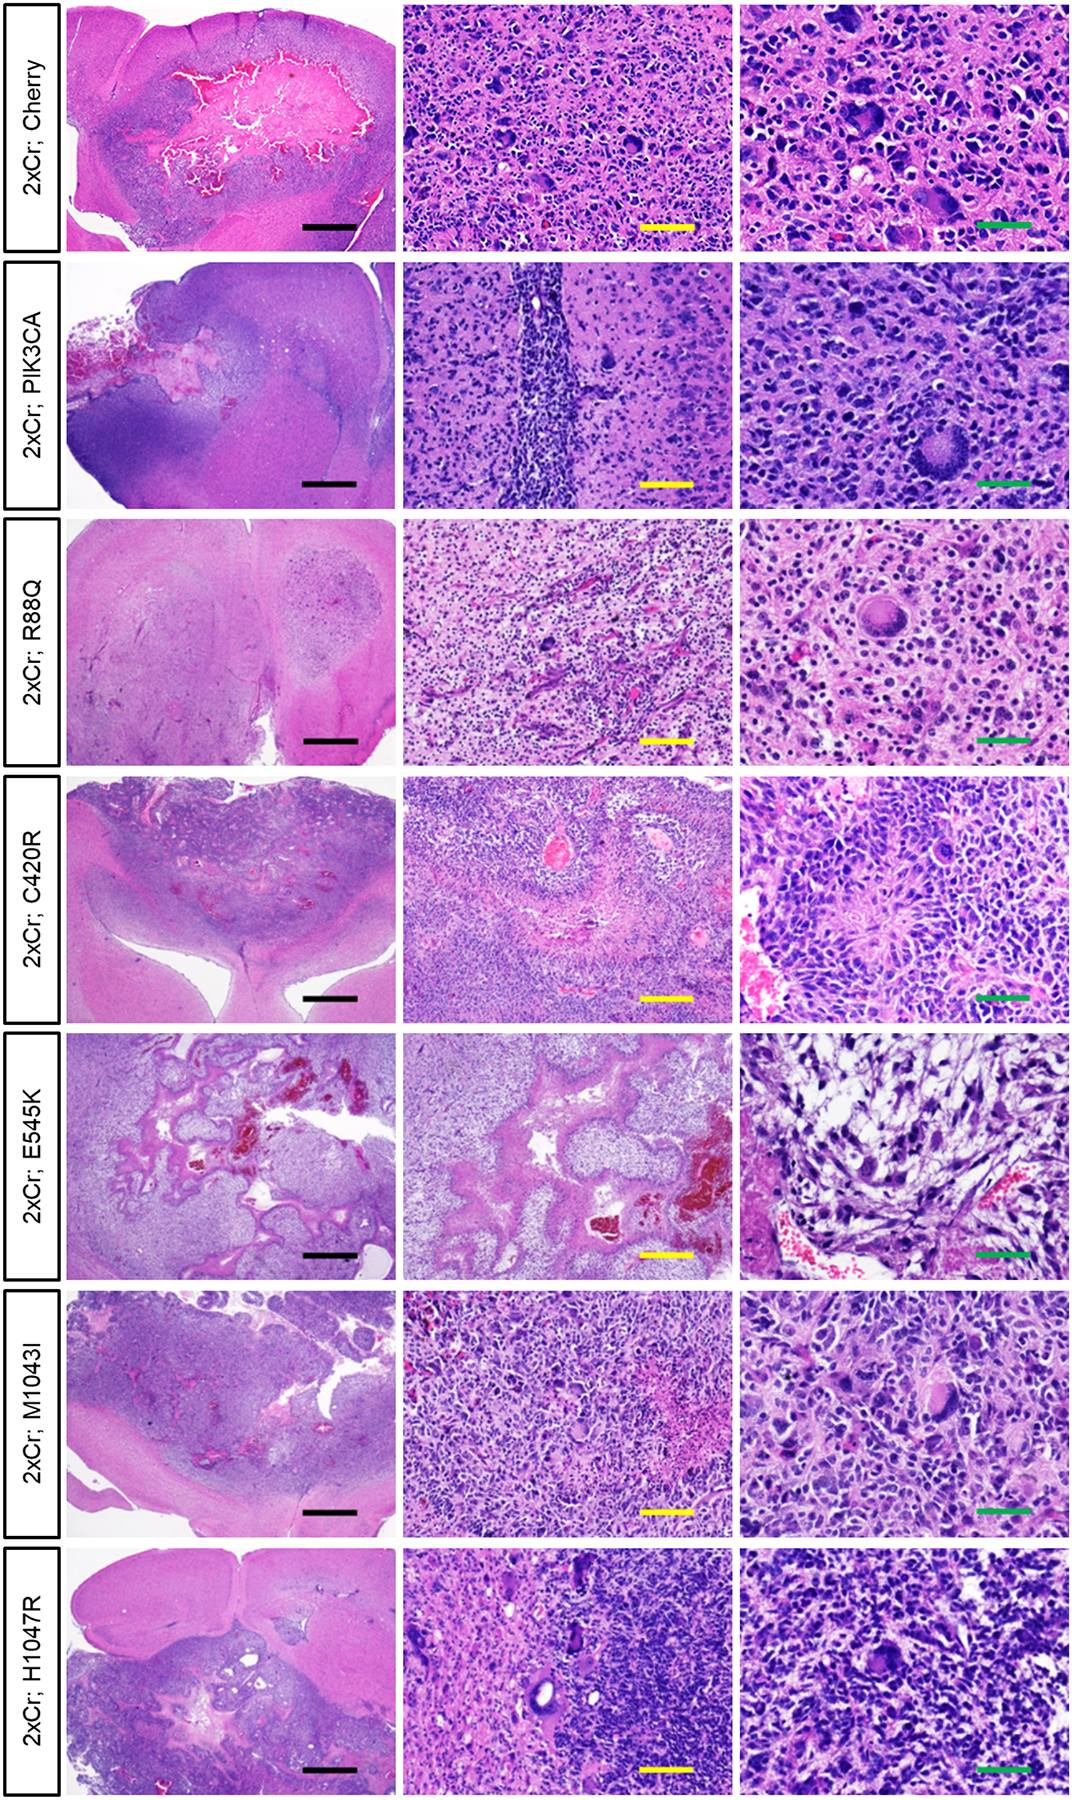
H&E staining of brains containing hypercellular and infiltrative high grade gliomas containing pleomorphic tumor cells. All tumors are histologically graded as high grade glioma, either WHO grade III anaplastic astrocytoma or Grade IV GBM. Black scale bar = 1mm; yellow scale bar = 100μm; green scale bar = 50μm. Representative images of each variant driven tumor are from N = 6 brains.
Extended Data Figure 4. PIK3CA variant differentially promote both tumor-associated and unassociated seizures.
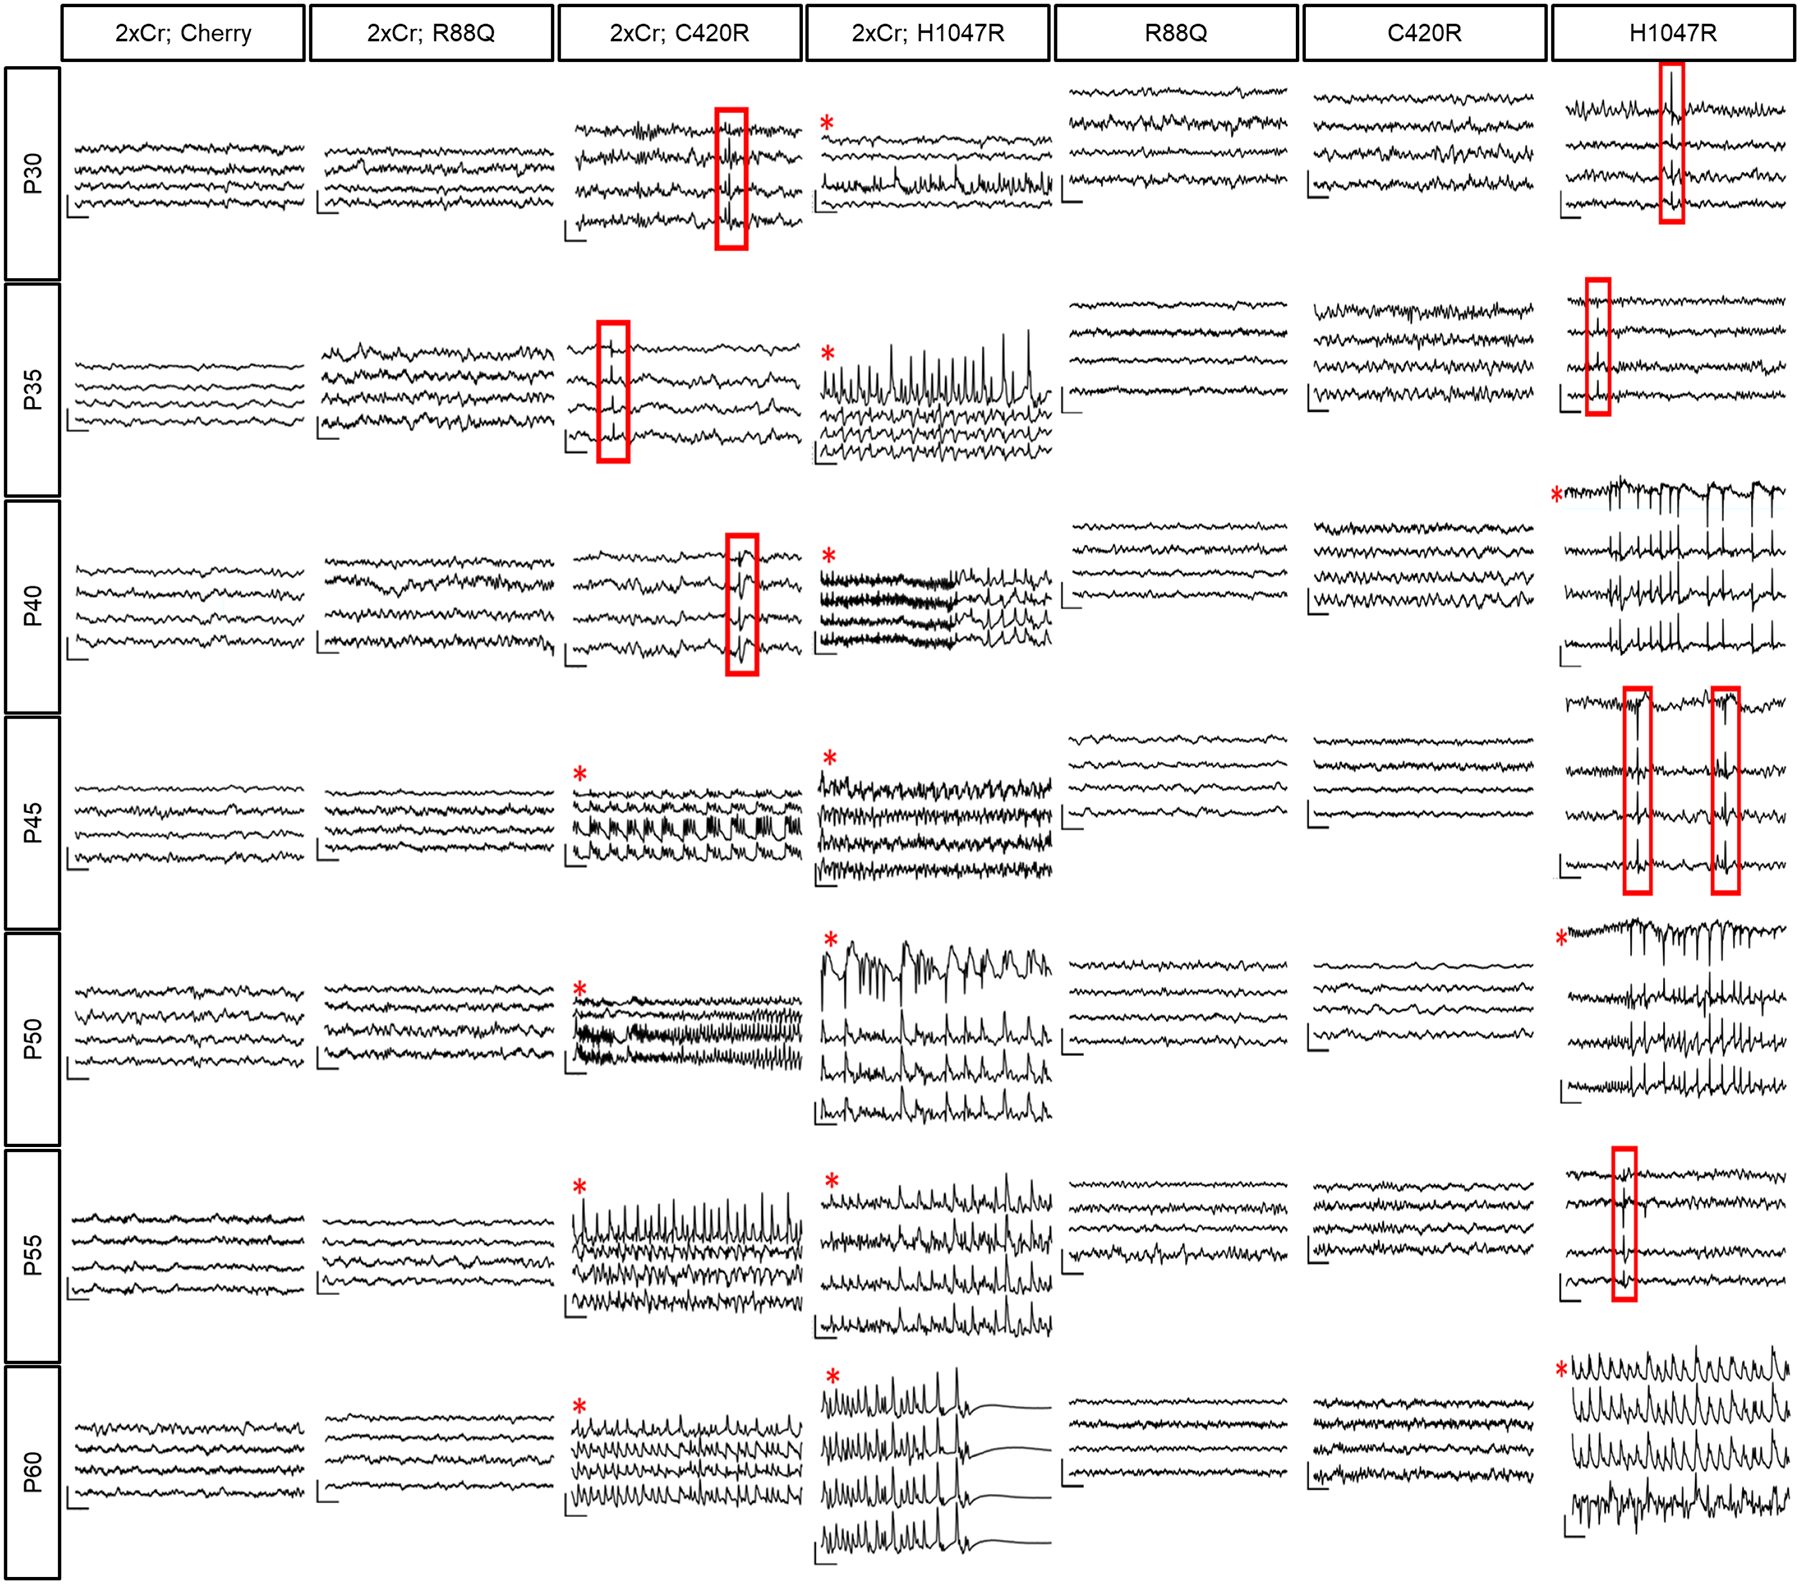
Longitudinal EEG recordings from PIK3CA variant tumor brain (2xCr) and non-tumor brains starting at P30. Red boxes outline inter ictal spike activity. Red asterisks signify generalized seizures confirmed with simultaneous video. Traces plot from top to bottom are recordings from the LF, LP, RF, and RP brain regions. Traces are representative of 4 mice per variant. Vertical scale bar = 300μV; horizontal scale bar = .5sec.
Extended Data Figure 5. PIK3CA variants differentially alter the local synaptic constituency at the peritumoral margins.
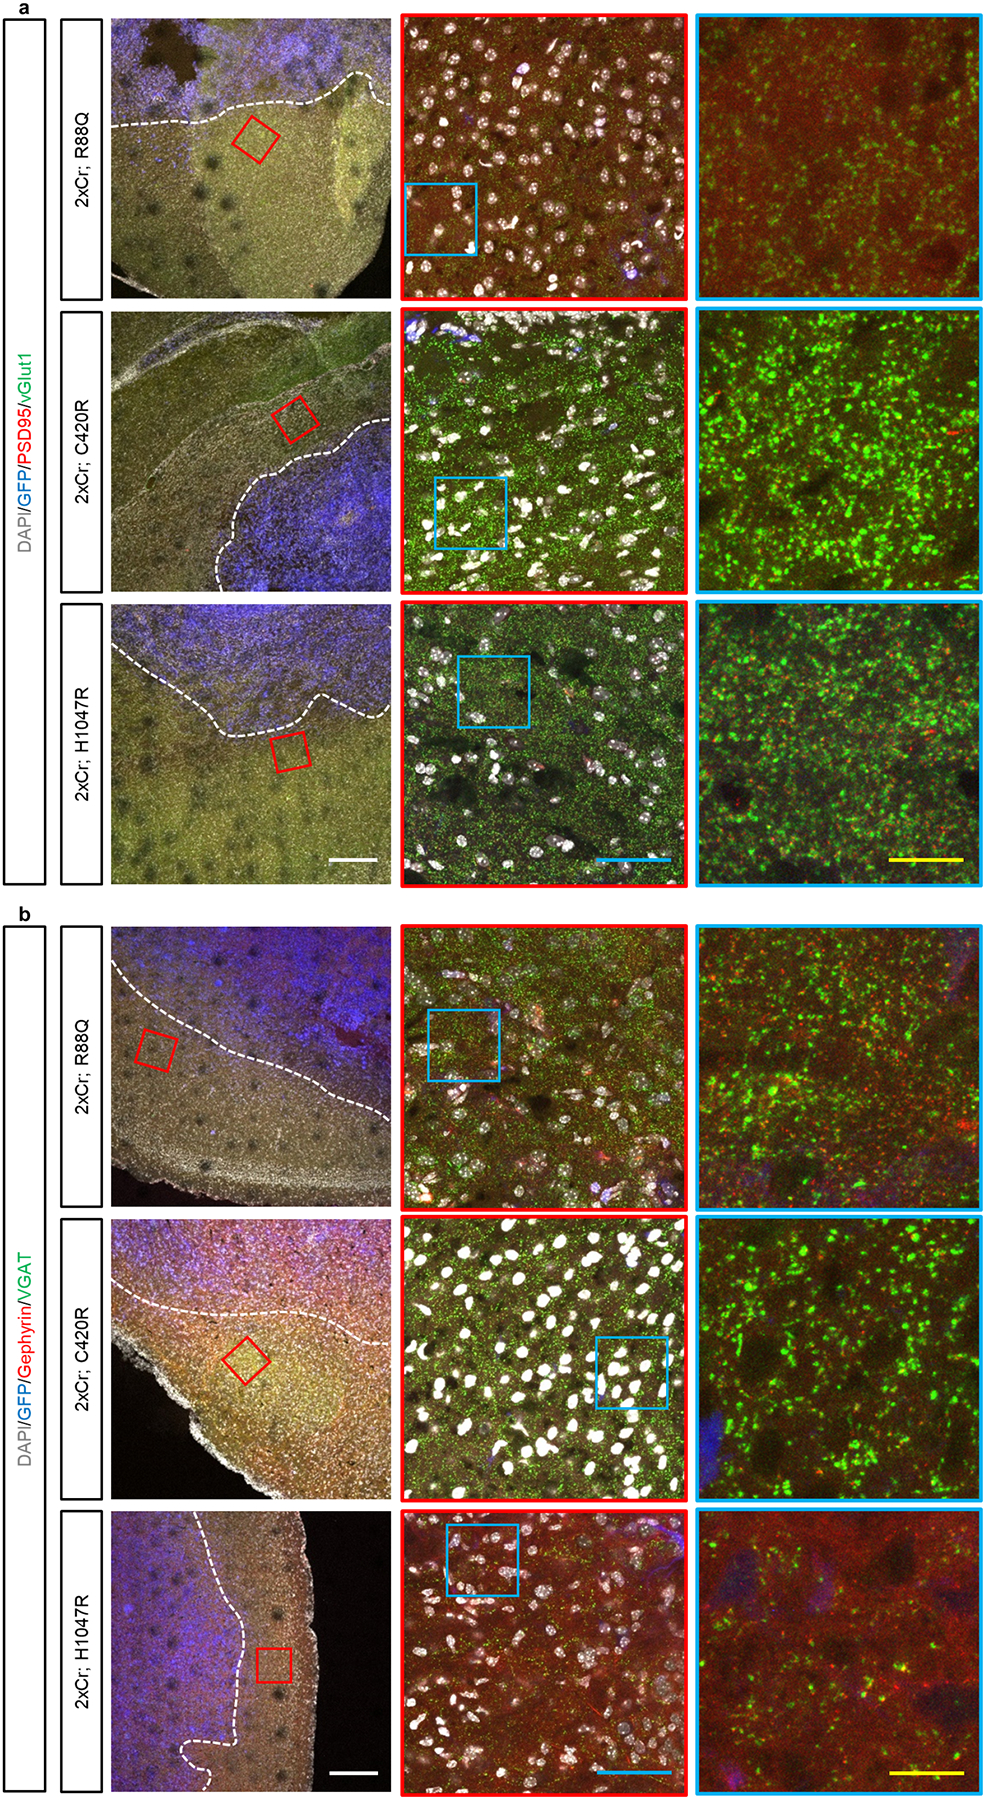
Immunohistofluorescence analysis of tumor brains, stained for excitatory (a) and inhibitory (b) synapses by the colocalization of pre- and post-synaptic markers. Analyses was focused within 200μm of the tumor margin (dotted line), as marked by GFP (pseudocolored in blue). Higher magnification images from the red and blue boxes are displayed. White scale bar = 200μm; blue scale bar = 50μm; yellow scale bar = 12.5μm. These experiments were independently repeated 15 times.
Extended Data Figure 6. GPC family member expression across mouse and human GBM models.
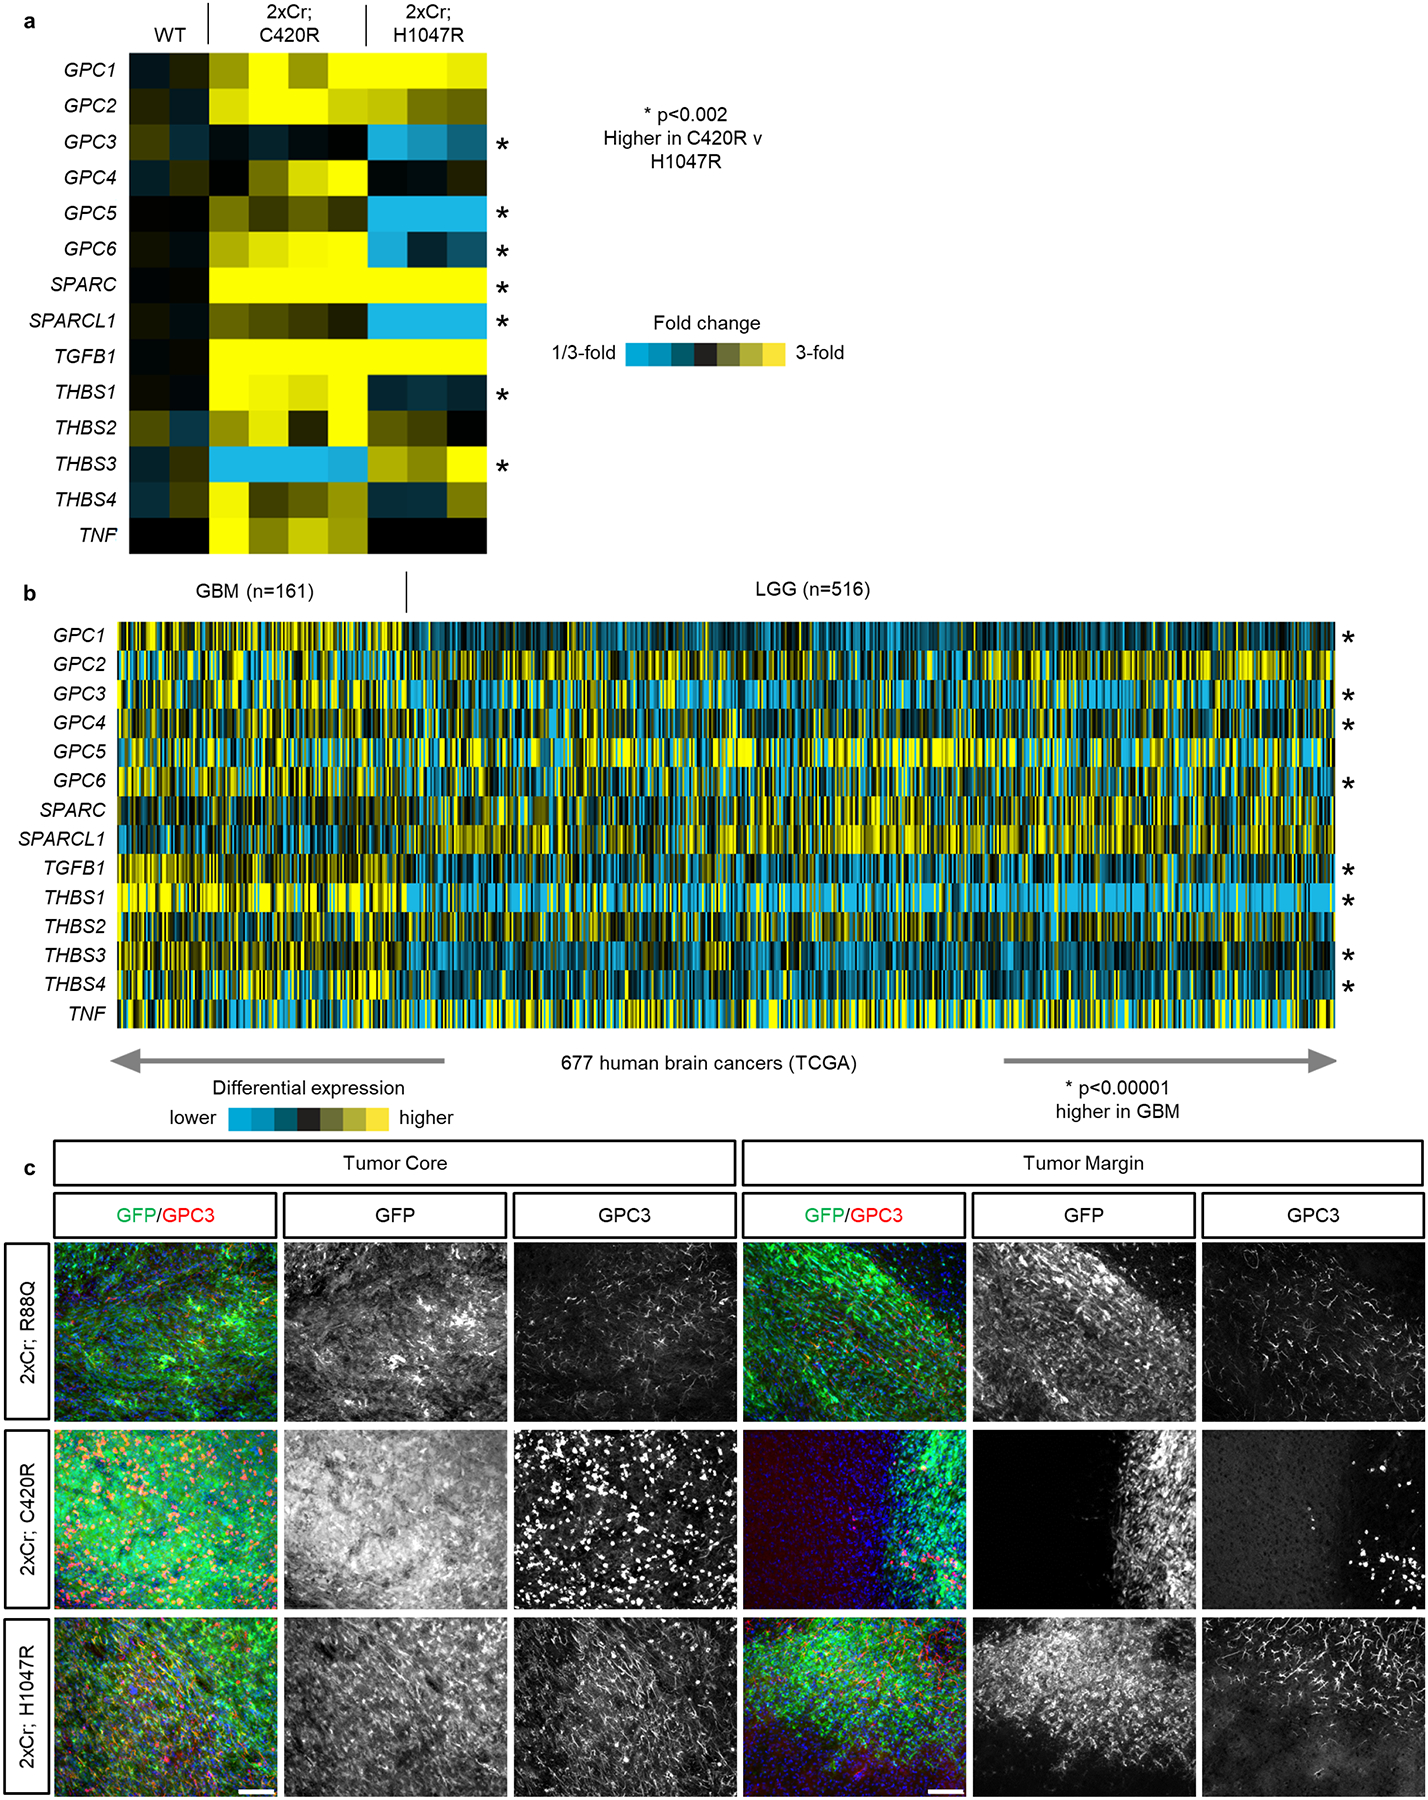
a) RNA-Sequencing analysis for astrocyte-secreted factors that promote synaptogenesis. Each column represents of average of biological replicates. NWT = 2 mice; NC420R = 4 mice; NH1047R = 3. p-values were calculated with a two sided T-test on log-transformed expression values. b) RNA-Sequencing data from the TCGA comparing the same set of gene across GBM and low grade glioma (LGG). Asterisks notes significant difference between GBM and LLG. p-values were calculated with a two sided T-test on log-transformed expression values. c) Immunohistofluorescence analyses of P30 variant tumor brains stained for GPC3 (red) and GPF (green) denoting tumor demonstrating GPC3 staining at tumor core (a) and tumor margin (b). N = 4 mice for each variant. White scale bar = 100μm. These experiments were independently repeated 4 times.
Extended Data Figure 7. Context specific requirement for GPC3 in glioma tumorigenesis.
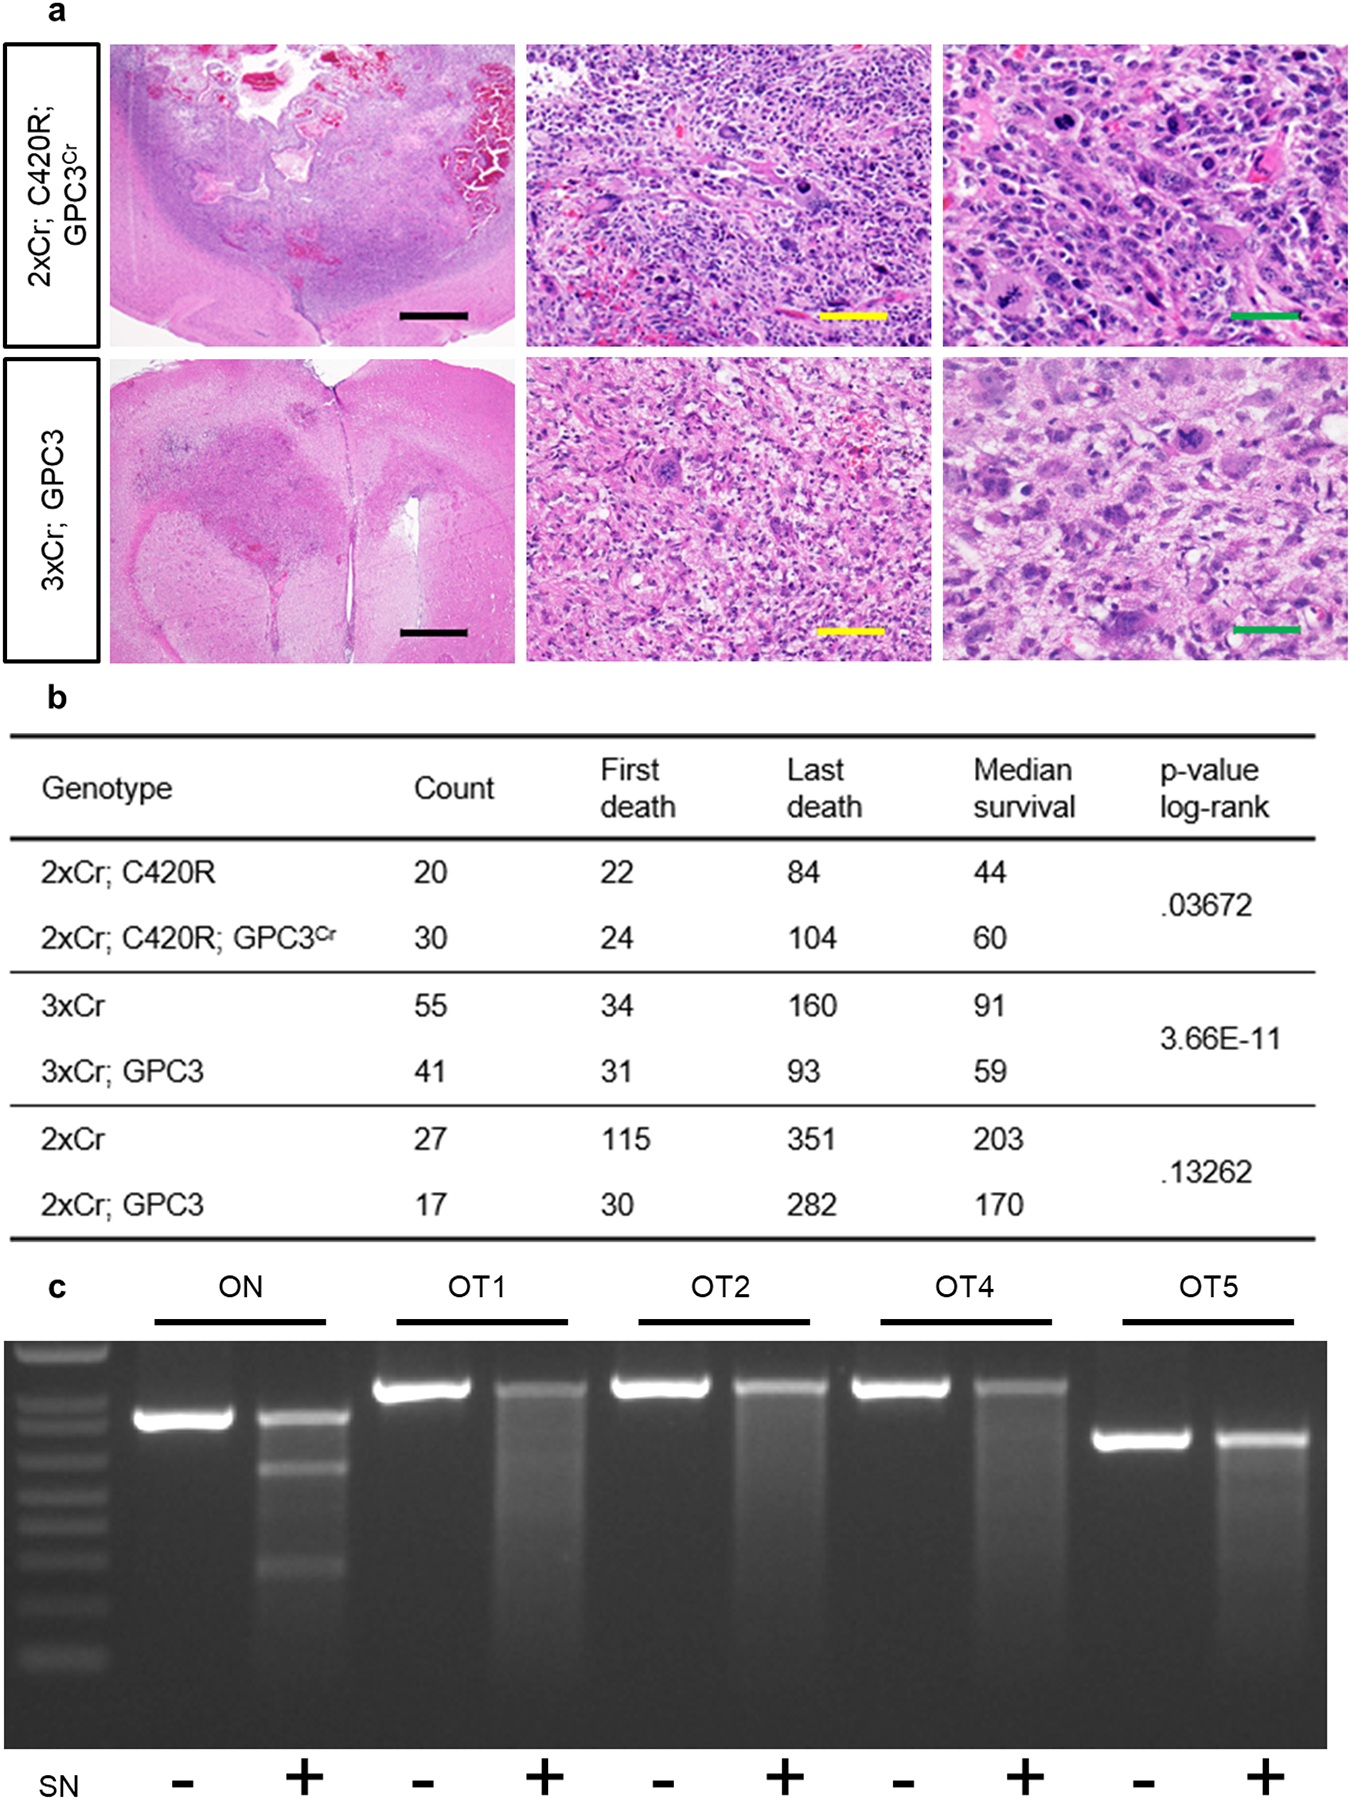
a) H&E staining of 2xCr; C420R; GPC3Cr (top) and 3xCr; GPC3 (bottom) tumor brains histologically graded as high grade glioma, either WHO grade III anaplastic astrocytoma or Grade IV GBM. Black scale bar = 1mm; yellow scale bar = 100μm; green scale bar = 50μm. Representative images of each variant driven tumor are from N = 6 brains. b) Survival statistics for in vivo modeling GPC3 loss and gain in various tumor models. p-values were calculated using the log rank test. c) SURVEYOR assay analysis on genomic DNA from 2xCr; C420R; GPC3Cr tissue. Representative DNA gel electrophoresis of PCR products after SURVEYOR enzyme treatment. After the ladder (1KB Plus, ThermoFisher, 10787018) ranging from 100bp – 1500bp, lanes contain on-target (ON) and top 5 off-target (OT) sites with and without nuclease treatment. OT3 rests in an AT rich region and was not amplifiable. This experiment was independently repeated 3 times with similar results. d) Table lists the on and off target sequences of the GPC3 CRISPR gRNA sequence. Off target sequences denote mismatches (lowercase) or bulges (−). In addition to the genomic location of sites, listed are primer sequences used to amplify target regions. Off target site 3 was not amplifiable because it was an AT-rich region, not amendable to specific primers.
Extended Data Figure 8. GPC3 promotes gliomagenesis and synaptic imbalance.
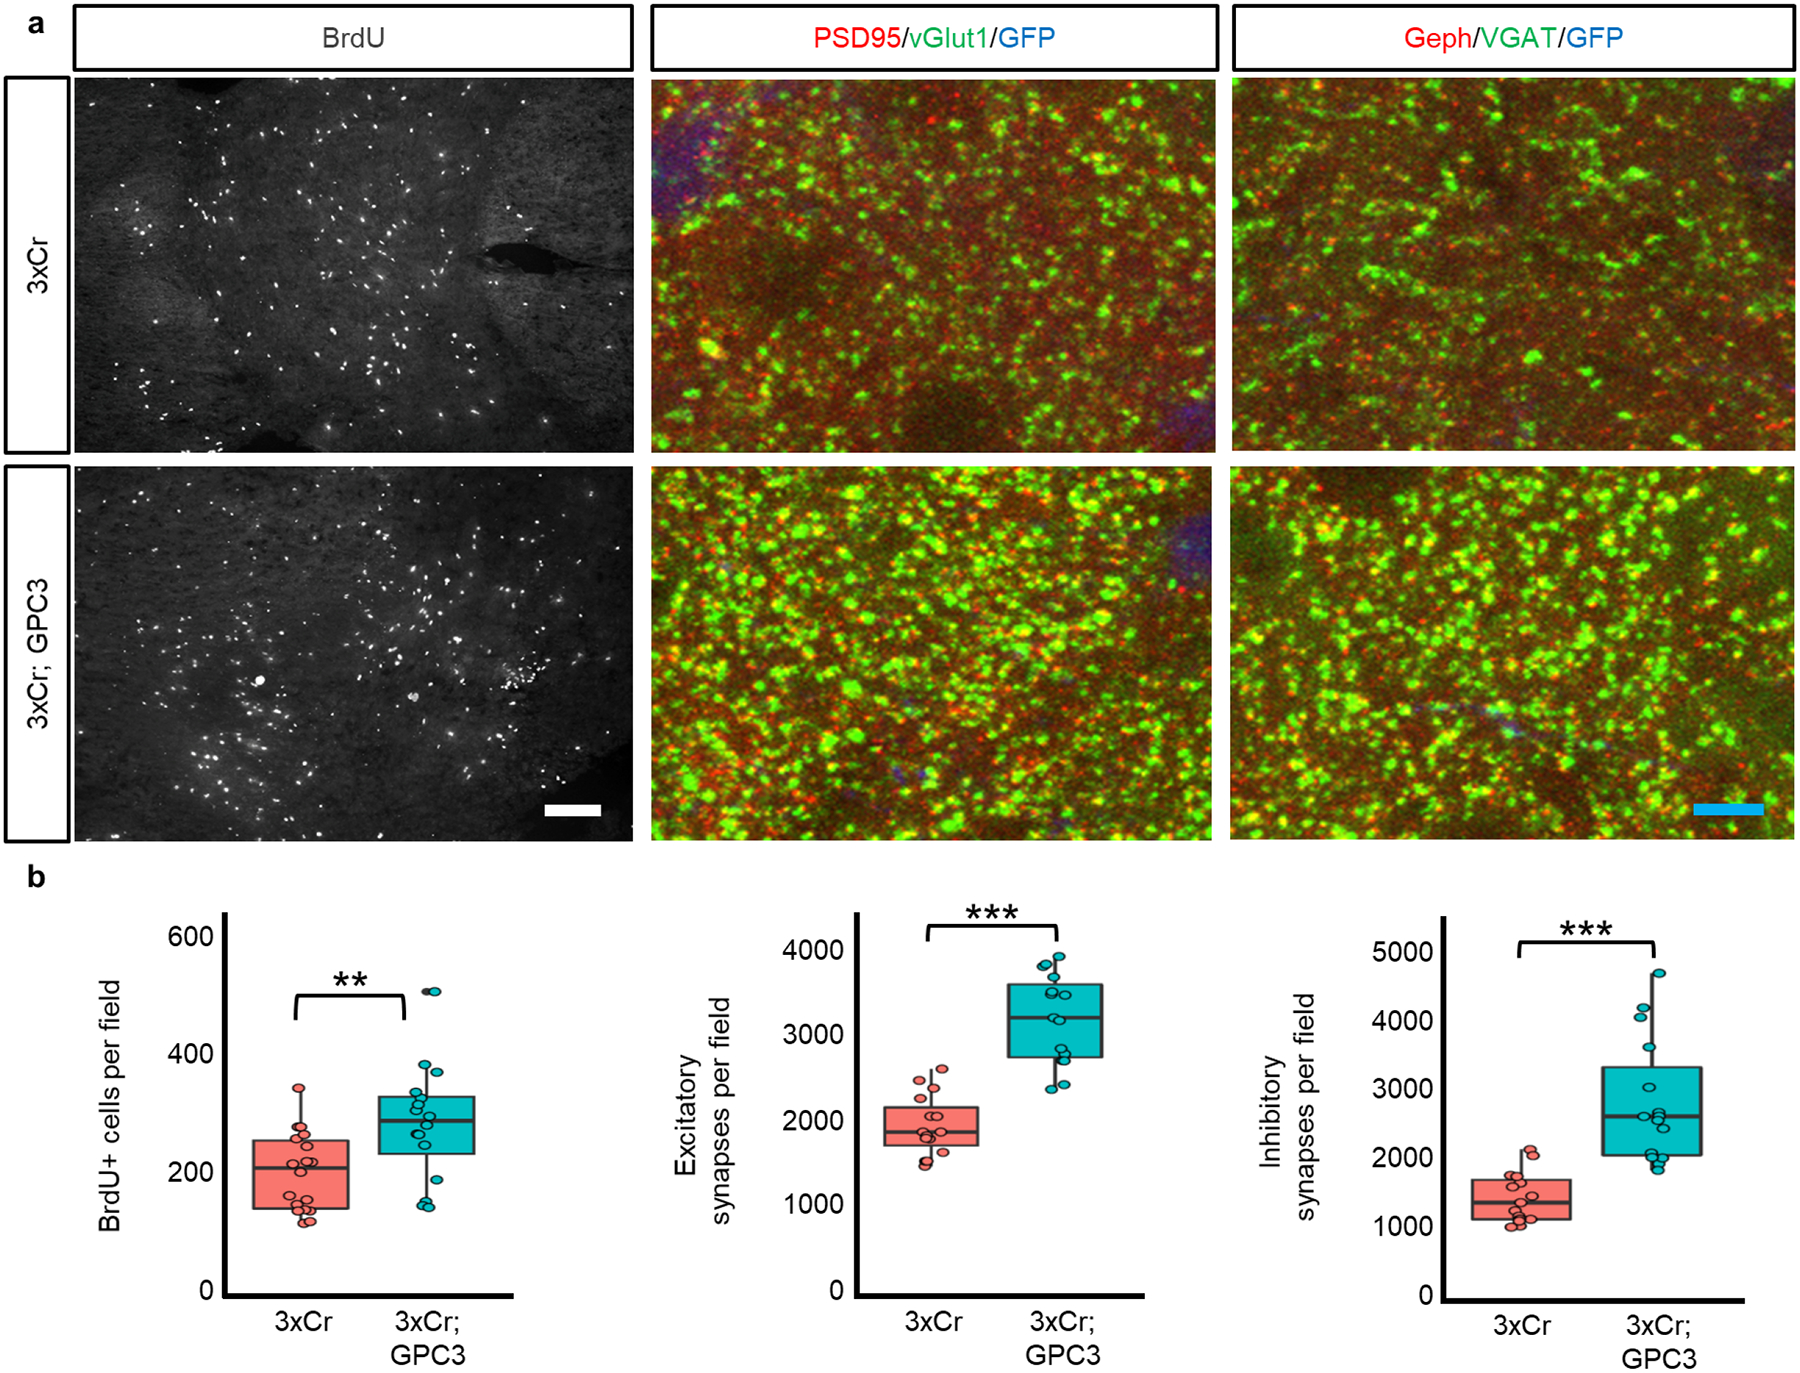
a) Immunohistofluorescence analyses of 3xCr control and GPC3 overexpression tumors for BrdU, excitatory synapses, and inhibitory synapses. White scale bar = 50μm; blue scale bar = 5μm. b) Quantification of immunohistofluorescence analysis. NBrdU = 4 mice of each condition; NtechnicalBrdU-3xCr = 18; NtechnicalBrdU-GPC3 = 16. Nsynapse = 3 mice of each condition. Ntechnical-synapse = 15 for each condition and synapse type. Field for BrdU incorporation = 1600μm2 field; field for synapse analysis = 34,000μm2. Plots are centered on mean, boxing the interquartile range (25th-75th percentiles), with whiskers extending to 1.5 times the interquartile range above and below. p-values:* p<.05; ** p<.01; *** p<.001; calculated by One-way ANOVA.
Extended Data Figure 9. Secreted GPC3 promotes synaptogenesis.
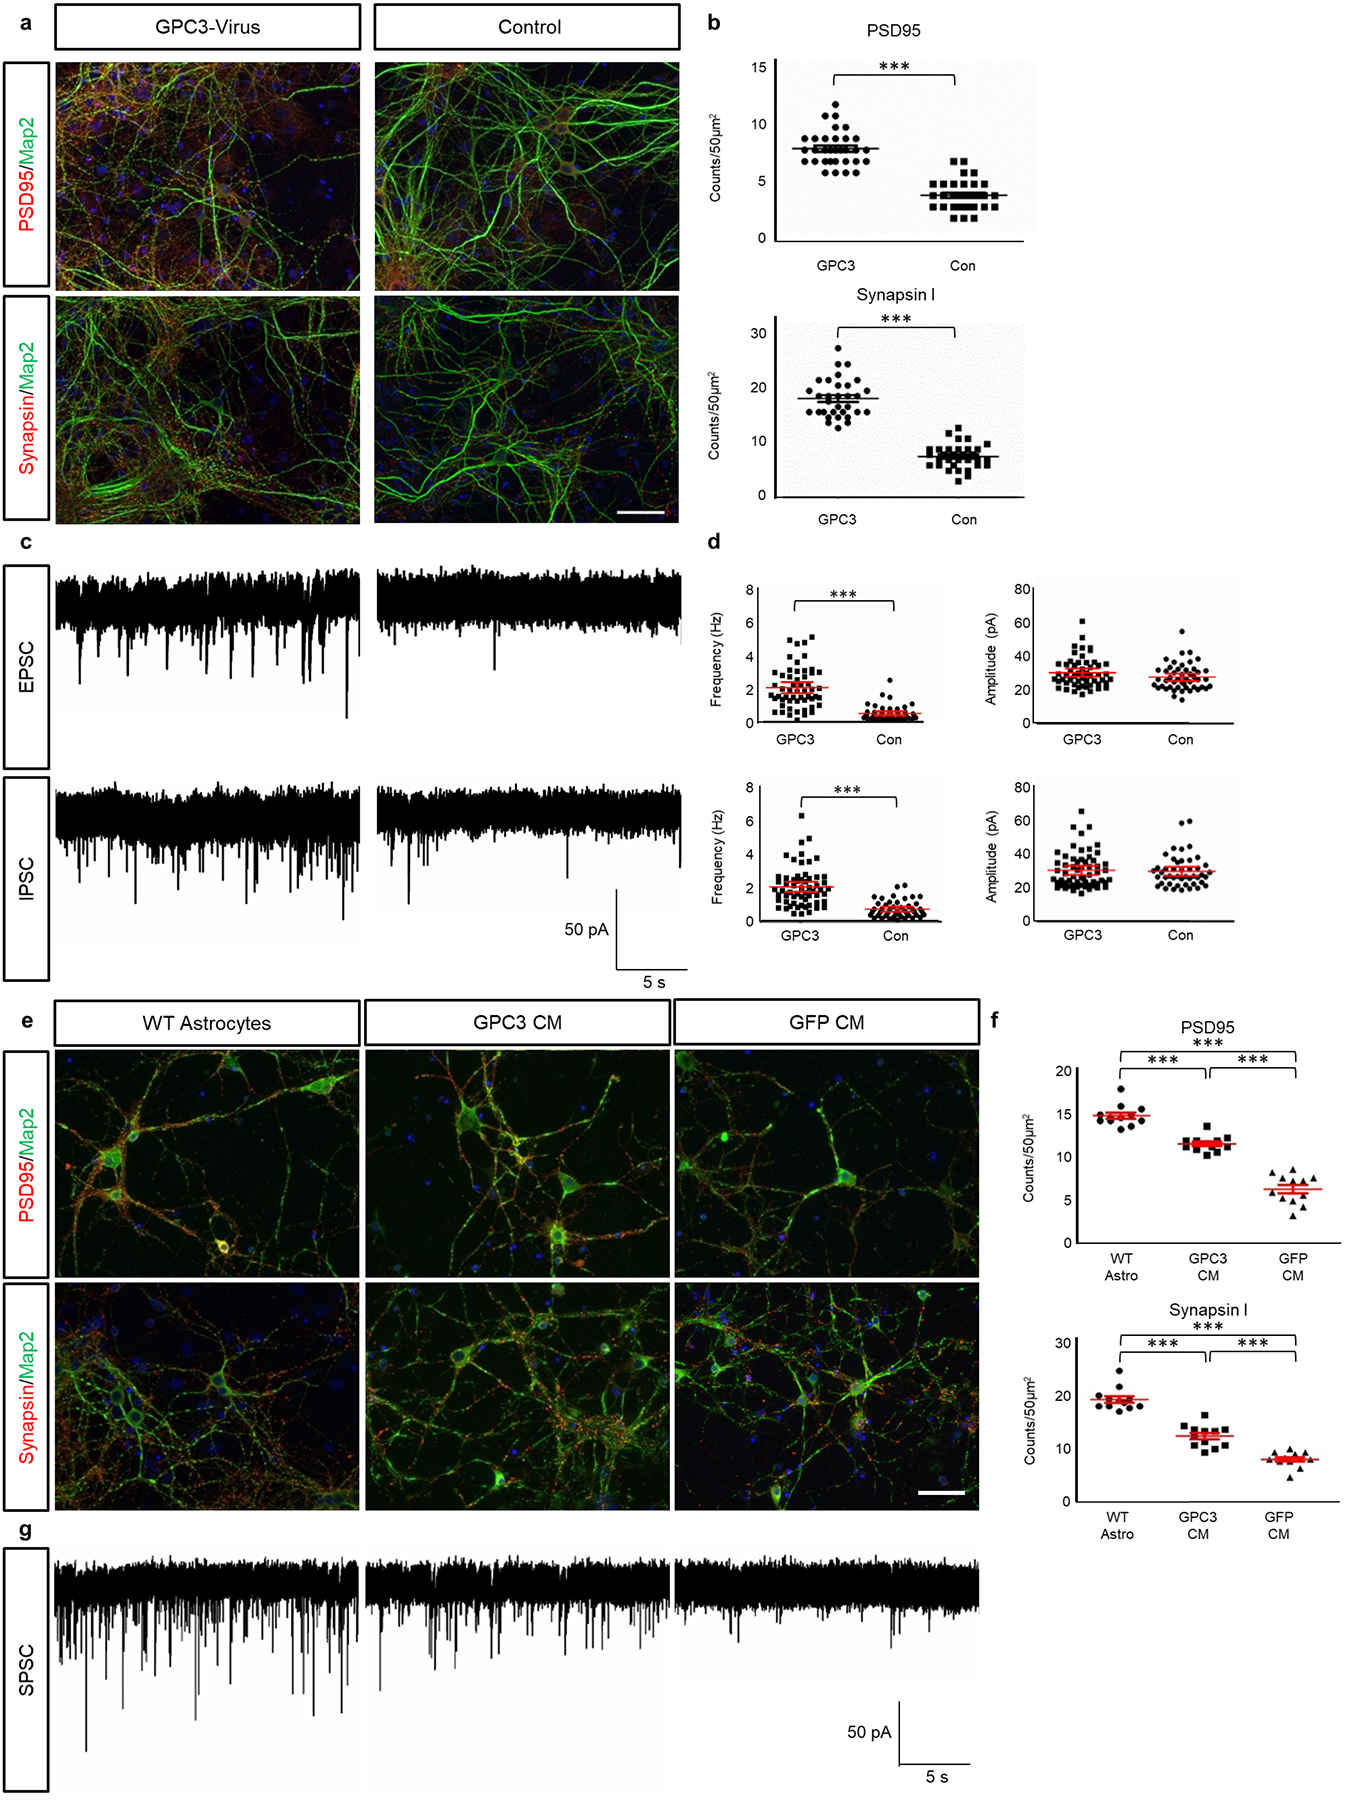
a) Immunocytofluorescence staining for PSD95, Synapsin1, and Map2 of astrocyte-neuron co-cultures (see Fig 3b), with astrocytes overexpressing GPC3 via virus. Non-infected astrocytes were used as control. White scale bar = 50μm. b) Quantification of PSD95 and Synapsin1 staining. Ntechnical = 32 each condition. Error bars denoted standard error from mean. p-values: *** p < .001; calculated by one-tail independent T-test; Tukey’s test was used to compare individual mean. c) Representative traces of from whole-cell recording of neurons co-cultured on astrocytes virally overexpressing GFP (Control) or GPC3, with associated scale bar. d) Quantification of EPSC and IPSC amplitude and frequency from co-culture. NGPC3-Virus (EPSC) = 54; NNo Virus (EPSC) = 48; NGPC3-Virus (IPSC) = 60; NNo-Virus (IPSC) = 46. Error bars denoted standard error from mean. p-values: *** p < .001; calculated by one-tail independent T-test; Tukey’s test was used to compare individual mean. e) Immunocytofluorescence staining for PSD95, Synapsin1, and Map2 on neuron cultures. Wild-type (WT) astrocyte-neuron co-culture served as a positive control. Cortical neuron cultures were grown in GPC3 condition media (CM), or GFP control CM. White scale bar = 50μm. f) Quantification of PSD95 and Synapsin1 immuno-positivity. Ntechnical = 12 for each condition. Error bars denoted standard error from mean. p-values: *** p < .001; calculated by one-tail independent T-test; Tukey’s test was used to compare individual mean. g) Representative traces of spontaneous postsynaptic current (SPSC) analysis of neurons co-cultured with astrocytes, GPC3 CM, or control CM, with associated scale bar.
Extended Data Table. PIK3CA variant modeling survival statistics.
Statistics for survival study of PIK3CA variants in 2xCr background. 3xCr model served as a positive control. All studies were terminated at 1 year of age. p-values were calculated using the log rank test. * denoted studies with surviving mice because the study was ended before they died.
| Count | Survival Range (days) | p-values (log rank test) | |||||||||||||
|---|---|---|---|---|---|---|---|---|---|---|---|---|---|---|---|
| Genotype | Total | ♂ | ♀ | First death | Last death | Median | 2×Cr; H1047R |
2×Cr; M10431 |
2×Cr; H701P |
2×Cr; V638A |
2×Cr; E545K |
2×Cr; C420R |
2×Cr; R88Q |
2×Cr; PIK3CA |
2×Cr; Cherry |
| 3×Cr | 42 | 23 | 19 | 53 | 105 | 84 | 0.000129 | 0.137233 | 7.49E-11 | 1.73E-10 | 0.000733 | 1.61E-15 | 0.000605 | i 6.65E-13 | 2.28E-13 |
| 2×Cr; Cherry | 28 | 12 | 16 | 115 | 351 | 203 | 4.51E-13 | 1.54E-12 | 0.000378 | 0.606653 | 2.56E-13 | 9.73E-15 | 6.69E-11 | 0.000469 | |
| 2×Cr; PIK3CA | 29 | 16 | 13 | 50 | 252 | 150 | 3.62E-13 | 6.34E-10 | 4.41 E-09 | 0.00151 | 3.10E-13 | 1.02E-15 | 1.61E-06 | ||
| 2×Cr; R88Q | 21 | 11 | 10 | 39 | 155 | 103 | 2.54E-05 | 0.067048 | 1.43E-10 | 2.36E-08 | 9.78E-05 | 2.71 E-08 | |||
| 2×Cr; C420R | 20 | 12 | 8 | 22 | 84 | 44 | 0.008385 | 8.79E-08 | 1.30E-11 | 1.60E-11 | 0.001131 | ||||
| 2×Cr; E545K | 32 | 17 | 15 | 37 | 119 | 63 | 0.398171 | 0.001046 | 9.81 E-11 | 2.49E-10 | |||||
| 2×Cr; V638A | 20 | 11 | 9 | 99 | >365* | 203 | 3.90E-10 | 4.38E-09 | 0.000867 | ||||||
| 2×Cr; H701P | 20 | 12 | 8 | 200 | >365* | 273 | 1.79E-10 | 1.17E-26 | |||||||
| 2×Cr; M10431 | 19 | 12 | 7 | 51 | 134 | 80 | 0.000236 | ||||||||
| 2×Cr: H1047R | 30 | 13 | 17 | 32 | 115 | 59 | |||||||||
Supplementary Material
Acknowledgements:
This study is dedicated to the memory of our dear friend and colleague, Kenneth L Scott, as his intellect, enthusiasm, and collaborative spirit were a driving force in this endeavor. This work was supported by grants from the Cancer Prevention Research Institute of Texas (RP150334 and RP160192 to BD, KLS, CAM, and CC), National Cancer Institute-Cancer Therapeutic Discovery (U01-CA217842 to BD, GBM, and KLS), National Institutes of Health (R01-CA223388 to BD and JLS; T32-HL902332 to KY), the American Cancer Society-Rob Rutherford Glioblastoma Research Postdoctoral Fellowship (PF-15-220-01-TBG to KY), and Howard Hughes Medical Institute Gilliam Fellowship (AH). We acknowledge the assistance of the Baylor College of Medicine Mouse Phenotyping Core with funding from the NIH (U54-HG006348). This project was supported by the BCM Small Animal MRI and Texas Children’s Hospital Small Animal Imaging Facility. Functional Proteomics RPPA Core Facility at MD Anderson Cancer Center, this facility is funded by NCI # CA16672. We acknowledge and thank Dr Frederick F Lang (MD Anderson Cancer Center), who generously provided patient derived cell lines under the auspices of his Internal Review Board protocol (LAB04-001) post-de-identification.
Footnotes
The RNA-Seq data from this study has been deposited in NBCI’s Gene Expression Omnibus and are accessible through GEO series accession number GSE123519. No custom code was used. R package limma eBayes function was used to define differentially expressed genes. Bioconductor SVA/Combat package was used for batch correction. The authors declare no competing interests.
References:
- 1.Venkatesh HS et al. Targeting neuronal activity-regulated neuroligin-3 dependency in high-grade glioma. Nature 549, 533–537, doi: 10.1038/nature24014 (2017). [DOI] [PMC free article] [PubMed] [Google Scholar]
- 2.Venkatesh HS et al. Neuronal Activity Promotes Glioma Growth through Neuroligin-3 Secretion. Cell 161, 803–816, doi: 10.1016/j.cell.2015.04.012 (2015). [DOI] [PMC free article] [PubMed] [Google Scholar]
- 3.Venkatesh HS et al. Electrical and synaptic integration of glioma into neural circuits. Nature 573, 539–545, doi: 10.1038/s41586-019-1563-y (2019). [DOI] [PMC free article] [PubMed] [Google Scholar]
- 4.Venkataramani V et al. Glutamatergic synaptic input to glioma cells drives brain tumour progression. Nature 573, 532–538, doi: 10.1038/s41586-019-1564-x (2019). [DOI] [PubMed] [Google Scholar]
- 5.Lawrence MS et al. Discovery and saturation analysis of cancer genes across 21 tumour types. Nature 505, 495–501, doi: 10.1038/nature12912 (2014). [DOI] [PMC free article] [PubMed] [Google Scholar]
- 6.Samuels Y et al. High frequency of mutations of the PIK3CA gene in human cancers. Science 304, 554, doi: 10.1126/science.1096502 (2004). [DOI] [PubMed] [Google Scholar]
- 7.Chang MT et al. Identifying recurrent mutations in cancer reveals widespread lineage diversity and mutational specificity. Nature biotechnology 34, 155–163, doi: 10.1038/nbt.3391 (2016). [DOI] [PMC free article] [PubMed] [Google Scholar]
- 8.Meyerson M, Gabriel S & Getz G Advances in understanding cancer genomes through second-generation sequencing. Nature reviews. Genetics 11, 685–696, doi: 10.1038/nrg2841 (2010). [DOI] [PubMed] [Google Scholar]
- 9.Miller ML et al. Pan-Cancer Analysis of Mutation Hotspots in Protein Domains. Cell systems 1, 197–209, doi: 10.1016/j.cels.2015.08.014 (2015). [DOI] [PMC free article] [PubMed] [Google Scholar]
- 10.Ng PK et al. Systematic Functional Annotation of Somatic Mutations in Cancer. Cancer cell 33, 450–462 e410, doi: 10.1016/j.ccell.2018.01.021 (2018). [DOI] [PMC free article] [PubMed] [Google Scholar]
- 11.Vogelstein B et al. Cancer genome landscapes. Science 339, 1546–1558, doi: 10.1126/science.1235122 (2013). [DOI] [PMC free article] [PubMed] [Google Scholar]
- 12.Zhang Y et al. A Pan-Cancer Proteogenomic Atlas of PI3K/AKT/mTOR Pathway Alterations. Cancer cell 31, 820–832 e823, doi: 10.1016/j.ccell.2017.04.013 (2017). [DOI] [PMC free article] [PubMed] [Google Scholar]
- 13.Brennan CW et al. The somatic genomic landscape of glioblastoma. Cell 155, 462–477, doi: 10.1016/j.cell.2013.09.034 (2013). [DOI] [PMC free article] [PubMed] [Google Scholar]
- 14.Cancer Genome Atlas Research, N. Comprehensive genomic characterization defines human glioblastoma genes and core pathways. Nature 455, 1061–1068, doi: 10.1038/nature07385 (2008). [DOI] [PMC free article] [PubMed] [Google Scholar]
- 15.John Lin CC et al. Identification of diverse astrocyte populations and their malignant analogs. Nature neuroscience 20, 396–405, doi: 10.1038/nn.4493 (2017). [DOI] [PMC free article] [PubMed] [Google Scholar]
- 16.Kfoury N et al. Cooperative p16 and p21 action protects female astrocytes from transformation. Acta neuropathologica communications 6, 12, doi: 10.1186/s40478-018-0513-5 (2018). [DOI] [PMC free article] [PubMed] [Google Scholar]
- 17.Dogruluk T et al. Identification of Variant-Specific Functions of PIK3CA by Rapid Phenotyping of Rare Mutations. Cancer research 75, 5341–5354, doi: 10.1158/0008-5472.CAN-15-1654 (2015). [DOI] [PMC free article] [PubMed] [Google Scholar]
- 18.Tsang YH et al. Functional annotation of rare gene aberration drivers of pancreatic cancer. Nature communications 7, 10500, doi: 10.1038/ncomms10500 (2016). [DOI] [PMC free article] [PubMed] [Google Scholar]
- 19.Nelson SB & Valakh V Excitatory/Inhibitory Balance and Circuit Homeostasis in Autism Spectrum Disorders. Neuron 87, 684–698, doi: 10.1016/j.neuron.2015.07.033 (2015). [DOI] [PMC free article] [PubMed] [Google Scholar]
- 20.Ramocki MB & Zoghbi HY Failure of neuronal homeostasis results in common neuropsychiatric phenotypes. Nature 455, 912–918, doi: 10.1038/nature07457 (2008). [DOI] [PMC free article] [PubMed] [Google Scholar]
- 21.Huberfeld G & Vecht CJ Seizures and gliomas--towards a single therapeutic approach. Nature reviews. Neurology 12, 204–216, doi: 10.1038/nrneurol.2016.26 (2016). [DOI] [PubMed] [Google Scholar]
- 22.van Breemen MS, Wilms EB & Vecht CJ Epilepsy in patients with brain tumours: epidemiology, mechanisms, and management. The Lancet. Neurology 6, 421–430, doi: 10.1016/S1474-4422(07)70103-5 (2007). [DOI] [PubMed] [Google Scholar]
- 23.Campbell SL et al. GABAergic disinhibition and impaired KCC2 cotransporter activity underlie tumor-associated epilepsy. Glia 63, 23–36, doi: 10.1002/glia.22730 (2015). [DOI] [PMC free article] [PubMed] [Google Scholar]
- 24.Lang FM et al. Mesenchymal stem cells as natural biofactories for exosomes carrying miR-124a in the treatment of gliomas. Neuro-oncology 20, 380–390, doi: 10.1093/neuonc/nox152 (2018). [DOI] [PMC free article] [PubMed] [Google Scholar]
- 25.Keppler-Noreuil KM et al. PIK3CA-related overgrowth spectrum (PROS): diagnostic and testing eligibility criteria, differential diagnosis, and evaluation. American journal of medical genetics. Part A 167A, 287–295, doi: 10.1002/ajmg.a.36836 (2015). [DOI] [PMC free article] [PubMed] [Google Scholar]
- 26.Mirzaa G et al. PIK3CA-associated developmental disorders exhibit distinct classes of mutations with variable expression and tissue distribution. JCI insight 1, doi: 10.1172/jci.insight.87623 (2016). [DOI] [PMC free article] [PubMed] [Google Scholar]
- 27.Roy A et al. Mouse models of human PIK3CA-related brain overgrowth have acutely treatable epilepsy. eLife 4, doi: 10.7554/eLife.12703 (2015). [DOI] [PMC free article] [PubMed] [Google Scholar]
- 28.Allen NJ & Eroglu C Cell Biology of Astrocyte-Synapse Interactions. Neuron 96, 697–708, doi: 10.1016/j.neuron.2017.09.056 (2017). [DOI] [PMC free article] [PubMed] [Google Scholar]
- 29.Allen NJ et al. Astrocyte glypicans 4 and 6 promote formation of excitatory synapses via GluA1 AMPA receptors. Nature 486, 410–414, doi: 10.1038/nature11059 (2012). [DOI] [PMC free article] [PubMed] [Google Scholar]
- 30.de Wit J et al. Unbiased discovery of glypican as a receptor for LRRTM4 in regulating excitatory synapse development. Neuron 79, 696–711, doi: 10.1016/j.neuron.2013.06.049 (2013). [DOI] [PMC free article] [PubMed] [Google Scholar]
- 31.Shah MA, Denton EL, Arrowsmith CH, Lupien M & Schapira M A global assessment of cancer genomic alterations in epigenetic mechanisms. Epigenetics & chromatin 7, 29, doi: 10.1186/1756-8935-7-29 (2014). [DOI] [PMC free article] [PubMed] [Google Scholar]
- 32.Thomas RK et al. High-throughput oncogene mutation profiling in human cancer. Nature genetics 39, 347–351, doi: 10.1038/ng1975 (2007). [DOI] [PubMed] [Google Scholar]
- 33.Zhang J, Wu LY, Zhang XS & Zhang S Discovery of co-occurring driver pathways in cancer. BMC bioinformatics 15, 271, doi: 10.1186/1471-2105-15-271 (2014). [DOI] [PMC free article] [PubMed] [Google Scholar]
- 34.Chen F & LoTurco J A method for stable transgenesis of radial glia lineage in rat neocortex by piggyBac mediated transposition. Journal of neuroscience methods 207, 172–180, doi: 10.1016/j.jneumeth.2012.03.016 (2012). [DOI] [PMC free article] [PubMed] [Google Scholar]
- 35.Doench JG et al. Optimized sgRNA design to maximize activity and minimize off-target effects of CRISPR-Cas9. Nature biotechnology 34, 184–191, doi: 10.1038/nbt.3437 (2016). [DOI] [PMC free article] [PubMed] [Google Scholar]
- 36.Dzyubenko E, Rozenberg A, Hermann DM & Faissner A Colocalization of synapse marker proteins evaluated by STED-microscopy reveals patterns of neuronal synapse distribution in vitro. Journal of neuroscience methods 273, 149–159, doi: 10.1016/j.jneumeth.2016.09.001 (2016). [DOI] [PubMed] [Google Scholar]
- 37.Johnson WE, Li C & Rabinovic A Adjusting batch effects in microarray expression data using empirical Bayes methods. Biostatistics 8, 118–127, doi: 10.1093/biostatistics/kxj037 (2007). [DOI] [PubMed] [Google Scholar]
- 38.Saldanha AJ Java Treeview--extensible visualization of microarray data. Bioinformatics 20, 3246–3248, doi: 10.1093/bioinformatics/bth349 (2004). [DOI] [PubMed] [Google Scholar]
- 39.Buckingham SC et al. Glutamate release by primary brain tumors induces epileptic activity. Nature medicine 17, 1269–1274, doi: 10.1038/nm.2453 (2011). [DOI] [PMC free article] [PubMed] [Google Scholar]
Associated Data
This section collects any data citations, data availability statements, or supplementary materials included in this article.
Supplementary Materials
Data Availability Statement
RNA sequencing of PIK3CA variant driven tumors is available on Gene Expression Omnibus (GEO) under accession GSE123519. All other data in this article are available from the corresponding author upon reasonable request.


