

Abstract

Parkinson’s disease (PD) is a progressive neurodegenerative disorder, whose treatment with modern therapeutics leads to a plethora of side effects with prolonged usage. Therefore, the management of PD with complementary and alternative medicine is often pursued. In the Ayurveda system of alternative medicine, Yashtimadhu choorna, a Medhya Rasayana (nootropic), prepared from the dried roots of Glycyrrhiza glabra L. (licorice), is prescribed for the management of PD with a favorable outcome. We pursued to understand the neuroprotective effects of Yashtimadhu choorna against a rotenone-induced cellular model of PD using differentiated IMR-32 cells. Cotreatment with Yashtimadhu choorna extract rescued rotenone-induced apoptosis and hyperphosphorylation of ERK-1/2. Quantitative proteomic analysis of six peptide fractions from independent biological replicates acquired 1,561,169 mass spectra, which when searched resulted in 565,008 peptide-spectrum matches mapping to 30,554 unique peptides that belonged to 4864 human proteins. Proteins commonly identified in biological replicates and >4 PSMs were considered for further analysis, leading to a refined set of 3720 proteins. Rotenone treatment differentially altered 144 proteins (fold ≥1.25 or ≤0.8), involved in mitochondrial, endoplasmic reticulum, and autophagy functions. Cotreatment with Yashtimadhu choorna extract rescued 84 proteins from the effect of rotenone and an additional regulation of 4 proteins. Network analysis highlighted the interaction of proteins and pathways regulated by them, which can be targeted for neuroprotection. Validation of proteomics data highlighted that Yashtimadhu confers neuroprotection by preventing mitochondrial oxidative stress and apoptosis. This discovery will pave the way for understanding the molecular action of Ayurveda drugs and developing novel therapeutics for PD.
Introduction
Neurodegeneration is a progressive phenomenon at old ages, which occurs as a result of neuronal loss or the inability of neurons to transmit the signals. Parkinson’s disease (PD) is one such age-related progressive neurodegenerative disorder whose prevalence accounts for 3% of the population, above 65 years.1 PD is caused by loss of dopaminergic neurons from the substantia nigra pars compacta (SNpc), resulting in loss of the neurotransmitter dopamine, and leads to the development of motor symptoms. The death of dopaminergic neurons is caused as a result of mitochondrial dysfunction, endoplasmic reticulum (ER) stress, neuroinflammation, and accumulation of protein aggregates.2,3 The management of PD relies on the alleviation of the symptoms, and levodopa is one of the most commonly prescribed medicines, which is useful in the early stages of the disease. However, with prolonged usage, the efficacy of PD medications decline and is reported to cause many side effects.4 Thus, there is a need for the use of a sustainable alternative and complementary management strategy of PD, which is required not only to prevent symptoms of PD but also to address the underlying molecular aberrations and improve the quality of life.
The quest for sustainable management of the disease led to the exploration of complementary and alternative medicines, which employ the use of traditional medicines and other forms of alternative treatments, including acupuncture, rhythmic therapy, and Reiki.5 The Indian Ayurvedic medicinal system classifies medicinal plants with nootropic properties as Medhya Rasayana, which helps in improving memory and brain functions.6−8 The nootropic formulations include Yashtimadhu (Glycyrrhiza glabra, licorice), Mandukaparni (Centella asiatica, Asiatic pennywort), Ashwagandha (Withania somnifera, Indian ginseng), and Brahmi (Bacopa monnieri, water hyssop).9−11 Yashtimadhu choorna is prepared from the dried roots of G. glabra L., commonly known as licorice (http://www.theplantlist.org/; http://www.ayurveda.hu/api/API-Vol-1.pdf). Several studies have reported its effectiveness as a neuroprotectant, an antidepressant, an antioxidant, and a memory enhancer.12−18 These studies highlight the neuromodulatory effects of Yashtimadhu; however, there exist lacunae in understanding the regulation of protein networks and the underlying molecular pathways.
PD is regarded as proteinopathy19,20 because of the dysregulation of the protein dynamics, resulting in abnormal accumulation of protein aggregates. Mass spectrometry (MS)-based proteomics serves as an invaluable tool to study the alteration of proteins that drive the pathogenesis in experimental models of PD, and the counteracting neuroprotective strategies, upon the introduction of a specific drug. The experimental models of PD are generated using genetically modified in vivo models such as α-synuclein (SNCA), parkin (PRKN), leucine-rich repeat kinases (LRRKs), or use of neurotoxins in vitro and in vivo.21 The commonly used neurotoxic models of PD are generated using rotenone, MPTP (1-methyl-4-phenyl-1,2,3,6-tetrahydropyridine), paraquat, and 6-hydroxydopamine.22 The establishment of an in vitro cellular model of PD offers advantages in monitoring and understanding the cellular mechanisms that are responsible for neurodegeneration. These proteins involved in the neurodegenerative mechanism can be targeted for efficient neuroprotective interventions.23,24 The study of proteins altered during the progression of a disease and its recovery helps in discovering the proteins associated with a protective pathway conferred by the drug.
In this study, we sought to evaluate the neuroprotective effects of Yashtimadhu choorna extract in an in vitro PD model. This model was generated using rotenone (a mitochondrial complex-I inhibitor), which triggers oxidative stress and induces apoptosis,25 effectively mimicking the cellular aberrations reported in PD. Quantitative proteomics was employed to identify proteins altered by rotenone and compared to their restoration by Yashtimadhu choorna extract to understand the molecular networks involved in neuroprotection.
Results and Discussion
Yashtimadhu Choorna Extract Counteracts Rotenone-Induced Apoptosis
We aimed to evaluate the establishment of the rotenone-induced PD model and the neuroprotection conferred by Yashtimadhu. To achieve this, we used IMR-32 cells that were differentiated with retinoic acid to yield dopaminergic neuron population.26−28
IMR-32 cells were differentiated with retinoic acid, which was confirmed with tyrosine hydroxylase (TH) expression (Supporting Information Figure S1A,B) and used to assess the neuroprotection conferred by Yashtimadhu choorna extract in a rotenone-induced PD model. Cytotoxicity assay was used to test the effective treatment doses of rotenone and Yashtimadhu choorna extract. Rotenone-induced time- and dose-dependent cell death and the IC50 (50% cell death) value was observed at a 100 nM concentration for 48 h, which was used for further treatments (Supporting Information Figure S1C). At the same time, treatment with Yashtimadhu choorna extract for 48 h showed no cytotoxicity at all tested concentrations (Supporting Information Figure S1D). The cell death observed at the IC50 rotenone concentration of 100 nM was prevented by cotreatment of Yashtimadhu choorna extract at a 200 μg/mL concentration, which was used for further treatments (Figure 1A). Cell death was also ascertained with the live–dead cell staining assay (Figure 1B,C). Rotenone treatment increased cell death (7.53-fold, p < 0.001), which was rescued by Yashtimadhu choorna extract cotreatment (0.89-fold, p < 0.001), which is in agreement with the cytotoxicity analysis.
Figure 1.

PD model validation and Yashtimadhu neuroprotection. (A) Cytotoxicity analysis showing rotenone-induced cell death and prevention of cell death by Yashtimadhu choorna extract cotreatment; (B) live–dead cell staining assay using propidium iodide (PI) (red) and HOECHST (blue) nuclear counterstain; and (C) graphical representation of cell death with respect to untreated cell control. Rotenone treatment increases cell death, encountered by Yashtimadhu choorna cotreatment, (D) immunoblot analysis of p-ERK-1/2 (T202/T204) and cleaved caspase-3 with β-actin as the loading control across control (C), rotenone (R), rotenone + Yashtimadhu choorna cotreatment (RY), and Yashtimadhu choorna extract (Y); (E) densitometry graph of cleaved caspase-3 activation, normalized with loading control; and (F) densitometry graph of p-ERK-1/2 activation, normalized with loading control, *, with respect to control (C) and # with respect to Yashtimadhu choorna cotreatment (RY). *,# p < 0.05, **,## p < 0.01, and ***,### p < 0.001. Labels: C-untreated cells, R-rotenone treatment, RY—rotenone + Yashtimadhu choorna extract cotreatment, and Y—Yashtimadhu choorna extract treatment.
ERK-1/2 phosphorylation and cleaved-caspase-3 activation are known to be induced by rotenone, which is also implicated in neurodegeneration.29,30 Rotenone induced activation of cleaved caspase-3 (2.22-fold, p < 0.05) and hyperphosphorylation of ERK-1/2 (1.87-fold, p < 0.05) (Figure 1D–F). Yashtimadhu choorna extract cotreatment encountered the rotenone-induced caspase-3 activation (0.88-fold, p < 0.05) and p-ERK-1/2 (0.58-fold, p < 0.01). These observations confirm the neuroprotective effects of Yashtimadhu against rotenone-induced stress by preventing p-ERK-1/2 activation and subsequent apoptosis.
Quantitative Proteomics Highlights Differentially Regulated Proteins
Quantitative proteomics was carried out to identify the altered proteins with rotenone treatment alone and restoration of those by cotreatment with Yashtimadhu choorna extract. The data were acquired for the biological duplicates, as technical triplicates each (Figure 2A). The workflow used for filtering proteins based on their identification from the independent replicates is outlined in Figure 2B. We obtained around 1.5 million tandem mass spectrometry (MS/MS) spectra, which provided 565,008 PSMs upon searching the MS/MS data against the database (human RefSeq109). These PSMs corresponded to 30,554 nonredundant peptides, identifying 4864 protein sequences corresponding to 4783 genes. Proteins commonly identified in both the biological replicates were considered, resulting in 3762 proteins. Also, proteins with PSMs < 4 were filtered out, and a list of 3720 resultant proteins (corresponding to 3673 gene symbols) was used for subsequent analysis (Supporting Information Table S1). The fold change (FC) of these 3720 proteins, along with their respective p-values and q-values, is deposited in the PRIDE repository.
Figure 2.
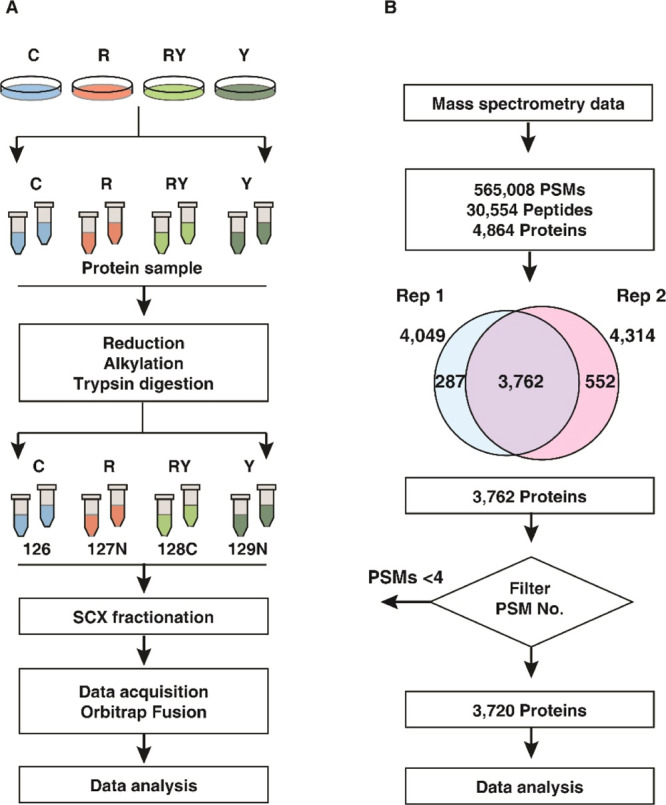
Summary of proteomics analysis. (A) Schematic of workflow employed for proteomics data acquisition. Labels: C-untreated cells, R-rotenone treatment, RY—rotenone + Yashtimadhu choorna extract cotreatment, and Y—Yashtimadhu choorna extract treatment and (B) schematic of the workflow used for proteomics data analysis.
Principal component analysis (PCA) was carried out to identify the variance across the four groups. The score plot (Figure 3A) shows the clustering of the groups based on the biological replicates. Rotenone treatment showed the maximal variation in comparison with the untreated cell control group. In contrast, the Yashtimadhu choorna extract cotreatment group showed a minimum variance compared with the untreated cells, indicating the restoration of altered protein dynamics.
Figure 3.

Differential regulation of proteins. (A) PCA score plot showing the variability between the groups and within the biological replicates, (B) scatter plot showing rotenone-induced differential expression, and (C) Venn diagram showing the restoration of proteins with Yashtimadhu choorna cotreatment. Labels: C-untreated cells, R-rotenone treatment, RY—rotenone + Yashtimadhu choorna extract cotreatment, and Y—Yashtimadhu choorna extract treatment.
The FC of protein expression was calculated with respect to the untreated cell control (C) and rotenone (R). A FC cutoff of ≥1.25 for overexpression and ≤0.8 for the downregulation of proteins was selected to be biologically significant, and an adjusted p-value, that is, q ≤ 0.05, was selected for statistical significance. A similar range of FCs has been previously reported by studies using isobaric labeling.31−35 Rotenone treatment highlighted 421 differentially regulated proteins (FC ≥1.25 or ≤0.8), of which 144 were significantly altered (q ≤ 0.05, with respect to untreated cell control, Figure 3B). Yashtimadhu choorna extract cotreatment was found to significantly regulate 88 proteins (q ≤ 0.05, with respect to rotenone), which included restoration of 84 proteins that were dysregulated by rotenone and an additional regulation of 4 proteins (Figure 3C).
Classification of Identified Proteins
Proteins were classified based on their intracellular compartmentalization and biological processes to understand the relevance of the differentially regulated proteins in the context of PD. Proteins were localized in the cytoplasm and nucleus, followed by exosomes, mitochondria, lysosomes, and ER. The proteins identified were also involved in processes such as cellular and protein metabolism, energy pathways, and cell proliferation.
Additionally, proteins were also classified using publicly available databases, such as MitoCarta, The Autophagy database, and the E3-ligases databases. The proteins regulating mitochondrial processes and energy pathways, ER function, autophagy, metabolism of proteins and lipids, cell proliferation, DNA repair, and replication were further shortlisted to understand the effect of rotenone and rescue by Yashtimadhu choorna extract cotreatment.
Rotenone Dysregulates Proteins Involved in Vital Functions
The extent of cellular damage as a result of rotenone was earlier ascertained with molecular assays, and the proteomics data were used to gain deeper insights into rotenone-induced cellular stress. Rotenone treatment resulted in 30 overexpressed (≥1.25, q < 0.05) and 114 downregulated (≤0.8, q < 0.05) proteins (Figure 4A). Mitochondrial dysfunction, ER stress, and autophagy dysregulation drive neuronal cell death, leading to the onset and progression of PD.36−38 Rotenone treatment altered the proteins involved in mitochondrial functions, ER functions, and autophagy. Altered mitochondrial proteins include those involved in the tricarboxylic acid (TCA) cycle and oxidative phosphorylation (OxPhos), among others (Figure 4B). The expression of these classified proteins with respect to control is also depicted in the chord diagram (Figure 4B). A heat map showing the expression of the highly overexpressed (FC ≥1.5, q ≤ 0.05) and downregulated ( FC ≤0.67, q ≤ 0.05) proteins with rotenone treatment is given in Figure 4C.
Figure 4.

Rotenone-induced differential protein expression. (A) Volcano plot displaying the differentially altered proteins with rotenone treatment, with respect to control group (R vs C), (B) chord plot showing the classification of differentially regulated proteins and their log 2FC, (C) heat map showing the differential expression of the highly upregulated (FC ≥ 1.5) and downregulated (FC ≤ 0.67) proteins, with respect to that of the control group. Labels: C-untreated cells and R-rotenone treatment.
OxPhos proteins such as ubiquinol-cytochrome c reductase hinge protein (UQCRH), NADH: ubiquinone oxidoreductase subunit-AB1 (NDUFAB1), and TCA cycle protein, dihydrolipoamide dehydrogenase were downregulated. Rotenone also affected the expression of ER proteins such as signal recognition particle 9 (SRP9), calumenin (CALU), eukaryotic translation initiation factor 2B subunit delta (EIF2B4), and autophagy proteins, 1-phosphatidylinositol 4,5-bisphosphate phosphodiesterase eta-1 (PLCH1) and cathepsin D (CTSD). The findings indicate mitochondrial dysfunction, autophagy dysregulation, and ER stress, which, as a result of rotenone, is reported to be a driving factor in neuronal apoptosis.25,39,40
Yashtimadhu Restores Proteins Involved in Cellular Stress Response
We have compared the Yashtimadhu choorna extract cotreatment group with the rotenone treatment group for differentially regulated proteins, which have been highlighted in a volcano plot (Figure 5A). The differentially regulated proteins are involved in mitochondrial functions, including the proteins in OxPhos and TCA cycle, ER and autophagy functions, cell proliferation, DNA repair, and DNA replication (Figure 5B). The proteins differentially regulated with Yashtimadhu choorna extract cotreatment are listed in Table 1 and heat map (Figure 5C).
Figure 5.

Yashtimadhu choorna extract cotreatment restores differentially regulated proteins. (A) Volcano plot displaying the differentially altered proteins with Yashtimadhu choorna extract cotreatment with rotenone, with respect to the rotenone group (RY vs R), (B) Sankey diagram showing the classification of differentially regulated proteins, and (C) heat map showing the differential expression of the proteins classified across all four groups, with respect to control. Labels: C-untreated cells, R-rotenone treatment, RY—rotenone + Yashtimadhu choorna extract cotreatment, and Y—Yashtimadhu choorna extract treatment.
Table 1. Partial List of Proteins Regulated by Yashtimadhu with Their Respective FC and q-Valuesa.
| description | accession | gene symbol | rotenone, FC | Yashtimadhu choorna extract cotreatment, FC |
|---|---|---|---|---|
| Proteins Restored by Yashtimadhu | ||||
| Proteins Overexpressed with Rotenone | ||||
| pygopus homolog 2 | NP_612157.1 | PYGO2 | 5.09,* | 0.96,# |
| X-ray radiation resistance-associated protein 1 isoform X10 | XP_011543064.1 | XRRA1 | 2.08,* | 1.4,# |
| bromodomain-containing protein 9 isoform 1 | NP_076413.3 | BRD9 | 1.94,** | 1.43,# |
| 10 kDa heat shock protein, mitochondrial | NP_002148.1 | HSPE1 | 1.34,* | 1.03,# |
| UDP-N-acetylhexosamine pyrophosphorylase-like protein 1 isoform X1 | XP_006717380.1 | UAP1L1 | 1.39,* | 0.99,# |
| 1-phosphatidylinositol 4,5-bisphosphate phosphodiesterase eta-1 isoform X5 | XP_011510867.1 | PLCH1 | 1.41,* | 0.93,# |
| anillin isoform X1 | XP_006715809.1 | ANLN | 1.41,* | 1.13,# |
| ornithine aminotransferase, mitochondrial isoform 1 | NP_001309897.1 | OAT | 1.38,* | 1.31,# |
| tripartite motif-containing protein 65 isoform X1 | XP_006721823.1 | TRIM65 | 1.35,* | 0.89,# |
| kallikrein-11 isoform X1 | XP_011524671.1 | KLK11 | 1.32,* | 0.76,# |
| Proteins Downregulated with Rotenone | ||||
| 60S ribosomal protein L37 | NP_000988.1 | RPL37 | 0.67,* | 0.89,# |
| superoxide dismutase 1 [Cu–Zn] | NP_000445.1 | SOD1 | 0.74,* | 0.77,# |
| zinc finger Ran binding domain-containing protein 2 isoform 1 | NP_976225.1 | ZRANB2 | 0.76,* | 0.85,# |
| histone H1.3 | NP_005311.1 | H1-3 | 0.76,*** | 0.84,# |
| CD59 glycoprotein | NP_001120699.1 | CD59 | 0.76,*** | 0.89,# |
| nucleolin | NP_005372.2 | NCL | 0.77,* | 0.83,# |
| CALU isoform c | NP_001186600.1 | CALU | 0.77,** | 0.88,# |
| Src substrate cortactin isoform a | NP_005222.2 | CTTN | 0.78,*** | 0.84,### |
| SH3 domain binding glutamic acid-rich-like protein | NP_003013.1 | SH3BGRL | 0.79,** | 0.86,# |
| ashwin isoform X1 | XP_024308903.1 | C2orf49 | 0.79,** | 0.89,# |
| Proteins Additionally Regulated by Yashtimadhu | ||||
| leucine-rich repeat-containing protein 14 | NP_001258965.1 | LRRC14 | 1.51,ns | 0.97,# |
| pleckstrin homology-like domain family A member 3 | NP_036528.1 | PHLDA3 | 1.02,ns | 0.72,# |
| neurabin-2 | NP_115984.3 | PPP1R9B | 0.95,ns | 1.24,# |
| CD63 antigen isoform A | NP_001244318.1 | CD63 | 0.86,ns | 1.16,# |
*, significance with respect to control; #, significance with respect to rotenone. *,#, q ≤ 0.05; **,##, q ≤ 0.01; and ***,###, q ≤ 0.005.
Yashtimadhu Regulates Pathways Essential for Neuronal Maintenance
Protein dynamics play a crucial role in the regulation of several cellular pathways. From the pathway enrichment analysis using the Enrichr and Reactome tools, significant pathways were identified (p < 0.05) and were narrowed down to essential pathways, such as essential neuronal functions, metabolism of proteins, and metabolism of lipids. The proteins involved in these pathways are summarized in Table 2. Regulation of apoptosis, dopaminergic synapse, superoxide removal, mitochondrial functions, maintenance of myelin, axonal transport, and postsynaptic differentiation was enriched. In addition to this, the regulation of lipid and protein metabolism was also enriched.
Table 2. Cellular Pathways Regulated by Yashtimadhu.
| pathway name | proteins |
|---|---|
| Neuronal Processes | |
| dopaminergic synapse | CALM3 |
| axon guidance | SDC2; CLTB; CLTA; RPL37 |
| transmission across chemical synapses | PRKAR1A; CALM3 |
| neurotransmitter receptors and postsynaptic signal transmission | PRKAR1A; CALM3 |
| long-term potentiation | CALM3 |
| agrin in postsynaptic differentiation | CTTN |
| synaptic vesicle cycle | CLTB; CLTA |
| regulation of mitotic cell cycle | SKP1 |
| regulation of cell cycle | NASP SKP1 |
| mitochondrial transcription | SSB |
| ROS degradation | SOD1 |
| apoptotic DNA fragmentation | HMGB2; HMGB1 |
| Protein Metabolism | |
| protein metabolism | EIF4B; HSPE1; SRSF1; NACA; TBCA; SERPINA3; SKP1; RPL37; KLK11 |
| translation initiation complex formation | EIF4B |
| cap-dependent translation initiation | RPL37; EIF4B |
| eukaryotic translation elongation and termination | RPL37 |
| protein processing in the ER | SKP1 |
| protein folding | TBCA |
| UPR | HDGF |
| activation of chaperones by IRE1α | HDGF |
| autophagy | HMGB1; PLCH1, CTLA, CTLB |
| neddylation | DCUN1D3 |
| Lipid Metabolism | |
| metabolism of lipids | PSAP; CYP51A1; AGPAT1 |
| sphingolipid and glycosphingolipid metabolism | PSAP |
| phospholipid and glycerophospholipid metabolism | AGPAT1 |
| CDP-diacylglycerol biosynthesis | AGPAT1 |
| cholesterol biosynthesis | CYP51A1 |
Yashtimadhu Prevents Mitochondrial Dysfunction
Mitochondrial dysfunction is attributed to increased oxidative stress and loss of mitochondrial membrane potential and results in activation of the apoptotic cascade in neurons.41 The mitochondrial OxPhos complex-III protein, cytochrome b-c1 complex subunit 6 (UQCRH), plays a vital role in ATP synthesis and maintenance of mitochondrial membrane potential. Gene expression analysis points to the reduction of UQCRH in the SNpc dopaminergic neurons of PD patients,42 correlating with the observation from rotenone treatment, which was increased with Yashtimadhu choorna cotreatment. Yashtimadhu also restored ATP synthase inhibitory factor subunit 1 (ATP5IF1) and superoxide dismutase-1 (SOD1), which are reported to be downregulated with rotenone.43 SOD1 quenches the reactive oxygen species (ROS) and maintaining redox balance, and ATP5IF1 inhibits mitochondrial ATP synthase, that is, complex-V and maintains the mitochondrial membrane potential.44,45 The reduction in ATP5IF1 is implicated in mitochondriopathies, while its overexpression confers neuroprotection.45,46 Yashtimadhu also countered rotenone-induced increase of chaperonin, that is, heat shock protein-10 kDa (HSPE1) that helps in the folding of mitochondrial proteins.47 Rotenone-mediated increase of HSPE1 is reported to be involved in caspase-3 activation and neuron death.48,49 From these observations, it can be inferred that Yashtimadhu prevented cleaved caspase-3-mediated apoptosis by restoring the mitochondrial proteins involved in redox balance, membrane potential, and regulation of apoptosis.
Yashtimadhu Restores Proteins Involved in Lipid Metabolism
The differentially expressed proteins with Yashtimadhu choorna extract cotreatment were found to be involved in the metabolism of phospholipid, sphingolipid, cytidine diphosphate diacylglycerol (CDP-DAG), and cholesterol metabolism. The proteins enriched were cytochrome 1-acyl-sn-glycerol-3-phosphate acyltransferase 1 (AGPAT1), P450 family 51 subfamily A member 1, that is, lanosterol 14-alpha demethylase (CYP51A1), and prosaposin (PSAP). AGPAT1 is a lysophosphatidic acid acyltransferase that regulates phospholipid and triglyceride levels in the brain, while CYP51A1 is involved in cholesterol metabolism.50,51 Dysregulated lipid metabolism is associated with the cytoplasmic accumulations of SNCA with other proteins and lipids, leading to the formation of protein aggregates, that is, Lewy bodies in PD.52 Lipidomic analysis of PD brains has demonstrated an increase in cholesterol metabolism and dysregulation of glycerophospholipid (CDP-DAG),53 signifying the classification of PD as a lipidopathy.19 The perturbations of lipid metabolism as a result of rotenone exposure in SHSY5Y cells have also been reported.54 The restoration of the proteins regulating lipid metabolism highlights the protective effect of Yashtimadhu.
Interplay between Protein Translation and Degradation Mechanisms by Yashtimadhu
In our analysis, we also enriched the proteins involved in protein translation and degradation. ER plays a central role in protein dynamics in the cell, regulating the translation, protein folding, trafficking, and unfolded protein response (UPR).55 Yashtimadhu restored ER proteins involved in translation and protein folding such as eukaryotic translation initiation factor (EIF4B) and translational regulator 60S ribosomal protein L37 (RPL37). Protein folding is a major determinant of its function, and with the accumulation of unfolded or misfolded proteins, oxidative stress and ER stress are induced. The ER stress results in the activation of UPR, which plays an essential role in PD.56,57 In response to the accumulation of unfolded proteins, the UPR regulates signals that activate the protein degradation pathways, that is, autophagy and ubiquitin-proteasomal system (UPS).57,58
Autophagy is a bulk degradation mechanism that degrades proteins and damaged cell organelles. Autophagy initiation is controlled primarily by mammalian target of rapamycin (mTOR) and 5′ AMP-activated protein kinase (AMPK), which in turn regulates the phosphorylation of ULK1/2.59,60 UPS is involved in clearing protein aggregates, which is carried out by the 26s proteasomal system and is reported to act in close association with the autophagy mechanism.61,62 Proteins that are tagged by the E3-ubiquitin ligases are selected for degradation.63 Yashtimadhu regulated autophagy proteins such as 1-phosphatidylinositol-4,5-bisphosphate phosphodiesterase (PLCH1), clathrins (CTLA and CTLB), and high mobility group box 1 (HMGB1). E3-ligase-associated proteins, such as BTB/POZ domain-containing adapter for CUL3-mediated RhoA degradation (TNFAIP1), galectin-3 binding protein (LGALS3BP), and tripartite motif-containing 65 (TRIM65), were also restored by Yashtimadhu.
The enrichment analysis identified selective protein degradation pathways such as autophagy and neddylation. Neddylation is a degradation process similar to ubiquitination that involves the addition of a NEDD8, whose activation has been proven to be protective in PD.64 Aggrephagy is a form of selective autophagy process that takes over the degradation of the accumulated proteins when the cellular UPS fails.65,66 The dysregulation of the protein degradation mechanism leads to the accumulation of protein aggregates, which induce apoptosis as a result of oxidative and ER stress in PD. The regulation of the proteins involved in the translation and degradation processes makes Yashtimadhu an attractive candidate for neuroprotection.
Regulation of Transcription Factors by Rotenone and Yashtimadhu
We enriched the transcription factors (TFs) that control the expression of the differentially altered proteins to understand the regulation of expression at the level of transcription (Supporting Information Tables S2 and S3). The proteins altered by rotenone treatment were found to be regulated by 169 TFs. Similarly, the proteins restored by Yashtimadhu were found to be regulated by 149 TFs. A list of the top enriched TFs and the proteins regulated by them is displayed in Table 3, which includes specificity proteins-1 and 4 (SP1 and SP4), early growth response-1 (EGR1), nuclear respiratory factor-1 (NRF1), and Kruppel-like factor 7 (KLF7), to name a few. Some of the enriched TFs were previously reported to be dysregulated in PD pathogenesis, such as EGR1,67,68 NRF1,69 and ELK1.70 These TFs were found to regulate proteins involved in autophagy, energy pathways, and metabolism of proteins and lipids. The findings show that Yashtimadhu helps in the regulation of TFs, which in turn restores the proteins impacted by rotenone.
Table 3. List of TFs Regulating the Rotenone- and Yashtimadhu-Induced Differentially Expressed Proteins.
| TF | no. of proteins, regulated by rotenone | no. of proteins, regulated by Yashtimadhu | representative proteins |
|---|---|---|---|
| SP1 | 64 | 39 | NCL; CTTN; HMGB1; TPM3; PSAP; NASP; EIF4B; SOD1; HSPE1 |
| KLF7 | 45 | 31 | FUS; PTMS; PDCD5; CD59; CIRBP; GAA; EWSR1; UQCRH |
| SP4 | 39 | 21 | HMGN2; HMGB2; SET; NUCKS1; CIRBP; ITGA3; CLTB |
| EGR1 | 37 | 20 | NASP; EIF4B; SRSF1; FUS; MARCKSL1; OAT; NACA |
| NFYA | 33 | 17 | LRRC14; TAF15; PRKAR1A; C12orf57; CLTA; ZRANB2; XRRA1 |
| GABPA | 27 | 16 | TGOLN2; C12orf57; RPL37; CHCHD2; BICD2; C2orf49; BRD9 |
| NRF1 | 22 | 15 | PSAP; SSB; SRSF1; MARCKSL1; TBCA; PAGE5; PDCD5; GAA |
| YY1 | 22 | 15 | CAPRIN1; TMSB4X; PRKAR1A; SRSF3; UQCRH; MORF4L1 |
| ELK1 | 22 | 12 | MT2A; TGOLN2; CLTA; RRP15; RPL37; CHCHD2; TNFAIP1 |
| HNF4A | 21 | 13 | TPM3; HSPE1; FUS; HPCAL1; CALM3; SH3BGRL; CD59; ITGA3 |
Molecular Network Involved in the Neuroprotective Functions of Yashtimadhu
The functional significance of the proteins regulated by Yashtimadhu cotreatment and their cellular functions were established, and the protein–protein interaction (PPI) network was constructed with STRING (confidence score ≥ 0.7). The PPI analysis showed the interactions between 31 out of the 84 proteins differentially regulated by Yashtimadhu (Supporting Information Table S4). We manually curated the molecular pathways that are governed by the 31 proteins and rebuilt the interaction network, highlighting the PPI and their interconnected pathways (Figure 6).
Figure 6.

Molecular network of Yashtimadhu-mediated neuroprotection. The interaction network of Yashtimadhu-regulated proteins and interlinking pathways.
The pathways regulated by the PPI were maintenance of neuronal functions, protein translation, cellular signaling (receptor tyrosine kinases, G-protein signaling, PI3K-AKT, and mTOR signaling), ROS degradation, RNA metabolism, energy pathway, autophagy, and apoptosis regulation, while the proteins regulating lipid mechanism formed a unique cluster. The network provides a snapshot of the proteins and their functions, modulating the neuroprotective of Yashtimadhu, against the rotenone-induced in vitro model of PD.
Validation of Neuroprotection Conferred by Yashtimadhu
The MS-based analysis highlighted the proteins and pathways regulated by Yashtimadhu, which were predominantly involved in mitochondrial functions. As stated earlier, mitochondria regulate several cellular functions such as energy production (TCA and OxPhos), maintenance of cellular redox, and apoptosis. We validated some of the proteins and pathways regulated by Yashtimadhu, which are involved in mitochondrial homeostasis.
We selected enzymes that are involved in the regulation of cellular redox (SOD1), TCA cycle [pyruvate dehydrogenase E1 subunit α 1 (PDHA1), citrate synthase (CS), and isocitrate dehydrogenase 1 (IDH1)], and apoptosis [voltage-dependent anion-selective channel protein 1 (VDAC1) and apoptosis-inducing factor mitochondrial 1 (AIFM1)]. The abundance of these proteins from the MS-based proteomics is given in Figure 7A. Immunoblotting analysis correlated with the proteomics analysis and showed a decrease in SOD1 with rotenone, which was subsequently restored by Yashtimadhu. PDHA1, AIFM1, and VDAC1 were also increased in rotenone that was restored by Yashtimadhu (Figure 7B,C). CS and IDH1 did not show significant changes in their expression patterns across the treatment conditions. VDAC is located on the mitochondrial outer membrane, forming channels for the transport of metabolites. It also plays a prime role in apoptosis by facilitating the release of proapoptotic proteins such as cytochrome-C and AIFM1, initiating apoptosis.71 Rotenone-mediated increase in VDAC and AIFM1 suggests activation of apoptosis as a result of mitochondrial dysfunction, which is prevented by Yashtimadhu.
Figure 7.

Validation of proteins and pathways regulated by Yashtimadhu. (A) Heat map showing the FC abundances of selected proteins from MS data, (B) immunoblotting analysis of proteins involved in mitochondrial health, (C) densitometry analysis showing the expression of the proteins, (D) cellular ROS staining using DCFDA (green) and counterstain HOECHST (blue), and (E) graphical representation of ROS production in the cells. *, significant with respect to control; #, significant with respect to rotenone. *,#, p ≤ 0.05; **,##, p ≤ 0.01. Labels: C-untreated cells, R-rotenone treatment, RY—rotenone + Yashtimadhu choorna extract cotreatment, and Y—Yashtimadhu choorna extract treatment.
Rotenone-induced reduction in SOD1 levels was reported earlier, which also led to increased oxidative stress.43 Our pathway analysis also pointed to the regulation of cellular ROS degradation. We used 2′,7′-DCFDA (2′,7′-dichlorofluorescein diacetate) staining dye to observe the cellular ROS, which was increased with rotenone decreased with Yashtimadhu choorna extract cotreatment. Also, alteration in PDHA1 is implicated in ER stress before induction of mitochondrial dysfunction,72 and an increase in PDHA1 is also associated with increased ROS production.73 Our observations of ROS correlated with the reduced SOD1 levels with rotenone, indicating that the action of Yashtimadhu is by modulating SOD1 and PDHA1 levels and regulating cellular ROS degradation. The Yashtimadhu-mediated reduction in cellular ROS prevents cell death by preventing mitochondrial dysfunction and subsequent release of apoptotic factors.
Conclusions
This study provides invaluable information on the neuroprotective properties of Yashtimadhu choorna against rotenone-induced PD model using quantitative proteomics. Yashtimadhu restored functions that are dysregulated in PD, such as mitochondrial function, ER health, protein, and lipid metabolism. The findings of this study enabled us to understand the proteins involved in rotenone-induced neurotoxicity that was counteracted by Yashtimadhu. Analysis of the restored proteins enabled the identification of molecular networks involved in the neuroprotective functions of Yashtimadhu. Validation of the proteins and pathways regulated by Yashtimadhu shows that it confers neuroprotection by the restoration of cellular redox potential and maintaining mitochondrial health, thereby preventing subsequent neuronal apoptosis. The identified proteins can be developed as molecular targets for neuroprotection against PD.
Our study opens new avenues in understanding and deciphering the molecular mechanisms of traditional medicine in combating neurodegenerative disorders. This omics-aided approach can be envisaged for molecularization of Indian Ayurvedic formulation-based therapeutic interventions.
Methods
Reagent Procurement
Rotenone (Cat# R8875), retinoic acid (Cat# R2625), collagen (Cat# C9791), thiazolyl blue tetrazolium bromide (MTT, Cat# M5655), bisBenzimide H 33342 (HOECHST, Cat# B2261), 2′,7′-dichlorodihydrofluorescein (DCFDA, Cat# D6883), iodoacetamide (Cat# I6125), and DL-dithiothreitol (Cat# D9779) were procured from Sigma-Aldrich, St. Louis, USA. Dulbecco’s modified Eagle medium (DMEM) high glucose (Cat#12100046), fetal bovine serum (FBS), and 100× antibiotic/antimycotic solution (Cat# 15240062) were purchased from Gibco. Pierce BCA protein estimation assay kit (Cat# 23225), Pierce Peptide estimation assay kit (Cat# 23275), and TMT 10plex kit (Cat# 90110) were procured from Thermo Fisher Scientific USA. Antibodies were purchased from Cell Signaling Technology, Danvers, USA, and Sigma-Aldrich, St. Louis, USA. Nitrocellulose membrane (Cat# 1620115) and Clarity ECL Substrate (Cat# 170-5061) were purchased from BioRad Laboratories, California, USA, and X-ray films from Carestream, USA. TPCK-treated trypsin (Cat# LS003741) was from Worthington Biochemical Corporation, USA. Solid-phase extraction disks, C-18 (Cat# 66883-U), and SCX (Cat# 66889-U) were procured from Empore, USA.
Procurement of Yashtimadhu Choorna
Yashtimadhu choorna (lot no.64) was procured from the SDP Remedies and Research Centre, Puttur, Karnataka, India (http://sdpayurveda.com/products/choorna/yastimadhu-choorna/), a GMP-certified manufacturer of Ayurvedic formulations, and a specimen is maintained at the center with the identification number SDP/YM/001-2017. The industrial process includes shade-net drying and vacuum drum drying of Yashtimadhu roots, followed by pulverization of the dried roots and sieving, resulting in the fine powder, with a yield of 90%. Yashtimadhu choorna was procured, and the presence of lead molecules, glabridin (specific for G. glabra), glycyrrhizic acid, and licoricesaponin-G2 was confirmed using liquid chromatography–MS/MS (LC–MS/MS) analysis using QTRAP-6500, ABSCIEX. The compounds were identified based on the MS/MS fragment spectra, matched to the theoretical spectra generated using CFM-ID,74 and detailed in Supporting Information Table S5.
Yashtimadhu Choorna Extract Preparation for Cell Culture Analysis
Yashtimadhu choorna extract for cell culture treatment was prepared using an aqueous (water) extraction method. Yashtimadhu choorna, 1 g, was suspended in 10 mL of Milli-Q water (concentration, 0.1 g/mL) and incubated overnight at room temperature with continuous rotation. The extraction mixture was then centrifuged at 5000g for 10 min. The centrifugation was repeated for complete aspiration of the supernatant and transferred to a fresh tube. The aqueous extract was then dried using SpeedVac (Savant, Thermo Fisher Scientific, USA) and stored at −20 °C until further use. The dried extract was resuspended in serum-free cell culture media before treatment.
Cell Culture and Treatments
IMR-32 cells (ATCC CCL-127) were procured from National Centre for Cell Science (NCCS), Pune, India. The cells were maintained in DMEM-high glucose supplemented with 10% FBS and 1× antibiotic/antimycotic solution and were incubated at 37 °C with 5% CO2. Differentiation of cells was carried out in a collagen-coated 6-well plate, wherein the cells were seeded at a density of 3 × 10⁴ cells/well. The cells were treated with 10 μM retinoic acid supplemented in 2% FBS-containing medium, for 9 days, for yielding a dopaminergic population. Differentiation was confirmed with TH expression (Supporting Information Figure S1A,B).
For MTT assay, 5000 cells/well were seeded in a 96-well plate and treated with different concentrations of rotenone (0.25, 0.5, 1, 10, 100, 200, 500, 1000, and 10000 nM) and Yashtimadhu choorna extract (50, 100, 200, 500, 1000, and 1500 μg/mL) for 48 h. MTT dye was added to the cells and incubated for 4 h. The resultant formazan crystals were dissolved using 50:50 of ethanol/dimethyl sulfoxide (DMSO) solution and read at 570 nm and background subtraction at 650 nm. Cell viability was calculated and represented as a percentage with respect to the untreated cells. The concentrations of rotenone and Yashtimadhu were determined from the results of the cytotoxicity assay. The differentiated cells were treated with (i) 100 nM rotenone (dissolved in DMSO), (ii) 200 μg/mL Yashtimadhu choorna extract, and (iii) 100 nM rotenone + 200 μg/mL Yashtimadhu choorna extract for 48 h, and untreated cells were taken as a control.
Cell Staining Assays
IMR-32 cells were seeded at 1 × 10⁴ cells/well in 12-well plates, differentiated, and treated with rotenone (100 nM), Yashtimadhu choorna extract (200 μg/mL), 100 nM rotenone + Yashtimadhu choorna extract cotreatment for 48 h. The untreated cells were taken as a control. Post-treatment, the medium was aspirated, and the cells were washed with 1× phosphate-buffered saline (PBS) and treated with 20 μg/mL of PI for dead cells and 5 μg/mL of HOECHST as a counter nuclear stain in serum-free media for 15 min.75 For staining of the intracellular ROS productions, the cells were stained with DCFDA post-treatment with rotenone, Yashtimadhu alone, and Yashtimadhu choorna extract cotreatment. The cells were washed with 1× PBS and stained with 25 μM of DCFDA and 5 μg/mL of HOECHST in serum-free media and stained for 15 min in the dark. Imaging was done with Zoe Imager, BioRad. The images were processed, and analysis of live–dead staining and ROS staining was measured using the ImageJ tool, NIH, USA.76 Cell viability was calculated with respect to untreated cells, and % ROS was calculated with respect to nuclear counterstained cells.
Immunoblotting Analysis
IMR-32 cells were seeded at 3 × 10⁴ cells/well in collagen-coated 6-well plates and differentiated with retinoic acid. Rotenone (100 nM), Yashtimadhu choorna extract (200 μg/mL), and 100 nM of rotenone + Yashtimadhu choorna extract cotreatment was done for 48 h, while untreated cells were taken as a control. Post-treatment, the medium was removed, and the cells were washed with ice-cold 1× PBS. The cells were scraped and harvested in a lysis buffer containing 4% sodium dodecyl sulfate (SDS) in 50 mM triethylammonium bicarbonate (TEABC), with sodium orthovanadate (1 mM), sodium pyrophosphatase (2.5 mM), and beta-glycerophosphate (1 mM). The lysates were probe-sonicated on ice using Q-Sonica (Cole-Parmer, India) and heated at 95 °C on a dry bath for 10 min, followed by centrifugation at 12,000g for 20 min. The supernatant was aspirated into a new tube, and the protein concentration was estimated using the BCA protein estimation assay kit.
Immunoblotting was performed as described previously.77 Briefly, an equal amount of protein was loaded across all treatments, electrophoretically resolved, and transferred onto the nitrocellulose membrane. The membranes were probed for the following proteins, with their dilution factors used for analysis, cleaved caspase-3 (1:1000), p-ERK1/2 (T202/Y204, 1:1000), TH (1:1000), SOD1 (1:1000), VDAC1 (1:1000), AIFM1 (1:1000), PDHA1 (1:1000), CS (1:1000), and IDH1 (1:1000), while β-actin (HRP-conjugated, 1:50,000) was used as a loading control. The blots were then incubated with the respective secondary antibodies (1:3000 dilution) and washed prior to imaging. Immunoreactive protein bands were visualized with Clarity ECL Substrate and captured onto X-ray films. The X-ray films were scanned, and densitometry analysis was carried out with ImageJ software, NIH, USA.76 The area under the curve was used to calculate protein expression, normalized with β-actin, and expressed as FC with respect to control.
Proteomics Sample Preparation
IMR-32 cells were seeded at 1 × 10⁵ cells/plate in 10 cm collagen-coated plates and differentiated with retinoic acid. Differentiated IMR-32 cells were treated with rotenone (100 nM), rotenone (100 nM) + Yashtimadhu choorna extract (200 μg/mL) cotreatment, and Yashtimadhu choorna extract (200 μg/mL) alone. The untreated cells were taken as a control. The cells were treated as independent biological duplicates and harvested. Briefly, the cells were washed thrice in ice-cold 1× PBS and scraped-off with lysis buffer [4% SDS in 50 mM TEABC with sodium pyrophosphate (2.5 mM), sodium orthovanadate (1 mM), and β-glycerophosphate (1 mM)], and the lysate was prepared as mentioned above. Protein concentration was estimated using the BCA assay, and the same was confirmed visually resolving on a 10% SDS-polyacrylamide gel electrophoresis (PAGE) gel. Based on the protein concentrations, 300 μg of protein from each treatment was taken, reduced with dithiothreitol, and alkylated with iodoacetamide. The proteins were then precipitated with ice-cold acetone overnight at −20 °C. Precipitated proteins were reconstituted in 50 mM of TEABC and digested with TPCK-trypsin overnight at a ratio of 1:20 of enzyme/protein at 37 °C.32 Digestion efficiency was evaluated by resolving the samples on 10% SDS-PAGE. The peptides were dried overnight in SpeedVac and stored at −20 °C until labeling.
Tandem Mass Tag Labeling
Peptide samples were reconstituted in 50 mM of TEABC, and their concentrations were estimated with the Pierce Peptide estimation kit. The peptide sample (50 μg) from each condition was used for labeling, with labels from the TMT 10plex kit. Peptides from the four different samples were labeled as follows: (i) untreated cells (C), (ii) 100 nM rotenone (R), (iii) 100 nM rotenone + 200 μg/mL Yashtimadhu choorna extract (RY), and (iv) 200 μg/mL Yashtimadhu choorna extract (Y), with four labels from the TMT 10plex kit, viz., 126 for C, 127N for R, 128C for RY, and 129N for Y. Both the biological replicates were independently labeled using the manufacturers’ protocol. The TMT labels were reconstituted in anhydrous acetonitrile (ACN) and vortexed for dissolution. The respective TMT tags were added to both the replicates and incubated at room temperature for 1 h and quenched by adding 8 μL of 5% hydroxylamine. The samples were pooled and dried overnight using SpeedVac. The dried samples were stored at −20 °C until peptide fractionation.
Peptide Fractionation and Clean-Up
Peptide fractionation was carried out using a strong cation exchange (SCX) Stage Tip protocol as previously described.78 Briefly, the SCX material was stacked onto 200 μL tips and activated with 100% ACN, followed by equilibration with 2% trifluoroacetic acid (TFA). Peptides were reconstituted in 2% TFA and loaded onto the Stage Tips. The flow-through was passed twice, followed by washing with 0.2% TFA. Elution was carried out with different concentrations of ammonium acetate in ACN (50, 75, 125, 200, and 300 mM) into five separate fractions, and the sixth fraction was collected in 5% ammonium hydroxide with 80% ACN. The six fractions were collected in individual tubes and dried.
Peptide desalting was carried out with the C-18 Stage Tip method, as described previously.79 The C-18 material was stacked onto 200 μL tips, activated with 100% ACN, and equilibrated with 0.1% formic acid. Fractionated peptide samples were reconstituted in 0.1% formic acid and loaded onto the C-18 material, and the flow-through was passed twice, followed by washing with 0.1% formic acid and elution with 40% ACN in 0.1% formic acid. The dried fractions were stored at −20 °C until MS analysis.
LC–MS/MS Analysis
LC–MS/MS analysis was carried out using an Orbitrap Fusion Tribrid mass spectrometer (Thermo Fisher Scientific, Bremen, Germany) coupled with an Easy-nl C1200 nanoflow UHPLC (Thermo Scientific, Odense, Denmark). The fractionated and dried peptides were reconstituted using 0.1% formic acid and introduced into the nanoViper trap column (75 μm × 2 cm and 3 μm, C18) (Thermo Fisher Scientific). Peptides were resolved on an EASY-Spray C18 Column (75 μm × 50 cm, 275 μm, 100 Å) maintained at a temperature of 40 °C. A gradient of 5–35% solvent B (0.1% formic acid in 80% ACN) at a flow rate of 300 nL/min for 110 min was used for peptide resolution. A total run time of 140 min, inclusive of the column conditioning and sample loading, was used for the LC–MS/MS analysis.
The data-dependent acquisition was carried out within a mass range of 400-1600 m/z in the Orbitrap mass analyzer at a resolution of 120,000 at 200 m/z. Most intense precursor ions were selected for MS/MS fragmentation at a top speed data-dependent mode with a maximum cycle time of 3 s. Higher collision energy dissociation (HCD) fragmentation mode with a normalized collision energy of 35% was used in a scan range of 400–1600 m/z at a resolution of 60,000 at 200 m/z using the Orbitrap mass analyzer. Peptide charge states were set to 2–6, and a dynamic exclusion at 30 s, with a 10 ppm mass window, was used. Data acquisition was carried out in technical triplicates for both the biological replicates.
Database Search for Peptide and Protein Identification
MS raw data files were processed using Proteome Discoverer, version 2.2 (Thermo Fisher Scientific, Bremen, Germany). The data were searched against the human protein database RefSeq109 along with known contaminants (containing 81,096 entries and 116 contaminants), using SequestHT and MASCOT search algorithms. The search parameters were used as follows: a minimum peptide length of seven amino acids, with trypsin as the proteolytic enzyme and one missed cleavage. Precursor and fragment level mass tolerances were set at 10 ppm and 0.05 Da, respectively. TMT-modification at the peptide N-terminus and lysine residues and carbamidomethylation of cysteine were set as fixed modifications. Oxidation of methionine, protein N-terminal acetylation, was set as a dynamic modification. The percolator node in the consensus workflow was used to compute the false discovery rate (FDR), applied at 1% at the peptide and PSM level. Data normalization was carried out on the total peptide amount using Proteome Discoverer.
Data Analysis
The results file from Proteome Discoverer was used for further analysis. Perseus80 was used for PCA, computing the FC, and its respective logarithmic value at base-2 (log2 FC), which was used for calculating the p-value and Benjamini–Hochberg FDR-corrected p-value, that is, the q-value. Morpheus, Broad Institute (https://software.broadinstitute.org/morpheus/), was used for generating heat maps. Sankey diagram was generated using an online Sankey generator (http://sankey-diagram-generator.acquireprocure.com/). Proteins were classified and categorized based on Gene Ontology analysis using FunRich81 and pathway analysis using Enrichr (https://amp.pharm.mssm.edu/Enrichr/)82 and Reactome83 online tools. The proteins identified were also classified based on comparison with databases such as MitoCarta, version 2.0,84 The Autophagy Database,85 and the E3-ligases Database.63 PPI network analysis was carried out with STRING.86
Data Records
The MS raw data and the Proteome Discoverer-searched data were submitted to the ProteomeXchange Consortium (http://proteomecentral.proteomexchange.org) via the PRIDE repository87 with the data set identifier PXD019672.
Acknowledgments
The authors thank Karnataka Biotechnology and Information Technology Services (KBITS), Government of Karnataka, for support to the Center for Systems Biology and Molecular Medicine at Yenepoya (Deemed to be University), Mangalore, under the Biotechnology Skill Enhancement Programme in Multiomics Technology (BiSEP GO ITD 02MDA2017). The authors thank Yenepoya (Deemed to be University) for access to instrumentation and providing financial assistance as a seed grant (YU/Seed grant/077-2019). G.K. was a recipient of Senior Research Fellowship from the Council of Scientific & Industrial Research (CSIR), Government of India (2014-2019), and is currently a recipient of KSTePs DST-Ph.D. Fellowship from Department of Science and Technology-Karnataka Science and Technology Promotion Society, Government of Karnataka (2020-2021). M.A.N. is a recipient of Senior Research Fellowship from the University Grants Commission, Government of India.
Glossary
Abbreviations
- PD
Parkinson’s disease
- ERK-1/2
extra cellular signal-regulated kinase-1/2
- ER
endoplasmic reticulum
- SNPc
substantia nigra pars compacta
- SNCA
α-synuclein
- PARK
parkin
- LRRK
leucine-rich repeat kinases
- MPTP
1-methyl-4-phenyl-1,2,3,6-tetrahydropyridine
- cl_Cas3
cleaved caspase-3
- TH
tyrosine hydroxylase
- SOD1
superoxide dismutase 1
- PHDA1
pyruvate dehydrogenase E1 subunit α 1
- CS
citrate synthase
- IDH1
isocitrate dehydrogenase 1
- VDAC1
voltage-dependent anion-selective channel protein 1
- AIFM1
apoptosis-inducing factor mitochondrial 1
- OxPhos
oxidative phosphorylation
- TCA
tricarboxylic acid
- CDP-DAG
cytidine diphosphate diacylglycerol
- UPR
unfolded protein response
- ROS
reactive oxygen species
- DCFDA
2′,7′-dichlorodihydrofluorescein
- TF
transcription factors
- FC
fold change
- FDR
false discovery rate
- TMT
tandem mass tags
- HCD
higher collision energy dissociation
- LC
liquid chromatography
- MS
mass spectrometry
- MS/MS
tandem mass spectrometry
- ACN
acetonitrile
Supporting Information Available
The Supporting Information is available free of charge at https://pubs.acs.org/doi/10.1021/acsomega.0c03420.
Western blotting analysis showing the expression of TH after differentiation with retinoic acid treatment, bar graph showing the densitometry analysis of tyrosine hydroxylase expression, cell cytotoxicity analysis with different concentrations of rotenone at 24 and 48 h, and cell cytotoxicity analysis with different concentrations of Yashtimadhu choorna extract at 48 h; list of proteins identified and their respective abundances; identification of transcription factors regulating proteins differentially expressed with rotenone; identification of transcription factors regulating proteins differentially expressed with Yashtimadhu choorna extract cotreatment; PPI analysis using STRING; and lead metabolites identified in Yashtimadhu choorna (PDF)
Author Contributions
T.S.K.P., R.P., and P.K.M. conceived the idea and designed and planned the experiments. G.K. performed the experiments, sample preparation, data analysis, drafting of the manuscript, and preparation of figures. M.A.N. performed the mass spectrometry data acquisition and participated in data analysis. S.K.P. participated in data analysis. R.P., a practicing Ayurveda clinician, procured the samples and authentically confirmed them. T.S.K.P. and P.K.M. critically reviewed and edited the manuscript. All authors read and approved the final version of the manuscript.
The authors declare no competing financial interest.
Supplementary Material
References
- Poewe W.; Seppi K.; Tanner C. M.; Halliday G. M.; Brundin P.; Volkmann J.; Schrag A. E.; Lang A. E. Parkinson disease. Nat. Rev. Dis. Primers 2017, 3, 17013. 10.1038/nrdp.2017.13. [DOI] [PubMed] [Google Scholar]
- Fujita K. A.; Ostaszewski M.; Matsuoka Y.; Ghosh S.; Glaab E.; Trefois C.; Crespo I.; Perumal T. M.; Jurkowski W.; Antony P. M. A.; Diederich N.; Buttini M.; Kodama A.; Satagopam V. P.; Eifes S.; Del Sol A.; Schneider R.; Kitano H.; Balling R. Integrating pathways of Parkinson’s disease in a molecular interaction map. Mol. Neurobiol. 2014, 49, 88–102. 10.1007/s12035-013-8489-4. [DOI] [PMC free article] [PubMed] [Google Scholar]
- Maiti P.; Manna J.; Dunbar G. L. Current understanding of the molecular mechanisms in Parkinson’s disease: Targets for potential treatments. Transl. Neurodegener. 2017, 6, 28. 10.1186/s40035-017-0099-z. [DOI] [PMC free article] [PubMed] [Google Scholar]
- Chotibut T.; Meadows S.; Kasanga E. A.; McInnis T.; Cantu M. A.; Bishop C.; Salvatore M. F. Ceftriaxone reduces L-dopa-induced dyskinesia severity in 6-hydroxydopamine parkinson’s disease model. Mov. Disord. 2017, 32, 1547–1556. 10.1002/mds.27077. [DOI] [PMC free article] [PubMed] [Google Scholar]
- Ghaffari B. D.; Kluger B. Mechanisms for alternative treatments in Parkinson’s disease: acupuncture, tai chi, and other treatments. Curr. Neurol. Neurosci. Rep. 2014, 14, 451. 10.1007/s11910-014-0451-y. [DOI] [PubMed] [Google Scholar]
- Das D.; Chandola H.; Agarwal S. Protective effect of Yashtimadhu (Glycyrrhiza glabra) against side effects of radiation/chemotherapy in head and neck malignancies. Ayu 2011, 32, 196–199. 10.4103/0974-8520.92579. [DOI] [PMC free article] [PubMed] [Google Scholar]
- Payyappallimana U.; Venkatasubramanian P. Exploring Ayurvedic Knowledge on Food and Health for Providing Innovative Solutions to Contemporary Healthcare. Front. Public Health 2016, 4, 57. 10.3389/fpubh.2016.00057. [DOI] [PMC free article] [PubMed] [Google Scholar]
- Kulkarni R.; Girish K.; Kumar A. Nootropic herbs (Medhya Rasayana) in Ayurveda: An update. Pharmacogn. Rev. 2012, 6, 147–153. 10.4103/0973-7847.99949. [DOI] [PMC free article] [PubMed] [Google Scholar]
- Singh R. H.; Narsimhamurthy K.; Singh G. Neuronutrient impact of Ayurvedic Rasayana therapy in brain aging. Biogerontology 2008, 9, 369–374. 10.1007/s10522-008-9185-z. [DOI] [PubMed] [Google Scholar]
- Kumar V. Potential medicinal plants for CNS disorders: an overview. Phytother Res. 2006, 20, 1023–1035. 10.1002/ptr.1970. [DOI] [PubMed] [Google Scholar]
- Sarokte A. S.; Rao M. V. Effects of Medhya Rasayana and Yogic practices in improvement of short-term memory among school-going children. Ayu 2013, 34, 383–389. 10.4103/0974-8520.127720. [DOI] [PMC free article] [PubMed] [Google Scholar]
- Hosseinzadeh H.; Nassiri-Asl M. Pharmacological Effects of Glycyrrhiza spp. and Its Bioactive Constituents: Update and Review. Phytother Res. 2015, 29, 1868–1886. 10.1002/ptr.5487. [DOI] [PubMed] [Google Scholar]
- Hwang I.-k.; Lim S.-s.; Choi K.-h.; Yoo K.-y.; Shin H.-k.; Kim E.-j.; Yoon-Park J.-h.; Kang T.-c.; Kim Y.-s.; Kwon D.-y.; Kim D.-w.; Moon W.-k.; Won M.-h. Neuroprotective effects of roasted licorice, not raw form, on neuronal injury in gerbil hippocampus after transient forebrain ischemia. Acta Pharmacol. Sin. 2006, 27, 959–965. 10.1111/j.1745-7254.2006.00346.x. [DOI] [PubMed] [Google Scholar]
- Shen B.; Truong J.; Helliwell R.; Govindaraghavan S.; Sucher N. J. An in vitro study of neuroprotective properties of traditional Chinese herbal medicines thought to promote healthy ageing and longevity. BMC Complementary Altern. Med. 2013, 13, 373. 10.1186/1472-6882-13-373. [DOI] [PMC free article] [PubMed] [Google Scholar]
- Yu X.-Y.; Lin S.-G.; Zhou Z.-W.; Chen X.; Liang J.; Yu X.-Q.; Chowbay B.; Wen J.-Y.; Duan W.; Chan E.; Li X.-T.; Cao J.; Li C.-G.; Xue C. C.; Zhou S.-F. Role of P-glycoprotein in limiting the brain penetration of glabridin, an active isoflavan from the root of Glycyrrhiza glabra. Pharm. Res. 2007, 24, 1668–1690. 10.1007/s11095-007-9297-1. [DOI] [PubMed] [Google Scholar]
- Dhingra D.; Sharma A. Antidepressant-like activity of Glycyrrhiza glabra L. in mouse models of immobility tests. Prog. Neuro-Psychopharmacol. Biol. Psychiatry 2006, 30, 449–454. 10.1016/j.pnpbp.2005.11.019. [DOI] [PubMed] [Google Scholar]
- Martins N.; Dueñas L.; Santos-Buelga C.; Ferreira I. C. F. R. Characterization of phenolic compounds and antioxidant properties of Glycyrrhiza glabra L. rhizomes and roots. RSC Adv. 2015, 5, 26991–26997. 10.1039/c5ra03963k. [DOI] [Google Scholar]
- Sheshagiri S.; Patel K.; Rajagopala S. Randomized placebo-controlled clinical study on enhancement of Medha (intelligence quotient) in school going children with Yahstimadhu granules. Ayu 2015, 36, 56–62. 10.4103/0974-8520.169011. [DOI] [PMC free article] [PubMed] [Google Scholar]
- Fanning S.; Selkoe D.; Dettmer U. Parkinson’s disease: proteinopathy or lipidopathy?. npj Parkinson’s Dis. 2020, 6, 3. 10.1038/s41531-019-0103-7. [DOI] [PMC free article] [PubMed] [Google Scholar]
- Ganguly G.; Chakrabarti S.; Chatterjee U.; Saso L. Proteinopathy, oxidative stress and mitochondrial dysfunction: cross talk in Alzheimer’s disease and Parkinson’s disease. Drug Des. Dev. Ther. 2017, 11, 797–810. 10.2147/dddt.s130514. [DOI] [PMC free article] [PubMed] [Google Scholar]
- Konnova E. A.; Swanberg M.. Animal Models of Parkinson’s Disease. In Parkinson’s Disease: Pathogenesis and Clinical Aspects; Stoker T. B., Greenland J. C., Eds.; Codon Publications: Brisbane, AU, 2018. [Google Scholar]
- Raza C.; Anjum R.; Shakeel N. U. A. Parkinson’s disease: Mechanisms, translational models and management strategies. Life Sci. 2019, 226, 77–90. 10.1016/j.lfs.2019.03.057. [DOI] [PubMed] [Google Scholar]
- Falkenburger B. H.; Saridaki T.; Dinter E. Cellular models for Parkinson’s disease. J. Neurochem. 2016, 139, 121–130. 10.1111/jnc.13618. [DOI] [PubMed] [Google Scholar]
- Ferrari E.; Cardinale A.; Picconi B.; Gardoni F. From cell lines to pluripotent stem cells for modelling Parkinson’s Disease. J. Neurosci. Methods 2020, 340, 108741. 10.1016/j.jneumeth.2020.108741. [DOI] [PubMed] [Google Scholar]
- Li N.; Ragheb K.; Lawler G.; Sturgis J.; Rajwa B.; Melendez J. A.; Robinson J. P. Mitochondrial complex I inhibitor rotenone induces apoptosis through enhancing mitochondrial reactive oxygen species production. J. Biol. Chem. 2003, 278, 8516–8525. 10.1074/jbc.m210432200. [DOI] [PubMed] [Google Scholar]
- Ikram F.; Ackermann S.; Kahlert Y.; Volland R.; Roels F.; Engesser A.; Hertwig F.; Kocak H.; Hero B.; Dreidax D.; Henrich K.-O.; Berthold F.; Nürnberg P.; Westermann F.; Fischer M. Transcription factor activating protein 2 beta (TFAP2B) mediates noradrenergic neuronal differentiation in neuroblastoma. Mol. Oncol. 2016, 10, 344–359. 10.1016/j.molonc.2015.10.020. [DOI] [PMC free article] [PubMed] [Google Scholar]
- Kotapalli S. S.; Dasari C.; Duscharla D.; Kami Reddy K. R.; Kasula M.; Ummanni R. All-Trans-Retinoic Acid Stimulates Overexpression of Tumor Protein D52 (TPD52, Isoform 3) and Neuronal Differentiation of IMR-32 Cells. J. Cell. Biochem. 2017, 118, 4358–4369. 10.1002/jcb.26090. [DOI] [PubMed] [Google Scholar]
- Chaudhari N.; Talwar P.; Lefebvre D’hellencourt C.; Ravanan P. CDDO and ATRA Instigate Differentiation of IMR32 Human Neuroblastoma Cells. Front. Mol. Neurosci. 2017, 10, 310. 10.3389/fnmol.2017.00310. [DOI] [PMC free article] [PubMed] [Google Scholar]
- Sai Y.; Chen J.; Wu Q.; Liu H.; Zhao J.; Dong Z. Phosphorylated-ERK 1/2 and neuronal degeneration induced by rotenone in the hippocampus neurons. Environ. Toxicol. Pharmacol. 2009, 27, 366–372. 10.1016/j.etap.2008.12.004. [DOI] [PubMed] [Google Scholar]
- Song J.-X.; Choi M. Y.-M.; Wong K. C.-K.; Chung W. W.-Y.; Sze S. C.-W.; Ng T.-B.; Zhang K. Y.-B. Baicalein antagonizes rotenone-induced apoptosis in dopaminergic SH-SY5Y cells related to Parkinsonism. Chin. Med. 2012, 7, 1. 10.1186/1749-8546-7-1. [DOI] [PMC free article] [PubMed] [Google Scholar]
- Thomas S. N.; Friedrich B.; Schnaubelt M.; Chan D. W.; Zhang H.; Aebersold R. Orthogonal Proteomic Platforms and Their Implications for the Stable Classification of High-Grade Serous Ovarian Cancer Subtypes. iScience 2020, 23, 101079. 10.1016/j.isci.2020.101079. [DOI] [PMC free article] [PubMed] [Google Scholar]
- Kumar S.; Kumar M.; Ekka R.; Dvorin J. D.; Paul A. S.; Madugundu A. K.; Gilberger T.; Gowda H.; Duraisingh M. T.; Keshava Prasad T. S.; Sharma P. PfCDPK1 mediated signaling in erythrocytic stages of Plasmodium falciparum. Nat. Commun. 2017, 8, 63. 10.1038/s41467-017-00053-1. [DOI] [PMC free article] [PubMed] [Google Scholar]
- Saul M. J.; Hegewald A. B.; Emmerich A. C.; Ossipova E.; Vogel M.; Baumann I.; Kultima K.; Lengqivst J.; Steinhilber D.; Jakobsson P. J. Mass Spectrometry-Based Proteomics Approach Characterizes the Dual Functionality of miR-328 in Monocytes. Front. Pharmacol. 2019, 10, 640. 10.3389/fphar.2019.00640. [DOI] [PMC free article] [PubMed] [Google Scholar]
- Cheng Y.; Sun D.; Zhu B.; Zhou W.; Lv C.; Kou F.; Wei H.. Integrative metabolic and proteomic profiling of brainstem in spontaneously hypertensive rats. J. Proteome Res. 2020 [DOI] [PubMed] [Google Scholar]
- Hung C.-W.; Klein T.; Cassidy L.; Linke D.; Lange S.; Anders U.; Bureik M.; Heinzle E.; Schneider K.; Tholey A. Comparative Proteome Analysis in Schizosaccharomyces pombe Identifies Metabolic Targets to Improve Protein Production and Secretion. Mol. Cell. Proteomics 2016, 15, 3090–3106. 10.1074/mcp.m115.051474. [DOI] [PMC free article] [PubMed] [Google Scholar]
- Valdinocci D.; Simoes R. F.; Kovarova J.; Cunha-Oliveira T.; Neuzil J.; Pountney D. L. Intracellular and Intercellular Mitochondrial Dynamics in Parkinson’s Disease. Front. Neurosci. 2019, 13, 930. 10.3389/fnins.2019.00930. [DOI] [PMC free article] [PubMed] [Google Scholar]
- Colla E. Linking the Endoplasmic Reticulum to Parkinson’s Disease and Alpha-Synucleinopathy. Front. Neurosci. 2019, 13, 560. 10.3389/fnins.2019.00560. [DOI] [PMC free article] [PubMed] [Google Scholar]
- González-Casacuberta I.; Juarez-Flores D. L.; Moren C.; Garrabou G. Bioenergetics and Autophagic Imbalance in Patients-Derived Cell Models of Parkinson Disease Supports Systemic Dysfunction in Neurodegeneration. Front. Neurosci. 2019, 13, 894. 10.3389/fnins.2019.00894. [DOI] [PMC free article] [PubMed] [Google Scholar]
- Mader B. J.; Pivtoraiko V. N.; Flippo H. M.; Klocke B. J.; Roth K. A.; Mangieri L. R.; Shacka J. J. Rotenone inhibits autophagic flux prior to inducing cell death. ACS Chem. Neurosci. 2012, 3, 1063–1072. 10.1021/cn300145z. [DOI] [PMC free article] [PubMed] [Google Scholar]
- Goswami P.; Gupta S.; Biswas J.; Sharma S.; Singh S. Endoplasmic Reticulum Stress Instigates the Rotenone Induced Oxidative Apoptotic Neuronal Death: a Study in Rat Brain. Mol. Neurobiol. 2016, 53, 5384–5400. 10.1007/s12035-015-9463-0. [DOI] [PubMed] [Google Scholar]
- Satoh T.; Enokido Y.; Aoshima H.; Uchiyama Y.; Hatanaka H. Changes in mitochondrial membrane potential during oxidative stress-induced apoptosis in PC12 cells. J. Neurosci. Res. 1997, 50, 413–420. 10.1002/(sici)1097-4547(19971101)50:3<413::aid-jnr7>3.0.co;2-l. [DOI] [PubMed] [Google Scholar]
- Simunovic F.; Yi M.; Wang Y.; Macey L.; Brown L. T.; Krichevsky A. M.; Andersen S. L.; Stephens R. M.; Benes F. M.; Sonntag K. C. Gene expression profiling of substantia nigra dopamine neurons: further insights into Parkinson’s disease pathology. Brain 2009, 132, 1795–1809. 10.1093/brain/awn323. [DOI] [PMC free article] [PubMed] [Google Scholar]
- Doktór B.; Damulewicz M.; Pyza E. Overexpression of Mitochondrial Ligases Reverses Rotenone-Induced Effects in a Drosophila Model of Parkinson’s Disease. Front. Neurosci. 2019, 13, 94. 10.3389/fnins.2019.00094. [DOI] [PMC free article] [PubMed] [Google Scholar]
- García-Aguilar A.; Cuezva J. M. A Review of the Inhibition of the Mitochondrial ATP Synthase by IF1 in vivo: Reprogramming Energy Metabolism and Inducing Mitohormesis. Front. Physiol. 2018, 9, 1322. 10.3389/fphys.2018.01322. [DOI] [PMC free article] [PubMed] [Google Scholar]
- Shah D. I.; Takahashi-Makise N.; Cooney J. D.; Li L.; Schultz I. J.; Pierce E. L.; Narla A.; Seguin A.; Hattangadi S. M.; Medlock A. E.; Langer N. B.; Dailey T. A.; Hurst S. N.; Faccenda D.; Wiwczar J. M.; Heggers S. K.; Vogin G.; Chen W.; Chen C.; Campagna D. R.; Brugnara C.; Zhou Y.; Ebert B. L.; Danial N. N.; Fleming M. D.; Ward D. M.; Campanella M.; Dailey H. A.; Kaplan J.; Paw B. H. Mitochondrial Atpif1 regulates haem synthesis in developing erythroblasts. Nature 2012, 491, 608–612. 10.1038/nature11536. [DOI] [PMC free article] [PubMed] [Google Scholar]
- Formentini L.; Sánchez-Aragó M.; Sánchez-Cenizo L.; Cuezva J. M. The mitochondrial ATPase inhibitory factor 1 triggers a ROS-mediated retrograde prosurvival and proliferative response. Mol. Cell 2012, 45, 731–742. 10.1016/j.molcel.2012.01.008. [DOI] [PubMed] [Google Scholar]
- Bie A. S.; Fernandez-Guerra P.; Birkler R. I.; Nisemblat S.; Pelnena D.; Lu X.; Deignan J. L.; Lee H.; Dorrani N.; Corydon T. J.; Palmfeldt J.; Bivina L.; Azem A.; Herman K.; Bross P. Effects of a Mutation in the HSPE1 Gene Encoding the Mitochondrial Co-chaperonin HSP10 and Its Potential Association with a Neurological and Developmental Disorder. Front. Mol. Biosci. 2016, 3, 65. 10.3389/fmolb.2016.00065. [DOI] [PMC free article] [PubMed] [Google Scholar]
- Kennedy D.; Jäger R.; Mosser D. D.; Samali A. Regulation of apoptosis by heat shock proteins. IUBMB Life 2014, 66, 327–338. 10.1002/iub.1274. [DOI] [PubMed] [Google Scholar]
- Samali A.; Cai J.; Zhivotovsky B.; Jones D. P.; Orrenius S. Presence of a pre-apoptotic complex of pro-caspase-3, Hsp60 and Hsp10 in the mitochondrial fraction of jurkat cells. EMBO J. 1999, 18, 2040–2048. 10.1093/emboj/18.8.2040. [DOI] [PMC free article] [PubMed] [Google Scholar]
- Bradley R. M.; Marvyn P. M.; Aristizabal Henao J. J.; Mardian E. B.; George S.; Aucoin M. G.; Stark K. D.; Duncan R. E. Acylglycerophosphate acyltransferase 4 (AGPAT4) is a mitochondrial lysophosphatidic acid acyltransferase that regulates brain phosphatidylcholine, phosphatidylethanolamine, and phosphatidylinositol levels. Biochim. Biophys. Acta, Mol. Cell Biol. Lipids 2015, 1851, 1566–1576. 10.1016/j.bbalip.2015.09.005. [DOI] [PubMed] [Google Scholar]
- Takeuchi K.; Reue K. Biochemistry, physiology, and genetics of GPAT, AGPAT, and lipin enzymes in triglyceride synthesis. Am. J. Physiol. Endocrinol. Metab. 2009, 296, E1195–E1209. 10.1152/ajpendo.90958.2008. [DOI] [PMC free article] [PubMed] [Google Scholar]
- Alecu I.; Bennett S. A. L. Dysregulated Lipid Metabolism and Its Role in alpha-Synucleinopathy in Parkinson’s Disease. Front. Neurosci. 2019, 13, 328. 10.3389/fnins.2019.00328. [DOI] [PMC free article] [PubMed] [Google Scholar]
- Cheng D.; Jenner A. M.; Shui G.; Cheong W. F.; Mitchell T. W.; Nealon J. R.; Kim W. S.; McCann H.; Wenk M. R.; Halliday G. M.; Garner B. Lipid pathway alterations in Parkinson’s disease primary visual cortex. PLoS One 2011, 6, e17299 10.1371/journal.pone.0017299. [DOI] [PMC free article] [PubMed] [Google Scholar]
- Worth A. J.; Basu S. S.; Snyder N. W.; Mesaros C.; Blair I. A. Inhibition of neuronal cell mitochondrial complex I with rotenone increases lipid beta-oxidation, supporting acetyl-coenzyme A levels. J. Biol. Chem. 2014, 289, 26895–26903. 10.1074/jbc.m114.591354. [DOI] [PMC free article] [PubMed] [Google Scholar]
- Schwarz D. S.; Blower M. D. The endoplasmic reticulum: structure, function and response to cellular signaling. Cell. Mol. Life Sci. 2016, 73, 79–94. 10.1007/s00018-015-2052-6. [DOI] [PMC free article] [PubMed] [Google Scholar]
- Walter P.; Ron D. The unfolded protein response: from stress pathway to homeostatic regulation. Science 2011, 334, 1081–1086. 10.1126/science.1209038. [DOI] [PubMed] [Google Scholar]
- Matus S.; Lisbona F.; Torres M.; Leon C.; Thielen P.; Hetz C. The stress rheostat: an interplay between the unfolded protein response (UPR) and autophagy in neurodegeneration. Curr. Mol. Med. 2008, 8, 157–172. 10.2174/156652408784221324. [DOI] [PubMed] [Google Scholar]
- Li H.; Chen Q.; Liu F.; Zhang X.; Li W.; Liu S.; Zhao Y.; Gong Y.; Yan C. Unfolded protein response and activated degradative pathways regulation in GNE myopathy. PLoS One 2013, 8, e58116 10.1371/journal.pone.0058116. [DOI] [PMC free article] [PubMed] [Google Scholar]
- Dunlop E. A.; Hunt D. K.; Acosta-Jaquez H. A.; Fingar D. C.; Tee A. R. ULK1 inhibits mTORC1 signaling, promotes multisite Raptor phosphorylation and hinders substrate binding. Autophagy 2011, 7, 737–747. 10.4161/auto.7.7.15491. [DOI] [PMC free article] [PubMed] [Google Scholar]
- Kim J.; Kundu M.; Viollet B.; Guan K.-L. AMPK and mTOR regulate autophagy through direct phosphorylation of Ulk1. Nat. Cell Biol. 2011, 13, 132–141. 10.1038/ncb2152. [DOI] [PMC free article] [PubMed] [Google Scholar]
- Cohen-Kaplan V.; Livneh I.; Avni N.; Fabre B.; Ziv T.; Kwon Y. T.; Ciechanover A. p62- and ubiquitin-dependent stress-induced autophagy of the mammalian 26S proteasome. Proc. Natl. Acad. Sci. U.S.A. 2016, 113, E7490–E7499. 10.1073/pnas.1615455113. [DOI] [PMC free article] [PubMed] [Google Scholar]
- Kocaturk N. M.; Gozuacik D. Crosstalk Between Mammalian Autophagy and the Ubiquitin-Proteasome System. Front. Cell. Dev. Biol. 2018, 6, 128. 10.3389/fcell.2018.00128. [DOI] [PMC free article] [PubMed] [Google Scholar]
- Medvar B.; Raghuram V.; Pisitkun T.; Sarkar A.; Knepper M. A. Comprehensive database of human E3 ubiquitin ligases: application to aquaporin-2 regulation. Physiol. Genom. 2016, 48, 502–512. 10.1152/physiolgenomics.00031.2016. [DOI] [PMC free article] [PubMed] [Google Scholar]
- Choo Y. S.; Vogler G.; Wang D.; Kalvakuri S.; Iliuk A.; Tao W. A.; Bodmer R.; Zhang Z. Regulation of parkin and PINK1 by neddylation. Hum. Mol. Genet. 2012, 21, 2514–2523. 10.1093/hmg/dds070. [DOI] [PMC free article] [PubMed] [Google Scholar]
- Lamark T.; Johansen T. Aggrephagy: selective disposal of protein aggregates by macroautophagy. Int. J. Cell Biol. 2012, 2012, 736905. 10.1155/2012/736905. [DOI] [PMC free article] [PubMed] [Google Scholar]
- Lim J.; Yue Z. Neuronal aggregates: formation, clearance, and spreading. Dev. Cell 2015, 32, 491–501. 10.1016/j.devcel.2015.02.002. [DOI] [PMC free article] [PubMed] [Google Scholar]
- Yu Q.; Huang Q.; Du X.; Xu S.; Li M.; Ma S. Early activation of Egr-1 promotes neuroinflammation and dopaminergic neurodegeneration in an experimental model of Parkinson’s disease. Exp. Neurol. 2018, 302, 145–154. 10.1016/j.expneurol.2018.01.009. [DOI] [PubMed] [Google Scholar]
- Xie B.; Wang C.; Zheng Z.; Song B.; Ma C.; Thiel G.; Li M. Egr-1 transactivates Bim gene expression to promote neuronal apoptosis. J. Neurosci. 2011, 31, 5032–5044. 10.1523/jneurosci.5504-10.2011. [DOI] [PMC free article] [PubMed] [Google Scholar]
- Zhang X.; Du L.; Zhang W.; Yang Y.; Zhou Q.; Du G. Therapeutic effects of baicalein on rotenone-induced Parkinson’s disease through protecting mitochondrial function and biogenesis. Sci. Rep. 2017, 7, 9968. 10.1038/s41598-017-07442-y. [DOI] [PMC free article] [PubMed] [Google Scholar]
- Iwata A.; Miura S.; Kanazawa I.; Sawada M.; Nukina N. alpha-Synuclein forms a complex with transcription factor Elk-1. J. Neurochem. 2001, 77, 239–252. 10.1046/j.1471-4159.2001.t01-1-00232.x. [DOI] [PubMed] [Google Scholar]
- Shoshan-Barmatz V.; De Pinto V.; Zweckstetter M.; Raviv Z.; Keinan N.; Arbel N. VDAC, a multi-functional mitochondrial protein regulating cell life and death. Mol. Aspect. Med. 2010, 31, 227–285. 10.1016/j.mam.2010.03.002. [DOI] [PubMed] [Google Scholar]
- Kemter E.; Frohlich T.; Arnold G. J.; Wolf E.; Wanke R. Mitochondrial Dysregulation Secondary to Endoplasmic Reticulum Stress in Autosomal Dominant Tubulointerstitial Kidney Disease - UMOD (ADTKD-UMOD). Sci. Rep. 2017, 7, 42970. 10.1038/srep42970. [DOI] [PMC free article] [PubMed] [Google Scholar]
- Yang Z.; Wang Y.; Zhang Y.; He X.; Zhong C.-Q.; Ni H.; Chen X.; Liang Y.; Wu J.; Zhao S.; Zhou D.; Han J. RIP3 targets pyruvate dehydrogenase complex to increase aerobic respiration in TNF-induced necroptosis. Nat. Cell Biol. 2018, 20, 186–197. 10.1038/s41556-017-0022-y. [DOI] [PubMed] [Google Scholar]
- Djoumbou-Feunang Y.; Pon A.; Karu N.; Zheng J.; Li C.; Arndt D.; Gautam M.; Allen F.; Wishart D. S. CFM-ID 3.0: Significantly Improved ESI-MS/MS Prediction and Compound Identification. Metabolites 2019, 9, 72. 10.3390/metabo9040072. [DOI] [PMC free article] [PubMed] [Google Scholar]
- Bose B.; Kapoor S.; Sen U.; Nihad As M.; Chaudhury D.; Shenoy S. Assessment of Oxidative Damage in the Primary Mouse Ocular Surface Cells/Stem Cells in Response to Ultraviolet-C (UV-C) Damage. J. Vis. Exp. 2020, 156, e59924 10.3791/59924. [DOI] [PubMed] [Google Scholar]
- Schneider C. A.; Rasband W. S.; Eliceiri K. W. NIH Image to ImageJ: 25 years of image analysis. Nat. Methods 2012, 9, 671–675. 10.1038/nmeth.2089. [DOI] [PMC free article] [PubMed] [Google Scholar]
- Modi P. K.; Komaravelli N.; Singh N.; Sharma P. Interplay between MEK-ERK signaling, cyclin D1, and cyclin-dependent kinase 5 regulates cell cycle reentry and apoptosis of neurons. Mol. Biol. Cell 2012, 23, 3722–3730. 10.1091/mbc.e12-02-0125. [DOI] [PMC free article] [PubMed] [Google Scholar]
- Subbannayya Y.; Mir S. A.; Renuse S.; Manda S. S.; Pinto S. M.; Puttamallesh V. N.; Solanki H. S.; Manju H. C.; Syed N.; Sharma R.; Christopher R.; Vijayakumar M.; Veerendra Kumar K. V.; Keshava Prasad T. S.; Ramaswamy G.; Kumar R. V.; Chatterjee A.; Pandey A.; Gowda H. Identification of differentially expressed serum proteins in gastric adenocarcinoma. J. Proteomics 2015, 127, 80–88. 10.1016/j.jprot.2015.04.021. [DOI] [PMC free article] [PubMed] [Google Scholar]
- Subbannayya Y.; Syed N.; Barbhuiya M. A.; Raja R.; Marimuthu A.; Sahasrabuddhe N.; Pinto S. M.; Manda S. S.; Renuse S.; Manju H.; Zameer M. A. L.; Sharma J.; Brait M.; Srikumar K.; Roa J. C.; Vijaya Kumar M.; Kumar K. V.; Prasad T. K.; Ramaswamy G.; Kumar R. V.; Pandey A.; Gowda H.; Chatterjee A. Calcium calmodulin dependent kinase kinase 2 - a novel therapeutic target for gastric adenocarcinoma. Canc. Biol. Ther. 2015, 16, 336–345. 10.4161/15384047.2014.972264. [DOI] [PMC free article] [PubMed] [Google Scholar]
- Tyanova S.; Temu T.; Sinitcyn P.; Carlson A.; Hein M. Y.; Geiger T.; Mann M.; Cox J. The Perseus computational platform for comprehensive analysis of (prote)omics data. Nat. Methods 2016, 13, 731–740. 10.1038/nmeth.3901. [DOI] [PubMed] [Google Scholar]
- Pathan M.; Keerthikumar S.; Ang C.-S.; Gangoda L.; Quek C. Y. J.; Williamson N. A.; Mouradov D.; Sieber O. M.; Simpson R. J.; Salim A.; Bacic A.; Hill A. F.; Stroud D. A.; Ryan M. T.; Agbinya J. I.; Mariadason J. M.; Burgess A. W.; Mathivanan S. FunRich: An open access standalone functional enrichment and interaction network analysis tool. Proteomics 2015, 15, 2597–2601. 10.1002/pmic.201400515. [DOI] [PubMed] [Google Scholar]
- Kuleshov M. V.; Jones M. R.; Rouillard A. D.; Fernandez N. F.; Duan Q.; Wang Z.; Koplev S.; Jenkins S. L.; Jagodnik K. M.; Lachmann A.; McDermott M. G.; Monteiro C. D.; Gundersen G. W.; Ma’ayan A. Enrichr: a comprehensive gene set enrichment analysis web server 2016 update. Nucleic Acids Res. 2016, 44, W90–W97. 10.1093/nar/gkw377. [DOI] [PMC free article] [PubMed] [Google Scholar]
- Jassal B.; Matthews L.; Viteri G.; Gong C.; Lorente P.; Fabregat A.; Sidiropoulos K.; Cook J.; Gillespie M.; Haw R.; Loney F.; May B.; Milacic M.; Rothfels K.; Sevilla C.; Shamovsky V.; Shorser S.; Varusai T.; Weiser J.; Wu G.; Stein L.; Hermjakob H.; D’Eustachio P. The reactome pathway knowledgebase. Nucleic Acids Res. 2020, 48, D498–D503. 10.1093/nar/gkz1031. [DOI] [PMC free article] [PubMed] [Google Scholar]
- Calvo S. E.; Clauser K. R.; Mootha V. K. MitoCarta2.0: an updated inventory of mammalian mitochondrial proteins. Nucleic Acids Res. 2016, 44, D1251–D1257. 10.1093/nar/gkv1003. [DOI] [PMC free article] [PubMed] [Google Scholar]
- Homma K.; Suzuki K.; Sugawara H. The Autophagy Database: an all-inclusive information resource on autophagy that provides nourishment for research. Nucleic Acids Res. 2011, 39, D986–D990. 10.1093/nar/gkq995. [DOI] [PMC free article] [PubMed] [Google Scholar]
- Szklarczyk D.; Gable A. L.; Lyon D.; Junge A.; Wyder S.; Huerta-Cepas J.; Simonovic M.; Doncheva N. T.; Morris J. H.; Bork P.; Jensen L. J.; Mering C. V. STRING v11: protein-protein association networks with increased coverage, supporting functional discovery in genome-wide experimental datasets. Nucleic Acids Res. 2019, 47, D607–D613. 10.1093/nar/gky1131. [DOI] [PMC free article] [PubMed] [Google Scholar]
- Vizcaíno J. A.; Csordas A.; del-Toro N.; Dianes J. A.; Griss J.; Lavidas I.; Mayer G.; Perez-Riverol Y.; Reisinger F.; Ternent T.; Xu Q.-W.; Wang R.; Hermjakob H. 2016 update of the PRIDE database and its related tools. Nucleic Acids Res. 2016, 44, D447–D456. 10.1093/nar/gkv1145. [DOI] [PMC free article] [PubMed] [Google Scholar]
Associated Data
This section collects any data citations, data availability statements, or supplementary materials included in this article.