

Abstract
Obesity is a current threat to health care systems, affecting approximately 13% of the world’s adult population, and over 18% children and adolescents. The rise of obesity is fuelled by inadequate life style habits, as consumption of diets rich in fats and sugars which promote, additionally, the development of associated comorbidities. Obesity results from a neuroendocrine imbalance in the cerebral mechanisms controlling food intake and energy expenditure, including the hypothalamus and the reward and motivational centres. Specifically, high-fat diets are known to trigger an early inflammatory response in the hypothalamus that precedes weight gain, is time-dependent, and eventually extends to the remaining appetite regulating regions in the brain. Multiple magnetic resonance imaging (MRI) and spectroscopy (MRS) methods are currently available to characterize different features of cerebral obesity, including diffusion weighted, T2 and volumetric imaging and 1H and 13C spectroscopic evaluations. In particular, consistent evidences have revealed increased water diffusivity and T2 values, decreased grey matter volumes, and altered metabolic profiles and fluxes, in the brain of animal models and in obese humans. This review provides an integrative interpretation of the physio-pathological processes associated with obesity development in the brain, and the MRI and MRS methods implemented to characterize them.
Keywords: High-fat feeding, magnetic resonance imaging, magnetic resonance spectroscopy, neuro-inflammation, obesity, hypothalamus
Introduction
Obesity is a chronic disease associated to several burdening comorbidities such as type 2 diabetes (T2D), cardiovascular disease, hypertension and some types of cancer increasing additionally the risk of developing neurodegenerative disorders.1,2 The latest evaluations in the European Union (EU) indicate that overweight affects 30–70% of the individuals, and obesity develops in 10–30% of adults. In 2016, the World Health Organization (WHO) estimated that this pandemic syndrome caused approximately 3.4 million annual deaths, ranking 5th among the leading causes of worldwide death.3 On these grounds, obesity has become a major public health concern of our era, with estimated costs reaching 60 billion€ annually, for the EU only.4
Obesity is associated with a low-grade systemic inflammation response, characterized by abnormal cytokine production and activation of a network of ample inflammatory signalling pathways.5 Moreover, the complications emerging from the obese phenotype appear to be closely related to its inflammatory component.6 Obesity-induced inflammation affects multiple organs, including the pancreas, liver, cardiovascular system and the brain, eventually leading to the disruption of global metabolic homeostasis.7 In the last decade, the scientific community has accomplished important advances in the understanding of the brain changes associated with obesity onset and development. In particular, numerous studies with animal models of diet-induced obesity (DIO) revealed the activation of a specific inflammatory response in the hypothalamus, a key brain region regulating energy homeostasis and food intake, that precedes weight gain.8,9 The early inflammation response to HFDs appears to be mediated by the excess of circulating long-chain saturated fatty acids (SFAs), which cross the blood–brain barrier (BBB) and bind to specific neuronal populations in the hypothalamus.10 Subsequently, SFA binding activates downstream signalling pathways that lead to the expression of pro-inflammatory genes, non-neuronal reactive processes, an imbalance in the control of energy homeostasis, and the eventual development of leptin and insulin resistance.11 The localized inflammatory profile remains active, mainly, during the first two weeks of high-fat feeding, tends to disappear after three weeks of diet, and re-emerges in long-term HFD consumption.9
In mammals, energy expenditure and feeding regulation result from the integration of endocrine signals from various organs with the homeostatic system of the hypothalamus, and the motivational and rewarding circuitries12,13 (Figure 1). Noteworthy, strong obesity-induced neuroinflammatory responses have been observed in these areas,14,15 with concomitant deleterious effects reported in memory and cognitive performance, occurring more typically in advanced stages of obesity.16,17 Similarly, studies on obese patients and in DIO animal models described pathological effects at the neurovascular BBB, such as diet-induced increased permeability, potentially contributing to exacerbate the neuroinflammatory responses in these regions.18 Importantly, long-term effects of obesity include, additionally, irregularities in cerebral blood flow (CBF) that influence negatively the clinical outcomes of older populations,19 and link closely the obesity condition to other pathologies such as T2D, cognitive decline or even Alzheimer disease (AD).20
Figure 1.

Central and peripheral interactions regulating energy intake and expenditure. Appetite and energy expenditure are controlled by a complex feedback loop connecting endocrine signals from peripheral tissues with the brain. In the brain, the hypothalamus (yellow) senses these signals and regulates energy homeostasis. The hypothalamus is coupled to the cerebral circuitries encoding diverse behavioural mechanisms that influence food intake, such as motivational or hedonic feeding (blue and red traces). Motivational impulses are controlled by the mesocorticolimbic system (MCL), formed by the dopaminergic projections from the nucleus accumbens and ventral tegmental area (purple) to the prefrontal cortex (orange), hippocampus (pink) and basolateral amygdale. Hedonic or reward-based feeding circuitries are constituted by neuronal connections between the nucleus accumbens (purple), amygdala, and regions from the orbitofrontal cortex (orange). Adapted from Michaelides.13 Reproduced with permission from the publisher.
Numerous studies implementing imaging and spectroscopy techniques have revealed key features of the obesity progress – at different stages and brain regions – both in DIO animal models and in obese humans. Particularly, a variety of magnetic resonance imaging (MRI) approaches disclosed abnormalities in cerebral microstructure and function linked to the inflammatory process.9,21 On the other hand, magnetic resonance spectroscopy (MRS) methods evidenced substantial changes in brain metabolism during obesity development.22,23 In addition, a battery of techniques sensitive to CBF changes –such as single photon emission tomography (SPECT), positron emission tomography (PET), or arterial spin labelling (ASL) MRI – explored regional CBF irregularities in advanced stages of obesity.24,25 Finally, yet importantly, a few clinical studies are beginning to implement neuroimaging methods to evaluate changes occurring in the brain during the recovery of weight-loss surgeries, including bariatric surgery (BS).26 Typically, each imaging modality used focuses on a particular process – inflammation, metabolic or blood flow changes – but integrative studies providing a reproducible frame of results with unifying hypotheses and conclusions remain limited. In this sense, histochemical validations of the molecular, cellular or vascular events underlying the neuroimaging findings remain still necessary.
In this review, we provide a summary of the key molecular, cellular and physiological events associated with obesity development in the brain, together with a brief description of the corresponding neuroimaging and spectroscopy methods able to characterize them. Special emphasis is placed in studies attempting to decipher the initial stages of obesity development, including animal models of diet-induced obesity, as well as to disclose the main alterations of the cerebral microstructure in obese patients. Further information on the neurovascular components of obesity, more characteristic of chronically obese patients, can be found in the excellent reviews of Val-Laillet et al. and Pak et al.27,28
Molecular and physiological basis of high-fat diet induced hypothalamic inflammation
The hypothalamus is a key brain region regulating global energy homeostasis and appetite, two integrated processes matching energy intake and expenditure to promote metabolic stability through the amount of fuel stored as fat.29 The regulation of energy homeostasis relies on the melanocortin system, which consists of two functionally antagonistic neuronal populations, one expressing the orexigenic neuropeptides agouti-related peptide (AgRP) and neuropeptide Y (NPY), and the other, expressing the anorexigenic peptide pro-opiomelanocortin (POMC).30 Both neuronal subsets express high levels of receptors that bind circulating hormones and respond to metabolic cues such as nutrients, neurotransmitters and cytokines, playing determinant roles in the control of the energy status by the brain.31
Dietary fats have emerged in the last decade as key regulators of global energy balance.32 Ordinarily, the consumption of nutritionally equilibrated amounts of dietary fats results in the correct regulation of hypothalamic neurons; but overconsumption, however, as it occurs during HFD intake, leads inevitably to hypothalamic impairment. Particularly, experiments using DIO in rodents have demonstrated that diets rich in SFAs trigger the immediate transcription of inflammatory genes in the hypothalamus,9,33,34 and that their long-term exposure results in the activation of the endoplasmic reticulum (ER) stress responses35 and neuronal apoptosis.36 Mechanistically, the pro-inflammatory response is initiated by the excess of circulating long-chain SFAs, such as palmitate or stearate, which cross the BBB and bind to the POMC neurons in the arcuate nucleus (ARC) of the hypothalamus10 (Figure 2). Binding of long-chain SFAs activates the toll-like receptor 4 (TLR4)-mediated inflammatory signalling cascades via NF-κB activation, the inhibitor of κB kinase (IKK) complex.37 Particularly, the activation of NF-κB induces the expression of suppressor of cytokine signalling 3 (SOCS3) in AgRP neurons, followed by a wide-spread up-regulation in a broader hypothalamic area after prolonged HFD consumption.38 Subsequently, SOCS3 induces the inhibition of leptin and insulin signalling, eventually leading to hyperphagia, a defective control of energy homeostasis, and to the development of central and peripheral insulin and leptin resistance.39
Figure 2.
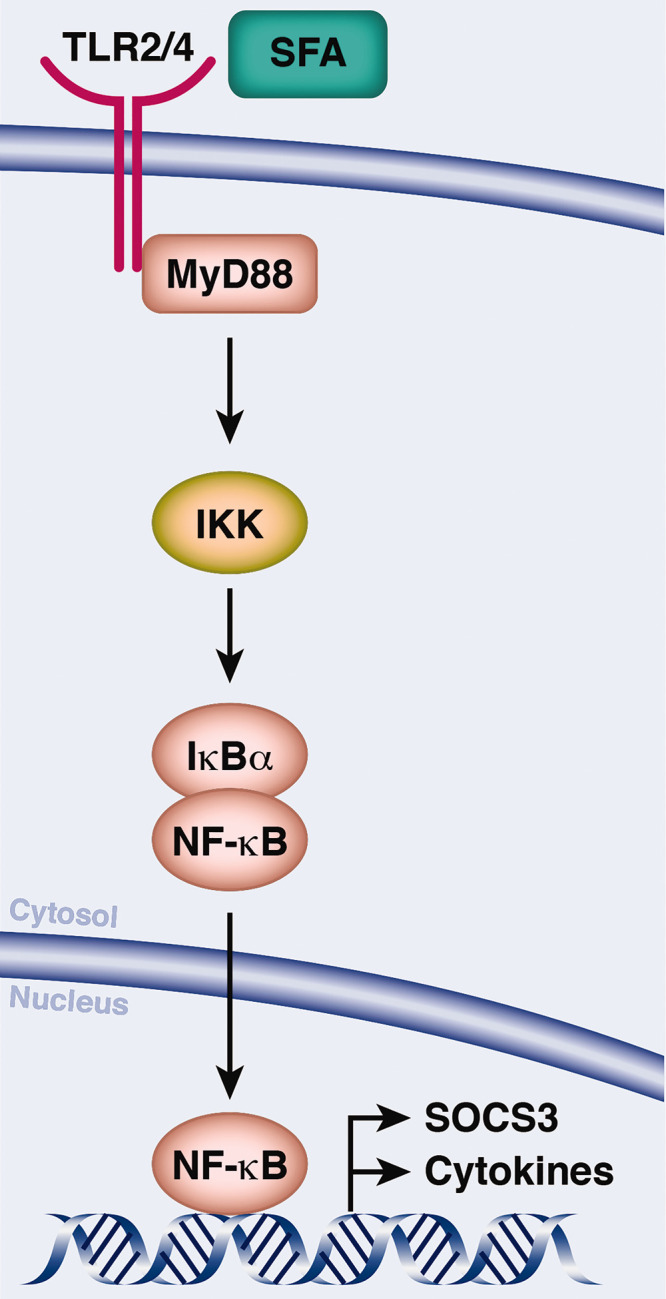
Saturated fatty acids (SFA) induce hypothalamic inflammation. SFAs bind to toll-like receptor 4 (TLR4) triggering the activation of inflammatory signalling cascades, with myeloid differentiation primary response 88 protein (MyD88) serving as a scaffold for downstream signalling molecules. NF-κB is sequestered in the cytoplasm by the inhibitor of NF-κB α (IκBα). Phosphorylation by the IKK complex leads to the release and nuclear translocations of NF-κB, binding to motifs in the promoter of the target gene SOCS3, a common inhibitor of insulin and leptin signalling and pro-inflammatory cytokines. Adapted from Jais and Bruning145 Reproduced with permission from the publisher.
An important amount of scientific literature and clinical evidences indicate that the effects of obesity in the brain, namely insulin and leptin resistance, and loss of cerebrovascular homeostasis, result in neurological dysfunction and neurodegeneration, although the exact underlying mechanisms are not fully understood.40 However, specific mechanisms such as neuro-inflammation, mitochondrial dysfunction, oxidative stress, and alterations of energy metabolism and synaptic plasticity have been invoked to connect insulin resistance to the progression of cognitive impairment.41 Moreover, some investigations underlined the role of mitochondrial dysfunction, overproduction of reactive oxygen species (ROS), depolarization and neurocellular swelling, to become key promoters in the development of cognitive decline and AD.42
Several non-neuronal populations contribute actively to create an inflammatory environment in the hypothalamus, with astrocytes and microglia providing early responses to HFDs.43 Experimental evidences indicate that under HFD, microglia undergo morphological, physiological and functional alterations, orchestrating the inflammatory response against the excess of SFA.44 Moreover, it has been demonstrated that microglial depletion limits the HFD-induced hyperphagia and weight gain.45 Astrocytes, on the other hand, develop a HFD-induced reactive phenotype in the ARC,46 detected in the hypothalamus as early as 24 h after HFD intake.47 Interestingly, both microglia and astrocytes release inflammatory cytokines in response to excessive SFA consumption,48 and the continuous presence of these cytokines impacts on BBB integrity.49 Indeed, experiments revealed that HFD induces an astrocyte-mediated increase in BBB permeability,50 disturbed glucose and water homeostasis,18 decreased BBB transport of leptin and insulin51,52 and augmented presence of cerebral fatty acids.53 Interestingly, since the transport of nutrients and hormonal signals regulating feeding behaviour is mediated by the BBB, obesity-induced BBB dysfunctions may lead to additional pathological consequences in the central nervous system (CNS).
Hypothalamic function during high-fat feeding and obesity
Activation of hypothalamic circuitries in the context of appetite and energy expenditure regulation results from the interaction between neurons, glia and the vascular system, as well as from the communication with systemic endocrine signals.54 In the hypothalamus, synaptic transmission of excitatory and inhibitory signals is dominated by the neurotransmitters glutamate (Glu) and gamma-aminobutyric acid (GABA), and their exogenous manipulations are known to alter the feeding behaviour.55 Notably, neurotransmission involves additionally the active role of astrocytes, which participate in the process of neurotransmitter removal from the synaptic cleft after synaptic transmissions.
Hypothalamic inflammation during HFD consumption alters hypothalamic function and physiology, eventually affecting peripheral metabolism.9,56 However, the mechanisms by which HFD induces the cellular and molecular disturbances altering the function of neuronal circuitries in the hypothalamus, or their concomitant effects on feeding, energy expenditure or fuel metabolism, remain largely unknown. To address these aspects and obtain information on the cellular activity and physiological status of the hypothalamus associated to obesity, several authors addressed the changes occurring in the neurochemical profile (or metabolome) of the hypothalamus during obesity development, using MRS.22,57 Further research is needed, however, to understand the acute versus long-term regulation of hypothalamic inflammation, which may have different consequences on hypothalamic function and physiology.
Beyond the hypothalamus: High-fat diet effects on non-homeostatic brain circuits
Outside the hypothalamus, the motivational and rewarding circuitries that participate in the control of feeding are also altered during obesity and HFD consumption. Appetite regulation in the mesocorticolimbic (MCL) structures – comprised by dopaminergic projections from the ventral tegmental area (VTA) to the prefrontal cortex, amygdala, hippocampus and nucleus accumbens (NAc) (Figure 1) – occurs via a complex “wanting” process. In this “wanting” response, certain food-related stimuli are tagged to an associated reward, e.g. the smell emanating from cooking that triggers an eating desire. Reward centres (RC), on the other hand, include regions from the orbitofrontal cortex, amygdala and NAc, and provide food of its pleasurable properties.58 Notably, both the RC and MCL centres integrate signals from a wide variety of inputs, having major roles coordinating the cerebral responses to appetite, and establishing common links between obesity and other pathological conditions such as stress,59 drug addiction,60 anxiodepressive behaviour61 and AD.62
The hippocampus is a key structure for learning and memory performance, and several neuroimaging techniques have reported reduced hippocampal integrity and structural changes related to decreased neurological function, both in AD and mild cognitive impairment pathologies.63 In parallel, clinical evidence indicate that obesity additionally distresses such structure in cognitively impaired patients, and is linked to smaller brain volumes, even in cognitively normal elderly subjects.64 On the other hand, experiments on animal models of obesity and T2D have assessed its effects on hippocampal function, and have found robust changes on memory impairment concomitant to important metabolic alterations.41 Other studies in obese mice have reported different connections between obesity and hippocampal dysfunction, such as the mediation of the pro-inflammatory cytokine IL1β,15 or the specific effects of short-term or long-term HFD feeding. Specifically, results obtained in rodents show that even very short-term HFD consumption (three days) can lead to inflammation and cognitive impairment on elderly animals, where aging-associated microglial priming leads to hyper-responsive IL1β after the HFD insult.17 The long-term hippocampal metabolic profile is also affected by HFDs, where important neurochemical alterations are associated to impaired hippocampal-dependent memory.23 Interestingly, similar to what occurs in the hypothalamus, BBB integrity in the hippocampus is compromised during HFD, with signs of increased permeability being reported.65 Indeed, continued increase in BBB permeability, together with the unconstrained entry of neurotoxic cytokines, chemokines, immune cells, free fatty acids (FFA), and triglycerides during obesity have been suggested to potentiate hippocampal injury.40
The NAc, on the other hand, is one of the major neuroanatomical structures regulating reward-seeking behaviours,12 and HFD-induced signs of inflammation have been described.61 Remarkably, these results indicate that the excess of SFAs, and not mono-unsaturated, increases anxiodepressive behaviour and sucrose motivation, providing the link between obesity and depression, through NFκB-mediated neuro-inflammation of the NAc.
Animal models
Animal models played a fundamental role in the understanding of the physio-pathological mechanisms underlying obesity development and associated therapeutic interventions.66,67 In particular, a large variety of genetic models, including leptin-deficient Ob/Ob mice, or obese Zucker rats deficient in the leptin receptor, have been crucial to unveil some of the molecular and cellular signatures involved in obesity and associated comorbidities.68 However, obesity and overweight result, most frequently, from additive polygenic alterations, or even from environmental determinants as the diet type, or the level of physical activity.69 DIO models appear, from this perspective, more adequate to evaluate dynamically the effects of excessive caloric intake during obesity development.70 Among these, the high-fat diet model has been primarily used in rodents.71 HFD models present indeed: higher body weight gain than controls,72 increased glucose and insulin levels,73 and insulin and leptin resistance.74 Moreover, HFD models allow to investigate feeding/fasting paradigms superimposed to the dietary manipulations, an acute nutritional intervention currently considered to promote activation of the neuro-inflammatory profile.75
Magnetic resonance imaging and spectroscopy of cerebral alterations during obesity development
A variety of neuroimaging and spectroscopic methods have revealed that obesity, and particularly HFD intake, induce important changes in brain inflammation and cerebral microstructure, metabolism and function. Among them, MRI techniques, as diffusion-weighted imaging (DWI) or T2-weighted imaging (T2WI), have provided evidence on intra- and extra-hypothalamic inflammation during HFD feeding. Volumetric measurements via T1-weighted imaging (T1WI)-based methods revealed the effects of obesity in white or grey matter integrity and density, and MRS techniques assessed the effects of obesity and HFD on cerebral metabolism. Finally, numerous functional MRI studies (fMRI), PET and SPECT approaches assessed the effects of obesity on brain function, principally addressing changes in neurovascular networks.76,77 The following paragraphs cover the most relevant imaging findings concerning the obesity-induced inflammatory, microstructural and metabolic changes. Special attention is given to the biophysical mechanisms underlying each imaging modality, and to the cellular and molecular mechanisms causing the observed imaging/spectroscopy changes.
Diffusion-weighted imaging is one of the most widely used biomedical imaging approaches, both in research and in clinical evaluations.78 DWI assesses the characteristics of biological tissues by measuring the Brownian motion or diffusion of water molecules, which reflect the random translational movements of water molecules resulting from their thermal energy.79 Molecular diffusion depends on the mass of the diffusing molecules, the temperature and the microviscosity of the surrounding medium. Naturally, water molecules crossing, or interacting with cell membranes, macromolecules or fibres, experiment additional restrictions to their diffusion properties. Technically, DWI techniques tag the translational diffusion of water molecules by using spin-echo sequences sensitized to diffusion with specific magnetic field gradients, whose strength and timing are reflected by a factor termed “b-value”. The final DWI signal received is partially attenuated if water spins “diffuse” out from the selected voxel (and consequently do not refocus) between the application of the gradients, the attenuation being proportional to their apparent diffusion coefficient (ADC). In this way, ADC reflects the combination of all the microscopic displacements of water molecules in each voxel and its quantification in vivo provides information on microstructural and geometric characteristics of the tissue, or their potential changes during pathological states.80 Water diffusion can be directionally dependent, as it occurs in the fibres conforming white matter (WM). Diffusion tensor imaging (DTI) allows the measurement of these three-dimensional diffusion components, both in their magnitude (mean diffusivity, MD), degree of anisotropy (fractional anisotropy, FA), and orientation (radial and axial diffusivities).81
DWI and DTI methods have revealed important microstructural alterations of the brain during obesity development. It has been described that obese patients depict higher diffusion coefficients in particular areas of the brain, as compared to non-obese subjects, and that these coefficients are positively correlated with body mass index (BMI).82,83 Affected structures include regions from the homeostatic and non-homeostatic circuitries of food intake regulation, including the hypothalamus, hippocampal gyrus, amygdala, insula, cerebellum and midbrain. Notably, authors explained the observed ADC increases as a consequence of an unspecific vasogenic edema,82 but the underlying mechanisms were not precisely elucidated. Interestingly, another study addressed specifically the relationship between cerebral inflammation and diffusion changes during obesity, by investigating the correlations between diffusivity and the concentration of the BBB permeability marker fibrinogen.14 Authors concluded that increased water diffusivity in the grey matter (GM) of obese individuals was positively correlated with fibrinogen concentration, whose blood levels are known to rise in response to systemic inflammation. More precisely, changes were found in regions from the amygdala and the right parietal cortex, two structures involved in the circuitry of behavioural feeding control, while diffusion on the hypothalamus could not be assessed for technical reasons. In their discussion, authors suggested that the higher net displacement of water molecules could be a consequence of cell membrane integrity loss, and pointed to microglia – a neurocellular population known to suffer from increases and loss of membrane integrity during inflammation – as the potential precursor of these changes. A recent and methodologically very well controlled study, performed on two large human cohorts, found a positive correlation between BMI and MD, suggesting hypothalamic microstructural alterations during obesity.84 Again, the mechanisms underlying the reported changes remained elusive, with a variety of processes being potentially consistent with the observed increases in MD. Indeed, phenomena such as enhanced amount of extracellular fluid accompanying neuronal loss, affected vessel integrity or gliosis, would all result in increased diffusion coefficients, becoming consistent with the reported findings (Figure 3). In animals, DWI combined with the implementation of biophysical models of diffusion and artificial intelligence-based image analysis has been used to detect subhypothalamic changes that indicate increases of diffusion coefficients in obese mice, suggesting that even acute fasting periods could change the diffusion properties of water in different brain regions.85–87 Despite the success of DWI-technique to evaluate obesity-related features in both animals and humans, the validity of DWI to detect the first stages of obesity –including the immunohistochemically detected initial inflammatory responses – remains to be established. In particular, the precise physio-pathological mechanisms underlying the observed imaging alterations have not been unambiguously explained. In this sense, studies addressing specifically the correlations between non-invasive neuroimaging parameters, and more conventional histochemical analyses at the cellular and molecular level, are expected to yield new insights into the mechanisms underlying the imaging alterations.
Figure 3.

High-fat diet induced cerebral alterations and underlying ADC changes. (a) Vasogenic edema. Top: Blood vessel’s endothelial tight junctions are disrupted by inflammatory reactions and oxidative stress following HFD feeding. Activated glial cells release vascular permeability and inflammatory mediators, that accelerate blood–brain barrier (BBB) hyper-permeability, result in fluid and albumin extravasation and accumulation in the extracellular space. Bottom: Dynamics of fluids (diffusion and bulk flow) through vascular, intra- and extracellular compartments under physiological conditions (left) or after HFD feeding (right). Bulk flow characterizes the vascular compartment (red), while diffusion occurs in the interstitial (yellow) and intracellular compartments (blue). Under HFDs, increased BBB permeability during vasogenic edema results in increased extracellular space and augmented ADC values. (b) Cellular alterations. Top: HFD induces the rapid appearance of activated microglia in the mediobasal hypothalamus. Middle: Long-term consumption of HFD has been also linked to neuronal apoptosis (arrows). Bottom: Highly cellular tissues with intact cell membranes restrict the movement of water molecules within intravascular, intracellular, and extracellular spaces (left). By contrast, less cellular tissues or damaged cells with defective cellular membranes increase the relative contribution of extracellular space, averaging faster water molecule displacements (right). In reactive gliosis, disruption of cell membranes, loss of myelin, or any process that alters the axon integrity would reduce the restrictions to water motion and increase the ADC. Panel A is redesigned and inspired from Michinaga and Koyama146 and Candelario-Jalil and Rosenberg147 and figures in Panel B are adapted from Valdearcos et al.148 and Moraes et al.36 All figures are reproduced with permission from the publishers.
T2-weighted imaging
T2 relaxation times determine how quickly the transversal component of the MR signal fades away after excitation, and images using T2 as contrast are called T2-weighted images. During an MRI experiment, nuclear spins absorb the energy from a radiofrequency (RF) pulse, which switches the original magnetization to the transversal plane. Once the RF is removed, the mutual interaction between neighbouring protons results in the dephasing of the transversal magnetization and its corresponding decay. Notably, this interaction –or dephasing – becomes more efficient when the contact time between the interacting protons is relatively long, as in viscous media. However, if the rotational correlation time is short, like in free water molecules, the interaction becomes less probable or efficient, thus increasing the T2 recovery time.88 On the other hand, water molecules interacting with macromolecules acquire the dynamics of the associated macromolecule and tend to reorient much slower, resulting in increased dephasing, promoting T2 relaxation and shortening T2 (Figure 4). Since T2 times are intrinsic features of biological tissues and vary widely within different tissues, T2WI can provide the basis for an exquisite soft-tissue discrimination and a tool with high diagnostic potential. The potential biases or inaccuracies derived from normalization processes could be overcome by performing T2 parametric mapping, an efficient quantitative MRI technique that solves the problems of comparison between subjects. Although quantitative approaches suffer from time-consuming implementation, this can be solved by using magnetic resonance fingerprint methods to simultaneously measure multiple tissue parameters in a single, time-efficient acquisition.89
Figure 4.

Magnetic relaxation properties depend on tissue composition. Observed T1 and T2 values in tissues are the weighted average of the contributions from the different dynamic environments of water in the corresponding macromolecular suspensions. Water molecules trapped in the macromolecular interior contribute stability to the macromolecular structure, forming the “constitutive water”. Hydration water involves the inner and outer hydration shells. The inner hydration shell involves those water molecules in direct contact with or, in the closest layers, to the macromolecule. Together with constitutive water, these molecules experience directly cross-coupling interactions (electrostatic, hydrogen-bonding, or Van der Waals…) with the macromolecular core and surface. The outer hydration sphere is formed by those water molecules not in direct contact with the macromolecular surface, but experiencing its influence through weaker long-range interactions. Inner and outer hydration layers experience a rapid exchange of water molecules. Free water molecules are those, sufficiently far from the macromolecular structure, to avoid its influence, experiencing only hydrogen bond interactions with neighbouring water molecules. Mobile free fatty acids refer to protons of saturated or unsaturated fatty acid chains, with sufficient mobility to generate relatively narrow resonances. These may contain methyl and methylene resonances from fast tumbling triglyceride nanoparticles, long-chain saturated or unsaturated fatty acids or very small phospholipid nanovesicles. Their interaction with surrounding aqueous environments is weak, of the hydrophobic type.
Few studies have used T2 imaging to investigate the effects of obesity and HFDs in brain tissue. For instance, it has been reported that after 21 weeks of HFD feeding, mice depict significant increases on T2 values in the basolateral hypothalamus – but not in the thalamus and cortex – a characteristic alteration not present in balanced diet fed animals.21 Remarkably, T2 hyperintensity has been recurrently associated to the presence of gliosis in different pathologies,90,91 but only a few studies have made attempts to validate the T2WI technique for gliosis detection by correlating histological evidence with MRI data.92 In this particular work, authors reported significant correlations of the glial fibrillary acidic protein (GFAP) – an astrocytic marker – with T2 values on HFD mice, therefore suggesting that astrogliosis could be the origin of the T2 increases reported during HFD. In parallel, a prospective MRI study on humans detected changes on T2 imaging during obesity, with T2 signal intensities on the left medio basal hypothalamus (MBH) correlating positively with BMI.9 However, this study assessed only a relative T2WI signal ratio change with BMI, and not the locally calculated T2 hypothalamic values. More specifically, the work addressed the hypothalamic signal as normalized to the signal in the amygdala. The amygdala, however, belongs to the behavioural circuitry of feeding regulation, with some studies reporting an altered microstructure in obese subjects.82 In this sense, potential BMI-related changes on the T2WI signal of the amygdala would affect the relative hypothalamic T2WI value, and thus the concluding results.
A similar study on a larger cohort of humans reported increases on T2 signal intensities, also only on the left region of the hypothalamus, but likewise as normalized to the amygdala.93 Of note, MRI evaluations of non-obese people showed that, under physiological conditions, the left hypothalamus had lower T2 intensity than the right. Authors proposed in this respect that the left MBH might contain –at least under healthy conditions – a larger number of neurons, and thus dominate over the right MBH in the regulation of autonomic functions. Additionally, the study followed a smaller group of obese patients that underwent bariatric surgery, and found no return to baseline of the T2 signal intensities, despite the profound weight loss and recovery of insulin sensitivity experienced by the operated subjects. On the same line, other authors used T2WI to assess the effects of HFD and its reversal on the mouse brain.94 Interestingly, authors found immuno-histochemical evidence of hypothalamic astrocytosis after 16 weeks of HFD, and a subsequent significant reduction after administrating a low caloric diet during the next 4 weeks. Even hypothalamic T2 values were significantly higher after the 16 weeks of HFD, the return to normal diet did not decreased T2 values. Authors proposed two different scenarios explaining the non-recovery of T2 values: either MRI tests were not sensitive enough to distinguish the reversal of astrocytosis; or the initial HFD-induced increase in T2 could be reflecting, in fact, other (non-reversible) processes than gliosis. Indeed, several processes involved in obesity development, such as vascular oedema or altered vascularization,95 neuronal loss,96 as well as increased glial cell number,97 associated to increased percentage of free water molecules could result in comparable increases in T2 values. Thus, even the T2 increases are being repeatedly described in animal models of obesity and on obese humans, the interpretation of the underlying mechanisms must be considered with caution. Importantly, the interaction of all molecular, cellular, vascular and metabolic events involved in obesity development must be taken into account to obtain an integral interpretation of the MRI signal changes.
Volumetric imaging
Along with DWI and T2WI, volumetric measurements based on T1-weighted images (T1WI) combined with tissue contrast-enhancing acquisitions are often performed in neuroimaging studies of obesity development. In an MRI experiment, T1 represents the recovery time of longitudinal magnetization to realign with the external magnetic field after the absorption of the RF pulse. This realignment –or return of the magnetic nuclei to equilibrium – is achieved by dissipating energy into the surroundings through the so-called spin-lattice relaxation, a process that occurs through a transfer of population from anti-parallel spins (with higher energy) to parallel spins (with lower energy). In this sense, the T1 relaxation time depends on the ability of molecules from the lattice to translate and rotate. Indeed, T1 values vary depending on the type of tissue concerned. For example, water-based tissues have slower longitudinal magnetization realignment, while fat recovers its magnetization much more quickly (Figure 3). Thus, in T1WI, water-based tissues appear darker than fat ones, and it becomes possible to distinguish GM from WM, since GM contains cellular bodies with low fat and high water content, and WM is constituted by neuronal fibres with high fat (myelin) content. The contrast provided by T1WI is, however, typically lower than that provided by T2 measurements, and volumetric evaluations require the use of complementary tissue enhancement methods. For example, T1WI is frequently performed in combination with the administration of exogenous paramagnetic contrast agents that shorten the T1 values, like gadolinium (III) chelates.98 Alternatively, T1 enhancement can be achieved using magnetization-prepared sequences that apply 180° inversion pulses, such as magnetization-prepared rapid acquisition with gradient echo (MPRAGE)99 or spoiled gradient recalled acquisitions (SPGR).100 Notably, when using T1WI combined with other preparatory techniques, the resulting image contrast can depend on additional parameters, such as T2 or proton density.
Volumetric evaluations are normally completed using voxel-based morphometry (VBM), an established automated technique that analyses cerebral structures without prior identification of regions of interest.101 Briefly, the method fits brain regions from T1WI into a given template, by stretching or compressing them, creating a relatively distorted image. Afterwards, this image is segmented in classes assigned to tissues (GM, WM and cerebrospinal fluid) depending on their intensity, and smoothed with the surrounding voxels. Finally, using the smoothed images, voxel-wise statistical tests are used for comparisons. To date, contradictory results have been reported concerning the correlations between regional cerebral volumes and obesity. A very recent study84 reported that BMI was not significantly correlated with hypothalamic volumes, but that additional factors such as sex and laterality did have an actual influence on the size of the hypothalamus. This particular study, performed on two large human cohorts, revealed that men depicted significantly higher hypothalamic volumes than women –irrespective to head size – and that the left lateral lobe of the hypothalamus was bigger than the right. Notably, authors attributed these results to the previously known existing differences between sexes on the metabolic and neuroendocrine systems, and to a potential lateralization of the circuits regulating food intake. Nevertheless, other studies reported negative relationships between GM volumes and obesity in several brain areas. For instance, using VBM, a study reported that obese Caucasian individuals had significantly lower GM density in the post-central gyrus, frontal operculum, putamen, and middle frontal gyrus, brain areas involved in the regulation of taste, reward, and behavioural control.102 In their work, authors did not investigate the underlying mechanisms causing the brain morphology abnormalities, but suggested that their findings are consistent with the known effects of excess of adiposity, such as inefficient insulin and leptin signalling. A study performed on a much larger cohort of healthy Japanese individuals found that brain GM volume loss and regional alterations in GM structures occurred exclusively in male – and not female – subjects with high BMI, and in regions comprising the bilateral medial temporal lobe (including the hippocampus), occipital lobe, frontal lobe, and the anterior lobe of the cerebellum.103 Notably, authors compared the GM decrease in the hippocampus with the decrease reported by other groups investigating AD, suggesting that the relationship between AD and obesity, may be related to their findings. Remarkably, one specific study reported a correlation between BMI and waist circumference with hypothalamic volume,104 but their results have not been replicated so far. Summarizing, even results tend to indicate that obesity is correlated to decreases on GM volumes, most of the studies remain exploratory, with the underlying mechanisms of these changes deserving further investigation.
Blood oxygen level-dependent (BOLD) fMRI methods can detect cerebral activation via the associated haemoglobin deoxygenation and perfusion changes.105,106 BOLD imaging is one of the most widely used techniques to study brain function in both animals and humans, based on detecting increases in oxygen delivery and associated hemodynamic responses to satisfy the increased energetic demands of neuronal activation. In the neuronal activation process, the ratio between deoxyhaemoglobin (paramagnetic) and oxyhaemoglobin (diamagnetic) changes, and by studying this ratio, BOLD107 can successfully map brain activity. Technically, BOLD fMRI relies on the use of ultra-fast multi-slice scans, covering the whole brain, and employing acquisition parameters that maximize the contrast-to-noise ratio of the BOLD response, achieving an appropriate temporal resolution.
The use of fMRI in the study of obesity and appetite regulation started in the late 90s, when a different hypothalamic response to a glucose load was reported for lean and obese subjects.108 Almost at the same time, using BOLD imaging, significant decreases of the fMRI signal were detected in the rat hypothalamus following intraperitoneal glucose administration.109 A few years later, a positive correlation between BOLD contrast fMRI and c-fos protein expression was identified in the activated areas of the rat brain after the administration of anorexigenic agents,110 therefore validating the use of BOLD in anesthetized animals to identify the brain response to appetite-modulating signals. A similar study in obese rats found an attenuated BOLD response to glucose uptake, as compared to lean animals.111 Moreover, such weaker response was positively correlated with a lower percentage of positive NPY cells in the hypothalamus, and with significantly lower levels of 5-hydroxytryptamine (5-HT). Since then, the use of BOLD imaging for the study of appetite regulation in animals has produced an important number of contributions, mainly related to the effects on hypothalamic activation after the administration of different diets or peptides to rodents112,113 and its association with endogenous levels of neuropeptides. More recently, we reported T2*-weighted contrast changes in the mouse hypothalamus during glucose uptake that were consistent with increases in blood oxygenation/microvascular flow in the dorsomedial and lateral hypothalamus nuclei.114 Finally, a very recent work described a robust experimental paradigm to assess real-time glucose-induced fMRI tasks in the mouse brain, and found that one-week high-fat and high-sucrose feeding impaired neuronal circuits in mice, particularly in the ARC, dorsomedial nucleus (DMN) and ventromedial nucleus + lateral hypothalamus (VMN+LH).115
In humans, fMRI studies in obese patients were performed to assess the brain activation during visual stimulation by food pictures,116 or the hypothalamic response to different tastes and calories.117 With these studies, it became clear that appetite regulation in humans was the result of interrelated neuronal circuits, including not only the homeostatic brain areas regulating body weight, but also the higher cortical areas related to reward and motivational networks. Consequently, different authors extended the investigation to such neuronal networks responding to specific orexigenic or anorexigenic signals.118–120 In the last decade, the applications of BOLD fMRI on studies of obesity development have consistently associated obesity with an increased motivational drive to eat, augmented reward responses to food cues and impaired food-related self-control processes.27,121 Interestingly, these obesity-associated changes have been linked with structural and connectivity changes within the central nervous system.122,123
Magnetic resonance spectroscopy (MRS) techniques are well endowed to provide a robust quantification of a wide range of metabolites “in vivo” or “ex vivo”. This is commonly known as the “metabolic profile” or “metabolome” of the tissue, a specific “fingerprint” of its physio-pathological state. The use of these techniques is currently emerging as an important tool in the study of global cerebral metabolism, neurological disorders, functional studies and therapy monitoring.124 Furthermore, when combined with the infusion of 13C-labelled compounds, MRS can be used to evaluate metabolic fluxes.125 Remarkably, in vivo and ex vivo MRS are sensitive enough to detect changes in very small structures (<9µL), such as the mouse hypothalamus.126,127 Using 1H MRS techniques in vivo,22 authors investigated longitudinal changes of the hypothalamic neurochemical profile in mice fed HFD. They described increased concentrations of putative markers of inflammation (as the osmolytes inositol, Ins, and taurine, Tau) and altered glucose metabolism (glucose, Glc, glutamate, Glu, and N-acetyl aspartate, NAA) after only eight weeks of diet (Figure 5(a)). Additional studies found comparable increases on NAA, glutamate, glutamine and total choline during longer HFD feeding periods, in both mice and rats.128,129 Notably, the MRS-detected elevated concentrations of Glc, Glu, osmolytes and NAA compare well with the results reported by molecular biology techniques at different stages of both diabetes and obesity. For example, augmented glucose concentration in diabetes is known to promote glutamate accumulation both in cerebral synaptosomes and in plasma,130,131 and the concentration of osmolytes is known to rise during inflammation and diabetes.132 On the other hand, since NAA synthesis is coupled to aspartate, to Acetyl-CoA (AcCoA) and to glucose metabolisms,133 both the HFD-induced accumulation of AcCoA and an augmented rate of glucose metabolism could contribute to the observed NAA accumulation.
Figure 5.

HFD modifications of hypothalamic metabolism. (a) Metabolic profile of the mouse hypothalamus by 1H MRS in vivo before (baseline) and after four months of feeding with control (CD) (top) or high-fat diets (HFD) (bottom). After four months of controlled feeding, neurochemical quantification revealed that animals under CD had increased concentrations of Cr+PCr (blue peaks), while HFD showed augmented concentrations of Ins, Tau, Glc, Glu+Gln, NAA+NAAG and Cr+PCr (red peaks).(b) Metabolic fluxes after 10 weeks of HFD calculated from 13C MRS measurements in vivo. Left: Values of the metabolic fluxes after 10 weeks of diet diversification for CD fed mice (blue) and HFD animals (red), obtained by fitting their corresponding 13C enrichment turnover curves to a one-compartment model of hypothalamic metabolism. Stars represent statistical significance between fluxes (*p < 0.05, **0.005 and *** p < 0.001). Adapted from Lizarbe et al.22 with permission from the publisher. Ala: alanine, ASP: aspartate, PCho: phosphorylcholine; Cr: creatine; PCr: phosphoCreatine; Glc: glucose; Gln:glutamine; Glu: glutamate; Glx: glutamine + glutamate; Ins: myo-inositol; Lac:lactate; NAA: N-acetylaspartate; Tau: taurine; NAAG: N-Acetyl-aspartyl-glutamate; GPC: glycerolphosphorylcholin; FA: fatty acids; KB: ketone bodies; VPDH: pyruvate dehydrogenase complex flux; VTCA; tricarboxylic acid cycle flux; VGln: glutamate-glutamine cycle;VGABA: glutamate-GABA cycle flux;Vdil: dilution flux; Vx: transmitochondrial glutamate exchange flux; VPC: pyruvate carboxylase flux; Veff: glutamine efflux flux.
Experiments combining high field MRS in vivo with the infusion of 13C-labelled glucose modelled ancillary cerebral metabolic fluxes in 10-weeks HFD mice22 (Figure 5(b)). The increased hypothalamic tricarboxylic acid (TCA) cycle flux detected on HFD mice is in agreement with reports of augmented cerebral metabolic rates in obese people,134 rodents135 and in the astrocytes of diabetic136 and ketogenic diet-fed137 rats. Moreover, the 13C MRS-detected increased fatty-acid metabolism is consistent with the larger astrocytic areas and mitochondrial density found in the ARC nucleus of HFD mice.138 Interestingly, the same study reported a noticeable shift from glutamatergic to GABAergic neurotransmission on HFD animals,125 consistent with the development of the defective control of energy homeostasis reported in HFDs.11 Similar effects on GABAergic metabolism have been described under ketogenic diets,137,139 where the described increase in GABAergic neurotransmission is believed to originate from the metabolism of ketone bodies to AcCoA and the concomitant decrease in the cerebral pool of oxaloacetate (OAA).
At long-term consumption (six months), a particular study found that very high HFDs (60%), but not 45%, induced 1H MRS-detectable metabolic alterations in the mouse hypothalamus, hippocampus and cortex.23 Specifically, authors reported metabolite changes suggestive of alterations in energy metabolism (phosphocreatine-to-creatine ratio, glucose and lactate), osmoregulation (myo-inositol, taurine, NAA), indicators of neurodegeneration and augmented phospholipid metabolism (NAA, glutathione, total choline) and increased microgliosis and astrogliosis (myo-inositol and glutamine). In summary, a wide variety of metabolic alterations during obesity development have been described using MRS, mainly on DIO animal models, where reports consistently indicate the presence of augmented biomarkers of inflammation, altered neurotransmission and metabolic fluxes. In this sense, changes have been reported from approximately eight weeks of HFD feeding, but the specific time point at which metabolism becomes altered, as well as the potential effects of obesity reversal, remains to be determined.
Future perspectives
Current strategies to fight against the global obesity pandemic are focused in implementing prevention strategies, promoting healthy life style habits and providing palliative medical treatment of the main comorbidities. Bariatric surgery, initially conceived as a body weight reduction high-risk operation, is unceasingly being demonstrated as the most successful approach at restoring non-obese BMI in an increasing range of population. Furthermore, experimental evidence shows that BS induces changes on global metabolism, gut microbiota and even on brain function.140
In parallel, investigations concerning the development of anti-obesity pharmaceuticals are yielding promising results, mostly at a preclinical level. Of particular interest is the discovery of celastrol, a pentacyclic triterpene extracted from the roots of the Tripterygium Wilfordii plant, which has been revealed as the most promising anti-obesity agent ever reported.141 Interestingly, the effects of both BS and celastrol involve the deactivation of hypothalamic inflammation, although the conforming mechanisms are far from being completely elucidated.142 Notably, existing scientific evidence strongly suggests that the initial degree of obesity-induced hypothalamic inflammation could directly influence the success of the specific anti-obesity treatments, and a variety of neuroimaging methods are starting to be implemented to define biomarkers for obesity treatment. For instance, a very recent study showed that Roux-en-Y gastric bypass surgery (a type of BS) progressively increased T2W signal intensities and decreased hypothalamic FA values, suggesting that this type of surgery has a time-dependent influence on the hypothalamic inflammation status.26 Two other research groups, using T1-based images with VBM analysis, assessed the whole brain evolution after BS and found surgery-induced brain plasticity that could be observed not only in the hypothalamus, but also in hedonic control regions.143,144 Moreover, these studies indicated that the higher BMI loss after surgery induced larger MRI-detected changes of grey and white matter densities across the entire brain. Thus, studies assessing brain changes after BS are currently a matter of interest in scientific and medical environments, and most probably, new studies will appear soon revealing the power of neuroimaging methods to assess its effects and potential predictive value.
Concluding remarks
In summary, multiple magnetic resonance imaging and spectroscopy methods have provided considerable advances in the characterization of the diverse facets of obesity development in the brain. Indeed, consistent results – such as increased diffusivity, increased T2 values, altered neurotransmission and metabolic rates, or decreased GM volumes – are being reported from a wide range of research groups working either in animal models of obesity, or in obese humans. Further multidisciplinary and integrative studies to identify the cellular and molecular determinants of the macroscopic changes observed in vivo entail substantial interest at present, and open simultaneously, a plethora of new and promising avenues for future research.
Acknowledgements
Authors are indebted to Mr. Javier Pérez (CSIC) for the professional drafting of the illustrations.
Funding
The author(s) disclosed receipt of the following financial support for the research, authorship, and/or publication of this article: This work was supported by Ministry of Science and Innovation (grant number SAF2017-83043-R) and, Community of Madrid (S2017/BMD-3688), both to SC and PL.
Declaration of conflicting interests
The author(s) declared no potential conflicts of interest with respect to the research, authorship, and/or publication of this article.
ORCID iDs
Blanca Lizarbe https://orcid.org/0000-0002-5531-4088
Sebastián Cerdán https://orcid.org/0000-0002-5531-4088
References
- 1.Apovian CM.Obesity: definition, comorbidities, causes, and burden. Am J Manag Care 2016; 22: s176–185. [PubMed] [Google Scholar]
- 2.Frisardi V, Solfrizzi V, Seripa D, et al. Metabolic-cognitive syndrome: a cross-talk between metabolic syndrome and Alzheimer's disease. Age Res Rev 2010; 9: 399–417. [DOI] [PubMed] [Google Scholar]
- 3.Smith KB, Smith MS.Obesity statistics. Prim Care 2016; 43: 121–135, ix. [DOI] [PubMed] [Google Scholar]
- 4.Flegal KM, Carroll MD, Ogden CL, et al. Prevalence and trends in obesity among US adults, 1999–2008. JAMA 2010; 303: 235–241. [DOI] [PubMed] [Google Scholar]
- 5.Wellen KE, Hotamisligil GS.Inflammation, stress, and diabetes. J Clin Invest 2005; 115: 1111–1119. [DOI] [PMC free article] [PubMed] [Google Scholar]
- 6.Hotamisligil GS.Inflammation and metabolic disorders. Nature 2006; 444: 860–867. [DOI] [PubMed] [Google Scholar]
- 7.Uranga RM, Keller JN.The complex interactions between obesity, metabolism and the brain. Front Neurosci 2019; 13: 513. [DOI] [PMC free article] [PubMed] [Google Scholar]
- 8.De Souza CT, Araujo EP, Bordin S, et al. Consumption of a fat-rich diet activates a proinflammatory response and induces insulin resistance in the hypothalamus. Endocrinology 2005; 146: 4192–4199. [DOI] [PubMed] [Google Scholar]
- 9.Thaler JP, Yi CX, Schur EA, et al. Obesity is associated with hypothalamic injury in rodents and humans. J Clin Invest 2012; 122: 153–162. [DOI] [PMC free article] [PubMed] [Google Scholar]
- 10.Posey KA, Clegg DJ, Printz RL, et al. Hypothalamic proinflammatory lipid accumulation, inflammation, and insulin resistance in rats fed a high-fat diet. Am J Physiol Endocrinol Metab 2009; 296: E1003–1012. [DOI] [PMC free article] [PubMed] [Google Scholar]
- 11.Zhang X, Zhang G, Zhang H, et al. Hypothalamic IKKbeta/NF-kappaB and ER stress link overnutrition to energy imbalance and obesity. Cell 2008; 135: 61–73. [DOI] [PMC free article] [PubMed] [Google Scholar]
- 12.Ferrario CR, Labouebe G, Liu S, et al. Homeostasis meets motivation in the battle to control food intake. J Neurosci 2016; 36: 11469–11481. [DOI] [PMC free article] [PubMed] [Google Scholar]
- 13.Michaelides M.Obesity: brain mechanisms in hypothalamic and extrahypothalamic regions. In: DW Pfaff, ND Volkow. (eds) Neuroscience in the 21st century: from basic to clinical. New York, NY: Springer New York, 2016, pp.3247–3259. [Google Scholar]
- 14.Cazettes F, Cohen JI, Yau PL, et al. Obesity-mediated inflammation may damage the brain circuit that regulates food intake. Brain Res 2011; 1373: 101–109. [DOI] [PMC free article] [PubMed] [Google Scholar]
- 15.Erion JR, Wosiski-Kuhn M, Dey A, et al. Obesity elicits interleukin 1-mediated deficits in hippocampal synaptic plasticity. J Neurosci 2014; 34: 2618–2631. [DOI] [PMC free article] [PubMed] [Google Scholar]
- 16.Moreno-Navarrete JM, Blasco G, Puig J, et al. Neuroinflammation in obesity: circulating lipopolysaccharide-binding protein associates with brain structure and cognitive performance. Int J Obes 2017; 41: 1627–1635. [DOI] [PubMed] [Google Scholar]
- 17.Spencer SJ, D'Angelo H, Soch A, et al. High-fat diet and aging interact to produce neuroinflammation and impair hippocampal- and amygdalar-dependent memory. Neurobiol Aging 2017; 58: 88–101. [DOI] [PMC free article] [PubMed] [Google Scholar]
- 18.Rhea EM, Salameh TS, Logsdon AF, et al. Blood-brain barriers in obesity. AAPS J 2017; 19: 921–930. [DOI] [PMC free article] [PubMed] [Google Scholar]
- 19.Selim M, Jones R, Novak P, et al. The effects of body mass index on cerebral blood flow velocity. Clin Auton Res 2008; 18: 331–338. [DOI] [PMC free article] [PubMed] [Google Scholar]
- 20.Birdsill AC, Carlsson CM, Willette AA, et al. Low cerebral blood flow is associated with lower memory function in metabolic syndrome. Obesity 2013; 21: 1313–1320. [DOI] [PMC free article] [PubMed] [Google Scholar]
- 21.Lee D, Thaler JP, Berkseth KE, et al. Longer T(2) relaxation time is a marker of hypothalamic gliosis in mice with diet-induced obesity. Am J Physiol Endocrinol Metab 2013; 304: E1245–1250. [DOI] [PMC free article] [PubMed] [Google Scholar]
- 22.Lizarbe B, Cherix A, Duarte JMN, et al. High-fat diet consumption alters energy metabolism in the mouse hypothalamus. Int J Obes 2019; 43: 1295–1304. [DOI] [PubMed] [Google Scholar]
- 23.Lizarbe B, Soares AF, Larsson S, et al. Neurochemical modifications in the hippocampus, cortex and hypothalamus of mice exposed to long-term high-fat diet. Front Neurosci 2018; 12: 985. [DOI] [PMC free article] [PubMed] [Google Scholar]
- 24.Willeumier KC, Taylor DV, Amen DG.Elevated BMI is associated with decreased blood flow in the prefrontal cortex using SPECT imaging in healthy adults. Obesity 2011; 19: 1095–1097. [DOI] [PMC free article] [PubMed] [Google Scholar]
- 25.Pursey KM, Stanwell P, Callister RJ, et al. Neural responses to visual food cues according to weight status: a systematic review of functional magnetic resonance imaging studies. Front Nutr 2014; 1: 7. [DOI] [PMC free article] [PubMed] [Google Scholar]
- 26.Hankir MK, Rullmann M, Seyfried F, et al. Roux-en-Y gastric bypass surgery progressively alters radiologic measures of hypothalamic inflammation in obese patients. JCI Insight 2019; 4: 1–13. [DOI] [PMC free article] [PubMed] [Google Scholar]
- 27.Val-Laillet D, Aarts E, Weber B, et al. Neuroimaging and neuromodulation approaches to study eating behavior and prevent and treat eating disorders and obesity. Neuroimage Clin 2015; 8: 1–31. [DOI] [PMC free article] [PubMed] [Google Scholar]
- 28.Pak K, Kim SJ, Kim IJ.Obesity and brain positron emission tomography. Nucl Med Mol Imaging 2018; 52: 16–23. [DOI] [PMC free article] [PubMed] [Google Scholar]
- 29.Seong J, Kang JY, Sun JS, et al. Hypothalamic inflammation and obesity: a mechanistic review. Arch Pharm Res 2019; 42: 383–392. [DOI] [PubMed] [Google Scholar]
- 30.Cone RD.Anatomy and regulation of the central melanocortin system. Nat Neurosci 2005; 8: 571–578. [DOI] [PubMed] [Google Scholar]
- 31.Morton GJ, Cummings DE, Baskin DG, et al. Central nervous system control of food intake and body weight. Nature 2006; 443: 289–295. [DOI] [PubMed] [Google Scholar]
- 32.Dragano NR, Monfort-Pires M, Velloso LA.Mechanisms mediating the actions of fatty acids in the hypothalamus. Neuroscience. Epub ahead of print 2 November 2019. DOI: 10.1016/j.neuroscience.2019.10.012 [DOI] [PubMed] [Google Scholar]
- 33.Morari J, Anhe GF, Nascimento LF, et al. Fractalkine (CX3CL1) is involved in the early activation of hypothalamic inflammation in experimental obesity. Diabetes 2014; 63: 3770–3784. [DOI] [PubMed] [Google Scholar]
- 34.Souza GFP, Solon C, Nascimento LF, et al. Defective regulation of POMC precedes hypothalamic inflammation in diet-induced obesity. Sci Rep 2016; 6: 29290. [DOI] [PMC free article] [PubMed] [Google Scholar]
- 35.Dalvi PS, Chalmers JA, Luo V, et al. High fat induces acute and chronic inflammation in the hypothalamus: effect of high-fat diet, palmitate and TNF-α on appetite-regulating NPY neurons. Int J Obes 2017; 41: 149–158. [DOI] [PubMed] [Google Scholar]
- 36.Moraes JC, Coope A, Morari J, et al. High-fat diet induces apoptosis of hypothalamic neurons. PLoS One 2009; 4: e5045. [DOI] [PMC free article] [PubMed] [Google Scholar]
- 37.Milanski M, Degasperi G, Coope A, et al. Saturated fatty acids produce an inflammatory response predominantly through the activation of TLR4 signaling in hypothalamus: implications for the pathogenesis of obesity. J Neurosci 2009; 29: 359–370. [DOI] [PMC free article] [PubMed] [Google Scholar]
- 38.Olofsson LE, Unger EK, Cheung CC, et al. Modulation of AgRP-neuronal function by SOCS3 as an initiating event in diet-induced hypothalamic leptin resistance. Proc Natl Acad Sci U S A 2013; 110: E697–706. [DOI] [PMC free article] [PubMed] [Google Scholar]
- 39.Engin A.Diet-induced obesity and the mechanism of leptin resistance. Adv Exp Med Biol 2017; 960: 381–397. [DOI] [PubMed] [Google Scholar]
- 40.O'Brien PD, Hinder LM, Callaghan BC, et al. Neurological consequences of obesity. Lancet Neurol 2017; 16: 465–477. [DOI] [PMC free article] [PubMed] [Google Scholar]
- 41.Garcia-Serrano AM, Duarte JMN.Brain metabolism alterations in type 2 diabetes: what did we learn from diet-induced diabetes models? Front Neurosci 2020; 14: 229. [DOI] [PMC free article] [PubMed] [Google Scholar]
- 42.Sripetchwandee J, Chattipakorn N, Chattipakorn SC.Links between obesity-induced brain insulin resistance, brain mitochondrial dysfunction, and dementia. Front Endocrinol 2018; 9: 496. [DOI] [PMC free article] [PubMed] [Google Scholar]
- 43.García-Cáceres C, Balland E, Prevot V, et al. Role of astrocytes, microglia, and tanycytes in brain control of systemic metabolism. Nat Neurosc 2019; 22: 7–14. [DOI] [PubMed] [Google Scholar]
- 44.Valdearcos M, Robblee MM, Benjamin DI, et al. Microglia dictate the impact of saturated fat consumption on hypothalamic inflammation and neuronal function. Cell Rep 2014; 9: 2124–2138. [DOI] [PMC free article] [PubMed] [Google Scholar]
- 45.Valdearcos M, Douglass JD, Robblee MM, et al. Microglial inflammatory signaling orchestrates the hypothalamic immune response to dietary excess and mediates obesity susceptibility. Cell Metab 2018; 27: 1356. [DOI] [PubMed] [Google Scholar]
- 46.Horvath TL, Sarman B, Garcia-Caceres C, et al. Synaptic input organization of the melanocortin system predicts diet-induced hypothalamic reactive gliosis and obesity. Proc Natl Acad Sci U S A 2010; 107: 14875–14880. [DOI] [PMC free article] [PubMed] [Google Scholar]
- 47.Buckman LB, Thompson MM, Lippert RN, et al. Evidence for a novel functional role of astrocytes in the acute homeostatic response to high-fat diet intake in mice. Mol Metab 2015; 4: 58–63. [DOI] [PMC free article] [PubMed] [Google Scholar]
- 48.Gupta S, Knight AG, Gupta S, et al. Saturated long-chain fatty acids activate inflammatory signaling in astrocytes. J Neurochem 2012; 120: 1060–1071. [DOI] [PMC free article] [PubMed] [Google Scholar]
- 49.Shigemoto-Mogami Y, Hoshikawa K, Sato K.Activated Microglia disrupt the blood-brain barrier and induce chemokines and cytokines in a rat in vitro model. Front Cell Neurosci 2018; 12: 494. [DOI] [PMC free article] [PubMed] [Google Scholar]
- 50.de Aquino CC, Leitao RA, Oliveira Alves LA, et al. Effect of hypoproteic and high-fat diets on hippocampal blood-brain barrier permeability and oxidative stress. Front Nutr 2018; 5: 131. [DOI] [PMC free article] [PubMed] [Google Scholar]
- 51.Banks WA, Farrell CL.Impaired transport of leptin across the blood-brain barrier in obesity is acquired and reversible. Am J Physiol Endocrinol Metab 2003; 285: E10–E15. [DOI] [PubMed] [Google Scholar]
- 52.Kaiyala KJ, Prigeon RL, Kahn SE, et al. Obesity induced by a high-fat diet is associated with reduced brain insulin transport in dogs. Diabetes 2000; 49: 1525–1533. [DOI] [PubMed] [Google Scholar]
- 53.Karmi A, Iozzo P, Viljanen A, et al. Increased brain fatty acid uptake in metabolic syndrome. Diabetes 2010; 59: 2171–2177. [DOI] [PMC free article] [PubMed] [Google Scholar]
- 54.Lizarbe B, Benitez A, Pelaez Brioso GA, et al. Hypothalamic metabolic compartmentation during appetite regulation as revealed by magnetic resonance imaging and spectroscopy methods. Front Neuroenerget 2013; 5: 6. [DOI] [PMC free article] [PubMed] [Google Scholar]
- 55.Delgado TC.Glutamate and GABA in appetite regulation. Front Endocrinol 2013; 4: 103. [DOI] [PMC free article] [PubMed] [Google Scholar]
- 56.Valdearcos M, Xu AW, Koliwad SK.Hypothalamic inflammation in the control of metabolic function. Annu Rev Physiol 2015; 77: 131–160. [DOI] [PubMed] [Google Scholar]
- 57.Cirulli ET, Guo L, Leon Swisher C, et al. Profound perturbation of the metabolome in obesity is associated with health risk. Cell Metab 2019; 29: 488–500.e482. [DOI] [PMC free article] [PubMed] [Google Scholar]
- 58.Saper CB, Chou TC, Elmquist JK.The need to feed: homeostatic and hedonic control of eating. Neuron 2002; 36: 199–211. [DOI] [PubMed] [Google Scholar]
- 59.Adam TC, Epel ES.Stress, eating and the reward system. Physiol Behav 2007; 91: 449–458. [DOI] [PubMed] [Google Scholar]
- 60.Koob GF, Volkow ND.Neurobiology of addiction: a neurocircuitry analysis. Lancet Psychiatry 2016; 3: 760–773. [DOI] [PMC free article] [PubMed] [Google Scholar]
- 61.Decarie-Spain L, Sharma S, Hryhorczuk C, et al. Nucleus accumbens inflammation mediates anxiodepressive behavior and compulsive sucrose seeking elicited by saturated dietary fat. Mol Metab 2018; 10: 1–13. [DOI] [PMC free article] [PubMed] [Google Scholar]
- 62.Pugazhenthi S, Qin L, Reddy PH.Common neurodegenerative pathways in obesity, diabetes, and Alzheimer's disease. Biochim Biophys Acta Mol Basis Dis 2017; 1863: 1037–1045. [DOI] [PMC free article] [PubMed] [Google Scholar]
- 63.De Santi S, de Leon MJ, Rusinek H, et al. Hippocampal formation glucose metabolism and volume losses in MCI and AD. Neurobiol Aging 2001; 22: 529–539. [DOI] [PubMed] [Google Scholar]
- 64.Monda V, La Marra M, Perrella R, et al. Obesity and brain illness: from cognitive and psychological evidences to obesity paradox. Diabetes Metab Syndr Obes 2017; 10: 473–479. [DOI] [PMC free article] [PubMed] [Google Scholar]
- 65.Kanoski SE, Zhang Y, Zheng W, et al. The effects of a high-energy diet on hippocampal function and blood-brain barrier integrity in the rat. J Alzheimers Dis 2010; 21: 207–219. [DOI] [PMC free article] [PubMed] [Google Scholar]
- 66.Kleinert M, Clemmensen C, Hofmann SM, et al. Animal models of obesity and diabetes mellitus. Nat Rev Endocrinol 2018; 14: 140–162. [DOI] [PubMed] [Google Scholar]
- 67.Lutz TA, Woods SC.Overview of animal models of obesity. Curr Protoc Pharmacol 2012; 61: 1–18. [DOI] [PMC free article] [PubMed] [Google Scholar]
- 68.Biddinger SB, Kahn CR.From mice to men: insights into the insulin resistance syndromes. Annu Rev Physiol 2006; 68: 123–158. [DOI] [PubMed] [Google Scholar]
- 69.Vickers SP, Jackson HC, Cheetham SC.The utility of animal models to evaluate novel anti-obesity agents. Br J Pharmacol 2011; 164: 1248–1262. [DOI] [PMC free article] [PubMed] [Google Scholar]
- 70.Nilsson C, Raun K, Yan F-F, et al. Laboratory animals as surrogate models of human obesity. Acta Pharmacol Sin 2012; 33: 173–181. [DOI] [PMC free article] [PubMed] [Google Scholar]
- 71.Freeman LR, Haley-Zitlin V, Rosenberger DS, et al. Damaging effects of a high-fat diet to the brain and cognition: a review of proposed mechanisms. Nutr Neurosci 2014; 17: 241–251. [DOI] [PMC free article] [PubMed] [Google Scholar]
- 72.Hariri N, Thibault L.High-fat diet-induced obesity in animal models. Nutr Res Rev 2010; 23: 270–299. [DOI] [PubMed] [Google Scholar]
- 73.Winzell MS, Ahrén B.The high-fat diet–fed mouse: a model for studying mechanisms and treatment of impaired glucose tolerance and type 2 diabetes. Diabetes 2004; 53: S215–S219. [DOI] [PubMed] [Google Scholar]
- 74.Yazıcı D, Sezer H.Insulin resistance, obesity and lipotoxicity. In: AB Engin, A Engin. (eds) Obesity and lipotoxicity. Cham: Springer International Publishing, 2017, pp.277–304. [Google Scholar]
- 75.Kosteli A, Sugaru E, Haemmerle G, et al. Weight loss and lipolysis promote a dynamic immune response in murine adipose tissue. J Clin Invest 2010; 120: 3466–3479. [DOI] [PMC free article] [PubMed] [Google Scholar]
- 76.Carnell S, Gibson C, Benson L, et al. Neuroimaging and obesity: current knowledge and future directions. Obes Rev 2012; 13: 43–56. [DOI] [PMC free article] [PubMed] [Google Scholar]
- 77.Letra L, Pereira D, Castelo-Branco M.Functional neuroimaging in obesity research. Adv Neurobiol 2017; 19: 239–248. [DOI] [PubMed] [Google Scholar]
- 78.Mayer AR, Ling J, Mannell MV, et al. A prospective diffusion tensor imaging study in mild traumatic brain injury. Neurology 2010; 74: 643–650. [DOI] [PMC free article] [PubMed] [Google Scholar]
- 79.Einstein A.Investigations on the theory of Brownian motion. [Reprint of the 1st English edition (1926)]. Mineola, NY: Dover Publications Inc., 1956.
- 80.Le Bihan D.Looking into the functional architecture of the brain with diffusion MRI. Nat Rev Neurosci 2003; 4: 469–480. [DOI] [PubMed] [Google Scholar]
- 81.Alexander AL, Lee JE, Lazar M, et al. Diffusion tensor imaging of the brain. Neurotherapeutics 2007; 4: 316–329. [DOI] [PMC free article] [PubMed] [Google Scholar]
- 82.Alkan A, Sahin I, Keskin L, et al. Diffusion-weighted imaging features of brain in obesity. Magn Reson Imag 2008; 26: 446–450. [DOI] [PubMed] [Google Scholar]
- 83.Kilicarslan R, Alkan A, Sharifov R, et al. The effect of obesity on brain diffusion alteration in patients with obstructive sleep apnea. Sci World J 2014; 2014: 768415. [DOI] [PMC free article] [PubMed] [Google Scholar]
- 84.Thomas K, Beyer F, Lewe G, et al. Higher body mass index is linked to altered hypothalamic microstructure. Sci Rep 2019; 9: 17373. [DOI] [PMC free article] [PubMed] [Google Scholar]
- 85.Benitez A, Lizarbe B, Guadilla I, et al. Cerebral hunger maps in rodents and humans by diffusion weighted MRI. Appetite 2019; 142: 104333. [DOI] [PubMed] [Google Scholar]
- 86.Lizarbe B, Benitez A, Sanchez-Montanes M, et al. Imaging hypothalamic activity using diffusion weighted magnetic resonance imaging in the mouse and human brain. Neuroimage 2013; 64: 448–457. [DOI] [PubMed] [Google Scholar]
- 87.Lizarbe B, Lopez-Larrubia P, Cerdan S.fDWI evaluation of hypothalamic appetite regulation pathways in mice genetically deficient in leptin or neuropeptide Y. Neurochem Res 2015; 40: 2628–2638. [DOI] [PubMed] [Google Scholar]
- 88.van der Weerd L, Thomas DL, Thornton JS, et al. MRI of animal models of brain disease. Methods Enzymol 2004; 386: 149–177. [DOI] [PubMed] [Google Scholar]
- 89.Bipin Mehta B, Coppo S, Frances McGivney D, et al. Magnetic resonance fingerprinting: a technical review. Magn Reson Med 2019; 81: 25–46. [DOI] [PubMed] [Google Scholar]
- 90.Briellmann RS, Kalnins RM, Berkovic SF, et al. Hippocampal pathology in refractory temporal lobe epilepsy: T2-weighted signal change reflects dentate gliosis. Neurology 2002; 58: 265–271. [DOI] [PubMed] [Google Scholar]
- 91.Marshall VG, W G Bradley J, Marshall CE, et al. Deep white matter infarction: correlation of MR imaging and histopathologic findings. Radiology 1988; 167: 517–522. [DOI] [PubMed] [Google Scholar]
- 92.Schur EA, Melhorn SJ, Oh SK, et al. Radiologic evidence that hypothalamic gliosis is associated with obesity and insulin resistance in humans. Obesity 2015; 23: 2142–2148. [DOI] [PMC free article] [PubMed] [Google Scholar]
- 93.Kreutzer C, Peters S, Schulte DM, et al. Hypothalamic inflammation in human obesity is mediated by environmental and genetic factors. Diabetes 2017; 66: 2407–2415. [DOI] [PubMed] [Google Scholar]
- 94.Berkseth KE, Guyenet SJ, Melhorn SJ, et al. Hypothalamic gliosis associated with high-fat diet feeding is reversible in mice: a combined immunohistochemical and magnetic resonance imaging study. Endocrinology 2014; 155: 2858–2867. [DOI] [PMC free article] [PubMed] [Google Scholar]
- 95.Yin WJ, Liu F, Li XM, et al. Noninvasive evaluation of renal oxygenation in diabetic nephropathy by BOLD-MRI. Eur J Radiol 2012; 81: 1426–1431. [DOI] [PubMed] [Google Scholar]
- 96.MacKenzie-Graham A, Tiwari-Woodruff SK, Sharma G, et al. Purkinje cell loss in experimental autoimmune encephalomyelitis. Neuroimage 2009; 48: 637–651. [DOI] [PMC free article] [PubMed] [Google Scholar]
- 97.Teresi LM, Hovda D, Seeley AB, et al. MR imaging of experimental demyelination. Am J Roentgenol 1989; 152: 1291–1298. [DOI] [PubMed] [Google Scholar]
- 98.Caravan P, Ellison JJ, McMurry TJ, et al. Gadolinium(III) chelates as MRI contrast agents: structure, dynamics, and applications. Chem Rev 1999; 99: 2293–2352. [DOI] [PubMed] [Google Scholar]
- 99.Mugler JP, 3rd, Brookeman JR.Three-dimensional magnetization-prepared rapid gradient-echo imaging (3D MP RAGE). Magn Reson Med 1990; 15: 152–157. [DOI] [PubMed] [Google Scholar]
- 100.Patronas N, Bulakbasi N, Stratakis CA, et al. Spoiled gradient recalled acquisition in the steady state technique is superior to conventional postcontrast spin echo technique for magnetic resonance imaging detection of adrenocorticotropin-secreting pituitary tumors. J Clin Endocrinol Metab 2003; 88: 1565–1569. [DOI] [PubMed] [Google Scholar]
- 101.Ashburner J, Friston KJ.Voxel-based morphometry – the methods. Neuroimage 2000; 11: 805–821. [DOI] [PubMed] [Google Scholar]
- 102.Pannacciulli N, Del Parigi A, Chen K, et al. Brain abnormalities in human obesity: a voxel-based morphometric study. Neuroimage 2006; 31: 1419–1425. [DOI] [PubMed] [Google Scholar]
- 103.Taki Y, Kinomura S, Sato K, et al. Relationship between body mass index and gray matter volume in 1,428 healthy individuals. Obesity 2008; 16: 119–124. [DOI] [PubMed] [Google Scholar]
- 104.Kurth F, Levitt JG, Phillips OR, et al. Relationships between gray matter, body mass index, and waist circumference in healthy adults. Hum Brain Mapp 2013; 34: 1737–1746. [DOI] [PMC free article] [PubMed] [Google Scholar]
- 105.Zhu XH, Kim SG, Andersen P, et al. Simultaneous oxygenation and perfusion imaging study of functional activity in primary visual cortex at different visual stimulation frequency: quantitative correlation between BOLD and CBF changes. Magn Reson Med 1998; 40: 703–711. [DOI] [PubMed] [Google Scholar]
- 106.Logothetis NK, Wandell BA.Interpreting the BOLD signal. Annu Rev Physiol 2004; 66: 735–769. [DOI] [PubMed] [Google Scholar]
- 107.Ogawa S, Lee TM, Kay AR, et al. Brain magnetic resonance imaging with contrast dependent on blood oxygenation. Proc Natl Acad Sci U S A 1990; 87: 9868–9872. [DOI] [PMC free article] [PubMed] [Google Scholar]
- 108.Matsuda M, Liu Y, Mahankali S, et al. Altered hypothalamic function in response to glucose ingestion in obese humans. Diabetes 1999; 48: 1801–1806. [DOI] [PubMed] [Google Scholar]
- 109.Mahankali S, Liu Y, Pu Y, et al. In vivo fMRI demonstration of hypothalamic function following intraperitoneal glucose administration in a rat model. Magn Reson Med 2000; 43: 155–159. [DOI] [PubMed] [Google Scholar]
- 110.Stark JA, Davies KE, Williams SR, et al. Functional magnetic resonance imaging and c-Fos mapping in rats following an anorectic dose of m-chlorophenylpiperazine. Neuroimage 2006; 31: 1228–1237. [DOI] [PubMed] [Google Scholar]
- 111.Chen H, Hansen MJ, Jones JE, et al. Regulation of hypothalamic NPY by diet and smoking. Peptides 2007; 28: 384–389. [DOI] [PubMed] [Google Scholar]
- 112.Min DK, Tuor UI, Koopmans HS, et al. Changes in differential functional magnetic resonance signals in the rodent brain elicited by mixed-nutrient or protein-enriched meals. Gastroenterology 2011; 141: 1832–1841. [DOI] [PubMed] [Google Scholar]
- 113.Li Z, Zhu Y, Childress AR, et al. Relations between BOLD fMRI-derived resting brain activity and cerebral blood flow. PLoS One 2012; 7: e44556. [DOI] [PMC free article] [PubMed] [Google Scholar]
- 114.Lizarbe B, Fernandez-Perez A, Caz V, et al. Systemic glucose administration alters water diffusion and microvascular blood flow in mouse hypothalamic nuclei – an fMRI study. Front Neurosci 2019; 13: 921. [DOI] [PMC free article] [PubMed] [Google Scholar]
- 115.Mohr AA, Garcia-Serrano AM, Vieira JPP, et al. A glucose-stimulated BOLD fMRI study of hypothalamic dysfunction in mice fed a high-fat and high-sucrose diet. bioRxiv. Epub ahead of print 24 March 2020. DOI: 10.1101/2020.03.21.001149 [DOI] [PMC free article] [PubMed] [Google Scholar]
- 116.Killgore WD, Young AD, Femia LA, et al. Cortical and limbic activation during viewing of high- versus low-calorie foods. Neuroimage 2003; 19: 1381–1394. [DOI] [PubMed] [Google Scholar]
- 117.Smeets PA, de Graaf C, Stafleu A, et al. Functional magnetic resonance imaging of human hypothalamic responses to sweet taste and calories. Am J Clin Nutr 2005; 82: 1011–1016. [DOI] [PubMed] [Google Scholar]
- 118.Batterham RL, ffytche DH, Rosenthal JM, et al. PYY modulation of cortical and hypothalamic brain areas predicts feeding behaviour in humans. Nature 2007; 450: 106–109. [DOI] [PubMed] [Google Scholar]
- 119.Miller JL, James GA, Goldstone AP, et al. Enhanced activation of reward mediating prefrontal regions in response to food stimuli in Prader-Willi syndrome. J Neurol Neurosurg Psychiatry 2007; 78: 615–619. [DOI] [PMC free article] [PubMed] [Google Scholar]
- 120.Malik S, McGlone F, Bedrossian D, et al. Ghrelin modulates brain activity in areas that control appetitive behavior. Cell Metab 2008; 7: 400–409. [DOI] [PubMed] [Google Scholar]
- 121.Makaronidis JM, Batterham RL.Obesity, body weight regulation and the brain: insights from fMRI. Br J Radiol 2018; 91: 20170910. [DOI] [PMC free article] [PubMed] [Google Scholar]
- 122.Park BY, Seo J, Park H.Functional brain networks associated with eating behaviors in obesity. Sci Rep 2016; 6: 23891. [DOI] [PMC free article] [PubMed] [Google Scholar]
- 123.Geha P, Cecchi G, Todd Constable R, et al. Reorganization of brain connectivity in obesity. Hum Brain Mapp 2017; 38: 1403–1420. [DOI] [PMC free article] [PubMed] [Google Scholar]
- 124.Duarte JM, Lei H, Mlynarik V, et al. The neurochemical profile quantified by in vivo 1H NMR spectroscopy. Neuroimage 2012; 61: 342–362. [DOI] [PubMed] [Google Scholar]
- 125.Lizarbe B, Cherix A, Gruetter R.In vivo heteronuclear magnetic resonance spectroscopy. Methods Mol Biol 2018; 1718: 169–187. [DOI] [PubMed] [Google Scholar]
- 126.Lizarbe B, Lei H, Duarte JMN, et al. Feasibility of in vivo measurement of glucose metabolism in the mouse hypothalamus by (1) H-[(13) C] MRS at 14.1T. Magn Reson Med 2018; 80: 874–884. [DOI] [PubMed] [Google Scholar]
- 127.Frost G, Sleeth ML, Sahuri-Arisoylu M, et al. The short-chain fatty acid acetate reduces appetite via a central homeostatic mechanism. Nat Commun 2014; 5: 3611. [DOI] [PMC free article] [PubMed] [Google Scholar]
- 128.Lim SI, Song KH, Yoo CH, et al. High-fat diet-induced hyperglutamatergic activation of the hippocampus in mice: a proton magnetic resonance spectroscopy study at 9.4T. Neurochem Int 2017; 114: 10–17. [DOI] [PubMed] [Google Scholar]
- 129.Ribeiro M, Castelhano J, Petrella LI, et al. High-fat diet induces a neurometabolic state characterized by changes in glutamate and N-acetylaspartate pools associated with early glucose intolerance: an in vivo multimodal MRI study. J Magnet Reson Imag 2018; 48: 757–766. [DOI] [PubMed] [Google Scholar]
- 130.Satoh E, Takahashi A.Experimental diabetes enhances Ca2+ mobilization and glutamate exocytosis in cerebral synaptosomes from mice. J Pharmacol Sci 2009; 109: 181p. [DOI] [PubMed] [Google Scholar]
- 131.Huang XT, Li C, Peng XP, et al. An excessive increase in glutamate contributes to glucose-toxicity in beta-cells via activation of pancreatic NMDA receptors in rodent diabetes. Sci Rep 2017; 7: 44120. [DOI] [PMC free article] [PubMed] [Google Scholar]
- 132.Brocker C, Thompson DC, Vasiliou V.The role of hyperosmotic stress in inflammation and disease. Biomol Concepts 2012; 3: 345–364. [DOI] [PMC free article] [PubMed] [Google Scholar]
- 133.Moffett JR, Ross B, Arun P, et al. N-Acetylaspartate in the CNS: from neurodiagnostics to neurobiology. Prog Neurobiol 2007; 81: 89–131. [DOI] [PMC free article] [PubMed] [Google Scholar]
- 134.Marques EL, Halpern A, Correa Mancini M, et al. Changes in neuropsychological tests and brain metabolism after bariatric surgery. J Clin Endocrinol Metab 2014; 99: E2347–2352. [DOI] [PubMed] [Google Scholar]
- 135.Delgado TC, Violante IR, Nieto-Charques L, et al. Neuroglial metabolic compartmentation underlying leptin deficiency in the obese ob/ob mice as detected by magnetic resonance imaging and spectroscopy methods. J Cereb Blood Flow Meabt 2011; 31: 2257–2266. [DOI] [PMC free article] [PubMed] [Google Scholar]
- 136.Girault F-M, Sonnay S, Gruetter R, et al. Alterations of brain energy metabolism in type 2 diabetic goto-kakizaki rats measured in vivo by 13c magnetic resonance spectroscopy. Neurotox Res 2019; 36: 268–278. [DOI] [PubMed] [Google Scholar]
- 137.Melo TM, Nehlig A, Sonnewald U.Neuronal-glial interactions in rats fed a ketogenic diet. Neurochem Int 2006; 48: 498–507. [DOI] [PubMed] [Google Scholar]
- 138.Schonfeld P, Reiser G.Why does brain metabolism not favor burning of fatty acids to provide energy? Reflections on disadvantages of the use of free fatty acids as fuel for brain. J Cereb Blood Flow Metab 2013; 33: 1493–1499. [DOI] [PMC free article] [PubMed] [Google Scholar]
- 139.Yudkoff M, Daikhin Y, Horyn O, et al. Ketosis and brain handling of glutamate, glutamine, and GABA. Epilepsia 2008; 49(Suppl 8): 73–75. [DOI] [PMC free article] [PubMed] [Google Scholar]
- 140.Herrick MK, Favela KM, Simerly RB, et al. Attenuation of diet-induced hypothalamic inflammation following bariatric surgery in female mice. Mol Med 2018; 24: 56. [DOI] [PMC free article] [PubMed] [Google Scholar]
- 141.Liu J, Lee J, Salazar Hernandez MA, et al. Treatment of obesity with celastrol. Cell 2015; 161: 999–1011. [DOI] [PMC free article] [PubMed] [Google Scholar]
- 142.Seyfried F, Hankir MK.Could de-stressing the brain be the solution for long-term weight loss? Cell Stress 2019; 3: 29–37. [DOI] [PMC free article] [PubMed] [Google Scholar]
- 143.Rullmann M, Preusser S, Poppitz S, et al. Gastric-bypass surgery induced widespread neural plasticity of the obese human brain. Neuroimage 2018; 172: 853–863. [DOI] [PubMed] [Google Scholar]
- 144.Tuulari JJ, Karlsson HK, Antikainen O, et al. Bariatric surgery induces white and grey matter density recovery in the morbidly obese: a voxel-based morphometric study. Hum Brain Mapp 2016; 37: 3745–3756. [DOI] [PMC free article] [PubMed] [Google Scholar]
- 145.Jais A, Bruning JC.Hypothalamic inflammation in obesity and metabolic disease. J Clin Invest 2017; 127: 24–32. [DOI] [PMC free article] [PubMed] [Google Scholar]
- 146.Michinaga S, Koyama Y.Pathogenesis of brain edema and investigation into anti-edema drugs. Int J Mol Sci 2015; 16: 9949–9975. [DOI] [PMC free article] [PubMed] [Google Scholar]
- 147.Candelario-Jalil ETS, Rosenberg GA.Brain edema in neurological diseases. In: JP Blass. (ed) Neurochemical mechanisms in disease. New York, NY: Springer, 2011. [Google Scholar]
- 148.Valdearcos M, Douglass JD, Robblee MM, et al. Microglial inflammatory signaling orchestrates the hypothalamic immune response to dietary excess and mediates obesity susceptibility. Cell Metab 2017; 26: 185–197.e183. [DOI] [PMC free article] [PubMed] [Google Scholar]