Abstract
An optical fiber interferometer-based ballistocardiography (BCG) monitoring system aided with the IJK complex detection algorithm is proposed in this paper. A new phase modulation method based on a moving-coil transducer is developed to address the problem of signal fading in the optical fiber interferometer and keep the system in quadrature by the closed loop controller. As a result, a stable BCG signal without baseline drift can be obtained. This BCG monitor based on optical fiber interferometer using phase modulation method owns the advantages of compact, low-cost, portable, and user-friendly. In addition, an end-to-end modified U-net is developed to conduct pixel-wise classification in the BCG signal. This network can achieve high accuracy and shows its capability to segment IJK complex and body movement in the BCG signal. In conclusion, the proposed BCG monitoring system with IJK complex segmentation algorithm is potential and promising in healthcare applications.
1. Introduction
In the modern aging society, health caring has always been the major concern, especially in some developed countries. Vital signs monitoring, which can help to assess the health condition of human body, are significant in many healthcare applications. Among them, heartbeat monitoring is particularly important as cardiovascular diseases (CVDs) have become the leading death cause among various fatal diseases in the world [1]. For heartbeat monitoring, long-term service is essential no matter in clinic or home usage. To achieve long-term heartbeat monitoring, various methods or standards were proposed to characterize the heartbeat signal, such as electrocardiography (ECG) and photoplethysmography (PPG). ECG signal is the record of the electrical activity with heart pumping blood and it has been widely accepted as the main method to diagnose CVDs. During ECG monitoring, multiple electrodes are required to attach on specific positions of body and each pair of electrodes is called the lead. The 12-lead ECG is widely used in clinic [2]. Other than ECG, PPG is the biological signal measured via optic method, which can obtain the plethysmography of organs by placing a pulse oximeter on the finger [3]. PPG signal is based on the blood flow change and thus can be collected from the variation in the intensity of transmitted light (or reflected light) on the skin. Both PPG and ECG signals collection requires skin contact, which are developed as wearable devices. The wearable devices will inevitably discomfort the users, especially for heartbeat monitoring in the long-term way. Therefore, for long-term heartbeat monitoring, non-invasive and non-wearable heartbeat monitors will be preferred and may become popular in near future.
Ballistocardiography (BCG), which is the measurement of body recoils produced by heart ejection during every cardiac cycle, can be used to monitor cardiac activities in an unobtrusive way. A completed BCG signal is composed of multiple peaks, including H, I, J, K, L peak, and these peaks own corresponding physiological significance. For instance, the amplitude of major wave J peak is related to the aortic pulse pressure [4]. The BCG signal was firstly observed by Gordon in 1877 [5], and Isaac Starr et al. developed an instrument to measure this signal in a scientific manner in 1939 [6]. However, due to some limitations on measurement methods, BCG-related technology was not developed further and gradually replaced by ECG. Nowadays, BCG regains the spotlight with evolved sensing techniques and signal processing methods. In recent years, various BCG detection methods have been proposed. For example, O. T. Inan et al. proposed a standing BCG monitor based on a modified commercial bathroom scale in 2009 [7]. The obtained BCG recording matched well with the synchronously measured Doppler echocardiography. In addition, J. Alametsa et al. built a sitting position monitor based on electromechanical film (EMFi) sensor to measure BCG signal and demonstrated its better performance than acceleration sensors [8]. M. Liu et al. developed a low-power piezoelectric film sensor to track BCG signal in both sitting and standing positions [9]. However, these BCG detection approaches are based on the electronic sensing technology, which owns the intrinsic disadvantages of low-sensitivity and incapability for severe applications, such as vital signs monitoring in magnetic resonance imaging (MRI) with electromagnetic interference. Moreover, to remove the baseline drift during BCG detection, which is caused from ambient factors, multiple filters need to be introduced in the hardware system. It may lead to the signal distortion and degrade the further disease diagnosis performance.
Optical fiber sensor-based vital signs monitors have attracted much attention among researchers due to their intrinsic merits such as high sensitivity, immunity to electromagnetic interference and low cost. For example, a fiber Bragg grating (FBG) strain sensor was proposed to acquire BCG and respiration signals of patients during the MRI survey and the high accuracy was proved by the Bland-Altman analysis [10]. In addition, a micro bending optical fiber sensor was demonstrated to measure breath/heartbeat rate (BR/HR) and BCG waveform [11]. However, the demodulation devices of FBG sensors are bulky and quite expensive, which is not suitable for practical applications. The sensitivity of micro bending-based sensors is limited, which may lose the BCG details. To overcome these drawbacks, our group focus on the phase-sensitive optical fiber interferometer schemes and several vital signs monitors have been demonstrated [12–14]. However, optical fiber interferometers are subject to the signal fading effect, which also makes the sensor unsuitable for long-term monitoring. Although many modulation and demodulation technologies can be utilized to address the signal fading problem, such as 3 × 3 coupler-based signal demodulation [15] and piezoelectric transducer-based (PZT) phase modulation [16], they are also exposed to some limitations for specific BCG monitoring. For example, piezoelectric cylinders are bulky and cannot be integrated into a compact BCG monitoring system. Therefore, in this paper, we propose a BCG monitoring system utilizing a new phase modulation method based on the moving-coil transducer to realize the long-term and stable heartbeat monitoring. The proposed transducer is compact and low-cost, which can be easily integrated into the sensing system without any bulk component. The phase modulation method can keep the interferometric output signal in quadrature by the closed loop controller and transducer.
Since BCG signal can be interfered and distorted by the motion artefact and ambient noise during the measurement, effective individual heartbeat signal extraction in the BCG signal is a crucial task for further HR analysis and CVDs diagnosis. Currently, many signal processing methods are proposed to locate J peak or IJK complex in the BCG signals. Among them, template matching is a common method based on the correlation between a fixed heartbeat template and the obtained signal [17]. Other than that, the dispersion-maximum algorithm is also adopted to detect J peak and calculate the HR [18]. In addition, machine learning algorithm, such as k-means clustering and support vector machine (SVM), are proposed to classify different peaks and thus extract J peak from BCG signals [19–20]. Also, a composite method consisting of convolutional neural network (CNN) and extreme learning machine (ELM) is used to detect the IJK complex [21]. However, these methods are limited on some points. For example, template matching method depends heavily on the fixed individual heartbeat template while the waveforms of BCG signal are variable, which results in low robustness. Traditional machine learning algorithms, which is commonly used in classification tasks, need to design and extract features. The process is time-consuming and largely depends on the expert knowledge. Although the deep learning algorithm, which can directly extract features, is used in [21], the ECG is necessary to assist in segmentation of BCG signal to find the approximate location of J peaks. Therefore, in this paper, based on the collected signal, we propose an end-to-end deep learning algorithm based on modified U-net to segment IJK complex and body movement signal in high-resolution from the BCG. The features can be learned by the network during training without another features engineering. More importantly, the BCG signal can be directly fed into the network without much processing, such as removing body movement signal, which largely simplifies the signal processing. In conclusion, in our work, we demonstrate a BCG monitoring system based on an optical fiber interferometer adopting a new phase modulation method, which can remove the baseline drift to realize stable and accurate BCG signal collection. For signal processing, we propose an end-to-end modified U-net to segment the IJK complex and body movement signal with high accuracy. This BCG monitoring system can be an effective method to monitor cardiac activity in non-invasive and long-term way, which owns great potential in healthcare applications.
2. BCG monitoring system
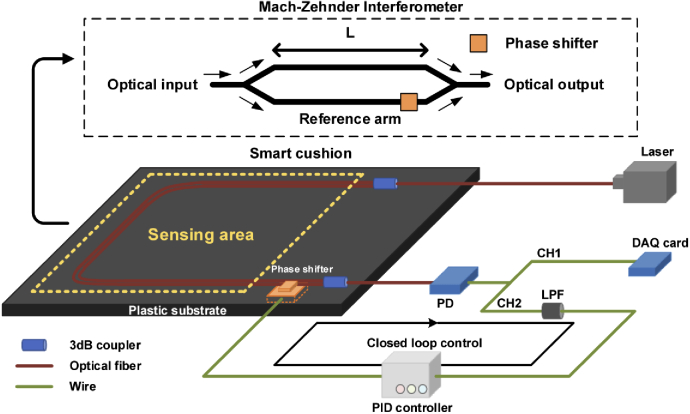
The BCG monitoring system is shown in Fig. 1. It consists of the Mach-Zehnder interferometer (MZI)-based BCG monitor, phase shifter and proportional-integral-derivative (PID) controller, the detailed introduction of which are presented in the subsequent section. The MZI and phase shifter are fixed on a plastic substrate, which can be packaged as a smart cushion to achieve non-invasive BCG monitoring. The sensing area for BCG signal detection of sitting subjects is highlighted as yellow dotted box. The light source is a DFB laser operating at 1550 nm while the receiver is a low-speed photodetector (PD). The arms of MZI, including the sensing arm and reference arm, are fixed in the parallel form. The phase shifter is placed outside the sensing area, which is used to maintain the interferometer system in quadrature by a PID controller. The received signal in the PD will be divided into two channels. Channel 1 (CH1) is the raw data and channel 2 (CH2) is obtained results through a low-pass filter (LPF), which will be fed into the PID controller. The controller can compensate the phase drift to make sure the system works in the quadrature point through the phase shifter. The raw data from CH1 is collected by a DAQ card (National Instrument, USB6001).
Fig. 1.
The BCG monitoring system.
2.1. Mach-Zehnder interferometer-based BCG monitor
The BCG monitor is based on the highly sensitive optical fiber MZI. The optical fiber MZI contains two 3 dB couplers, which work as optical splitter and optical coupler to form interference. A PD is used to convert the BCG related variational optical intensity signal to the electrical signal. The output optical intensity I can be expressed by
| (1) |
where I1 and I2 are output optical intensities from two arms and φ is the optical phase difference within these two arms, which can be given by
| (2) |
where λ is the central wavelength of laser and n is the refractive index of standard optical fiber. L1 and L2 are the length of two arms while δL is their length difference. In MZI design, the two arms of the interferometer are about 40 cm long and their length difference is 5 mm. These two arms are bent side by side without overlap in a semicircle form and packaged on a plastic substrate integrated into a cushion. When the subject sits on the cushion, the body recoils resulted from heartbeats introduce phase difference in the interferometer and the corresponding intensity variation can be used for BCG signal extraction.
For MZI, the signal fading effect is a common problem, in which the bias point will shift, and the sensitivity will change accordingly. Finally, it can lead to BCG signal distortion. There are many phase modulation methods to solve this problem, such as active homodyne and passive homodyne. Our proposed phase modulation method is based on active homodyne method, in which a moving-coil transducer is used as the phase shifter to keep the system in quadrature (φ = π/2). The phase shifter with a compact size can be easily integrated into the smart cushion without any bulk component.
2.2. Phase shifter based on moving-coil transducer
In the BCG monitoring system, we use a compact moving-coil transducer as the phase shifter, the size of which is 18(Length)×12(Width)×3(Height) mm. Compared with bulky PZT, the moving-coil transducer can be easily integrated into the cushion type BCG monitor. In addition, unlike PZT-based method, additional bending loss will not be introduced by the transducer since the optical fiber is directly fixed on the transducer instead of coiling. As shown in Fig. 2(a), the transducer is embedded in the plastic substrate and the reference arm of MZI is tightly fixed on the surface of transducer. Figure 2(b) is the sketch of the moving-coil transducer, in which the coil is placed in the magnetic field. When the driven current changes, a tiny displacement, which is perpendicular to the fixed optical fiber, is introduced by the transducer resulted from the electromagnetic induction, as shown in Fig. 2(b). The relationship between the displacement x and driven current I can be given by
| (3) |
where B, L, N, and k are magnetic field intensity, length of coil in the magnetic field, number of turns in the coil and the elastic coefficient of spring, respectively. Therefore, the strain will be introduced in the optical fiber by the tiny displacement derived from the transducer, and thus the phase can be modulated and controlled by the transducer.
Fig. 2.
(a) Integrated MZI with transducer. (b) Sketch of moving-coil transducer.
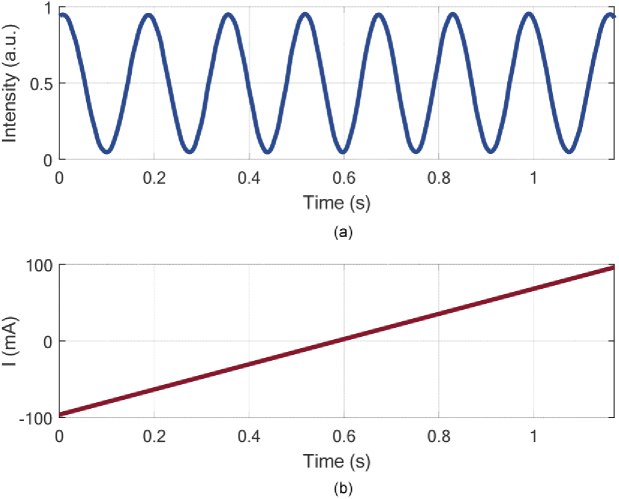
The output intensity of MZI presents a cosine waveform with the increasing driven current from -100 mA to 100 mA on transducer, as shown in Fig. 3. Then, the induced phase change under driven current can be calculated as 0.22 rad/mA. Therefore, by altering the driven current of transducer, the phase drift will be compensated, and the system can be kept in quadrature.
Fig. 3.
The relationship between resultant output cosine signal in the MZI (a) and driven current (b).
2.3. Compensation method
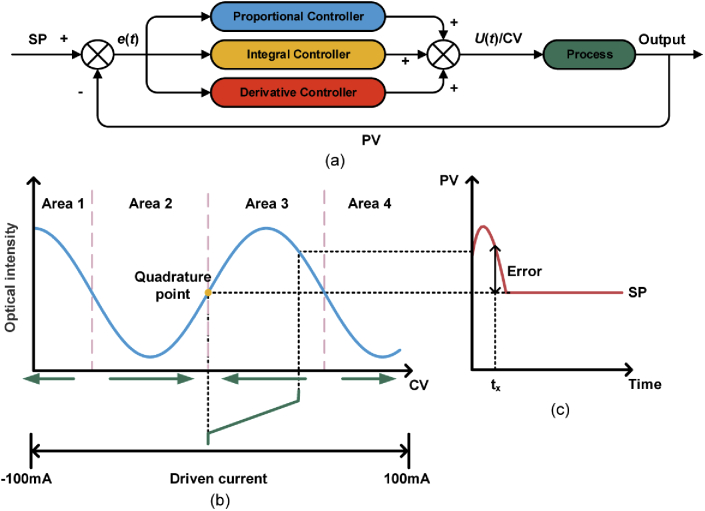
To maintain the MZI system in quadrature, we use a PID controller to control the moving-coil transducer-based phase shifter. The MZI, phase shifter and PID controller form a closed loop control system. The PID controller consists of the proportional, integral and derivative terms and the detailed principle is described in Fig. 4(a). The set point (SP) and process variable (PV) are the desired value and the feedback value, respectively. Error is the difference between SP and PV. Based on the error obtained from the subtractor, the PID controller outputs the control variable (CV) according to the following equation:
| (4) |
where U(t) and e(t) represent CV and error at time t, and KP, TI and TD are the coefficients of proportional, integral and derivative controller [22]. The phase shifter will work to compensate the phase drift and output PV accordingly, and the PID controller will work after receiving PV and calculate the error to update the CV in the closed loop control system according to Eq. (4).
Fig. 4.
(a) Principle of the closed loop control system with PID controller. (b) Variation of optical intensity toward driven current. (c) Electrical signals in the time domain.
The detailed compensation process is shown in Fig. 4(b) and (c). Figure 4(b) represents the variation of output optical intensity toward driven current and Fig. 4(c) is the electrical signals from PD in the time domain. In our BCG monitoring system, SP is the quadrature point (φ = π/2), which is set as half of peak-to-peak value in output waveform. PV is the filtered signal in CH2, and CV is the driven current of phase shifter. The error at time tx is the value of SP minus PV, as shown in Fig. 4(c), which can be obtained by the PID controller. Based on the calculated error and Eq. (4), the PID controller will adjust the phase shifter, in which the moving-coil transducer works based on Eq. (3) to eventually keep the MZI system in quadrature. When the error is less than 0, as shown in the area 1 and area 3 of Fig. 4(b), CV will decline accordingly to keep the system in quadrature. Inversely, in the area 2 and area 4 of Fig. 4(b), the error is large than 0, and CV will increase to pull the bias point back to the quadrature point. In consequence, the bias point will be kept in the quadrature point of the rising edge. Prior to data collection, the system need calibration. A manual mode is set in the system, in which the phase shifter is triggered to generate cosine waves, and SP is obtained as the half of peak-to-peak value. As presented before, the dynamic range of phase shifter is 44 rad. In addition, to keep the system up, a CV reset method is introduced and the driven current will be reset to 0 mA when the driven current reaches the limit of ±100 mA. Therefore, according to this compensation way, the BCG monitoring system can always work in the quadrature point of rising edge with stable performance and the BCG signal can be obtained with desired waveform.
2.4. BCG result
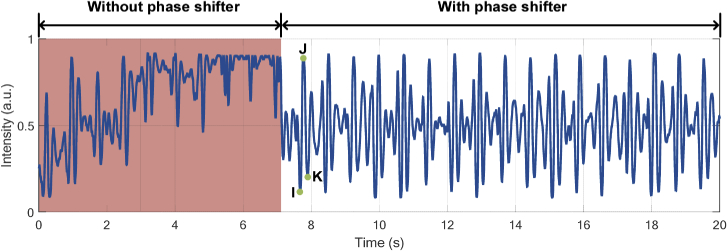
When the subject sits on the smart cushion, vibration signals from body recoils in reaction to heartbeat can be caught, and the BCG signal is recorded by DAQ card. To compare the results collected using our proposed phase modulation method or not, we directly collect the signal from CH1 firstly and then activate the closed loop control system for continuous new data collection. The summarized results are shown in Fig. 5. In the first 7-second duration marked with red background, only part of BCG can be obtained due to the aforementioned signal fading effect and these signals are distorted as the result of bias point deviation. In contrast, when the closed loop control system is activated, signal fading effect is mitigated and the system keeps working on the quadrature point. The collected new BCG signal is shown in the last 13 second. It can be seen that the baseline drift introduced by ambient noise is removed and desired BCG signal with specific peaks, including I, J, K peaks, can be obtained successfully and continuously, which demonstrates that our proposed phase modulation and compensation method can realize the long-term BCG monitoring. In BCG-related healthcare applications, I, J, K peaks play important roles for specific vital signs measurement and even disease diagnosis. Therefore, their extraction with high accuracy and stable performance becomes necessary. According to this, we proposed an IJK complex and body movement segmentation algorithm and present it as follows.
Fig. 5.
Raw data of BCG signals.
3. End-to-end IJK complex segmentation algorithm
3.1. Modified U-net
U-net [23] is a widely used high-resolution segmentation algorithm and it has been demonstrated with excellent performance in the task of biomedical image segmentation. U-net can perform pixel-wise classification, which means each pixel is assigned to one type of class. U-net is based on the CNN, consisting of the contracting path and expansive path. In the contracting path, the size of feature map will be reduced by the pooling operation, and in contrast, the output resolution can be increased by the upsampling operation in the expansive path. Therefore, the segmentation map in the output layer will have the same size with input segment, and it can give the prediction of the input segment in pixel level, which is a pixel-to-pixel mapping.
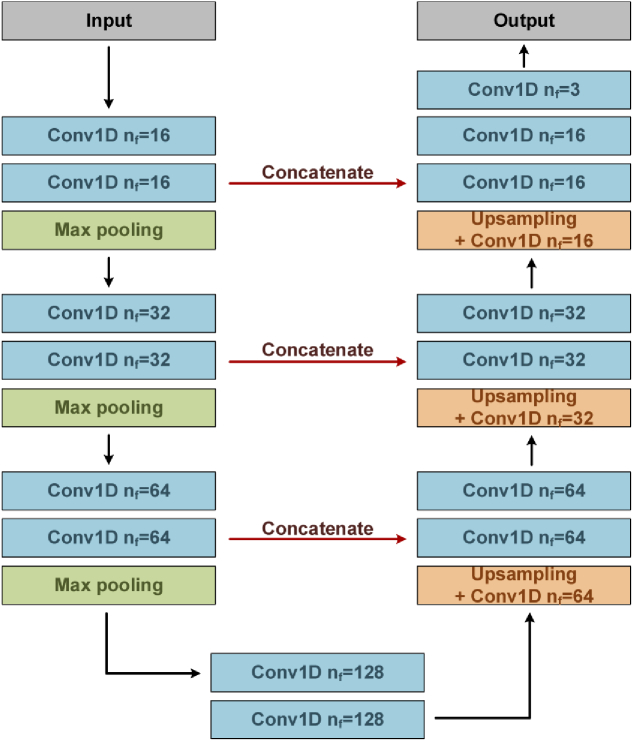
BCG is a flexible signal and varies from person to person. The U-net is modified to extract the location information of IJK complex and body movement signal, which can be used for beat-wise BCG analysis. The architecture of modified U-net is shown in Fig. 6, in which three contracting and expansive stages are included. The left part is contracting path, each stage in which consists of repeated two 15×1 1-D convolutional layers with ReLU [24] activation function followed by a 2×1 max pooling layer with stride 2 to halve the size of feature maps. The number of filters (nf) in the convolutional layer doubles at each downsampling stage, as shown in Fig. 6. The right part is expansive path, and at each stage, a upsampling layer followed by a 2×1 convolutional layer is used to double the size of feature map and halve the number of feature channels. The feature map in the corresponding contracting stage is directly duplicated and combined to the upsampled feature map in the expansive path. The combined feature map is followed by two 15×1 1-D convolutional layers with ReLU and the filter number of convolutional layer halved at each upsampling stage, as shown in Fig. 6. Compared with the conventional U-net, since we use same padding instead of valid padding in the convolutional layer, cropping is no need in the concatenation process. Finally, a convolutional layer with softmax activation function, the kernel size and filter number of which are 1×1 and 3, is used in the output layer to predict the class of each sampling point, including IJK complex, body movement signal and background (non IJK complex). In total, the network consists of 18 convolutional layers.
Fig. 6.
The architecture of modified U-net. nf is the number of filters in 1-D convolution layer.
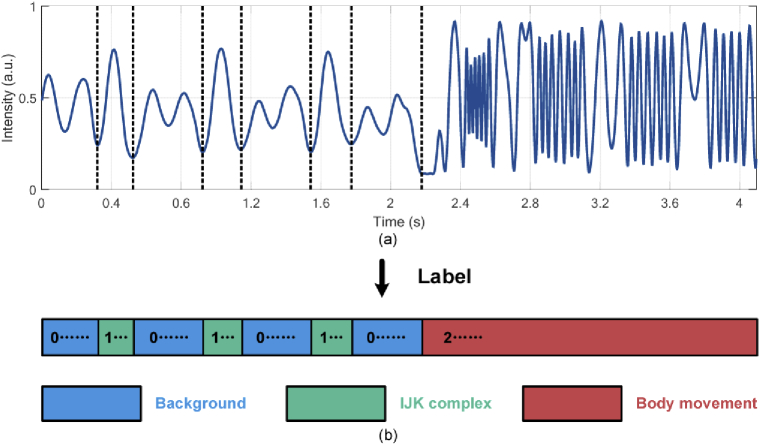
The raw data is collected from different subjects in healthy condition and the sampling rate is 500 Hz. During data collection, the subjects are required to sit on the smart cushion and remain still for several minutes. To collect uniform body movement data, subjects are asked to move for multiple times. All the raw data are segmented with the same data length of 2048 and one of these segments lasting for 4.096 second with both heartbeat and body movement signal is shown in Fig. 7(a), in which the intensity is normalized. The background, IJK complex and body movement signal are labelled as 0, 1 and 2 in the corresponding sampling point and we can get the label with the same size as input data, as shown in Fig. 7(b).
Fig. 7.
A BCG segment (a) with corresponding label (b).
To train the network, we totally collect 1147 segments, in which 4948 individual heartbeat (IJK complex) and body movement signal are included. The ratio between the training set and validation set is 8 to 2. Adam optimization method [25] with default parameters (learning rate: 0.001, beta-1: 0.9, beta-2: 0.99) is used as the optimizer. The cross-entropy loss is adopted as loss function. In addition, mini-batch gradient descent is adopted and the batch size of which is 16. During the training stage, when higher accuracy of validation set is achieved, the parameters of network will be saved.
3.2. Segmentation result
To test the modified U-net, we use 511 BCG segments from 7 subjects as test set, including 2107 individual heartbeat (IJK complex) and body movement signal. These test data were collected in different days and 3 subjects did not participate in the data collection of training set. To evaluate the segmentation performance of the network, three metrics including pixel accuracy (PA), mean pixel accuracy (MPA) and mean intersection over union (MIOU) [26] are adopted. PA is the percentage of the correctly labeled pixels to total pixel, which can be given by
| (5) |
where nij means the number of pixels in class i are assigned to class j. MPA represents the mean of pixel accuracy in each class, which can be described as
| (6) |
where ncl is the number of different classes. MIOU is a commonly used metric in the task of segmentation, which represents the similarity between the predicted region and actual region. MIOU can be given by
| (7) |
Since the BCG signal is one-dimension data, the number of pixels in the above equation can be replaced by the number of sampling points in the data.
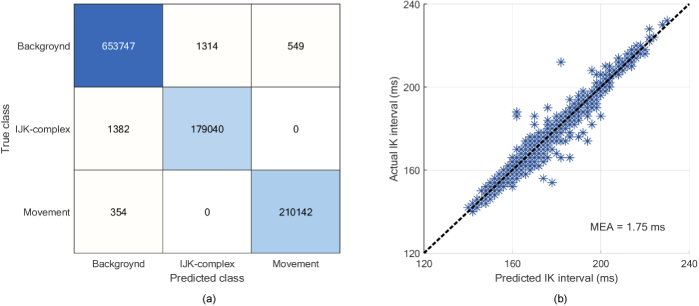
Figure 8(a) shows the confusion matrix of test set in the pixel-wise classification task. We can calculate the PA, MPA and MIOU through the confusion matrix, which is 99.66%, 99.59% and 99.18%, respectively. In addition, to verify the accuracy of I-K intervals in the predicted IJK complex, we calculate the mean absolute error (MAE) between predicted and actual I-K intervals in the test set and the result of which is 1.75 ms. The scatterplot of predicted versus actual I-K intervals is shown in Fig. 8(b). The results show the modified U-net performs well on the task of IJK complex and body movement segmentation in the BCG data.
Fig. 8.
(a) Confusion matrix of test set. (b) The scatterplot of predicted versus actual I-K interval.
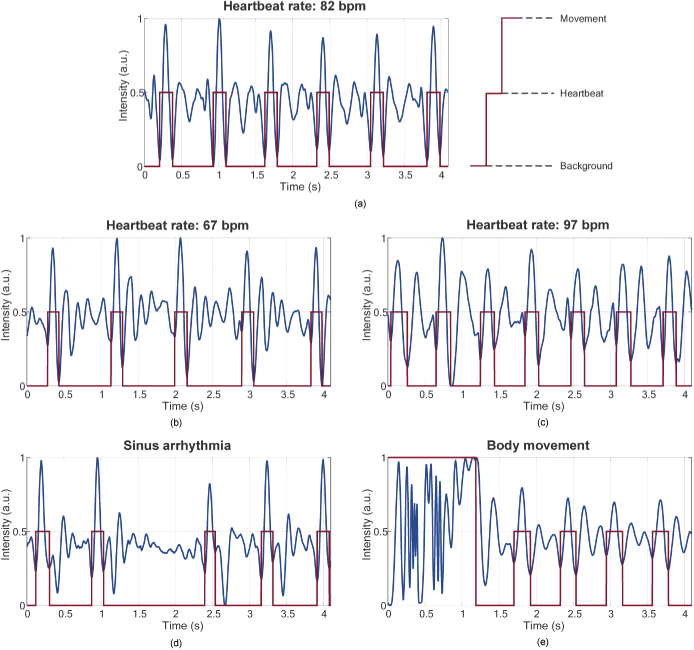
Figure 9 shows five kinds of segmentation results of BCG signal, the red line of which is the classification result. Figure 9(a) is a BCG segment from one of subjects, in which we can find that there are six heartbeats during 4.096 second (82 bpm) and the position of each IJK complex can be predicted by the network accurately. Also, to confirm the feasibility of IJK complex detection for subjects with different HRs, we select two sets of BCG segment from another two subjects with the lower HR (67 bpm) and the higher HR (97 bpm) shown in Fig. 9(b) and (c), respectively. In addition, though the 7 subjects in the experiment are all in health condition, we also find some BCG segments with occasional sinus arrhythmia from one subject, which may be caused by nervous, as shown in Fig. 9(d), and the IJK complex can also be segmented accurately. Apart from IJK complex, the network can also implement segmentation of body movement signal. A BCG segment recording the body movement on the chair is shown in Fig. 9(e), and the IJK complex and body movement signal can be segmented perfectly by the network. In summary, compared with many existing algorithms, our modified U-net is an end-to-end algorithm and it can accurately detect the location information of IJK complex and body movement in the BCG signal without much processing, which is time-saving for BCG signal analysis.
Fig. 9.
BCG segmentation results based on modified U-net: (a) BCG signal with HR of 82 bpm; (b) BCG signal with HR of 67 bpm; (c) BCG signal with HR of 97 bpm; (d) BCG signal with occasional sinus arrhythmia; (e) BCG signal with body movement.
4. Conclusion
In this paper, we propose a BCG monitoring system based on optical fiber interferometer with a low-cost and easily integrated phase shifter. The proposed moving-coil transducer-based phase shifter can maintain the optical fiber interferometer system in quadrature by the PID controller. The signal fading problem can be solved successfully and the BCG signal with good quality can be obtained. On the other hand, we develop an end-to-end modified U-net to segment IJK complex and body movement signal in the BCG. We test our network on 7 healthy subjects and the PA, MPA and MIOU are 99.66%, 99.59% and 99.18%. The MAE of predicted IK interval is 1.75 ms. The result shows that our proposed network owns good performance in the task of IJK complex and body movement signal segmentation. The proposed BCG monitoring system aided with the IJK complex detection algorithm can implement a long-term and stable BCG monitoring for users, which has the tremendous potential in future healthcare applications.
Funding
National Natural Science Foundation of China10.13039/501100001809 (61971372); Research Grants Council, University Grants Committee10.13039/501100002920 (Grant 15200718).
Disclosures
The authors declare that there are no conflicts of interest related to this article.
References
- 1.Namara K. M., Alzubaidi H., Jackson J. K., “Cardiovascular Disease as a Leading Cause of Death: How Are Pharmacists Getting Involved?” IPRP 8, 1–11 (2019). 10.2147/IPRP.S133088 [DOI] [PMC free article] [PubMed] [Google Scholar]
- 2.Kligfield P., Gettes L. S., Bailey J. J., Childers R., Deal B. J., Hancock E. W., Herpen G. V., Kors J. A., Macfarlane P., Mirvis D. M., Pahlm O., Rautaharju P., Wagner G. S., “Recommendations for the standardization and interpretation of the electrocardiogram: part I: the electrocardiogram and its technology a scientific statement from the American Heart Association Electrocardiography and Arrhythmias Committee, Council on Clinical Cardiology; the American College of Cardiology Foundation; and the Heart Rhythm Society endorsed by the International Society for Computerized Electrocardiology,” J. Am. Coll. Cardiol. 49(10), 1109–1127 (2007). 10.1016/j.jacc.2007.01.024 [DOI] [PubMed] [Google Scholar]
- 3.Mascaro S. A., Asada H. H., “Photoplethysmograph fingernail sensors for measuring finger forces without haptic obstruction,” IEEE Trans. Robot. Automat. 17(5), 698–708 (2001). 10.1109/70.964669 [DOI] [Google Scholar]
- 4.Kim C. S., Ober S. L., Mcmurtry M. S., Finegan B. A., Inan O. T., Mukkamala R., Hahn J. O., “Ballistocardiogram: Mechanism and Potential for Unobtrusive Cardiovascular Health Monitoring,” Sci. Rep. 6(1), 31297 (2016). 10.1038/srep31297 [DOI] [PMC free article] [PubMed] [Google Scholar]
- 5.Gordon J. W., “Certain molar movements of the human body produced by the circulation of the blood,” J. Appl. Physiol. 11(Pt 3), 533–536 (1877). [PMC free article] [PubMed] [Google Scholar]
- 6.Starr I., Rawson A. J., Schroeder H. A., Joseph N. R., “Studies on the estimation of cardiac output in man, and of abnormalities in cardiac function, from the heart’s recoil and the blood’s impacts; the ballistocardiogram,” Am. J. Physiol. 127(1), 1–28 (1939). 10.1152/ajplegacy.1939.127.1.1 [DOI] [Google Scholar]
- 7.Inan O. T., Etemadi M., Paloma A., Giovangrandi L., Kovacs G. T. A., “Non-invasive cardiac output trending during exercise recovery on a bathroom-scale-based ballistocardiograph,” Physiol. Meas. 30(3), 261–274 (2009). 10.1088/0967-3334/30/3/003 [DOI] [PubMed] [Google Scholar]
- 8.Alametsäa J., Värri A., Viik J., Hyttinen J., Palomäki A., “Ballistocardiogaphic studies with acceleration and electromechanical film sensors,” J. Biomed. Eng. 31(9), 1154–1165 (2009). 10.1016/j.medengphy.2009.07.020 [DOI] [PubMed] [Google Scholar]
- 9.Liu M., Jiang F., Jiang H., Ye S., Chen H., “Low-power, noninvasive measurement system for wearable ballistocardiography in sitting and standing positions,” Comput. Ind. 91, 24–32 (2017). 10.1016/j.compind.2017.05.005 [DOI] [Google Scholar]
- 10.Dziuda Ł., Krej M., Skibniewski F. W., “Fiber Bragg grating strain sensor incorporated to monitor patient vital signs during MRI,” IEEE Sens. J. 13(12), 4986–4991 (2013). 10.1109/JSEN.2013.2279160 [DOI] [Google Scholar]
- 11.Chen Z., Hu J., Yu C., “Fiber senor for long-range and biomedical measurements,” in 2013 12th International Conference on Optical Communications and Networks (ICOCN), 1–4, (2013). [Google Scholar]
- 12.Tan F., Chen S., Lyu W., Liu Z., Yu C., Lu C., Tam H. Y., “Non-invasive human vital signs monitoring based on twin-core optical fiber sensors,” Biomed. Opt. Express 10(11), 5940–5952 (2019). 10.1364/BOE.10.005940 [DOI] [PMC free article] [PubMed] [Google Scholar]
- 13.Chen S., Tan F., Huang Z., Yang T., Tu J., Yu C., “Non-invasive smart monitoring system based on multi-core fiber optic interferometers,” in 2018 Asia Communications and Photonics Conference (ACP; ), 1–3, (2018). [Google Scholar]
- 14.Lyu W., Tan F., Chen S., Yu C., “Myocardial Contractility Assessment using Fiber Optic Sensors,” 2019 Asia Communications and Photonics Conference (ACP), (2019). [Google Scholar]
- 15.Priest R. G., “Analysis of Fiber Interferometer Utilizing 3×3 Fiber Coupler,” IEEE Trans. Microwave Theory Tech. 30(10), 1589–1591 (1982). 10.1109/TMTT.1982.1131294 [DOI] [Google Scholar]
- 16.Jackson D. A., Priest R., Dandridge A., Tveten A. B., “Elimination of drift in a single-mode optical fiber interferometer using a piezoelectrically stretched coiled fiber,” Appl. Opt. 19(17), 2926–2929 (1980). 10.1364/AO.19.002926 [DOI] [PubMed] [Google Scholar]
- 17.Shin J. H., Choi B. H., Lim Y. G., Jeong D. U., Park K. S., “Automatic ballistocardiogram (BCG) beat detection using a template matching approach,” in 2008 30th Annual International Conference of the IEEE Engineering in Medicine and Biology Society, 1144–1146 (2008). [DOI] [PubMed] [Google Scholar]
- 18.Choe S.-T., Cho W.-D., “Simplified real-time heartbeat detection in ballistocardiography using a dispersion-maximum method,” Biomed. Res. 28(9), 1 (2017). [Google Scholar]
- 19.Brüser C., Stadlthanner K., Waele S. D., Leonhardt S., “Adaptive Beat-to-Beat Heart Rate Estimation in Ballistocardiograms,” IEEE Trans. Inform. Technol. Biomed. 15(5), 778–786 (2011). 10.1109/TITB.2011.2128337 [DOI] [PubMed] [Google Scholar]
- 20.Brüser C., Zink M. D. H., Winter S., Schauerte P., Leonhardt S., “A feasibility study on the automatic detection of atrial fibrillation using an unobtrusive bed-mounted sensor,” in 2011 Computing in Cardiology, 13–16 (2011). [Google Scholar]
- 21.Lu H., Zhang H., Lin Z., Huat N. S., (2018, July). “A Novel Deep Learning based Neural Network for Heartbeat Detection in Ballistocardiograph,” In 40th Annual International Conference of the IEEE Engineering in Medicine and Biology Society (EMBC), 2563–2566 (2018). [DOI] [PubMed] [Google Scholar]
- 22.Ang K. H., Chong G., Li Y., “PID control system analysis, design, and technology,” IEEE Trans. Contr. Syst. Technol. 13(4), 559–576 (2005). 10.1109/TCST.2005.847331 [DOI] [Google Scholar]
- 23.Ronneberger O., Fischer P., Brox T., “U-Net: Convolutional Networks for Biomedical Image Segmentation,” arXiv, In International Conference on Medical image computing and computer-assisted intervention, 234–241 (2015). [Google Scholar]
- 24.Nair V., Hinton G. E., “Rectified linear units improve restricted boltzmann machines,” in Proceedings of the 27th international conference on machine learning (ICML-10), 807–814 (2010). [Google Scholar]
- 25.Kingma D. P., Ba J., “Adam: A method for stochastic optimization,” arXiv, 1412.6980 (2014).
- 26.Shelhamer E., Long J., Darrell T., “Fully Convolutional Networks for Semantic Segmentation,” IEEE Trans. Pattern Anal. Mach. Intell. 39(4), 640–651 (2017). 10.1109/TPAMI.2016.2572683 [DOI] [PubMed] [Google Scholar]


