Abstract
It is presently not known whether neuronal cell type diversity, defined by cell type-specific anatomical, biophysical, functional and molecular signatures, can be reduced to relatively simple molecular descriptors of neuronal identity 1. Examination of the expression of all conserved homeodomain proteins encoded by the Caenorhabditis elegans genome 2 reveals that the complete set of 118 C. elegans neuron classes can be described individually by unique combinations of homeodomain protein expression, thereby providing the simplest currently known descriptor of neuronal diversity. Computational as well as genetic loss of function analyses corroborate that homeodomain proteins not only provide unique descriptors of neuron type, but also play a critical role specifying neuronal identity. We speculate that the pervasive employment of homeobox genes in defining unique neuronal identities reflects the evolutionary history of neuronal cell-type specification.
The classification of neurons into distinct types is an important step toward understanding the logic of nervous system evolution, development and function 1. Traditionally, neuron type classification has relied on anatomical features, later expanded to include electrophysiological features and eventually molecular markers 1. The emergence of high-throughput transcriptome profiling, including single-cell sequencing, has deepened our appreciation for the enormous complexity of neuronal cell types among many different animal species, from very simple (e.g. cnidarian) to very complex (mammals)3–6. Ongoing molecular classifications of neuron types raise a number of intriguing questions: is there a minimal descriptor for neuronal identity, i.e. are their specific subsets of molecular features that are sufficient to capture the full complexity of all neuronal cell types? Or can unique cellular identities only be described by their combined expression of many different types of genes? And, from a developmental standpoint, how are the molecular signatures that characterize individual neuron types genetically specified during differentiation?
Homeodomain transcription factors, encoded by homeobox genes 7, have emerged as possible answers to these questions. Loss of function studies in a number of distinct organisms have demonstrated their importance in neuronal cell-type specification. For example, in C. elegans, the first neuronal-specification genes positionally cloned after unbiased mutant screens were homeobox genes (mec-3, unc-4, unc-30, unc-86)8–11. Subsequent mutant analysis revealed the involvement of many additional homeobox genes in neuronal identity control in the nematode 12. Homeobox genes have also surfaced as neuronal identity specifiers in other organisms (e.g.7,13–17) and, intriguingly, recent single-cell profiling of isolates from many different regions of the mouse CNS has shown that homeobox genes are the gene family the best distinguishes CNS neuron classes 4. A similar discriminatory power for homeobox gene expression - particularly, the combinatorial expression of distinct homeobox genes - was revealed through the bulk sequencing of 179 distinct, genetically- and anatomically-identified mouse cell populations 18. Transcriptome analysis in the visual system and the ventral nerve cord of Drosophila also revealed that homeobox genes display a more discriminatory expression profile than other transcription factor-encoding genes 19,20. However, due to the complexity of the mouse and even the fly nervous system, and the resulting incomplete coverage of all neuronal cell types, these previous studies have not been able to test the tantalizing possibility that the expression of homeobox genes might uniquely identify every single cell type in the entire nervous system. We test this possibility here in the context of the nervous system of the C. elegans model system, in which fine-grained anatomical analysis has previously charted the precise repertoire of neuronal cell types. The nervous system of the adult hermaphrodite is composed of 302 neurons classified into 118 anatomically distinct types and several additional subtypes 21,22. We set out to systematically address how much of this neuronal cell-type diversity can possibly be explained by homeobox genes.
C. elegans homeobox genes
The C. elegans genome encodes 102 homeobox genes (see Methods), less than half of the number of homeobox genes present in mammalian genomes 2,23,24. As in other animal genomes, C. elegans homeodomain proteins do not constitute the largest family of transcription factors and only account for ~10% of all transcription factor-encoding genes25,26. Of the 102 C. elegans homeobox genes, 70 have homologs in other invertebrate and vertebrate genomes, 18 are conserved only in nematodes and 14 are not conserved in any other known Caenorhabditis species (Fig.1a)2. C. elegans contains representatives of all subclasses of mammalian homeobox genes, characterized by specific sequence features within the homeodomain (e.g. Paired-type homeodomain) or by the presence of additional domains (e.g., the POU or LIM domain)(Fig.1a) 2. Like in other animal genomes, only small fraction of all C. elegans homeobox genes are Antennapedia-like HOX cluster genes 23,24.
Figure 1: The homeobox gene family in C. elegans and representative expression patterns.
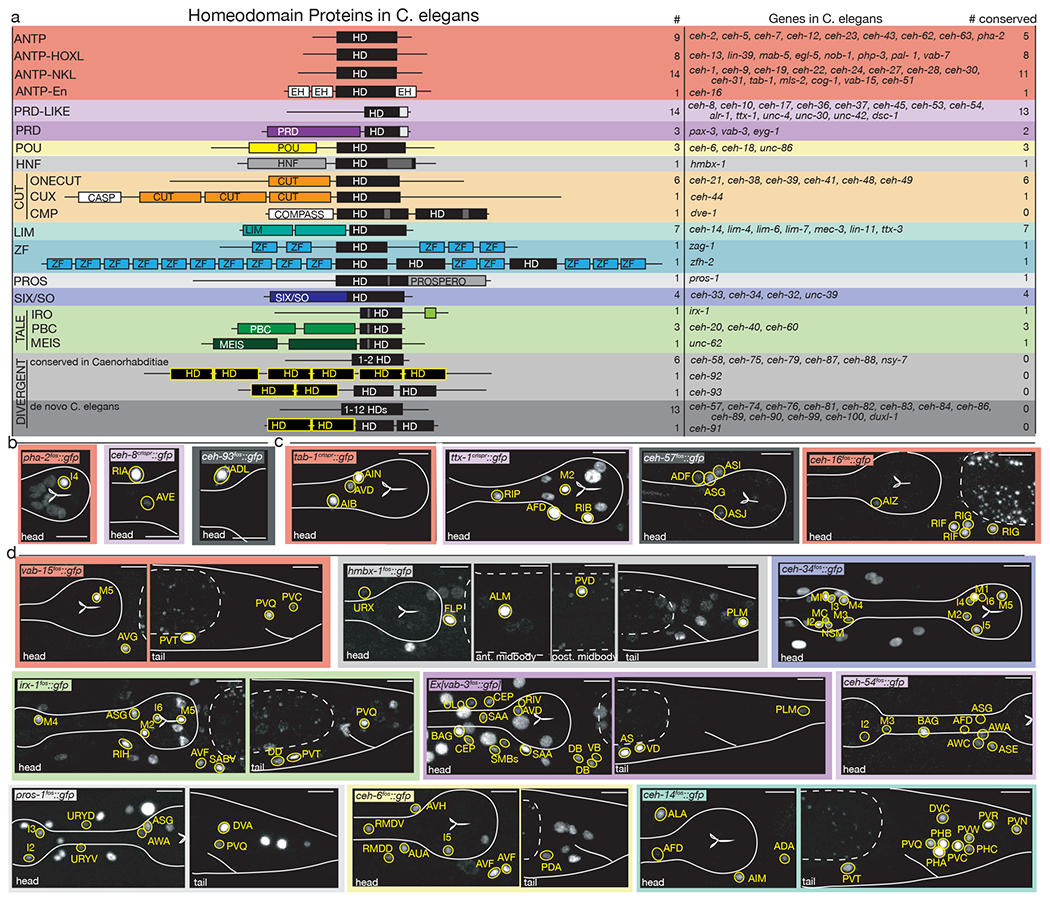
(a) Cartoon representations of homeodomain proteins and their associated domains by subfamily. Numbers of homeobox genes in C. elegans, names of homeobox genes in C. elegans, and number of conserved homeobox genes in humans are based on 2. HD = homeodomain. Yellow “HD” indicates nematode-specific HOCHOB domain, a derivative of the homeodomain 2.
(b-d) Representative images of homeobox genes expressed in 1-2 neuron classes (b), 3-4 neuron classes (c) or 5-18 neuron classes (d). Neurons were identified by overlap with the NeuroPAL landmark strain, outlined and labeled in yellow. Head structures including the pharynx were outlined in white for visualization. Autofluorescence common to gut tissue is outlined with a white dashed line. An n of 10 worms were analyzed for each reporter strain. Scale in bottom or top right of the figure represents 10 um. All other expression patterns are shown in ED Fig.1–8.
Analysis of homeodomain protein expression.
The expression pattern of a number of C. elegans homeobox genes has been reported, but mostly not with individual neuron resolution and almost entirely with reporter reagents that do not capture the full complement of regulatory sequences (SI Table 1)2,12,27. To comprehensively analyze the expression pattern of homeodomain proteins throughout the entire nervous system, we used fosmid-based reporter transgenes that contain the full intergenic genomic context of the respective homeobox genes and/or engineered gfp into homeobox gene loci using CRISPR/Cas9 genome engineering. As expected, our fosmid and/or endogenous reporter alleles reveal novel sites of expression of previously reported homeobox genes, in addition to providing expression patterns of many dozen previously uncharacterized homeobox genes (SI Table 1, 2). Since we always fused gfp to the coding sequences, our analysis infers protein expression which has the intrinsic advantages to capture posttranscriptional regulatory events not revealed through transcriptomic approaches.
We built an expression atlas of 101 of the 102 homeodomain proteins, including all the 70 homeodomain proteins that are conserved outside the nematode phylum, plus all of the 18 nematode-specific homeodomain proteins, and 13 of the 14 C. elegans-specific homeodomain proteins (i.e. no homologs in other Caenorhabditis genomes 2). This atlas entails 97 homeodomain expression patterns that we established ourselves using fosmid reporters and/or CRISPR/Cas9-engineered reporter alleles, complemented with the patterns of four previously characterized homeodomain patterns also generated either using fosmid or CRISPR/Cas9-engineered reporter alleles (SI Table 1,2,3). We comprehensively analyzed the expression pattern of all these homeodomain proteins with single-neuron resolution throughout all 302 neurons using the multicolor-landmark identification strain NeuroPAL 28. We focused our expression analysis on mature neurons in the nervous system of late larval stage/young adult stage animals since continuous expression throughout the life of postmitotic neurons is usually associated with transcription factors that specify and subsequently maintain terminal neuron identity 12,29.
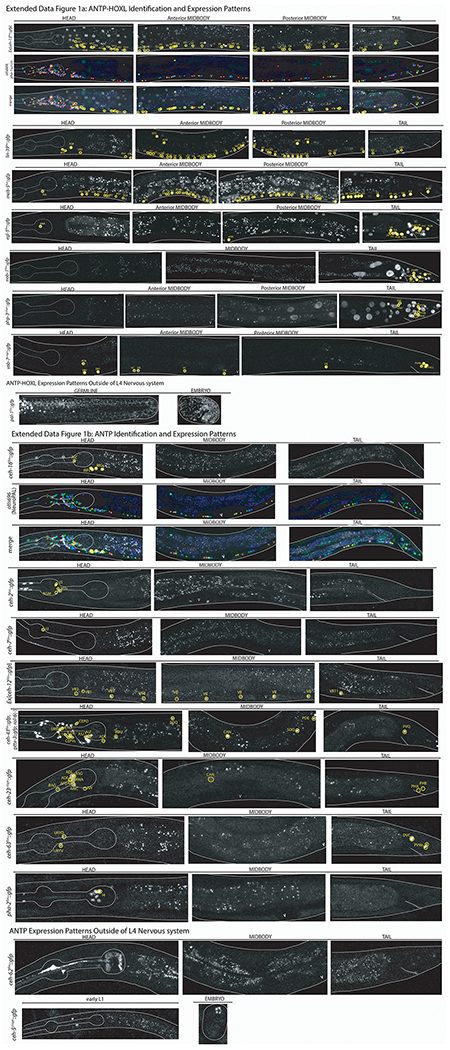
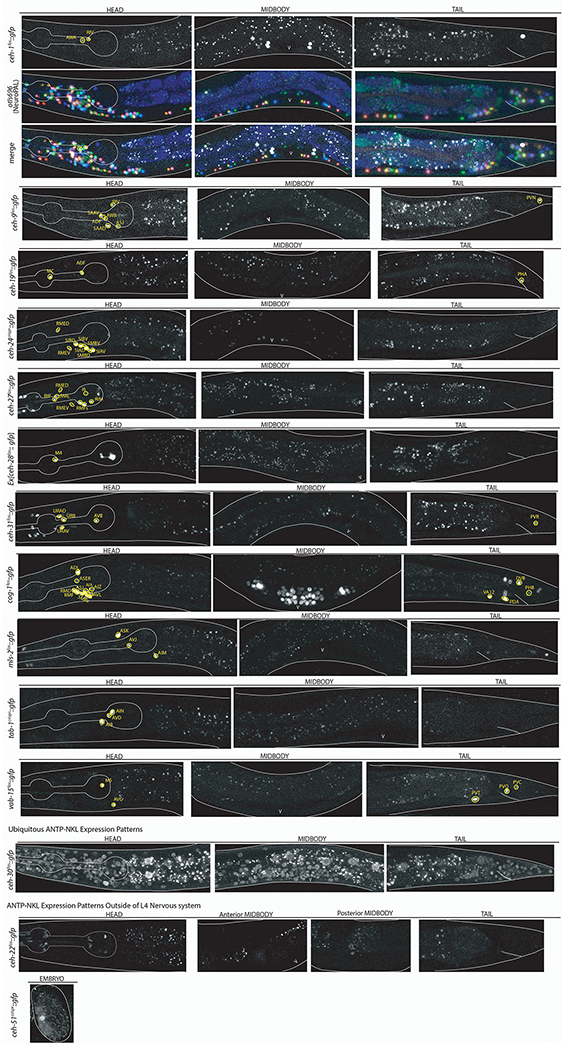
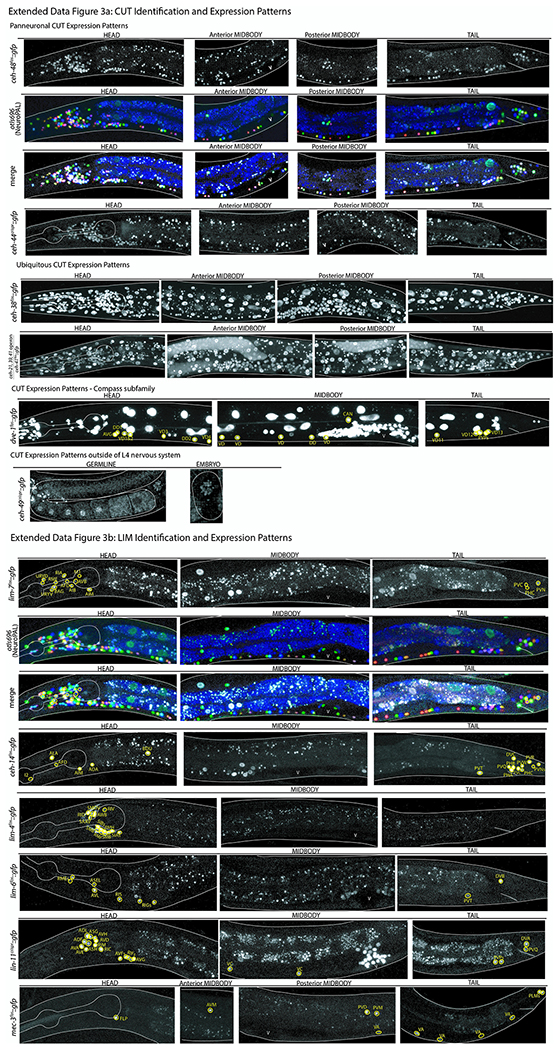
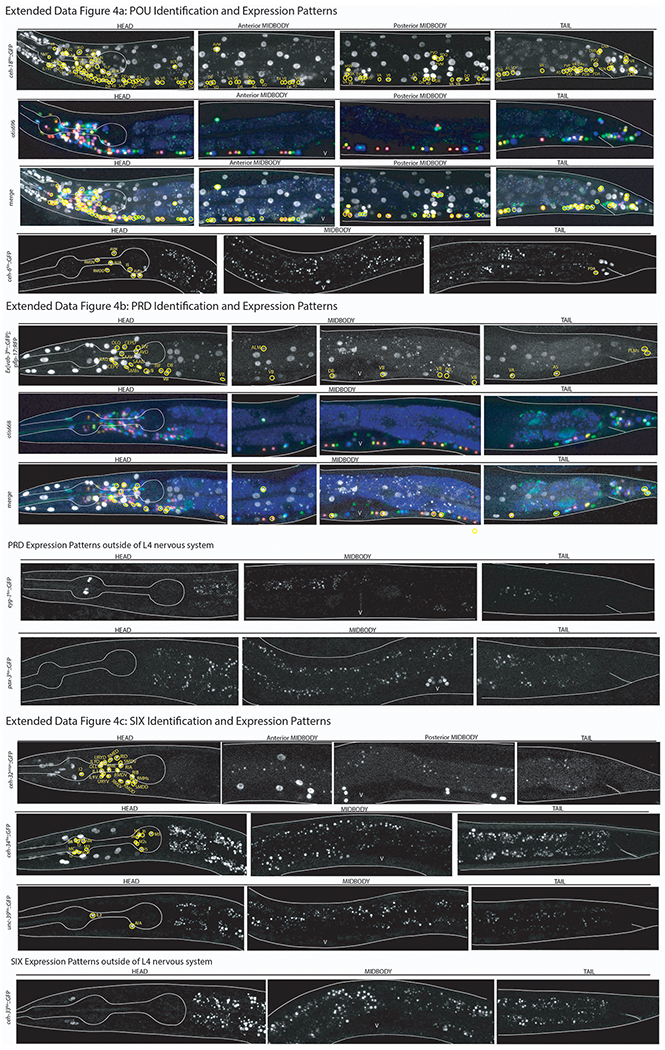
Strikingly, we find that 80 of the 101 examined homeodomain proteins are expressed in the mature nervous system (Fig.1b–d, ED Fig.1–7, SI Table 2, 3). 12 are expressed in all neurons and many major tissue types and two Cut-type homeobox genes, ceh-44 and ceh-48 as well as the nematode-specific ceh-58 gene show the intriguing feature of being exclusively expressed in all neurons, but no other major tissue types (Fig.1; ED Fig.3, 7). On the other extreme end of the spectrum, seven homeodomain proteins are expressed exclusively in one neuron class (Fig.1; ED Fig. 1, 2, 5, 7). More than two thirds of the neuron type-specifically expressed homeodomain proteins are expressed in less than 10% of all neuron classes (Fig.2a). Neurons expressing the same homeodomain protein are usually not related by lineage or by neurotransmitter identity (ED Fig.8). With the exception of the panneuronally expressed homeodomain proteins, no two homeodomain proteins are expressed in the exact same combination of neuron classes (SI Table 2). The two homeodomain proteins with the closest similarity in expression are encoded by unc-62/Meis (expressed in 33 neuron classes) and ceh-20/Pbx (32 classes; 31 of which same as unc-62-expressing), consistent with the mutual dependency of function of Meis and Pbx proteins in other organisms 30. Tandem duplicated homeobox genes retain overlaps in their expression, but in most cases, one of the duplicates shows a much more restricted expression pattern (SI Table 2).
Figure 2: Summary of homeobox gene expression patterns across the nervous system and similarity of neuron classes based on homeobox gene codes.
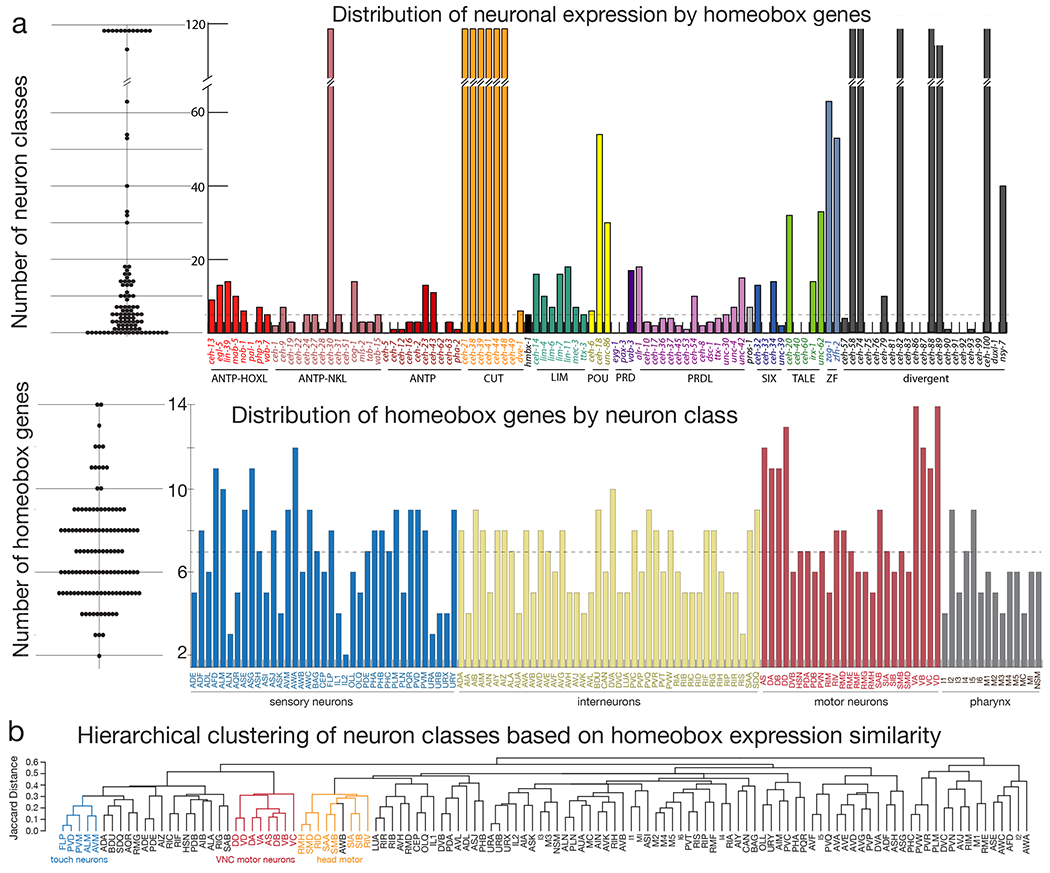
(a) Upper panel: Number of neuron classes where each homeobox gene is expressed Left: Dotplot distribution where each dot represents a homeobox gene, and the value associated with the dot represents the number of neuron classes in which this homeobox gene is expressed in. Right: Histogram showing the number of neuron classes in which each homeobox gene is expressed in. Organized and colored by homeobox gene subfamily and shared protein domains. The dashed line at 5 neuron classes is the median number of neuron classes in which each homeobox gene is expressed. Lower panel: Number of homeobox genes expressed in each neuron class Left: Dotplot distribution where each dot represents a neuron, and associated value represents the number of homeobox genes expressed in this neuron. Right: Histogram displaying the number of homeobox genes expressed in each neuron class excluding the panneuronal homeobox genes and ordered by the neuron type (sensory, motor, inter, and pharyngeal). Dashed line at 7 homeobox genes is the median number of genes per neuron class.
(b) Dendrogram ordering neuron classes based on the similarity of their homeobox gene code. Some examples of functionally related neuron groups are shaded.
The expression pattern of members of subclasses of homeodomain proteins (e.g. POU, LIM, Prd) do not share obvious features (e.g., there is no enrichment of specific homeodomain subclasses in sensory vs. inter vs. motor neurons or in neurons that express a specific neurotransmitter identity). The only exceptions are the above-mentioned Cut-type homeodomain proteins which are either ubiquitously or panneuronally expressed. The cellular specificity of homeodomain protein within the nervous system appears to correlate with the extent of conservation: Of the 70 conserved homeodomain proteins, 56 (80%) are expressed in specific subsets of neurons, while only 10 out of the 18 (56%) nematode-specific proteins and only 3 of the tested 13 (27%) C.elegans-specific homeobox genes are expressed in specific neuronal subset (SI Table 2, ED Fig.7). Some of the highly unusual C. elegans-specific homeodomain proteins 2, such as CEH-100, which contains an unprecedented number of 12 homeodomains, are expressed in all cells and tissues while the very unusual HOCHOB-type homeodomain protein CEH-91, displays no expression in the mature nervous system (ED Fig.7). The greater neuronal cell type-specificity of conserved homeodomain proteins suggests that neuron type-specific expression may be an ancestral feature of homeodomain protein expression.
Recently reported single-cell transcriptome sequencing recovered mRNA profiles for 42 of the 118 neuron classes 31,32. While these datasets recover homeobox gene transcripts in all those 42 identified neuron classes, they uncover only little more than half of the expression profiles that we recovered via our protein expression analysis (55%; see Methods), which is a likely testament to the incomplete depth of scRNA profiles (SI Table 4). Vice versa, there are cases where a homeobox gene transcript can be detected in cells in which we observe no expression of the corresponding protein (SI Table 4), possibly due to posttranscriptional regulatory events. Together, the comparison of our protein dataset with single cell transcriptome data illustrates the limitations of the depth of currently available single cell datasets and expected discordances between transcript and protein expression.
Homeodomain combinations defined neuron types.
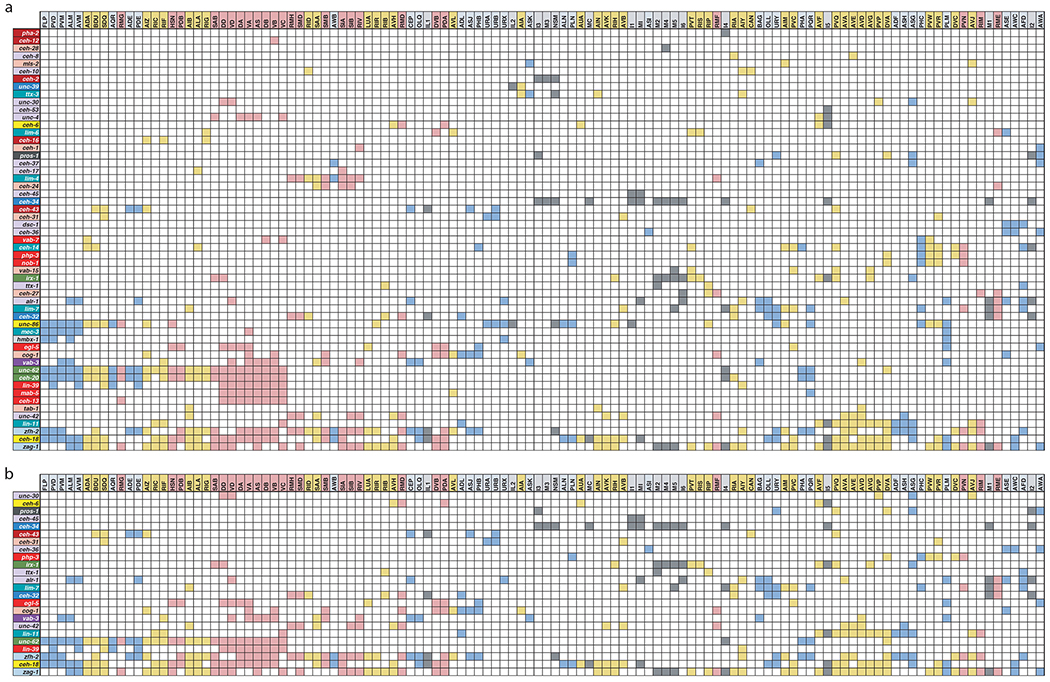
The most striking feature of the homeodomain protein expression atlas becomes apparent when one considers their patterns of co-expression in distinct neuron classes: every neuron class expresses its own, entirely unique, combination of homeodomain proteins. Excluding the panneuronally expressed homeobox genes, the combinatorial code consists of four homeodomain proteins on average (Fig.2a). Strikingly, neuron-type specific homeodomain codes are generated by the 70 phylogenetically conserved homeobox genes alone (ED Fig.9a). Not all 70 conserved homeobox genes are required to generate neuron class specific code. We calculated that the expression patterns of a minimal set of 24 conserved homeodomain proteins uniquely identify all 118 neuron class (ED Fig.9b).
We visualized the complete set of homeodomain codes using their Jaccard distance to construct a dendrogram, grouping neurons based on the similarity of their unique homeodomain protein codes (see Methods)(Fig.2b). When comparing this clustering to the relatedness of neuron classes based on other anatomical or functional criteria, a number of expected, and unexpected, relationships were revealed. Broad classes of functionally related neurons clustered together based on similarity of homeodomain protein codes, such as ventral nerve cord motor neurons, head motor neurons or touch-receptor neurons (Fig.2b). Notably, neurons that share similar codes and fall into related classes are not obviously related by lineage. However, functionally and anatomically related neuron classes can also display quite different homeodomain protein codes. For example, the two interconnected, anatomically-similar and functionally-related phasmid sensory neuron classes PHA and PHB display distinct homeobox codes (Fig.2b; SI Table 3). Vice versa, neurons that display no obvious similarity clustered together based on their similar homeodomain protein codes. For example, the amphid olfactory neuron AWB displays a code that related to that of several head motor neurons.
We also clustered homeodomain proteins based on similarity of their expression patterns. This dendrogram visualizes, with a few notable exceptions (the Meis and Pbx similarities and some HOX cluster genes), substantial differences in expression patterns of individual homeodomain proteins (Fig.3). We used both dendrograms (i.e. clustering homeodomain proteins based on similarity of expression patterns as well as clustering of neuron classes based on similarity of homeodomain expression), to order the axes of our homeodomain expression matrix (Fig.3). This illustrates the uniqueness of each homeodomain code per neuron class by grouping the most similar codes in proximity to each other. This provides the most succinct summary of homeodomain protein expression patterns throughout the C. elegans nervous system and visualizes the sparsity of this matrix (Fig.3).
Figure 3: Unique homeobox expression atlas for entire C. elegans nervous system.
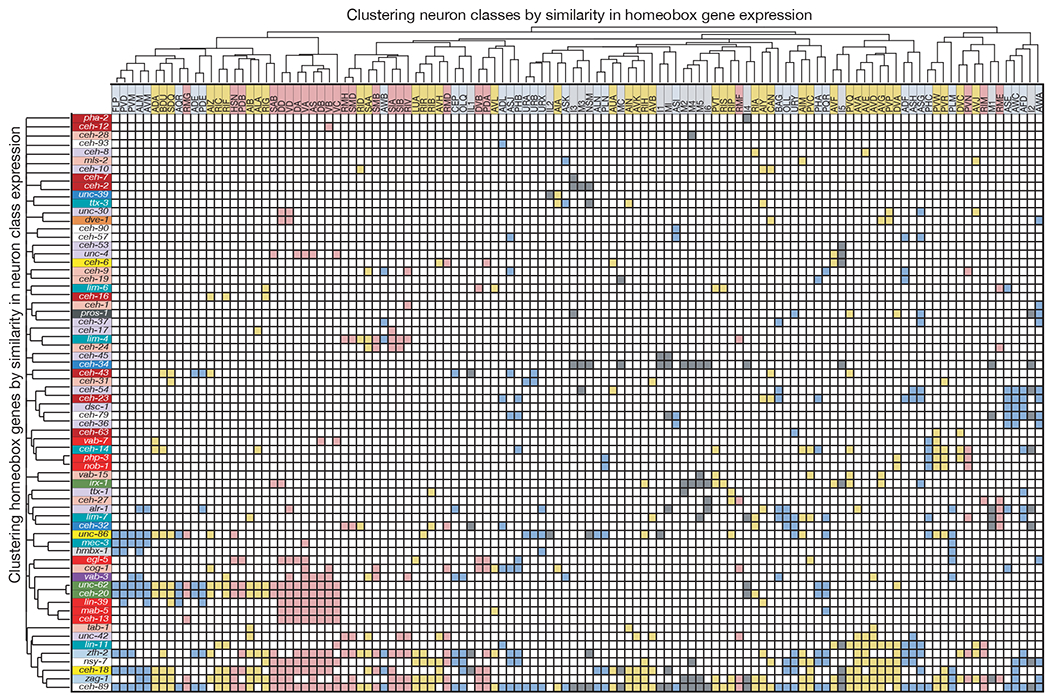
Neuron classes are colored by neuron type (sensory= blue, motor = pink, interneuron = yellow, and pharyngeal = gray) and ordered by similarity between neuron classes defined by the Jaccard index as in 2b. Homeobox genes are colored by subfamily and ordered by similarity of neuron class expression and sparsity.
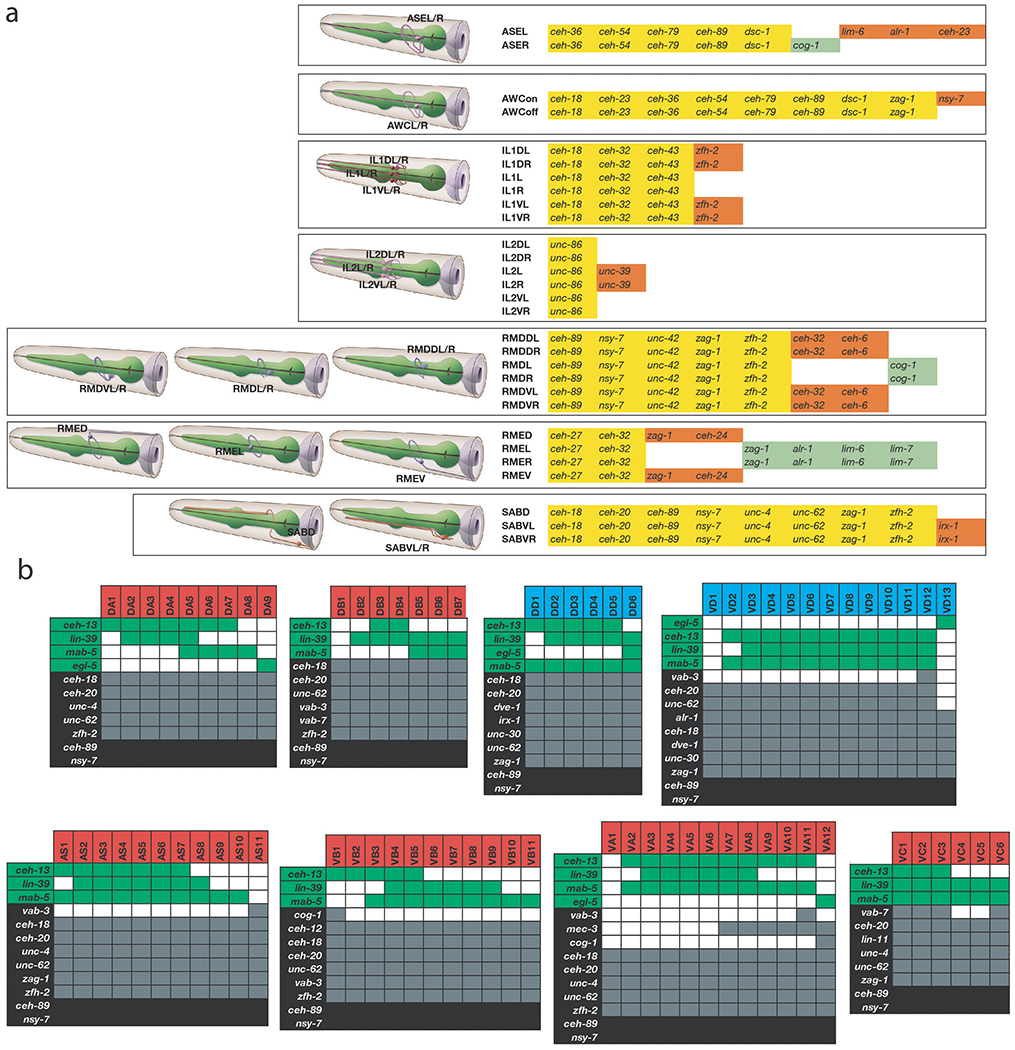
Intriguingly, while there are 118 anatomically defined neuron classes, there are 155 distinct combinatorial homeobox codes, demonstrating that the homeobox codes reveals additional neuronal sub-identities (ED Fig.10a,b). For example, the six radially symmetric RMD neurons, composed of a dorsal and a ventral left/right symmetric neuron pair and a lateral left/right symmetric pair, are uniquely defined by the combination of ceh-89, nsy-7, unc-42, zfh-2 and zag-1, but the dorsal and ventral neuron pair is further distinguished by additional expression of ceh-32 and ceh-6 and the lateral pair by the additional expression of cog-1. The subclassification of the D/V and the lateral RMD pair is paralleled by synaptic connectivity differences 21. Similarly, the inner labial neuron class IL1, composed of six class members (a dorsal, lateral and ventral pair), can be subdivided into subclasses by differential homeodomain expression patterns (all 3 neuron pairs co-express ceh-43, ceh-32 and ceh-18, but only the dorsal and ventral pair express zfh-2). This subclassification also mirrors the distinct synaptic connectivity patterns of dorsal/ventral versus the lateral IL1 pairs 21.
Yet another example of homeodomain codes subdividing neuron classes is evident in ventral nerve cord motorneurons that are aligned along the anterior/posterior (A/P) axis (ED Fig.10b). Distinct homeobox codes uniquely identify all known motor neuron classes (i.e. DA vs. VA vs. AS etc.), but HOX cluster protein expression further subdivides the identity of individual motor neuron class members (e.g. DA1 vs. DA2), not only toward the tail of the ventral nerve cord, as previously reported 33,34, but also in mid- and anterior domains of the ventral nerve cord. Moreover, every single post-embryonically generated motor neuron class expresses a diverse set of additional, non-HOX homeodomain proteins in a subclass-specific manner, including vab-3/Pax6, vab-7/Eve or cog-1/Nkx6 (ED Fig.10b). Lastly, our homeobox data also revealed novel left/right asymmetries in the functionally lateralized ASE neuron pair 35, which we find to express the homeobox genes alr-1 and ceh-23 exclusively in the left but not right ASE neuron (ED Fig.1, 5).
Homeodomain profiles predict neuronal signatures.
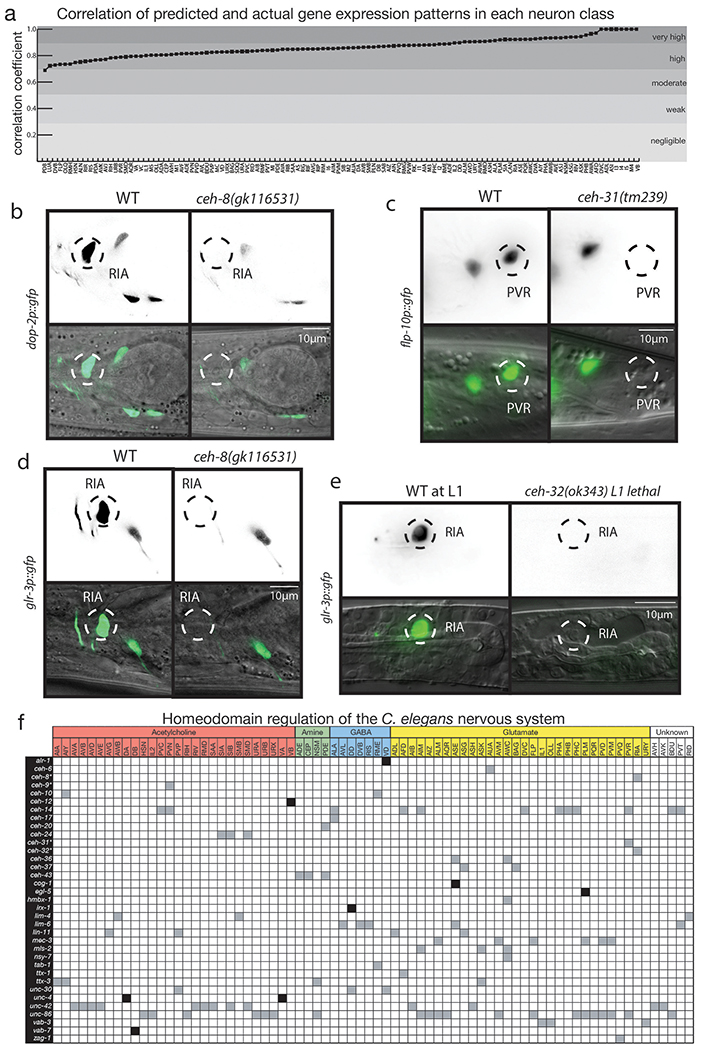
We next set out to determine to what extent the unique homeodomain expression code can account for the known molecular signatures of all C. elegans neurons. To this end, we used a Wormbase-curated list of 1,126 published reporter transgenes generated by the C. elegans community over the past few decades 22. This reporter atlas describes regulatory states for every single neuron type, with a sizable average of 42 reporters expressed per neuron type 22 (SI Table 5). We used a simple multivariate linear regression to ask how well our homeodomain protein expression atlas (the independent variables) fit the remaining genes observed in neurons (the dependent results). We found that we could explain 74% of the reporter atlas expression, at single neuron resolution, using our sparse set of homeobox protein expression. This a significantly better fit than our control (p=0.0001), a randomly shuffled homeobox protein expression dataset. To further illustrate the fit of our multivariate linear regression, we used it to predict reporter expression in each neuron class and correlated this prediction to the known reporter expression in these neuron classes (ED Fig.11a, SI Table 5). Multiple neuron classes have expression that is completely predicted by homeodomain protein expression (exhibiting a correlation coefficient of 1) and all of the remaining neuron classes show moderate to strong positive correlations (exhibiting coefficients between 0.5 and 0.95).
Functional relevance of homeobox genes.
Experimental validation of the importance of the homeobox code was already demonstrated by previous genetic loss of function analysis, which had shown that 40 of the 80 neuronally expressed C. elegans homeodomain proteins indeed have a role in neuronal identity specification (SI Table 2)8–12. We extended this functional analysis by examining homeobox genes that were not previously implicated in neuronal identity specification and examining neurons for which no identity-promoting factor had previously been reported. We found that the C. elegans ortholog of the vertebrate Rax homeobox gene, ceh-8, and the Six/So-type homeobox gene ceh-32, both uncharacterized in the context of neuronal identity specification, define a unique expression homeodomain code for the RIA interneurons (ED Fig.2,5). In animals carrying a nonsense allele of either ceh-8 or ceh-32, the RIA interneurons fail to acquire a number of distinct RIA identity features (Fig.4a; ED Fig.11b–e).
Figure 4: Predicted function of homeobox genes across the nervous system and select examples of functional analysis.
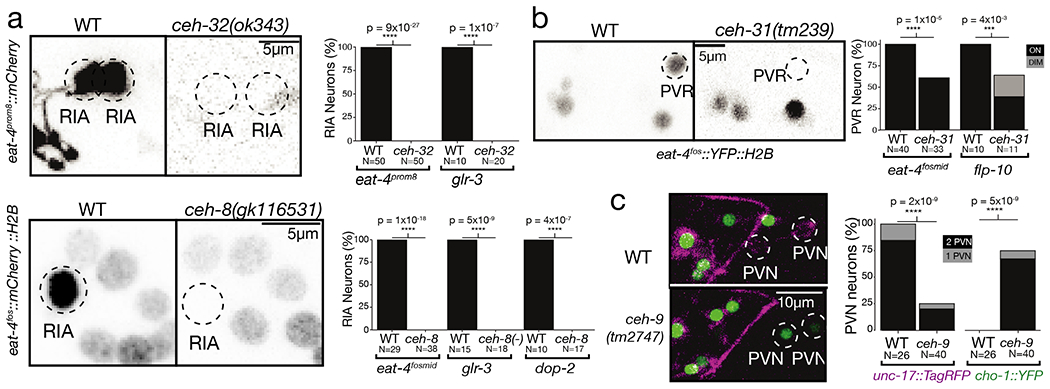
(a-c) Previously uncharacterized homeodomains act as regulators of neuronal identity. Each subfigure compares wild type worms to null mutants, with n~30 independent animal per condition for neurotransmitter reporters and ~15 for other reporters. Graphs show p-values from Fisher’s exact test, *** for p-values between 10−2 and 10−3, **** for p-values below 10−3. Characteristic images were chosen. In (a), RIA identity is lost in ceh-8 and ceh-32 mutant animals, as assessed with multiple markers. Left: eat-4 expression is lost from RIA in a ceh-8 or ceh-32 mutant background. Right: quantification of eat-4 loss in RIA for both ceh-8 and ceh-32 mutant, as well as glr-3 and dop-2 reporters (see ED Fig.11 for reporter image).(b) PVR glutamatergic identity is lost in ceh-31 mutant animals. Left: eat-4 expression is lost in ceh-31 mutant background. Right: quantification of eat-4 loss in PVR, as well as a flp-10 reporter (see ED Fig.11 for reporter image). (c) PVN neuron fate change in ceh-9 mutant animals. Left: PVN expresses only unc-17 in a WT background. In a ceh-9 mutant background, cho-1 fosmid expression is ectopically activated and unc-17 expression is lost, indicating a cell fate change. Right: quantification of unc-17 and cho-1 expression in WT and mutant.
We further examined whether any of our newly-identified homeobox gene-expression patterns can distinguish previously defined, but non-discriminatory homeodomain codes. The unc-86/Brn3 POU and ceh-14/Lhx3 LIM homeobox genes were previously found to specify the identity of distinct neuron classes, among them the AIM and PVR neurons 36,37. We discovered that the BarH-homolog ceh-31 is expressed in PVR, but not AIM and that in ceh-31 mutants, the glutamatergic as well as peptidergic identify of PVR is affected (Fig.4b; ED Fig.11c). Similarly, we discovered that the NK-like homeobox gene ceh-9 is required for neurotransmitter mechanistic identity specification of the PVN neuron (Fig.4c), a neuron that was previously found to be specified by a combination of the ceh-14 and unc-3, both of which also specify the PVC neuron 38. The ceh-9 homeobox gene therefore distinguishes PVN from PVC identity. Taken together, 74 of the 118 neuron classes of C. elegans have been found to require at least one, if not multiple homeobox transcription factors for their proper identity specification (ED Fig.11f).
Conclusions.
We have shown here that the expression patterns of a single transcription factor family fully describe the diversity of all neuronal cell types throughout an entire nervous system. Several transcriptome dataset datasets from Drosophila and vertebrate nervous systems have also explicitly noted that homeobox genes are the gene family that distinguishes neuron types most effectively 4,18–20. For example, bulk sequencing of large collections of distinct, labeled cell types throughout the mouse CNS also revealed that distinct homeobox gene combinations distinguish almost all distinct neuronal cell populations 18. However, the analysis described here is the first to assign unique homeodomain protein codes to a whole nervous system in its entirety and with single cell resolution. Transcriptome efforts from more complex nervous systems will need to be substantially upscaled in order to assess the depth and breadth of combinatorial homeobox codes. Ideally, since transcriptome datasets do not capture posttranscriptional regulatory events, such transcriptome data needs to be complemented by protein expression data, as we have shown here.
Future analysis will reveal whether other transcription factor families may also display unique combinatorial expression patterns throughout the nervous system. It is already clear that non-homeodomain types of transcription factors also play critical roles in neuronal identity specification (e.g. 12) but such non-homeodomain transcription factors often cooperate with homeodomain transcription factors in neuron identity control in C. elegans 33,38–40. Inspired by Dobzhansky’s dictum that “nothing in biology makes sense except in the light of evolution” 41, we speculate that a possible preponderance of homeobox genes in neuronal identity specification may hint at the possibility that homeodomain proteins were recruited into neuronal identity specification very early in the evolution of the nervous system. Perhaps a homeodomain transcription factor was used to specify signal properties of an ancestral “ur-neuron” (the evolutionarily earliest, most primitive form of neuron). Different neuronal cell types could have come into existence through homeobox gene duplication, ensuing diversification of expression, and target specificity of the homeodomain proteins. Homeobox expression codes may therefore provide a window in the evolutionary history of neuronal cell types.
MATERIAL AND METHODS
HOMEOBOX GENE LIST
Previous sequence analysis identified 103 C. elegans homeobox genes 2. A more recent evaluation of sequences revealed that one gene, ceh-85, is a pseudogene (www.wormbase.org)(G. Williams, pers.comm.), therefore bringing the total number of homeobox considered here down to 102.
GENERATION OF EXPRESSION REAGENTS
Previously reported expression patterns of homeobox genes relied in some very few cases on antibody staining whose patterns of expression in the nervous system were either incompletely or not completely correctly identified (e.g. VAB-7, UNC-30; revised in this paper), owing to a lack of molecular landmarks for proper cellular identification. With only three exceptions (ttx-3, unc-86, unc-42 all of which used both fosmid and/or endogenous reporter alleles generated by CRISPR/Cas9), all other previously reported homeobox gene expression patterns were determined using reporter transgenes that did not contain the entire gene locus, which, as we show here, results in substantial underestimations of expression patterns (all summarized in SI Table 1, 2).
We examined here the expression patterns of 20 homeodomain proteins by tagging the respective endogenous locus with gfp via CRISPR/Cas9 genome-engineering. To this end, gfp was inserted at the 3’end of the gene right before the stop codon. For vab-7, lin-11, ceh-37, and zfh-2 these reporter alleles were generated using the SEC method for CRISPR/Cas9 genome engineering 43. ceh-44 and ceh-49 reporter alleles were kindly provided from Eduardo Leyva Díaz which were generated as described 44. CRISPR/Cas9-engineered strains with the strain name PHX were created by Sunybiotech. 60 homeodomain proteins were examined using available, chromosomally integrated fosmid reporters lines generated by ModEncode (not previously examined for neuron type-specific expression in the nervous system)45 and an additional six homeodomain proteins were examined using fosmid reporters (again made by the ModEncode project45) that we injected ourselves. All fosmid reporters a 3’ tagged protein fusions as well. Injections were done into OH15430 [otis669;pha-1(e2123)] worms at 10ng/uL with 3ng/uL pha-1(+) and 100ng/ul OP50 genomic DNA to create independent lines. A list of all reporter strains is provided below.
We note that as expected from the usual compactness of C. elegans gene loci and the size of fosmid reporter (~40kb of genomic sequences usually containing several genes up- and/or downstream of the gene of interest), we have not found a single instance so far in which fosmid reporters do not fully recapitulate expression patterns observed with a reporter allele generated by CRISPR/Cas9 genome engineering. Such comparisons have been explicitely made with the transcription factors unc-42 (E. Berghoff, pers. comm.), ttx-3 (V. Bertrand, pers. comm.), lin-39 46 unc-3 47 and che-1 48.
STRAIN LIST FOR EXPRESSION ANALYSIS
All newly generated strains used in this study will be publicly available from the Caenorhabditis Genetics Center. The strains for the respective homeobox genes are listed below.
alr-1: OP200; wgIs200 [alr-1::TY1::EGFP::3xFLAG + unc-119(+)].
ceh-1: OP571; wgIs571 [ceh-1::TY1::EGFP::3xFLAG + unc-119(+)].
ceh-12: OH16368; otEx7486[ceh-12::TY1::EGFP::3xFLAG + unc-119(+) + pha-1(+)]
ceh-13: OH16366; otEx7484[ceh-13::TY1::EGFP::3xFLAG + unc-119(+) + pha-1(+)]
ceh-14: OP73; wgIs73 [ceh-14::TY1::EGFP::3xFLAG + unc-119(+)].
ceh-16: OP82; wgIs82 [ceh-16::TY1::EGFP::3xFLAG + unc-119(+)].
ceh-17: OH16369; otEx7487[ceh-17::TY1::EGFP::3xFLAG + unc-119(+) + pha-1(+)]
ceh-18: OP533; wgIs533 [ceh-18::TY1::EGFP::3xFLAG + unc-119(+)].
ceh-19: OP739; wgIs739 [ceh-19::TY1::EGFP::3xFLAG + unc-119(+)].
ceh-2: OP323; wgIs323 [ceh-2::TY1::EGFP::3xFLAG + unc-119(+)].
ceh-20: RW12211; ceh-20(st12211[ceh-20::TY1::EGFP::3xFLAG])
ceh-21, ceh-39, ceh-41: OP759; wgIs759 [ceh-41::TY1::EGFP::3xFLAG + unc-119(+)].
ceh-22: OP389; wgIs389 [ceh-22::TY1::EGFP::3xFLAG + unc-119(+)].
ceh-23: PHX1849; ceh-23(syb1849[ceh-23::GFP)]
ceh-24: PHX1608; ceh-24(syb1608[ceh-24::GFP)]
ceh-27: OP135; wgIs135 [ceh-27::TY1::EGFP::3xFLAG + unc-119(+)].
ceh-28: OH16367; otEx7485[ceh-28::TY1::EGFP::3xFLAG + unc-119(+) + pha-1(+)]
ceh-30: OP120; wgIs120 [ceh-30::TY1::EGFP::3xFLAG + unc-119(+)].
ceh-31: OP370; wgIs379 [ceh-31::TY1::EGFP::3xFLAG + unc-119(+)].
ceh-32: OP516; wgIs516 [ceh-32::TY1::EGFP::3xFLAG + unc-119(+)].
ceh-33: OP575; wgIs575 [ceh-33::TY1::EGFP::3xFLAG + unc-119(+)].
ceh-34: OP524; wgIs524 [ceh-34::TY1::EGFP::3xFLAG + unc-119(+)].
ceh-36: OP620; wgIs620 [ceh-36::TY1::EGFP::3xFLAG + unc-119(+)].
ceh-37: OH16345; ceh-37(ot1023[ceh-37::GFP::FLAG])
ceh-38: OP241; wgIs241 [ceh-38::TY1::EGFP::3xFLAG + unc-119(+)].
ceh-40: OP232; wgIs232 [ceh-40::TY1::EGFP::3xFLAG + unc-119(+)].
ceh-43: OH10447; otIs339 [ceh-43::gfp; ttx-3::dsred; rol-6]
ceh-44: OH16219; ceh-44(ot1015[ceh-44::gfp])
ceh-45: OH16370; otEx7488[ceh-45::TY1::EGFP::3xFLAG + unc-119(+) + pha-1(+)]
ceh-48: OP631; wgIs631 [ceh-48::TY1::EGFP::3xFLAG + unc-119(+)].
ceh-49: OH16224; ceh-49(ot1016[ceh-49::gfp])
ceh-5: PHX1592; ceh-5(syb1592[ceh-5::GFP)]
ceh-51: PHX1551; ceh-51(syb1551[ceh-51::GFP)]
ceh-53: OP444; wgIs444 [ceh-53::TY1::EGFP::3xFLAG + unc-119(+)].
ceh-54: OP456; wgIs456 [ceh-54::TY1::EGFP::3xFLAG + unc-119(+)].
ceh-57: OP706; wgIs706 [ceh-57::TY1::EGFP::3xFLAG + unc-119(+)].
ceh-58: PHX2015; ceh-58(syb2015[ceh-58::GFP)]
ceh-6: RW10871; wgIs87[ceh-6::TY1::EGFP::3xFLAG + unc-119(+)].
ceh-60: DLS395; ceh-60(rhd395 [HA-mCherry::ceh-60])
ceh-62: OP416; wgIs416 [ceh-62::TY1::EGFP::3xFLAG + unc-119(+)].
ceh-63: OP742; wgIs741 [ceh-63::TY1::EGFP::3xFLAG + unc-119(+)].
ceh-7: OP168; wgIs681[ceh-7::TY1::EGFP::3xFLAG + unc-119(+)].
ceh-74: OP680; wgIs680 [ceh-74::TY1::EGFP::3xFLAG + unc-119(+)].
ceh-75: PHX1884; ceh-75(syb1884[ceh-75::GFP)]
ceh-76: OH16487; ceh-76(ot1042[ceh-76::GFP])
ceh-79: OP553; wgIs553 [ceh-79::TY1::EGFP::3xFLAG + unc-119(+)].
ceh-8: PHX1656; ceh-8(syb1656[ceh-6::GFP)]
ceh-81: OH16479; otEx7569 [ceh-81:TY1::EGFP::3xFLAG + unc-119(+)].
ceh-82: OP212; wgIs212 [ceh-82::TY1::EGFP::3xFLAG + unc-119(+)].
ceh-83: OP727; wgIs727 [ceh-83::TY1::EGFP::3xFLAG + unc-119(+)].
ceh-86: PHX2517; ceh-86(syb2517[ceh-86::GFP)]
ceh-87: PHX1955; ceh-87(syb1995[ceh-87::GFP)]
ceh-88: OP593; wgIs593 [ceh-88::TY1::EGFP::3xFLAG + unc-119(+)].
ceh-89: OH16505; ceh-89(ot1050[ceh-89::GFP])
ceh-9: OP690; wgIs690 [ceh-9::TY1::EGFP::3xFLAG + unc-119(+)].
ceh-90: OP210; wgIs210 [ceh-90::TY1::EGFP::3xFLAG + unc-119(+)].
ceh-91: OH16480; otEx7570 [ceh-91:TY1::EGFP::3xFLAG + unc-119(+)].
ceh-92: PHX1610; ceh-92(syb1610[ceh-92::GFP)]
ceh-93: OP554; wgIs554 [ceh-93::TY1::EGFP::3xFLAG + unc-119(+)].
ceh-99: OH16481; otEx7571 [ceh-99:TY1::EGFP::3xFLAG + unc-119(+)].
ceh-100: OH16488; ceh-100(ot1043[ceh-100::GFP])
cog-1: OP541; wgIs541 [cog-1::TY1::EGFP::3xFLAG + unc-119(+)].
dsc-1: OP522; wgIs522[dsc-1::TY1::EGFP::3xFLAG + unc-119(+)].
duxl-1: OP470; wgIs470 [duxl-1::TY1::EGFP::3xFLAG + unc-119(+)].
dve-1: OP398; wgIs398 [dve-1::TY1::EGFP::3xFLAG + unc-119(+)].
egl-5: OP54; wgIs54 [egl-5::TY1::EGFP::3xFLAG + unc-119(+)]
eyg-1: OP441; wgIs441 [eyg-1::TY1::EGFP::3xFLAG + unc-119(+)].
hmbx-1: OP655; wgIs655 [hmbx-1::TY1::EGFP::3xFLAG + unc-119(+)].
irx-1: OP536; wgIs536 [irx-1::TY1::EGFP::3xFLAG + unc-119(+)].
lim-4: OP681; wgIs681 [lim-4::TY1::EGFP::3xFLAG + unc-119(+)].
lim-6: OP387; wgIs387 [lim-6::TY1::EGFP::3xFLAG + unc-119(+)].
lim-7: OP15; wgIs15[lim-7::TY1::EGFP::3xFLAG + unc-119(+)].
lin-11: OH15910; lin-11(ot958[lin-11::GFP::FLAG])
lin-39: OP18; wgIs18 [lin-39::TY1::EGFP::3xFLAG + unc-119(+)]
mab-5: OP27; wgIs27 [mab-5::TY1::EGFP::3xFLAG + unc-119(+)]
mec-3: OP55; wgIs55 [mec-3::TY1::EGFP::3xFLAG + unc-119(+)].
mls-2: OP645; wgIs654 [mls-2::TY1::EGFP::3xFLAG + unc-119(+)].
nob-1: JIM271; stIs10286 [nob-1::GFP::unc-54 3’UTR + rol-6(su1006)]
nsy-7: OH16371; otEx7489[nsy-7:TY1::EGFP::3xFLAG + unc-119(+) + pha-1(+)]
pal-1: OP380; wgIs380 [pal-1::TY1::EGFP::3xFLAG + unc-119(+)]
pax-3: OP190; wgIs190 [pax-3::TY1::EGFP::3xFLAG + unc-119(+)].
pha-2: OP687; wgIs687 [pha-2::TY1::EGFP::3xFLAG + unc-119(+)].
php-3: PHX1549; php-3(syb1548[php-3::GFP])
pros-1: OP500; wgIs500 [ceh-26::TY1::EGFP::3xFLAG + unc-119(+)].
tab-1: PHX1587; tab-1(syb1587[tab-1::GFP)]
ttx-1: PHX1679; ttx-1(syb1679[ttx-1::GFP)]
unc-30: OP395; wgIs395 [unc-30::TY1::EGFP::3xFLAG + unc-119(+)].
unc-39: OP186; wgIs186 [unc-39::TY1::EGFP::3xFLAG + unc-119(+)].
unc-4: PHX1658; unc-4(syb1658[unc-4::GFP)]
unc-62: SD1871; wgIs600 [unc-62::TY1::EGFP::3xFLAG + unc-119(+)].
vab-15: OP730; wgIs730 [vab-15::TY1::EGFP::3xFLAG + unc-119(+)].
vab-3: FQ1092; wzEx302[vab-3::GFP + Pflp-17::DsRed]
vab-7: OH15912; vab-7(ot959[vab-7::GFP::FLAG])
zag-1: OP83; wgIs83 [zag-1::TY1::EGFP::3xFLAG + unc-119(+)].
zfh-2: OH16346; zfh-2(ot1024[zfh-2::GFP::FLAG])
The unc-42 reporter lines will be described elsewhere (E. Berghoff and O.H., in preparation).
MICROSCOPY
Worms were anesthetized using 100mM of sodium azide (NaN3) and mounted on 5% agarose pad on glass slides. Images were acquired using confocal laser scanning microscopes (Zeiss LSM800 and LSM880) and processed using the ImageJ software 49. For expression of reporters, representative maximum intensity projections are shown for GFP channel as gray scale and gamma and histogram were adjusted for visibility. For mutant functional analysis, representative maximum intensity projections are shown as inverted gray scale. NeuroPAL images provided in supplement are pseudocolored in accord with 28. All reporter reagents and mutants were imaged at 40x using fosmid or CRISPR reagents unless otherwise noted.
EXAMINATION OF EXPRESSION REAGENTS AND NEURON IDENTIFICATION
Some obviously panneuronal or ubiquitous genes were determined to be expressed in all neurons by crossing the reporter strain with otIs314, a rab-3 fosmid driving TagRFP. For all the remaining genes, colocalization with the NeuroPAL landmark strain (otIs669 or otIs696) was used to determine the identity of all neuronal expression28. For CRISPR/Cas9 generated strains and integrated fosmid strains, the reporter strain was crossed with the NeuroPAL landmark strain. To analyze fosmid expression with available DNA but no integrated strain, fosmid DNA was injected into the NeuroPAL landmark strain OH15430 [otIs669;pha-1(e2123)] as a rescuing array with pha-1(+) DNA. Three extrachromosomal lines were created and analyzed for each extrachromosomal fosmid strain to determine that gene’s expression. Generally, expression of a given reporter genes turned out to be very stable over all animals scored. In the few cases where we observed somewhat variable expression of fosmid reporter genes (e.g. ceh-8, ceh-24), we generated reporter alleles by CRISPR/Cas9 and those showed more stable expression. In terms of expression level, for every gene expressed in multiple neurons, we noticed different levels of expression in different neuron class (as seen in ED Figs.1–8). Expression, even very dim, was counted as present if seen across multiple worms. This is because even dim expression of a homeodomain transcription factor has been shown have functional phenotypes. For example, ceh-14 is bright in all neuron types where it is expressed except AFD and I2. Yet, ceh-14 has been shown to control the specification of the AFD neurons 36,50.
We also noticed many cases of additional expression of well-characterized homeobox genes whose expression was studied with suboptimal reporter reagents. In some cases, the new sites of expression of relatively dim, in others they are strong. Two such examples are a fosmid reporter of the LIM homeobox mec-3 which is brightly expressed in previously identified touch neurons 51, but less bright in posterior VA neurons which we newly describe here. In contrast, a CRISPR/Cas9-engineered reporter allele of the unc-4 locus is, within the context of the ventral nerve cord, equally bright in the previously identified VA and DA motor neuron classes 52 as it is in the newly identified AS motor neurons.
While we did not notice obvious differences in expression patterns between late larval stages and adult, we do note that a number of genes clearly express in additional cells in the embryo.
CLUSTERING USING JACCARD INDEX
To assess the similarities among neuron classes by homeobox genes we used the Jaccard index. This index is used to measure similarity between finite sample sets by calculating the intersection of those sets divided by their union. For our data, we calculated the number of shared homeobox genes between each neuron class in a pairwise manner, then divided them by the number of shared and unshared homeobox genes in those pairs. To cluster this data we created a distance matrix for the degree of dissimilarity between each neuron class based on their homeobox gene codes calculated as 1 – Jaccard similarity index. With this distance matrix we clustered our data using the hierarchical clustering tool hclust, available in R, an open source software environment for statistical computing.
We did this same analysis for the degree of similarity among homeobox genes by their expression in shared neuron classes. In this calculation, the number of shared neuron classes between each homeobox gene was counted in a pairwise manner, then divided them by the number of shared and unshared neuron classes where those genes express. We again created a distance matrix (1- Jaccard index), clustered the data using hclust.
MINIMAL CODE OF HOMEOBOX GENES
We observe a given set of redundant code of homeodomain coexpression for each neuron that is the result of differentiation processes and we aim to reduce this codebook where there are no redundancies and each cell is represented by a unique barcode. The problem of codebook reduction is cast as a multidimensional knapsack problem 53 with binary weight constraints. The global optimum solution is then found through a branch-and-bound scheme 54 that yields the minimum subset of bits that can be conserved from the genetic codebook that ensures uniqueness of cell barcodes.
CORRELATION OF HOMEOBOX AND REPORTER EXPRESSION
We used a Wormbase-curated list of 1,126 published reporter transgenes available with new homeobox gene expression data added in SI Table 5. To test for correlation between reporter transgene expression in specific neurons and homeobox gene expression, we removed all homeobox gene expression profiles from the Wormbase-curated list. We then performed a simple linear regression using the lm function in R: we fitted lm(G ~ TF), where G was the reporter expression by neuron class matrix and TF the homeobox expression by neuron class one. To assess the goodness of our fit, we also shuffled the homeobox expression matrix 1000 times. This gave us an R-squared value of 0.74 for our actual homeobox expression dataset, which compared favorably to the 0.41 achieved with the control shuffled homeobox expression dataset. We then set to verify how good this correlation was across individual neuron classes, since the number of available reporters they express is variable. The fitted values from the above regression predict an expected reporter expression for each neuron class, based on their homeobox gene expression. For each neuron class, we extracted these fitted values and compared them to the actual transgene expression profiles reported using the correlation function in R (cor) using the standard Pearson method. These correlation values are shown in Fig.4A.
MUTANT ANALYSIS SCORING AND STATISTICS
Reporter expression was scored as an all-or-nothing phenotype per neuron, with expression in 0,1 or 2 neurons. Scoring data was processed in R and converted as number of expressing neurons by genotype contingency tables. Statistical analysis was then done using Fisher’s exact test (under two-sided null hypothesis), using Holm’s method to correct for multiple comparisons. The resulting adjusted p-values are all below 0.001. No statistical methods were used to determine sample size prior to experiment. Based on the common standard in the field, we aimed for n ~ 30 per genotype for neurotransmitter reporters and n ~ 15 for other markers.
ceh-32(ok343) mutant animales arrested at L1 were maintained with an otEx7146 ceh-32 fosmid rescue construct. Worms are only counted as ceh-32 mutants when the myo-2::mCherry coinjection marker of this array was not visible at all. The ceh-32 L1 mutants are scored against their wild type counterpart strain at L1, rather than with the rescued worm of the same strain. Due to the disorganization of their head ganglions, glutamatergic identity in RIA was instead scored using a short integrated eat-4 promoter fragment (otIs521) with a restricted expression pattern in only a subset of glutamatergic neurons36. Scoring was done under a Zeiss stereo dissecting scope at high magnification and representative images from confocal microscopy are shown at 63x. 1 or 2 very dim cells were seen in less than 15% of the ceh-32 mutants under confocal microscopy, but those cells made no axonal projection and their cell body did not match the shape of RIA. Reported p-values would still be significant if they were conservatively counted as eat-4(+) RIA neurons.
For the mutant analysis, the following strains were used:
OH13094 otIs354[cho-1fos::YFP]; otIs518 [eat-4fos::mCherry]
OH15958 otIs354[cho-1fos::YFP]; otIs518 [eat-4fos::mCherry]; ceh-8(gk116531)
IK705(njIs10[glr-3p::GFP]
OH15970 njIs10[glr-3p::GFP]; ceh-8(gk116531)
OH4793 otIs173 [F25B3.3::DsRed2 + ttx-3pB::GFP]; otEx980 [dop-2::GFP + pha-1(+)]
OH16478 otIs173 [F25B3.3::DsRed2 + ttx-3pB::GFP]; otEx980 [dop-2::GFP + pha-1(+)]; ceh-8(gk116531)
OH16253 otIs354[cho-1fos::YFP]; ot907(unc-17::mKate2 CRISPR)
OH16251 otIs354[cho-1fos::YFP]; ot907(unc-17::mKate2 CRISPR), ceh-9(tm2747)
OH16256 otIs580 [cho-1fos::mCherry + eat-4fos::YFP]
OH16201 otIs580 [cho-1fos::mCherry + eat-4fos::YFP] ceh-31(tm239)
OH16204 otIs92[flp-10p::GFP]
OH16203 otIs92[flp-10p::GFP]; ceh-31(tm239)
OH12525 otIs521[eat-4prom8::tagRFP; ttx-3::gfp]
OH16314 otIs521[eat-4prom8::tagRFP; ttx-3::gfp], otIs388[eat-4fos::YFP], ceh-32(ok343) otEx7146[ ceh-32 fosmid rescue WRM0637dA10 + myo-2 RFP])
IK705 njIs10[glr-3p::GFP]
OH16476 ceh-32(ok343) V; njIs10[glr-3p::GFP]; otEx7146[ ceh-32 fosmid rescue WRM0637dA10 + myo-2 RFP]
COMPARISON OF HOMEOBOX EXPRESSION WITH scRNA-seq DATA
To analyze the congruence between available scRNA sequencing data 31,32 and our reported homeodomain expression, we used the provided bootstrap median data (averaging resampled RNA levels 1000 times) from 31,32 and applied no cutoff (i.e. any TPM>0 counted as real expression). We then directly compared the binary expression profiles of the homeobox gene mRNA in isolated neuron classes with our reported homeodomain protein expression (colored in legend in figure). We found that the scRNA-seq expression data from the 42 identified L2 neuron classes recapitulated only 38% of our homeodomain protein expression. We calculated this percentage by taking the agreed expression (blue) and dividing it by the agreed expression plus the expression seen only in the homeodomain protein analysis (blue+ red). We then asked if scRNA-seq was able to detect mRNA of our homeodomain proteins at earlier embryonic time points. To this end, we added the scRNA-seq embryo data available for those 42 neuron classes and found that this increased the coverage to 55%. This percentage was calculated as above with the agreed expression divided by the agreed plus the expression seen only in the homeodomain protein analysis.
DATA AVAILABILITY
All newly generated data, including the expression pattern of every homeobox gene is available in SI Tables 1,2. Additionally, whole-worm confocal images of all homeobox genes analyzed are available in ED Fig.1–8. Newly generated reporter strains made during this study will be available from the Caenorhabditis Genetics Center. The most updated version of the community-curated transgene expression resource used is also available in SI Table 5.
CODE AVAILABILITY
The R code used to generate the Jaccard Distance Matrix for clustering of homeobox genes and neuron classes is available to everyone on the Hobert lab GitHub at https://github.com/hobertlab/Reilly_2020/tree/master/Jaccard_Distance. Additionally, the MATLAB code used to create the minimal codebook of homeobox genes is available at https://github.com/hobertlab/Reilly_2020/tree/master/Minimal_Codebook.
Extended Data
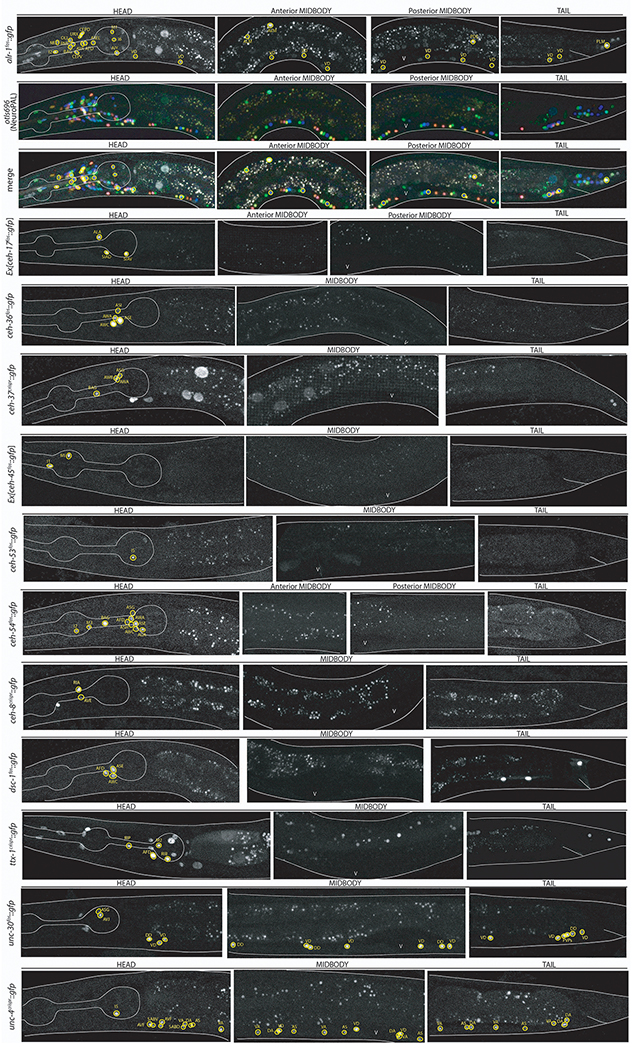
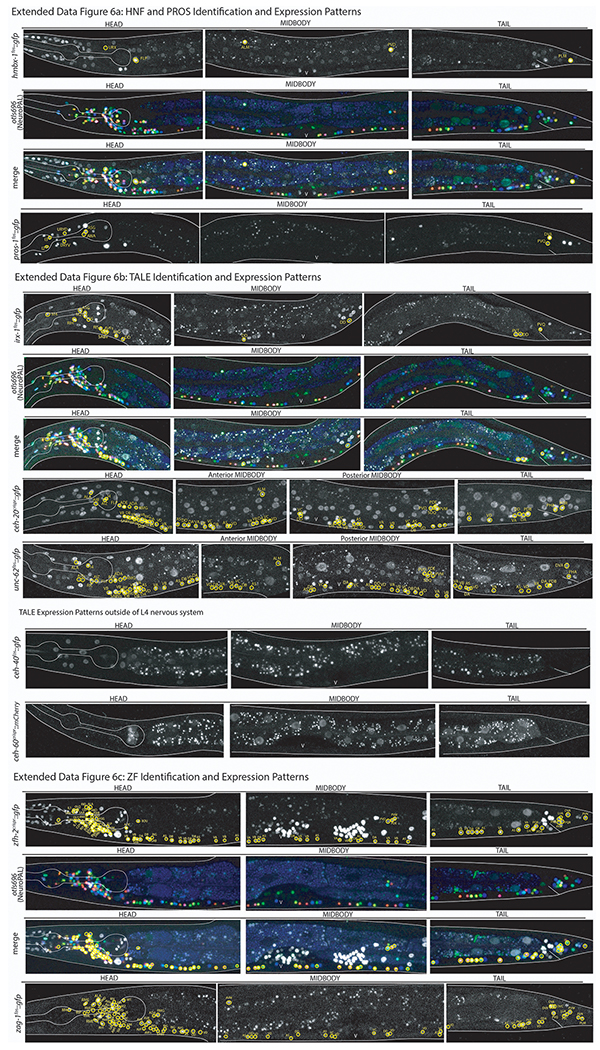
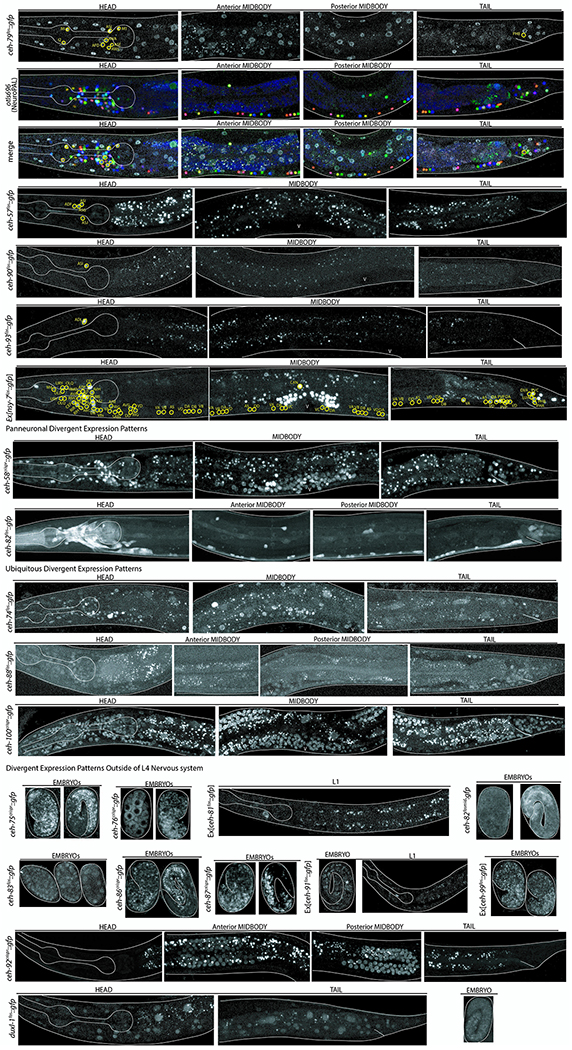
ED Fig.1-7: Confocal images of all homeobox genes identified by homeobox gene family including NeuroPAL identification.
Images of all homeodomain reporters analyzed by authors ordered by gene class. Example identifications with NeuroPAL are provided for at least one member of each class and shown as the GFP reporter alone, the NeuroPAL landmark alone, and a merged picture of the GFP reporter with the NeuroPAL landmark. Heads, midbodies, and tails of each reporter are shown and labeled accordingly. The outer body of the worm and pharynx are outlined in white. Neurons are circled in yellow and the identities of those neurons by NeuroPAL ID are immediately beside them. “V” indicates the vulva of the worm. All pictures are of L4 or young adult worms unless otherwise noted as an expression outside of the L4 nervous system. Ten worms were analyzed for each reporter strain and characteristic images were chosen.
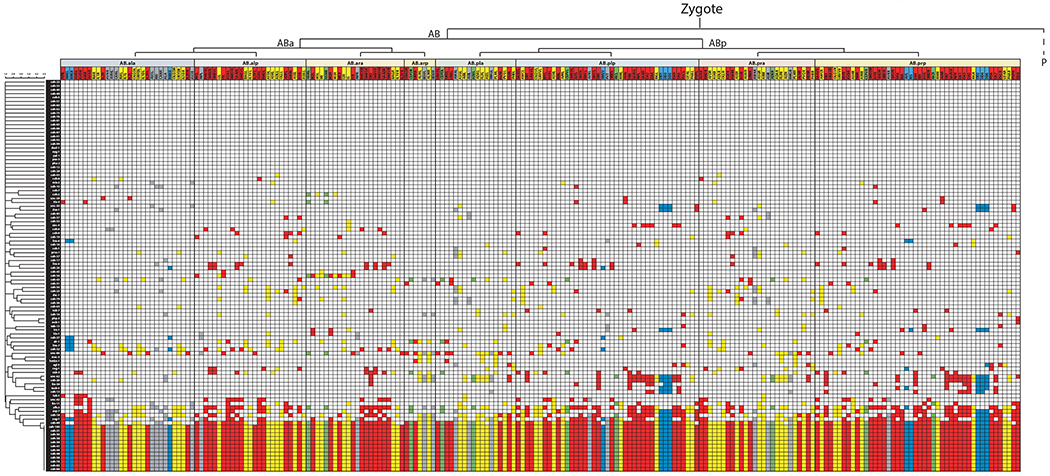
ED Fig.8: Homeobox gene expression ordered by lineage and neurotransmitter identity.
Representation of homeobox gene expression pattern with neurons ordered by their lineage and genes ordered by similarity of expression by the Jaccard index (as in Fig 3). Neurons are further colored by their neurotransmitter identity with red = acetylcholine, yellow = glutamate, blue = GABA, green = amine, gray = unknown.
ED Fig.9: Features of the homeobox gene code.
(a) The 70 conserved homeobox box genes alone are sufficient to codify all neuron classes. Neuron classes are colored by neuron type (sensory= blue, motor = pink, interneuron = yellow, and pharyngeal = gray) and ordered by similarity between neuron classes defined by the Jaccard index as in 2b. Homeobox genes are colored by subfamily and ordered by similarity of neuron class expression and sparsity.
(b) Theoretical minimal code of conserved homeobox genes required to distinguish every neuron class. Determined mathematically as described in Methods. Coloring as in (b).
ED Fig.10: Homeobox codes define neuronal subclasses.
(a) Homeobox codes subdivide neuron classes in the head. Pictures of head neuron classes are provided from WormAtlas.org. Homeobox genes expressed in each neuron are listed. Yellow color indicates the homeobox gene is expressed in all members of that neuron class. Orange and green colors indicate that the homeobox gene is expressed in only a subset of neuron class members.
(b) Tabular representation of homeobox gene expression subdividing members of the ventral nerve cord motor neurons. Red and blue boxes correspond to cholinergic and GABAergic neurotransmitter identity, respectively. Green boxes indicate the gene is a member of the HOX subfamily, gray boxes indicate that a gene is expressed in some neurons of the VNC, black boxes indicate that a gene is expressed in all neurons of the VNC.
ED Fig.11: Homeobox genes affecting neuronal marker gene expression.
(a) Correlation between predicted gene expression patterns and actual expression patterns in each neuron class. Actual expression patterns for each neuron class were determined by a community-curated list of 1132 fluorescent reporter expression patterns in all 118 neuron classes (SI Table 5). Predicted gene expression was found by multivariate linear regression of known reporter expression patterns using homeobox gene expression atlas. Correlation coefficient was calculated by Pearson where a coefficient of 0.5 – 0.7 is moderate, 0.7 – 0.9 is a strong, and 0.9 – 1 is a very strong correlation consistent with 42.
(b-e) Additional characteristic images for the quantification shown Fig4 a–c. We analyzed n~15 independent animals per genotype, acquired over at least two separate imaging sessions with an equal mix of both genotypes. Characteristic images were chosen.
(b) Expression of dop-2, a dopamine receptor, is lost in RIA in the ceh-8 mutant.
(c) Expression of flp-10, a neuropeptide, is lost or becomes dimmer in PVR in the ceh-31 mutant.
(d,e) Expression of glr-3, a glutamate receptor, is lost in RIA in both the ceh-8 (c) and the ceh-32 (d) mutants.
(f) Summary of effects of loss of homeobox gene on neuronal identity throughout entire C. elegans nervous system, based on previous studies (SI Table S2) and mutant analysis conducted in the study. Dark grey boxes indicate gene activator function, black boxes indicate repressor function.
Supplementary Material
Acknowledgements:
We thank Qi Chen for expert technical assistance in generating transgenic lines, Emily Berghoff for communicating the unpublished expression of unc-42, Eduardo Leyva-Díaz for CRISPR-tagging ceh-44 and ceh-48, Rob Dowen for sending a ceh-60 reporter allele, Vincent Bertrand for communicating unpublished results on ceh-10 and ttx-3 reporter alleles, Lori Glenwinkel for updating and sharing the community-curated gene expression resource, Jillian Booth for creation of select extrachromosomal fosmid reporter strains, Yasmin Ramadan for help with mutant analysis and Thomas Bürglin for comments on the manuscript. This work was funded by a predoctoral fellowship to Molly Reilly (F31 NS105398), by NIH R21 NS106843, and by the Howard Hughes Medical Institute. Some strains were provided by the CGC, which is funded by NIH Office of Research Infrastructure Programs (P40 OD010440).
Footnotes
The authors declare no competing financial interests.
Readers are welcome to comment on the online version of the paper.
Bibliography
- 1.Zeng H & Sanes JR Neuronal cell-type classification: challenges, opportunities and the path forward. Nat Rev Neurosci 18, 530–546, doi: 10.1038/nrn.2017.85 (2017). [DOI] [PubMed] [Google Scholar]
- 2.Hench J et al. The Homeobox Genes of Caenorhabditis elegans and Insights into Their Spatio-Temporal Expression Dynamics during Embryogenesis. PLoS One 10, e0126947, doi: 10.1371/journal.pone.0126947 (2015). [DOI] [PMC free article] [PubMed] [Google Scholar]
- 3.Sebe-Pedros A et al. Cnidarian Cell Type Diversity and Regulation Revealed by Whole-Organism Single-Cell RNA-Seq. Cell 173, 1520–1534 e1520, doi: 10.1016/j.cell.2018.05.019 (2018). [DOI] [PubMed] [Google Scholar]
- 4.Zeisel A et al. Molecular Architecture of the Mouse Nervous System. Cell 174, 999–1014 e1022, doi: 10.1016/j.cell.2018.06.021 (2018). [DOI] [PMC free article] [PubMed] [Google Scholar]
- 5.Tasic B et al. Shared and distinct transcriptomic cell types across neocortical areas. Nature 563, 72–78, doi: 10.1038/s41586-018-0654-5 (2018). [DOI] [PMC free article] [PubMed] [Google Scholar]
- 6.Hodge RD et al. Conserved cell types with divergent features in human versus mouse cortex. Nature 573, 61–68, doi: 10.1038/s41586-019-1506-7 (2019). [DOI] [PMC free article] [PubMed] [Google Scholar]
- 7.Gehring WJ Master Control Genes in Development and Evolution: The Homeobox Story. (Yale University Press;, 1998). [Google Scholar]
- 8.Way JC & Chalfie M mec-3, a homeobox-containing gene that specifies differentiation of the touch receptor neurons in C. elegans. Cell 54, 5–16 (1988). [DOI] [PubMed] [Google Scholar]
- 9.Finney M, Ruvkun G & Horvitz HR The C. elegans cell lineage and differentiation gene unc-86 encodes a protein with a homeodomain and extended similarity to transcription factors. Cell 55, 757–769 (1988). [DOI] [PubMed] [Google Scholar]
- 10.White JG, Southgate E & Thomson JN Mutations in the Caenorhabditis elegans unc-4 gene alter the synaptic input to ventral cord motor neurons. Nature 355, 838–841 (1992). [DOI] [PubMed] [Google Scholar]
- 11.Jin Y, Hoskins R & Horvitz HR Control of type-D GABAergic neuron differentiation by C. elegans UNC-30 homeodomain protein. Nature 372, 780–783 (1994). [DOI] [PubMed] [Google Scholar]
- 12.Hobert O A map of terminal regulators of neuronal identity in Caenorhabditis elegans. Wiley interdisciplinary reviews. Developmental biology 5, 474–498, doi: 10.1002/wdev.233 (2016). [DOI] [PMC free article] [PubMed] [Google Scholar]
- 13.Tsuchida T et al. Topographic organization of embryonic motor neurons defined by expression of LIM homeobox genes. Cell 79, 957–970, doi:0092-8674(94)90027-2 [pii] (1994). [DOI] [PubMed] [Google Scholar]
- 14.Lindtner S et al. Genomic Resolution of DLX-Orchestrated Transcriptional Circuits Driving Development of Forebrain GABAergic Neurons. Cell Rep 28, 2048–2063 e2048, doi: 10.1016/j.celrep.2019.07.022 (2019). [DOI] [PMC free article] [PubMed] [Google Scholar]
- 15.Stettler O & Moya KL Distinct roles of homeoproteins in brain topographic mapping and in neural circuit formation. Semin Cell Dev Biol 35, 165–172, doi: 10.1016/j.semcdb.2014.07.004 (2014). [DOI] [PubMed] [Google Scholar]
- 16.Tahayato A et al. Otd/Crx, a dual regulator for the specification of ommatidia subtypes in the Drosophila retina. Dev Cell 5, 391–402, doi: 10.1016/s1534-5807(03)00239-9 (2003). [DOI] [PubMed] [Google Scholar]
- 17.Blochlinger K, Bodmer R, Jack J, Jan LY & Jan YN Primary structure and expression of a product from cut, a locus involved in specifying sensory organ identity in Drosophila. Nature 333, 629–635, doi: 10.1038/333629a0 (1988). [DOI] [PubMed] [Google Scholar]
- 18.Sugino K et al. Mapping the transcriptional diversity of genetically and anatomically defined cell populations in the mouse brain. eLife 8, doi: 10.7554/eLife.38619 (2019). [DOI] [PMC free article] [PubMed] [Google Scholar]
- 19.Davis FP et al. A genetic, genomic, and computational resource for exploring neural circuit function. eLife 9, doi: 10.7554/eLife.50901 (2020). [DOI] [PMC free article] [PubMed] [Google Scholar]
- 20.Allen AM et al. A single-cell transcriptomic atlas of the adult Drosophila ventral nerve cord. eLife 9, doi: 10.7554/eLife.54074 (2020). [DOI] [PMC free article] [PubMed] [Google Scholar]
- 21.White JG, Southgate E, Thomson JN & Brenner S The structure of the nervous system of the nematode Caenorhabditis elegans. Philosophical Transactions of the Royal Society of London B. Biological Sciences 314, 1–340 (1986). [DOI] [PubMed] [Google Scholar]
- 22.Hobert O, Glenwinkel L & White J Revisiting Neuronal Cell Type Classification in Caenorhabditis elegans. Curr Biol 26, R1197–R1203, doi: 10.1016/j.cub.2016.10.027 (2016). [DOI] [PubMed] [Google Scholar]
- 23.Burglin TR & Affolter M Homeodomain proteins: an update. Chromosoma 125, 497–521, doi: 10.1007/s00412-015-0543-8 (2016). [DOI] [PMC free article] [PubMed] [Google Scholar]
- 24.Burglin TR, Finney M, Coulson A & Ruvkun G Caenorhabditis elegans has scores of homoeobox-containing genes. Nature 341, 239–243 (1989). [DOI] [PubMed] [Google Scholar]
- 25.Lambert SA et al. The Human Transcription Factors. Cell 172, 650–665, doi: 10.1016/j.cell.2018.01.029 (2018). [DOI] [PubMed] [Google Scholar]
- 26.Fuxman Bass JI et al. A gene-centered C. elegans protein-DNA interaction network provides a framework for functional predictions. Mol Syst Biol 12, 884, doi: 10.15252/msb.20167131 (2016). [DOI] [PMC free article] [PubMed] [Google Scholar]
- 27.Murray JI et al. Automated analysis of embryonic gene expression with cellular resolution in C. elegans. Nat Methods 5, 703–709, doi: 10.1038/nmeth.1228 (2008). [DOI] [PMC free article] [PubMed] [Google Scholar]
- 28.Yemini E et al. NeuroPAL: A Neuronal Polychromatic Atlas of Landmarks for Whole-Brain Imaging in C. elegans. bioRxiv, doi: 10.1101/676312 (2019). [DOI] [Google Scholar]
- 29.Hobert O Terminal Selectors of Neuronal Identity. Curr Top Dev Biol 116, 455–475, doi: 10.1016/bs.ctdb.2015.12.007 (2016). [DOI] [PubMed] [Google Scholar]
- 30.Merabet S & Mann RS To Be Specific or Not: The Critical Relationship Between Hox And TALE Proteins. Trends Genet 32, 334–347, doi: 10.1016/j.tig.2016.03.004 (2016). [DOI] [PMC free article] [PubMed] [Google Scholar]
- 31.Packer JS et al. A lineage-resolved molecular atlas of C. elegans embryogenesis at single-cell resolution. Science 365, doi: 10.1126/science.aax1971 (2019). [DOI] [PMC free article] [PubMed] [Google Scholar]
- 32.Cao J et al. Comprehensive single-cell transcriptional profiling of a multicellular organism. Science 357, 661–667, doi: 10.1126/science.aam8940 (2017). [DOI] [PMC free article] [PubMed] [Google Scholar]
- 33.Kratsios P et al. An intersectional gene regulatory strategy defines subclass diversity of C. elegans motor neurons. eLife 6, doi: 10.7554/eLife.25751 (2017). [DOI] [PMC free article] [PubMed] [Google Scholar]
- 34.Schneider J et al. UNC-4 antagonizes Wnt signaling to regulate synaptic choice in the C. elegans motor circuit. Development 139, 2234–2245, doi: 10.1242/dev.075184 (2012). [DOI] [PMC free article] [PubMed] [Google Scholar]
- 35.Hobert O Development of left/right asymmetry in the Caenorhabditis elegans nervous system: from zygote to postmitotic neuron. Genesis 52, 528–543, doi: 10.1002/dvg.22747 (2014). [DOI] [PubMed] [Google Scholar]
- 36.Serrano-Saiz E et al. Modular Control of Glutamatergic Neuronal Identity in C. elegans by Distinct Homeodomain Proteins. Cell 155, 659–673 (2013). [DOI] [PMC free article] [PubMed] [Google Scholar]
- 37.Serrano-Saiz E, Oren-Suissa M, Bayer EA & Hobert O Sexually Dimorphic Differentiation of a C. elegans Hub Neuron Is Cell Autonomously Controlled by a Conserved Transcription Factor. Curr Biol 27, 199–209, doi: 10.1016/j.cub.2016.11.045 (2017). [DOI] [PMC free article] [PubMed] [Google Scholar]
- 38.Pereira L et al. A cellular and regulatory map of the cholinergic nervous system of C. elegans. eLife 4, doi: 10.7554/eLife.12432 (2015). [DOI] [PMC free article] [PubMed] [Google Scholar]
- 39.Lloret-Fernandez C et al. A transcription factor collective defines the HSN serotonergic neuron regulatory landscape. eLife 7, doi: 10.7554/eLife.32785 (2018). [DOI] [PMC free article] [PubMed] [Google Scholar]
- 40.Doitsidou M et al. A combinatorial regulatory signature controls terminal differentiation of the dopaminergic nervous system in C. elegans. Genes Dev 27, 1391–1405, doi:27/12/1391 [DOI] [PMC free article] [PubMed] [Google Scholar]
- 41.Dobzhansky T Biology, Molecular and Organismic. American Zoologist 4, 443–452 (1964). [DOI] [PubMed] [Google Scholar]
Associated Data
This section collects any data citations, data availability statements, or supplementary materials included in this article.
Supplementary Materials
Data Availability Statement
All newly generated data, including the expression pattern of every homeobox gene is available in SI Tables 1,2. Additionally, whole-worm confocal images of all homeobox genes analyzed are available in ED Fig.1–8. Newly generated reporter strains made during this study will be available from the Caenorhabditis Genetics Center. The most updated version of the community-curated transgene expression resource used is also available in SI Table 5.


