

SUMMARY
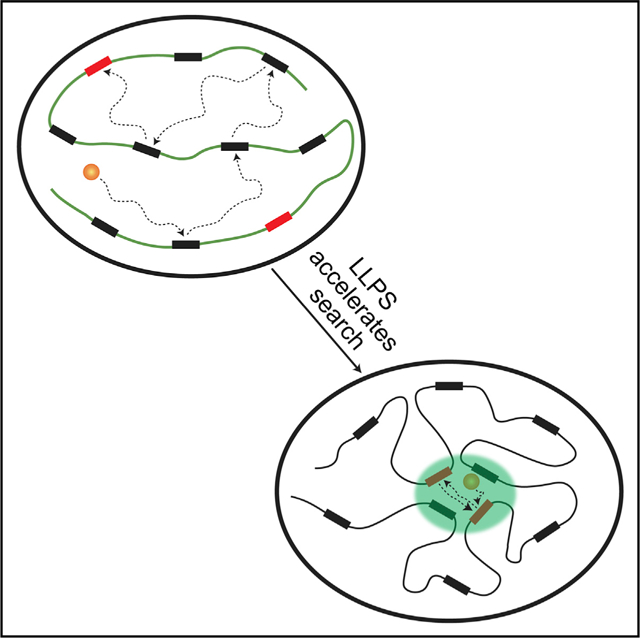
Compartmentalization by liquid-liquid phase separation is implicated in transcription. It remains unclear whether and how transcriptional condensates accelerate the search of transcriptional regulatory factors for their target sites. Furthermore, the molecular mechanisms by which regulatory factors nucleate on chromatin to assemble transcriptional condensates remain incompletely understood. The CBX-PRC1 complexes compartmentalize key developmental regulators for repression through phase-separated condensates driven by the chromobox 2 (CBX2) protein. Here, by using live-cell single-molecule imaging, we show that CBX2 nucleates on chromatin independently of H3K27me3 and CBX-PRC1. The interactions between CBX2 and DNA are essential for nucleating CBX-PRC1 on chromatin to assemble condensates. The assembled condensates shorten 3D diffusion time and reduce trials for finding specific sites through revisiting the same or adjacent sites repetitively, thereby accelerating CBX2 in searching for target sites. Overall, our data suggest a generic mechanism by which transcriptional regulatory factors nucleate to assemble condensates that accelerate their target-search process.
Graphical Abstarct
In Brief
Kent et al. demonstrate that CBX2 phase separates to assemble Polycomb condensates on chromatin through CBX2 interactions with DNA rather than H3K27me3. The assembled condensates accelerate the search of CBX2 for its cognate binding sites by revisiting the same or adjacent sites repetitively, thereby enhancing the genomic occupancy of CBX2.
INTRODUCTION
Mammalian cells use numerous membrane-bound organelles or membraneless condensates to compartmentalize biochemical reactions to regulate cellular metabolism. These membraneless condensates can be assembled via liquid-liquid phase separation (LLPS) (Banani et al., 2017; Hyman et al., 2014; Shin and Brangwynne, 2017). Phase-separated condensates are implicated in the genome organization to activate or repress transcription. Transcription factors, coactivators, and RNA polymerase II coordinately assemble transcriptional condensates to activate transcription (Boehning et al., 2018; Boija et al., 2018; Cho et al., 2018; Chong et al., 2018; Gallego et al., 2020; Guo et al., 2019; Lu et al., 2018; Nair et al., 2019; Sabari et al., 2018; Shrinivas et al., 2019; Zamudio et al., 2019). Heterochromatin proteins phase separate to assemble condensates that organize constitutive heterochromatin (Larson et al., 2017; Sanulli et al., 2019; Strom et al., 2017; Wang et al., 2019). Phase separation of Polycomb group (PcG) chromobox protein 2 (CBX2) underlies the formation of facultative heterochromatin (Plys et al., 2019; Tatavosian et al., 2019). Additionally, chromatin phase separates to form liquid-like condensates (Gibson et al., 2019). Despite these exciting advances, the molecular mechanisms underlying how LLPS organizes biochemical reactions of nucleic acid metabolism remain enigmatic.
PcG proteins are master regulators of development (Schuettengruber et al., 2017). PcG complexes, including Polycomb repressive complexes (PRCs) 1 and 2, act directly at specific chromatin regions to create Polycomb-repressive domains (Schuettengruber et al., 2017; Simon and Kingston, 2013). The PRC1 complexes are divided into canonical CBX-PRC1, which contains CBX (CBX2/4/6/7/8) proteins, and variant PRC1 (Blackledge et al., 2015). Variant PRC1 ubiquitinates histone H2A at lysine 119 (H2AK119Ub) (de Napoles et al., 2004; Wang et al., 2004), which influences PRC2 recruitment (Blackledge et al., 2014; Cooper et al., 2014). CBX-PRC1 compacts chromatin and organizes higher order chromatin structure (Schuettengruber et al., 2017). PRC2 methylates histone H3 on lysine 27 (H3K27me3) (Margueron and Reinberg, 2011), which provides binding sites for CBX7-PRC1 and CBX8-PRC1 (Zhen et al., 2016). These biochemical and genetic studies suggest that PRC1 and PRC2 form a feedback loop to reinforce each other’s activity in establishing and maintaining facultative heterochromatin.
The activity behind CBX-PRC1 compacting chromatin has been mapped to CBX2 (Grau et al., 2011). Mutating the CBX2 residues that are required for compaction leads to homeotic transformations (Lau et al., 2017). Consistently, recent studies demonstrate that CBX2 phase separates to assemble CBX-PRC1 condensates (Plys et al., 2019; Tatavosian et al., 2019), which function as compartments for target gene silencing (Isono et al., 2013; Kondo et al., 2014; Kundu et al., 2017). To repress gene expression, CBX-PRC1 condensates localize at specific sites of the genome. Nevertheless, it is unclear how CBX2 nucleates at specific genomic regions to assemble condensates.
The target-search process of transcriptional regulatory factors for their cognate sites is essential for controlling the specificity and efficiency of transcription regulation (Chen et al., 2014; Izeddin et al., 2014; Normanno et al., 2015; Tatavosian et al., 2018). Despite this, it is challenging to search for specific sites because of the enormous size of mammalian genomes and the number of non-specific sites vastly exceeding the number of specific sites. Condensates enhance the local concentration of their constituents. It has been proposed that this enhancement accelerates biochemical reactions, but there is a lack of direct in vivo evidence supporting this (Banani et al., 2017; Hyman et al., 2014; Shin and Brangwynne, 2017). Whether and how CBX-PRC1 condensates accelerate the target-search process remains unclear.
Here, by using live-cell single-molecule tracking (SMT) and genetic engineering, we show that the interactions between CBX2 and DNA are essential for assembling the CBX-PRC1 condensates via LLPS. We indicate that the assembled CBX-PRC1 condensates accelerate the target-search process of CBX2 by shortening the three-dimensional (3D) free diffusion time and reducing the number of non-specific sites sampled, which is achieved through revisiting the same or adjacent sites repetitively. Thus, we suggest that CBX-PRC1 phase separates to assemble condensates that accelerate the target-search process. This activity may be a common mechanism fundamental to LLPS controlling the genomic occupancy of chromatin bound factors.
RESULTS
CBX2 Is the Driver of LLPS of CBX-PRC1
Biochemical studies have shown that CBX2 undergoes LLPS in vitro, but other CBX-PRC1 subunits do not (Plys et al., 2019; Tatavosian et al., 2019). Genetic studies have indicated that the LLPS of CBX2 is independent of other CBX-PRC1 subunits; however, the condensate formation of other CBX-PRC1 subunits depends on CBX2 (Tatavosian et al., 2019). These data suggest that CBX2 drives the LLPS of CBX-PRC1 (Plys et al., 2019; Tatavosian et al., 2019). Classical phase separation theories indicate that within the two-phase regime of a two-component LLPS system, the volume fraction of the dense phase increases when increasing its concentration (Alberti et al., 2019; Bracha et al., 2018; McSwiggen et al., 2019b). Here, we further test whether CBX2 governs the LLPS of CBX-PRC1 by examining the number and/or size of condensates.
There are three CBX-PRC1 complexes in mouse embryonic stem cells (mESCs) (Figure 1A; Lau et al., 2017; Morey et al., 2012). We integrated HaloTag fusion of CBX-PRC1 subunits, whose expression is controlled by the tetracycline-response element, into the genome of mESCs. The expression level of these fusions was modulated by doxycycline concentrations. We labeled these fusion proteins using HaloTag TMR ligand and imaged their distribution in live mESCs. The protein level of HaloTag fusions increased with increasing doxycycline concentration (Figures S1A and S1B), consistent with our previous immunoblotting studies (Tatavosian et al., 2015; Zhen et al., 2014). CBX6 did not form condensates, consistent with previous reports (Ren et al., 2008; Vincenz and Kerppola, 2008). Except for CBX6, other CBX-PRC1 proteins formed condensates (Figure 1B). CBX2 condensates colocalized with condensates of other CBX-PRC1 subunits (Figures S1C and S1D). The number of CBX2 condensates increased with increasing doxycycline concentration; however, the numbers of other CBX-PRC1 protein condensates were similar under different doxycycline concentrations (Figure 1C). The sizes of condensates of CBX-PRC1 proteins were similar under different doxycycline concentrations (Figure S1E). These data support the notion that CBX2 drives the LLPS of CBX-PRC1 (Plys et al., 2019; Tatavosian et al., 2019).
Figure 1. CBX2 Drives the LLPS of CBX-PRC1.
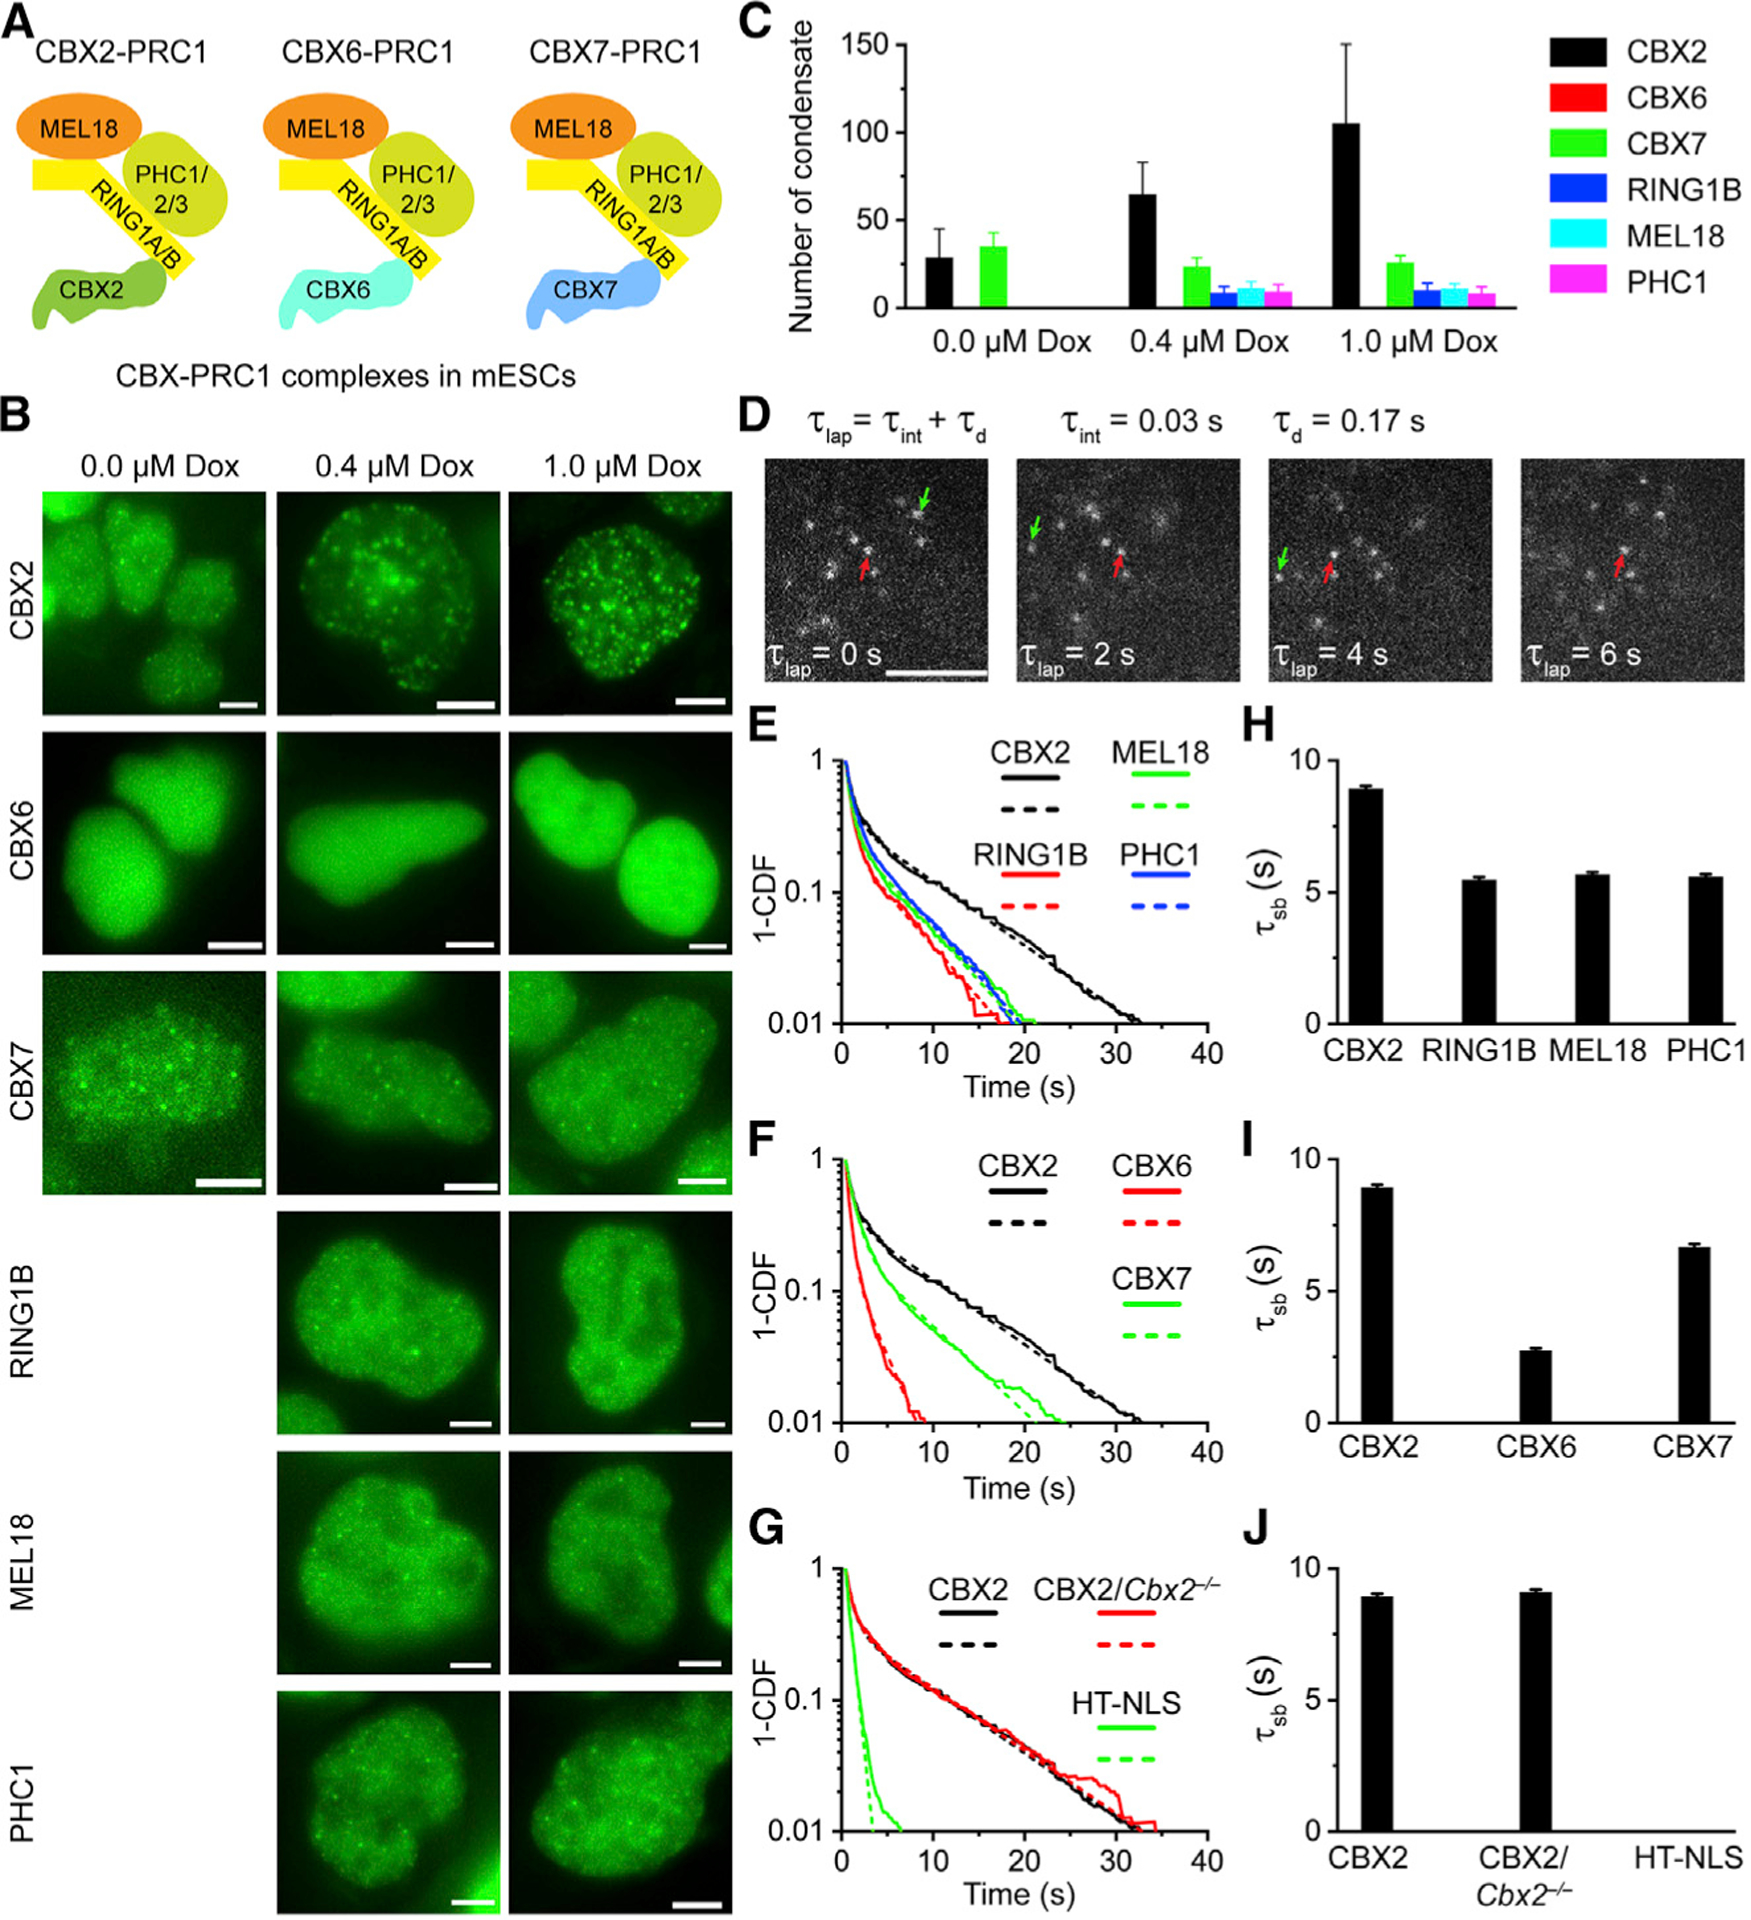
(A) CBX-PRC1 complexes in mESCs.
(B) Example fluorescence images for CBX-PRC1 proteins fused with HaloTag in mESCs. Scale bar, 5.0 μm.
(C) Numbers of condensates of HaloTag-PRC1 fusion proteins quantified from (B). Error bars represent SD.
(D) Measuring residence times by live-cell single-molecule tracking. The red arrowhead indicates molecules that bind stably to chromatin (τsb), and the green arrowhead represents molecules that bind transiently to chromatin (τtb). Scale bar, 2.0 μm.
(E–G) Survival probability distribution of the dwell times. HT-NLS, HaloTag fused with nuclear localization sequence. The numbers of cells and trajectories used are listed in Table S1.
(H–J) Specific residence times (τsb) quantified from (E)–(G). Non-specific residence times (τtb) are shown in Figure S1. Error bars represent standard error for the derived parameter.
CBX2 Binds More Stably to Chromatin Than Other CBX2-PRC1 Subunits
Binding stability of nuclear factors on chromatin is characterized by residence time. Recent studies have suggested that a long residence time facilitates the initiation and assembly of phase-separated condensates (Bracha et al., 2018; Case et al., 2019). Here, we measure the residence time of CBX2 on chromatin by performing live-cell SMT as described previously (Tatavosian et al., 2018; Zhen et al., 2016). We labeled a subpopulation of HT-CBX2 in live mESCs with HaloTag ligand JF549. The labeled protein was illuminated at an integration time of 30 ms interspersed with a dark time of 170 ms (Figure 1D). We calculated the diffusion coefficient of individual molecules and selected molecules with a diffusion coefficient less than 0.032 μm2/s as chromatin bound (Tatavosian et al., 2018; Zhen et al., 2016). We recorded thousands of binding events and calculated their survival probability (Figure 1E). A double exponential decay function, corresponding to specific (τsb) and transient/non-specific (τtb) binding, was used to fit the CBX2 survival curve. We estimated τsb = 8.9 s for CBX2 (Figure 1H). We then measured the residence time of the three core subunits RING1B, MEL18, and PHC1 of CBX2-PRC1. The specific residence time for CBX2 was about 1.6-fold longer than that for RING1B (τsb = 5.5 s), for MEL18 (τsb = 5.7 s) and for PHC1 (τsb = 5.6 s) (Figures 1E and 1H). We also measured the residence time of CBX6 and CBX7 (Figures 1F and 1I). CBX6 was the least stable on chromatin (τsb = 2.7 s). The specific residence time for CBX7 (τsb = 6.9 s), which is similar to previous reports (Zhen et al., 2016), was slightly shorter than that of CBX2. As controls, we quantified the residence time of CBX2 (τsb = 9.1 s) in Cbx2−/− mESCs, which is similar to CBX2 in wild-type mESCs (Figures 1G and 1J). HaloTag fused to a nuclear localization sequence (NLS) did not stably associate with chromatin (Figures 1G and 1J), which is consistent with our previous reports (Tatavosian et al., 2018). These data indicate that CBX2 binds more stably to chromatin than the other CBX-PRC1 subunits in mESCs.
PRC1 Has Minor Effects on the Binding Stability of CBX2
As CBX2 drives the LLPS of CBX-PRC1 (Plys et al., 2019; Tatavosian et al., 2019), we asked whether the removal of CBX2-PRC1 subunits affects the binding stability of CBX2 (Figure 2B). To this end, we measured the residence time of HT-CBX2 in Ring1a−/−/Ring1b−/− and Mel18−/−/Bmi1−/− mESCs, respectively (Figures 2C and 2D). The residence time of CBX2 (τsb = 7.8 s) was similar to that in wild-type mESCs. To further test whether the complex formation affects the binding stability, we made CBX21–498 in which the Chromobox (Cbox) has been deleted (Figure 2A). The Cbox interacts with RING1B (Wang et al., 2008). The specific residence time of CBX21–498 (τsb = 9.4 s) was similar to CBX2 (Figures 2C and 2D). These data indicate that the subunits of CBX2-PRC1 complex are not required for stabilizing CBX2 on chromatin.
Figure 2. The Binding Stability of CBX2 Is Independent of PRC1 and PRC2.
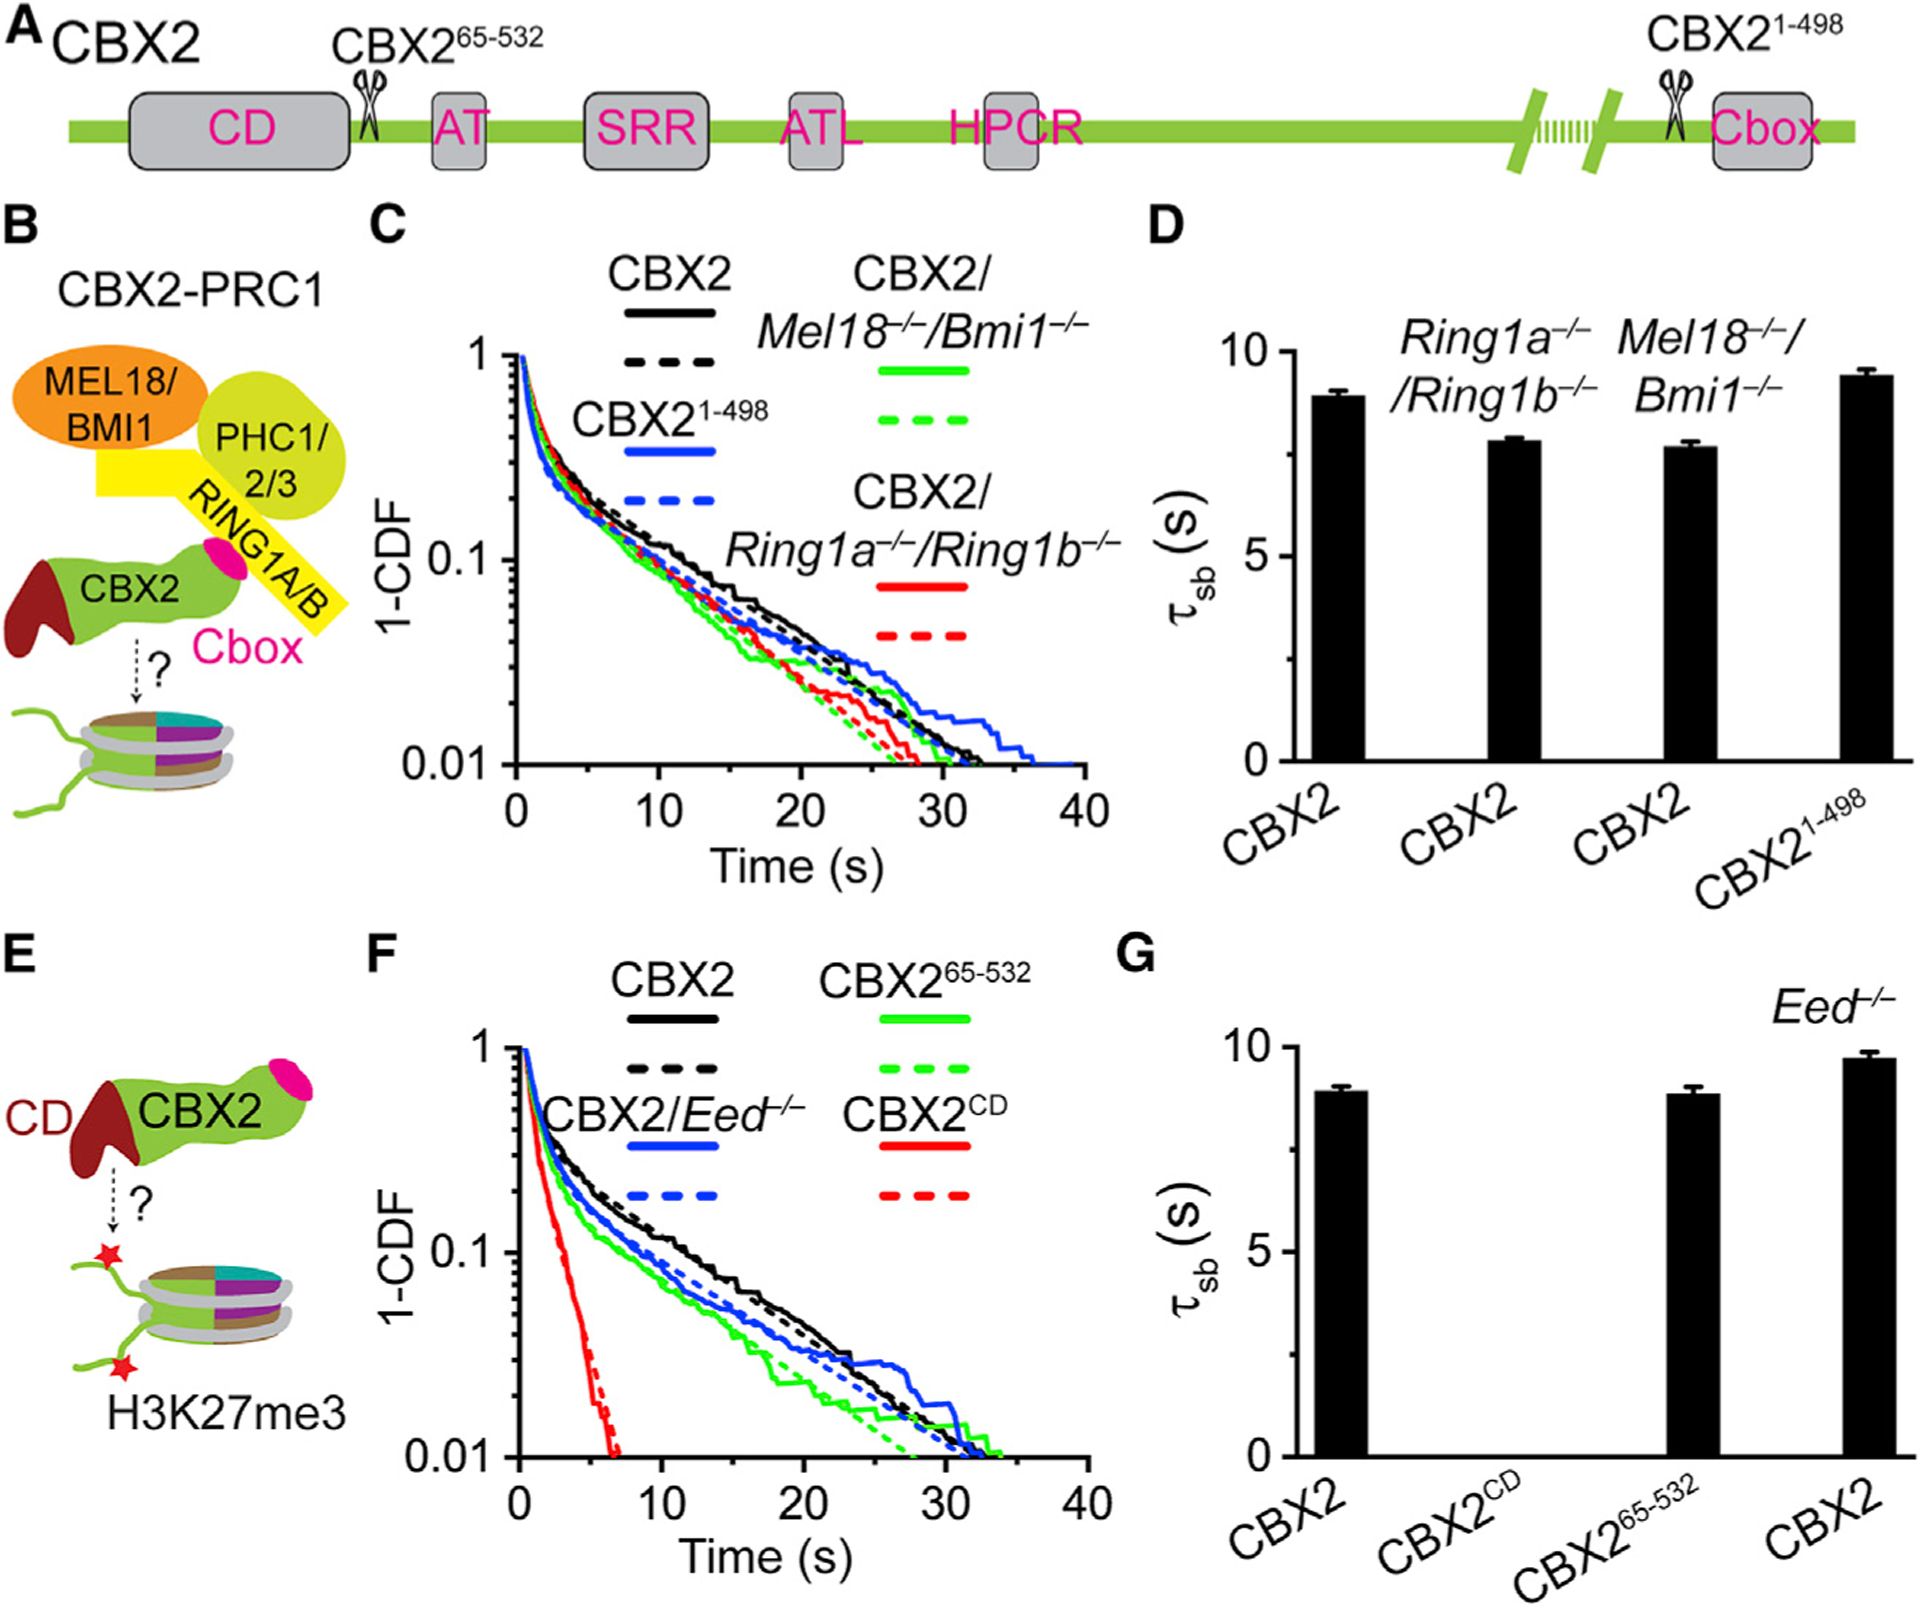
(A) Schematic representation of CBX2 and its variants. CD denotes chromodomain; AT, AT-hook; SRR, serine-rich region; ATL, AT-hook-like; HPCR, highly positively charged region; and Cbox, Chromobox.
(B) Sketch of the CBX2-PRC1 complex. The Cbox motif of CBX2 interacts with RING1B.
(C and F) Survival probability distribution of the dwell times. The numbers of cells and trajectories used are listed in Table S1.
(E) The hypothesis tests whether H3K27me3 affects the binding stability of CBX2 through interaction with the CD motif of CBX2.
(D and G) Specific residence times (τsb) quantified from (C) and (F). Non-specific residence times (τtb) are shown in Figure S2. Error bars represent standard error for the derived parameter.
H3K27me3 Is Not the Binding Site for CBX2
If CBX2 is the nucleator of CBX2-PRC1 condensates, CBX2 should nucleate at the specific chromatin regions that provide sites for stabilizing CBX2 on chromatin. The binding of CBX2 to sites can slow down its diffusion and increase its local concentration, thereby driving phase separation. The prevailing model is that the CBX-PRC1 complexes bind to chromatin marked by H3K27me3 generated through PRC2 (Aranda et al., 2015; Blackledge et al., 2015; Steffen and Ringrose, 2014; Figure 2E). Thus, we asked whether H3K27me3 is the site that stabilizes CBX2 on chromatin.
To address this, we integrated HT-CBX2 into the genome of Eed−/− mESCs in which H3K27me3 is eliminated (Margueron and Reinberg, 2011; Zhen et al., 2016). The residence time of CBX2 in Eed−/− mESCs (τsb = 9.7 s) was similar to that in wild-type mESCs (Figures 2F and 2G). Because chromodomain (CD) has been proposed to be the binding domain for H3K27me3 (Aranda et al., 2015; Blackledge et al., 2015; Steffen and Ringrose, 2014), we investigated whether CD affects the binding stability of CBX2. We made two CBX2 variants: CD only (CBX2CD) and CBX2 without CD (CBX265–532) (Figure 2A). CBX265–532 (τsb = 8.9 s) had the same binding stability as CBX2; however, CBX2CD (τsb = 0 s) did not bind tightly to chromatin (Figures 2F and 2G). These results indicate that H3K27me3 may not be the seeding site for the LLPS of CBX2, which is consistent with our previous reports in which the elimination of H3K27me3 does not prevent the formation of CBX2 condensates in live cells (Tatavosian et al., 2019).
The AT-Hook Motif Stabilizes CBX2 on Chromatin
As H3K27me3 contributes little to the binding stability of CBX2, we started to search for the region(s) that determines its binding stability, which may provide insights into the nucleation process. We made a series of CBX2 variants and then measured their binding stability (Figure 3A). First, we made five deletions (two in Figure 2 and three in Figure 3). The C-terminal deletions (CBX21–192, CBX21–281, and CBX21–498) had negligible effects on the binding stability of CBX2 (Figures 2B, 3B, and 3C). Deleting CD (CBX265–532) had no impact on binding stability (Figure 2G); however, deleting both CD and the AT-hook (AT) motif (CBX289–532) greatly reduced the binding stability (Figures 3B and 3C). The AT motif is a potential DNA-binding motif through the residues PRG (Huth et al., 1997; Reeves and Nissen, 1990); nonetheless, mutating PRG (CBX2ATm) had no effect on the binding stability (Figures 3B and 3C). Positively charged residues within AT and between AT and CD are over-represented (Figure 3A). Mutating the positively charged residues within AT (CBX2AT-P2A) greatly reduced the binding stability but not those between AT and CD (CBX2CA-P2A) (Figures 3B and 3C). These data indicate that AT is critical for stabilizing CBX2 on chromatin.
Figure 3. Effects of Mutation and Deletion on the Condensate Formation and Binding Stability of CBX2.
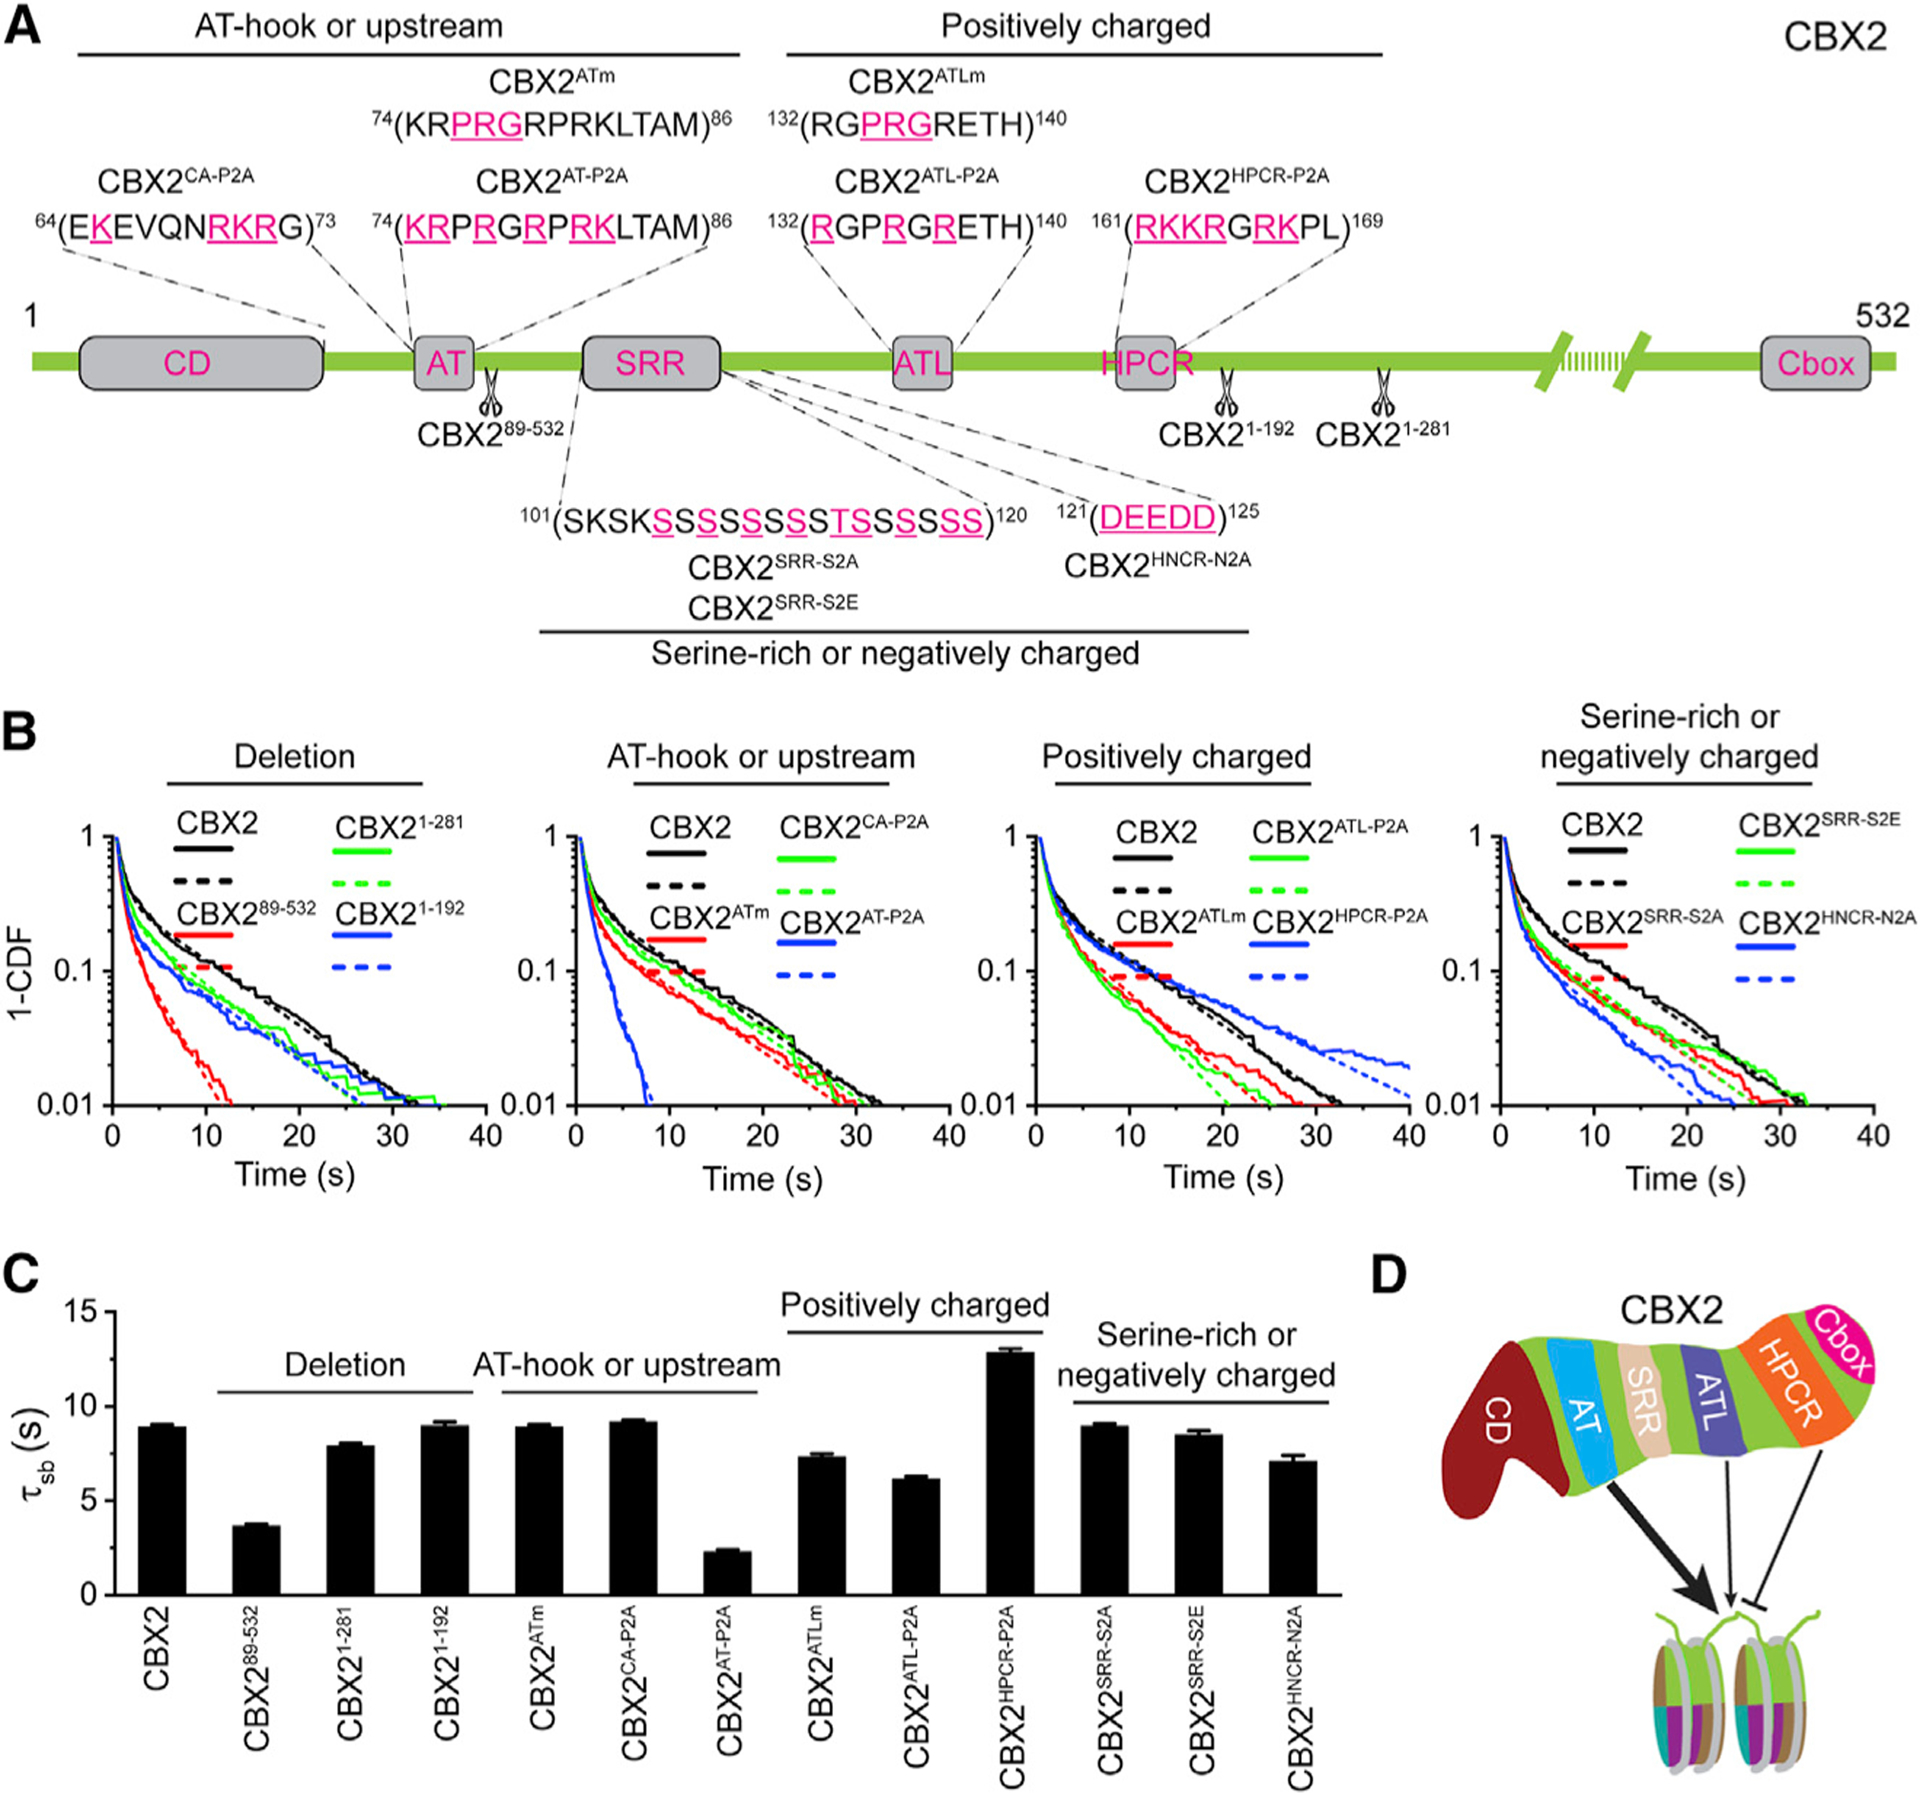
(A) Schematic representation of CBX2 variants used in this study. The underlined residues highlighted in red were mutated to Ala (P2A, positively charged residues to Ala; S2A, Ser to Ala; N2A, negatively charged residues to Ala) or Glu (S2E, Ser to Glu).
(B) Survival probability distribution of the dwell times for CBX2 and variants, respectively. The numbers of cells and trajectories used are listed in Table S1.
(C) Specific residence times (τsb) for CBX2 and its variants quantified from (B). Non-specific residence times (τsb) are shown in Figure S3. Error bars represent standard error for the derived parameter.
(D) Schematic representation of the elements of CBX2 that mediate the interactions with chromatin. The AT motif stabilizes CBX2 on chromatin. The ATL motif also contributes to the stabilization of CBX2 on chromatin but to a lesser extent compared with the AT motif. The HPCR motif antagonizes the binding stability of CBX2 on chromatin.
The AT-hook-like (ATL) motif contains the potential DNA-binding residues PRG (Huth et al., 1997; Reeves and Nissen, 1990; Figure 3A). Mutating PRG (CBX2ATLm) had no impact on the binding stability (Figures 3B and 3C). Mutating the positively charged residues within ATL (CBX2ATL-P2A) slightly reduced the binding stability (Figures 3B and 3C). Highly positively charged region (HPCR) is a conserved motif (Senthilkumar and Mishra, 2009), and positively charged residues are over-represented (Figure 3A). Mutating these resides enhanced the binding stability (Figures 3B and 3C). The serine-rich region (SRR) is conserved and phosphorylated (Plys et al., 2019; Senthilkumar and Mishra, 2009). Mutating Ser and Thr to Ala (CBX2SRR-S2A) or Glu (CBX2SRR-S2E) had no effects on the binding stability (Figures 3B and 3C). There is a stretch of negatively charged resides (HNCR) juxtaposed with SRR (Figure 3A). Mutating these resides (CBX2HNCR-N2A) had no impact on the binding stability (Figures 3B and 3C). Overall, these data demonstrate that the binding of CBX2 on chromatin is primarily stabilized by AT but is antagonized by HPCR (Figure 3D). It would be interesting to investigate whether and how these domains communicate to control the binding stability of CBX2 in the future.
AT Nucleates CBX2 through Binding DNA
As the AT-hook motif is primarily required for stabilizing CBX2 on chromatin, it may be involved in the nucleation of CBX2 condensates. The AT-hook motif can bind DNA (Huth et al., 1997; Reeves and Nissen, 1990). Thus, we investigated whether CBX2 can bind DNA. We generated recombinant CBX2 and CBX2AT-P2A proteins and then performed electrophoretic mobility shift assay (EMSA) using the major satellite DNA (Figures 4A and S4A). EMSA analysis indicated that CBX2 binds DNA (Kd ≈ 3.0 μm), while mutating positively charged residues within AT-hook (CBX2AT-P2A) reduces the binding affinity (Kd ≈ 10.0 μm) (Figure 4B), indicating that the AT-hook motif binds DNA. As the AT-hook of CBX2 preferentially binds AT-rich DNA, we reduced the AT content of satellite DNA used (Figure S4A) and then performed EMSA. EMSA showed that CBX2 slightly prefers the AT-rich satellite sequence over the non-AT-rich satellite sequence (Figures S4B and S4C). These data indicate that CBX2 binds DNA through the AT-hook motif.
Figure 4. CBX2 Binds DNA, which Promotes LLPS In Vitro and In Vivo.
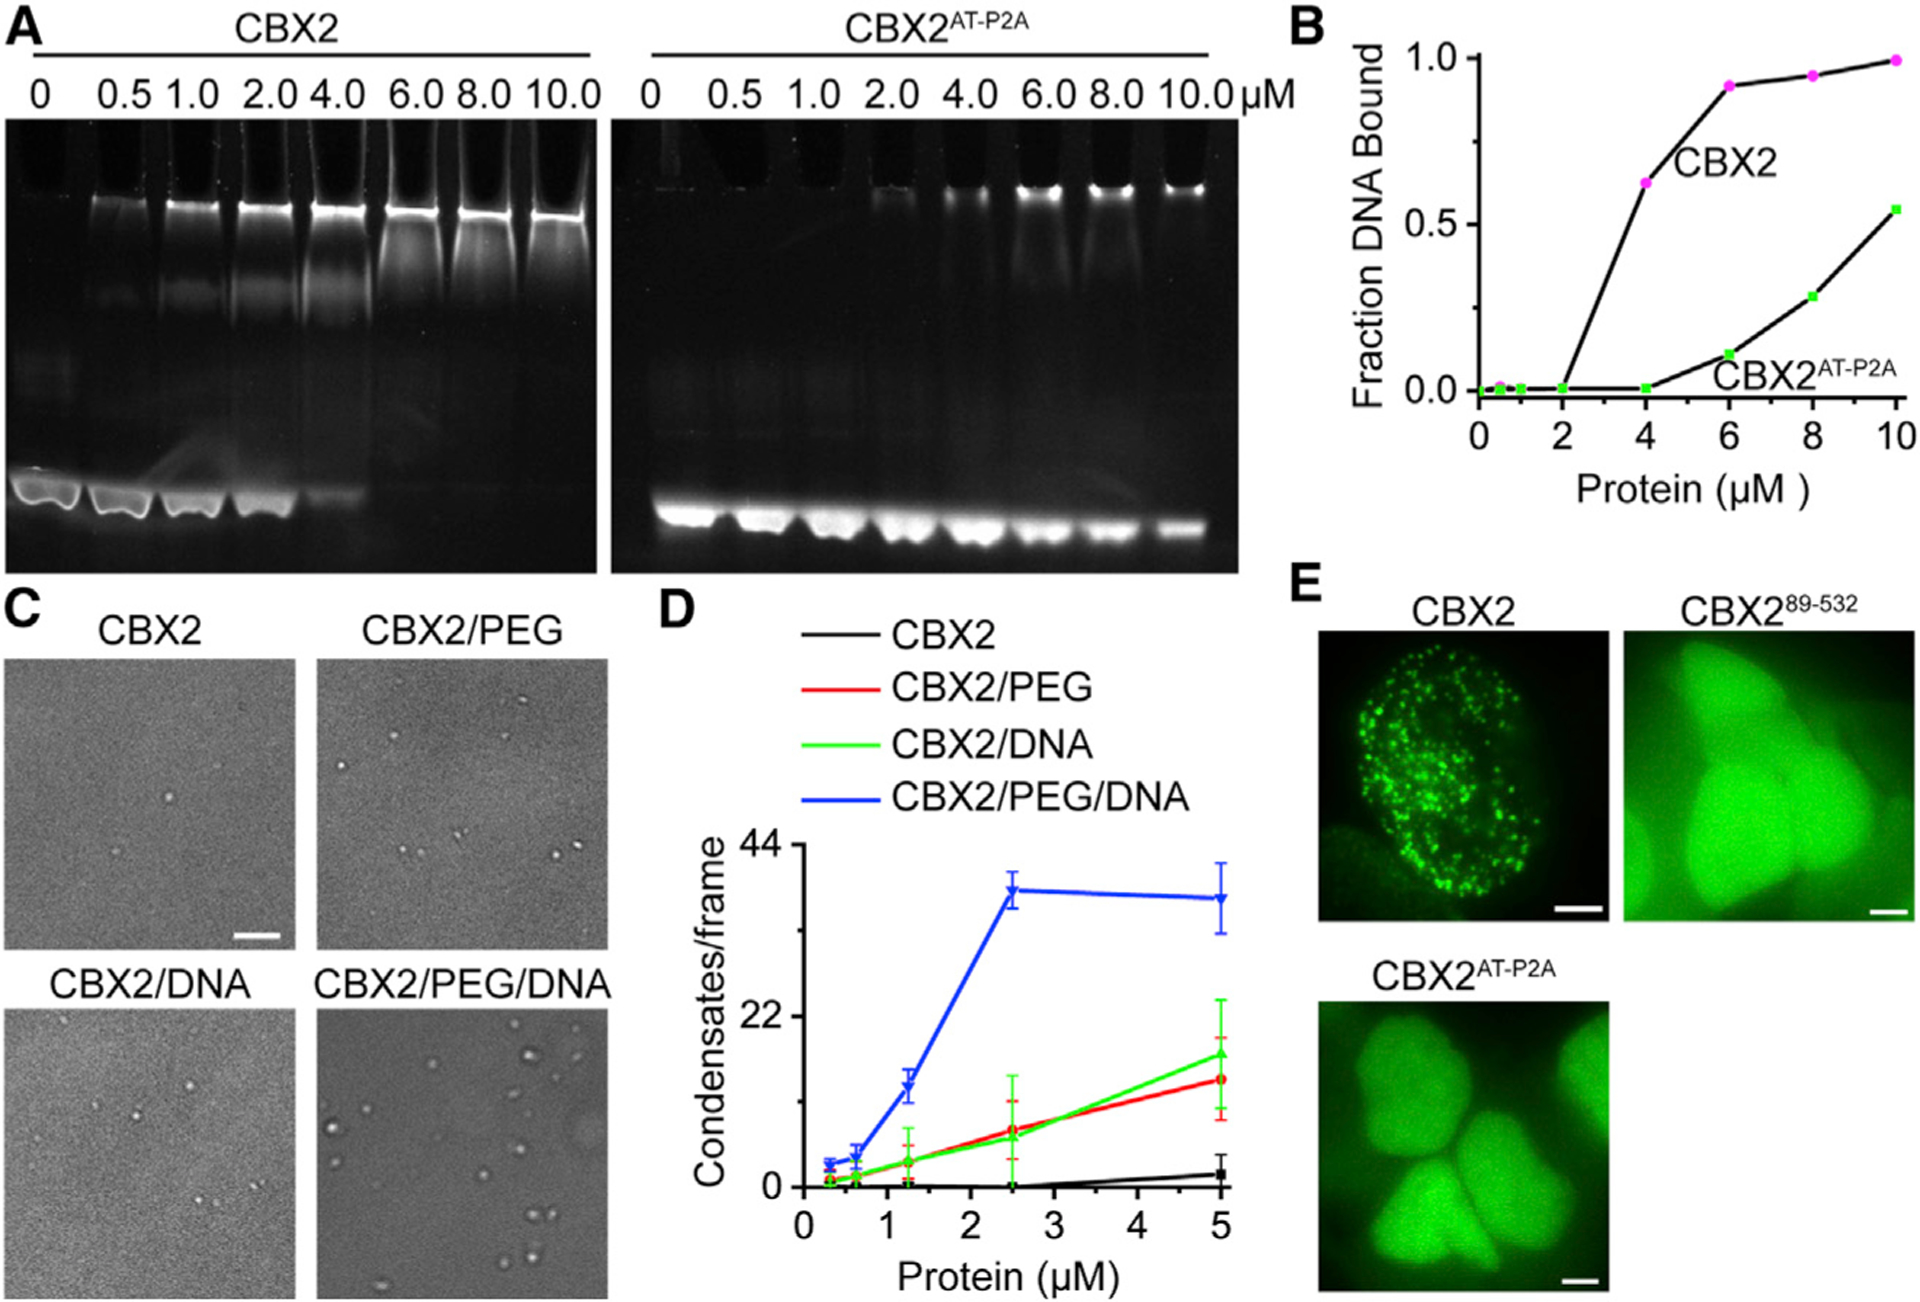
(A) Determination of the binding of CBX2 and CBX2AT-P2A to DNA by EMSA.
(B) Quantification of EMSA gel from (A) to estimate the dissociation constant of CBX2 to DNA.
(C) Example DIC images of CBX2 condensates on the surface of coverslip in the absence or presence of PEG, DNA, or both. Scale bar, 5.0 μm.
(D) Number of condensates quantified from (C). Error bars represent SD.
(E) Example live-cell epifluorescence images of CBX2 and its variants with impaired DNA-binding capacity. Scale bars, 2.0 μm.
Given that CBX2 binds DNA, we asked whether DNA promotes the LLPS of CBX2. We performed an in vitro condensate formation assay. We recorded images of condensates under the microscope and found that CBX2 formed spherical condensates (Figures 4C and 4D), which is consistent with previous reports (Plys et al., 2019; Tatavosian et al., 2019). PEG increases the crowding of solution and can promote the LLPS of proteins (Annunziata et al., 2002). We found that PEG promotes the LLPS of CBX2 (Figure 4D). Adding DNA also enhanced the LLPS of CBX2. Combining PEG and DNA further enhanced the LLPS of CBX2. These data suggest that DNA promotes the LLPS of CBX2.
If the AT-hook motif is involved in the nucleation of LLPS of CBX2, then disrupting its DNA binding capacity would lead to the loss of LLPS of CBX2. To test this, we analyzed the LLPS of CBX289–532 and CBX2AT-P2A in live mESCs. CBX289–532 and CBX2AT-P2A did not form condensates in live mESCs (Figure 4E). As LLPS is concentration dependent, we varied doxycycline concentrations ranging from 0.0 to 2.0 μm. At all the doxycycline concentrations tested, CBX289–532 and CBX2AT-P2A did not form condensates. These results indicate that the AT-hook motif is essential for the LLPS of CBX2 in vivo and that the interaction of the AT-hook motif with DNA is involved in the nucleation of LLPS of CBX2.
PRC2 Is Required for the Target Search of CBX2, but PRC1 Is Not Required
The genomic occupancy level of nuclear factors is regulated by the residence time and the target-search time (STAR Methods). The residence time is determined by the intrinsic physical properties of both nuclear factors and their binding sites. The target-search process of nuclear factors in mammalian cells can be regulated by their spatial organization (Hansen et al., 2020; McSwiggen et al., 2019a). As LLPS alters spatial organization by increasing the local concentration of proteins involved, we asked whether phase-separated condensates can regulate the target-search process of CBX2. To address this question, we first quantified the target-search process and LLPS capacity of CBX2 and its variants and then established the correspondence between them.
To quantify the target-search process of CBX2 in live cells, we tracked individual molecules at 30 ms integration time without interval or 10 ms integration time with 20 ms interval (Figure 5A; Figures S5A–S5E). We constructed the displacement histogram from the data and then carried out kinetic modeling of the measured displacements using Spot-On (Hansen et al., 2017, 2018), which quantitatively measures three kinetic fractions of total molecules within the nucleus: F1 (chromatin bound), F2 (confined motion), and F3 (free diffusion) (Figure 5A). By analyzing the survival probability distribution of the dwell times, we obtain τtb and τsb as well as f1tb (the non-specific fraction within the total chromatin-bound molecules) and f1sb (the specific chromatin-bound fraction within the total chromatin-bound molecules) (Figure 5A). By kinetic modeling, we obtain four target-search parameters: the specific chromatin-bound fraction within the total molecular population (F1sb), the number of non-specific sites sampled (Ntrial), the 3D freely diffusing time between two binding sites (τ3D), and the time for locating specific sites (τsearch) (Figure 5A; STAR Methods). We quantified the target-search process of CBX2 (Figures 5B–5E and S5A). About 11% of CBX2 (F1sb) is bound specifically to chromatin. After dissociating from a specific site, CBX2 took ~72 s to locate the next specific site: sampling about four non-specific binding sites, spending ~69 s (Ntrial × τ3D) in 3D free diffusion, and residing ~3 s (Ntrial × τtb) on non-specific sites. The 3D free diffusion time was more than 20-fold longer than the non-specific residence time. The target-search kinetics of CBX2 in Cbx2−/− mESCs was similar to that in wild-type mESCs. We also found that HaloTag does not bind stably to chromatin. Our data suggest that the 3D free diffusion dominates the target-search process of CBX2.
Figure 5. The Target-Search Process of CBX2 and Its Variants.
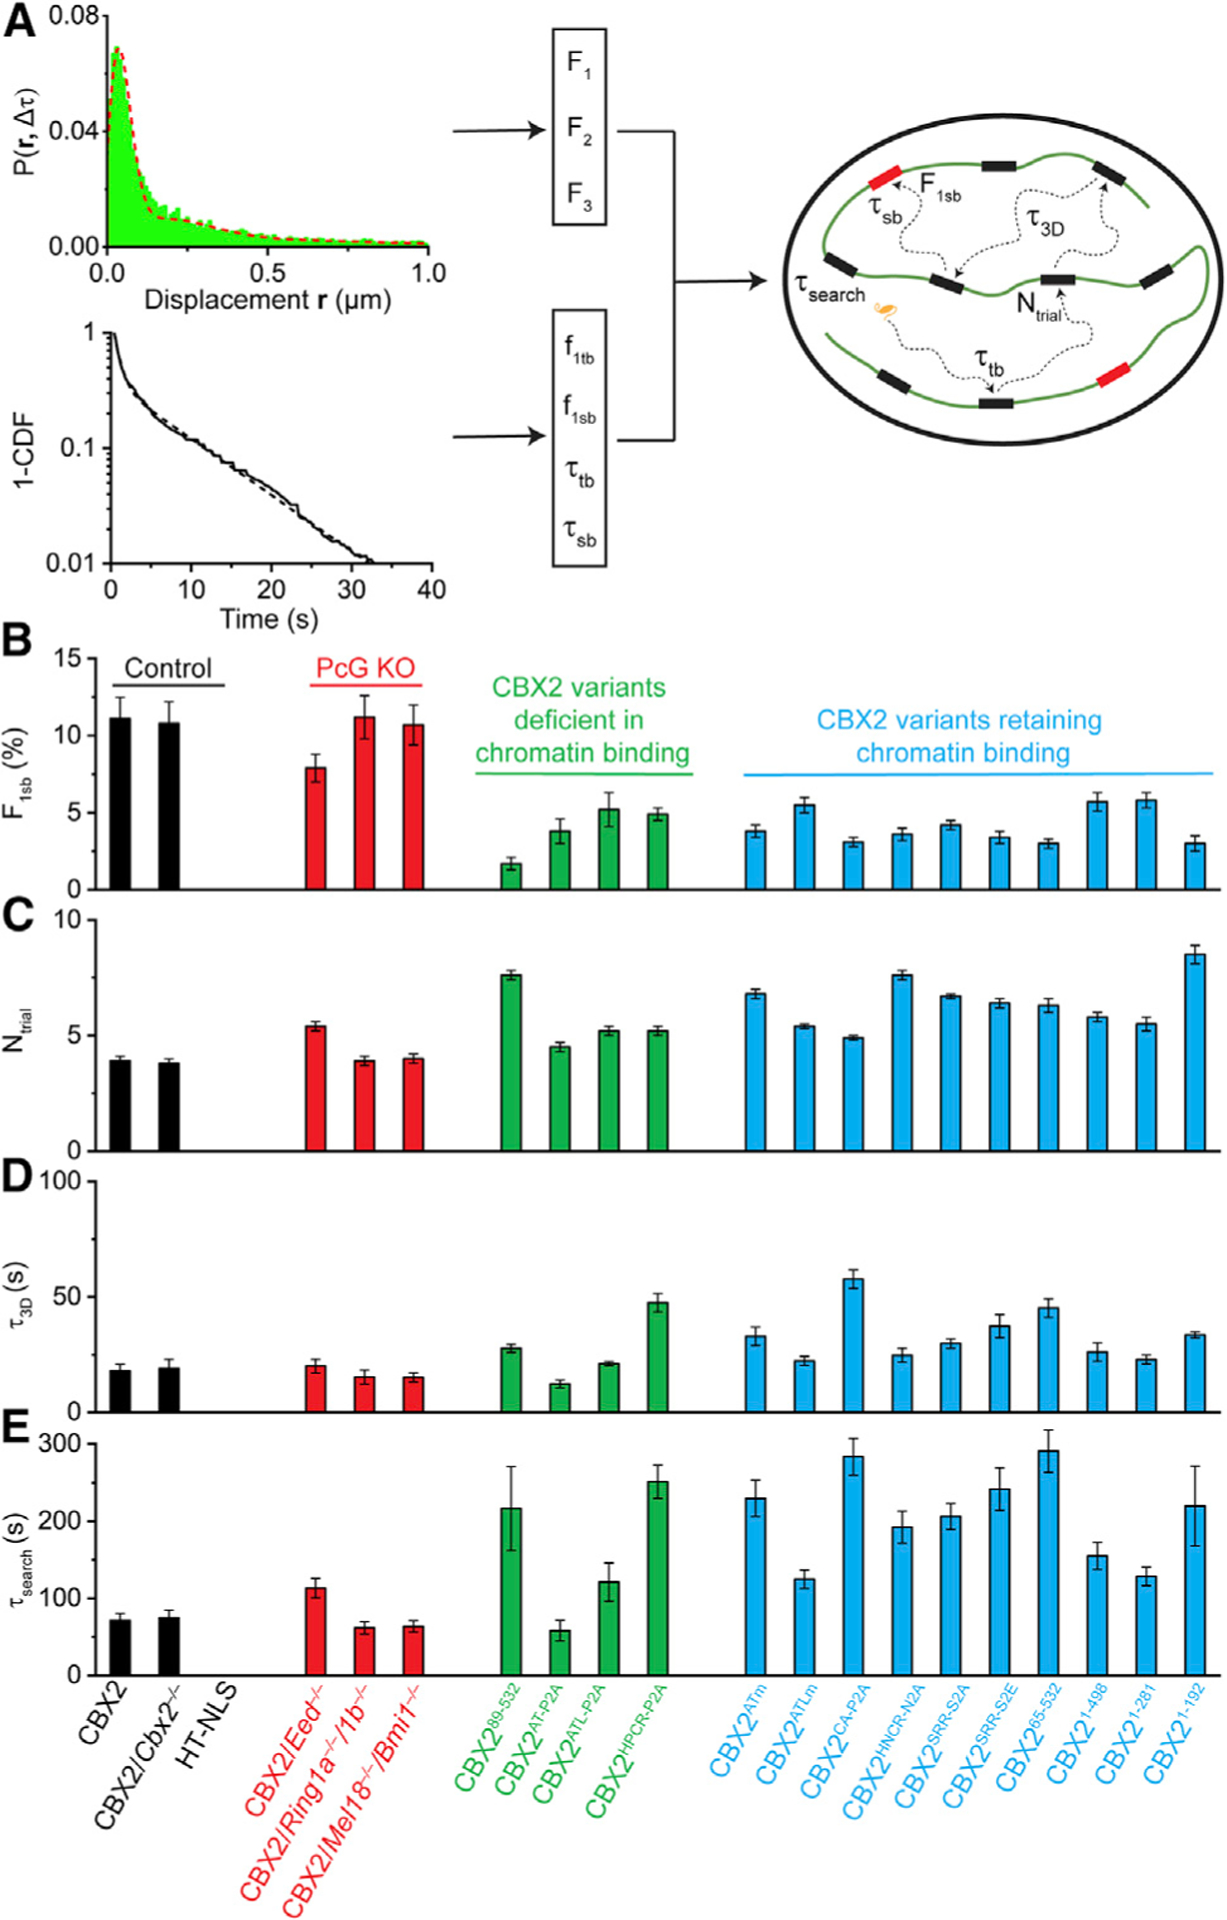
(A) Schematic representation of the quantification of the target-search process. See STAR Methods for details.
(B–E) F1sb (B), Ntrial (C), τ3D (D), and τsearch (E) for CBX2 and its variants in wild-type mESCs and for CBX2 in PcG-knockout mESCs as well as for the control HT-NLS in wild-type mESCs. Displacement histograms are in Figure S5. The numbers of cells and displacements used are listed in Table S1. Error bars represent SD.
To investigate whether H3K27me3 affects the target-search process of CBX2, we examined the search parameters of CBX2 in Eed−/− mESCs (Figures 5B–5E and S5B). The chromatin-bound fraction (F1sb = 7.9%) of CBX2 in Eed−/− mESCs was about 70% of CBX2 in wild-type mESCs. The number of trials (Ntrial), the 3D free diffusion time (τ3D), and the search time (tsearch) of CBX2 in Eed−/− mESCs increased in comparison with that in wild-type mESCs. These data suggest that although H3K27me3 is not required for the binding stability of CBX2, it is needed for the target-search process of CBX2, thereby affecting its genomic occupancy level.
To determine the effects of PRC1 subunits on the target-search process of CBX2, we measured the search parameters of CBX2 in Ring1a−/−/Ring1b−/− mESCs and Mel18−/−/Bmi1−/− mESCs (Figures 5B–5E and S5B). The chromatin-bound fractions for CBX2 in knockout mESCs were similar to CBX2 in wild-type mESCs. The target-search parameters (Ntrial, τ3D, and τsearch) of CBX2 in knockout mESCs were also similar to that in wild-type mESCs, indicating that PRC1 subunits have minor effects on the target-search process of CBX2.
Effects of Mutations on the Target-Search Process of CBX2
To further understand the factors that regulate the target-search process, we studied the CBX2 variants generated above. There were two kinds of CBX2 variants: one with an altered chromatin-binding stability and another retaining chromatin-binding stability similar to the wild-type. We first investigated the target-search process of CBX2 variants with an altered binding stability (Figures 5B–5E and S5C). We found that the specific chromatin-bound fractions of these CBX2 variants are reduced by 2- to 6-fold in comparison with wild-type CBX2. Although CBX2HPCR-P2A bound more stably to chromatin than CBX2, its specific chromatin-bound fraction was less than CBX2. These data suggest that increasing binding stability may not enhance the genomic occupancy of nuclear factors, as the genomic occupancy level is determined by both the binding stability and the target-search process. We compared the target-search process of these CBX2 variants with CBX2. CBX289–532, CBX2AT-P2A, and CBX2ATL-P2A were all deficient in chromatin binding; however, they exhibited distinct target-search processes. It was interesting to observe that although CBX2HPCR-P2A exhibits a better binding stability than CBX2, it has a prolonged target-search process compared with CBX2. These data indicate that the target-search process is regulated not only by binding stability but also by other factors, such as spatial organization of proteins.
We then investigated the target-search process of CBX2 variants that retain the same chromatin-binding stability as CBX2 (Figures 5B–5E and S5D). The specific chromatin-bound fractions of these CBX2 variants were 2- to 3-fold less than that of CBX2. Analysis of the target-search process showed that these CBX2 mutants have a lengthened target-search process: taking 1.5- to 2-fold more trials to sample non-specific sites, spending 1.5- to 3-fold more free diffusion time between two binding events, and taking 1.5- to 4-fold more time to locate their targets. These results point out that although these CBX2 variants have a similar binding stability as CBX2, they have a lengthened target-search time due to an increased sampling of non-specific sites and a prolonged 3D free diffusion time. The lengthened target-search process reduces the specific chromatin-bound fraction of these CBX2 variants.
LLPS Speeds up the Target-Search Process of CBX2
It was interesting to note that although some CBX2 variants have the same binding stability as CBX2, they have distinct target-search processes. This could be due to the difference in their spatial organization, as the spatial organization of nuclear factors can affect the target-search process (Hansen et al., 2020; McSwiggen et al., 2019a). We investigated the LLPS capacity of these CBX2 variants and determined the correlation between their LLPS capacity and the target-search process. We focused on the CBX2 variants that retain a similar binding stability as wild-type CBX2, so we can exclude the effects of binding stability on the target-search process. To determine the LLPS capacity, we labeled these fusion proteins by using HaloTag TMR ligand and then performed live-cell imaging. We found that CBX2 forms condensates in Eed−/−, Ring1a−/−/Ring1b−/−, and Mel18−/−/Bmi1−/− mESCs (Figure 6A), respectively, which is consistent with our previous reports (Tatavosian et al., 2019). The condensates of CBX2 in wild-type mESCs were spherical; however, some condensates in PcG-knockout mESCs were irregular shapes (Figure 6A). These data suggest that PRC1 and PRC2 regulate the structure of CBX2 condensates. CBX2 variants that retain the same binding ability as CBX2 either did not form condensates or had much less condensate formation than CBX2 (Figure 6A). We then quantified the number and the size of these CBX2 variant condensates (Figure S6). To systematically compare the LLPS capacity of CBX2 variants, we defined the capacity of LLPS (CLLPS) as the product of the average number of condensates and the average size of condensates. CBX2 in Ring1a−/−/Ring1b−/− and Mel18−/−/Bmi1−/− mESCs had a similar CLLPS as that in wild-type mESCs (Figure 6B). CBX2 in Eed−/− mESCs had a reduced CLLPS compared with that in wild-type mESCs (Figure 6B). The studied CBX2 mutations and deletions had a reduced CLLPS compared with CBX2 (Figure 6B).
Figure 6. LLPS Speeds up the Target-Search Process of CBX2.
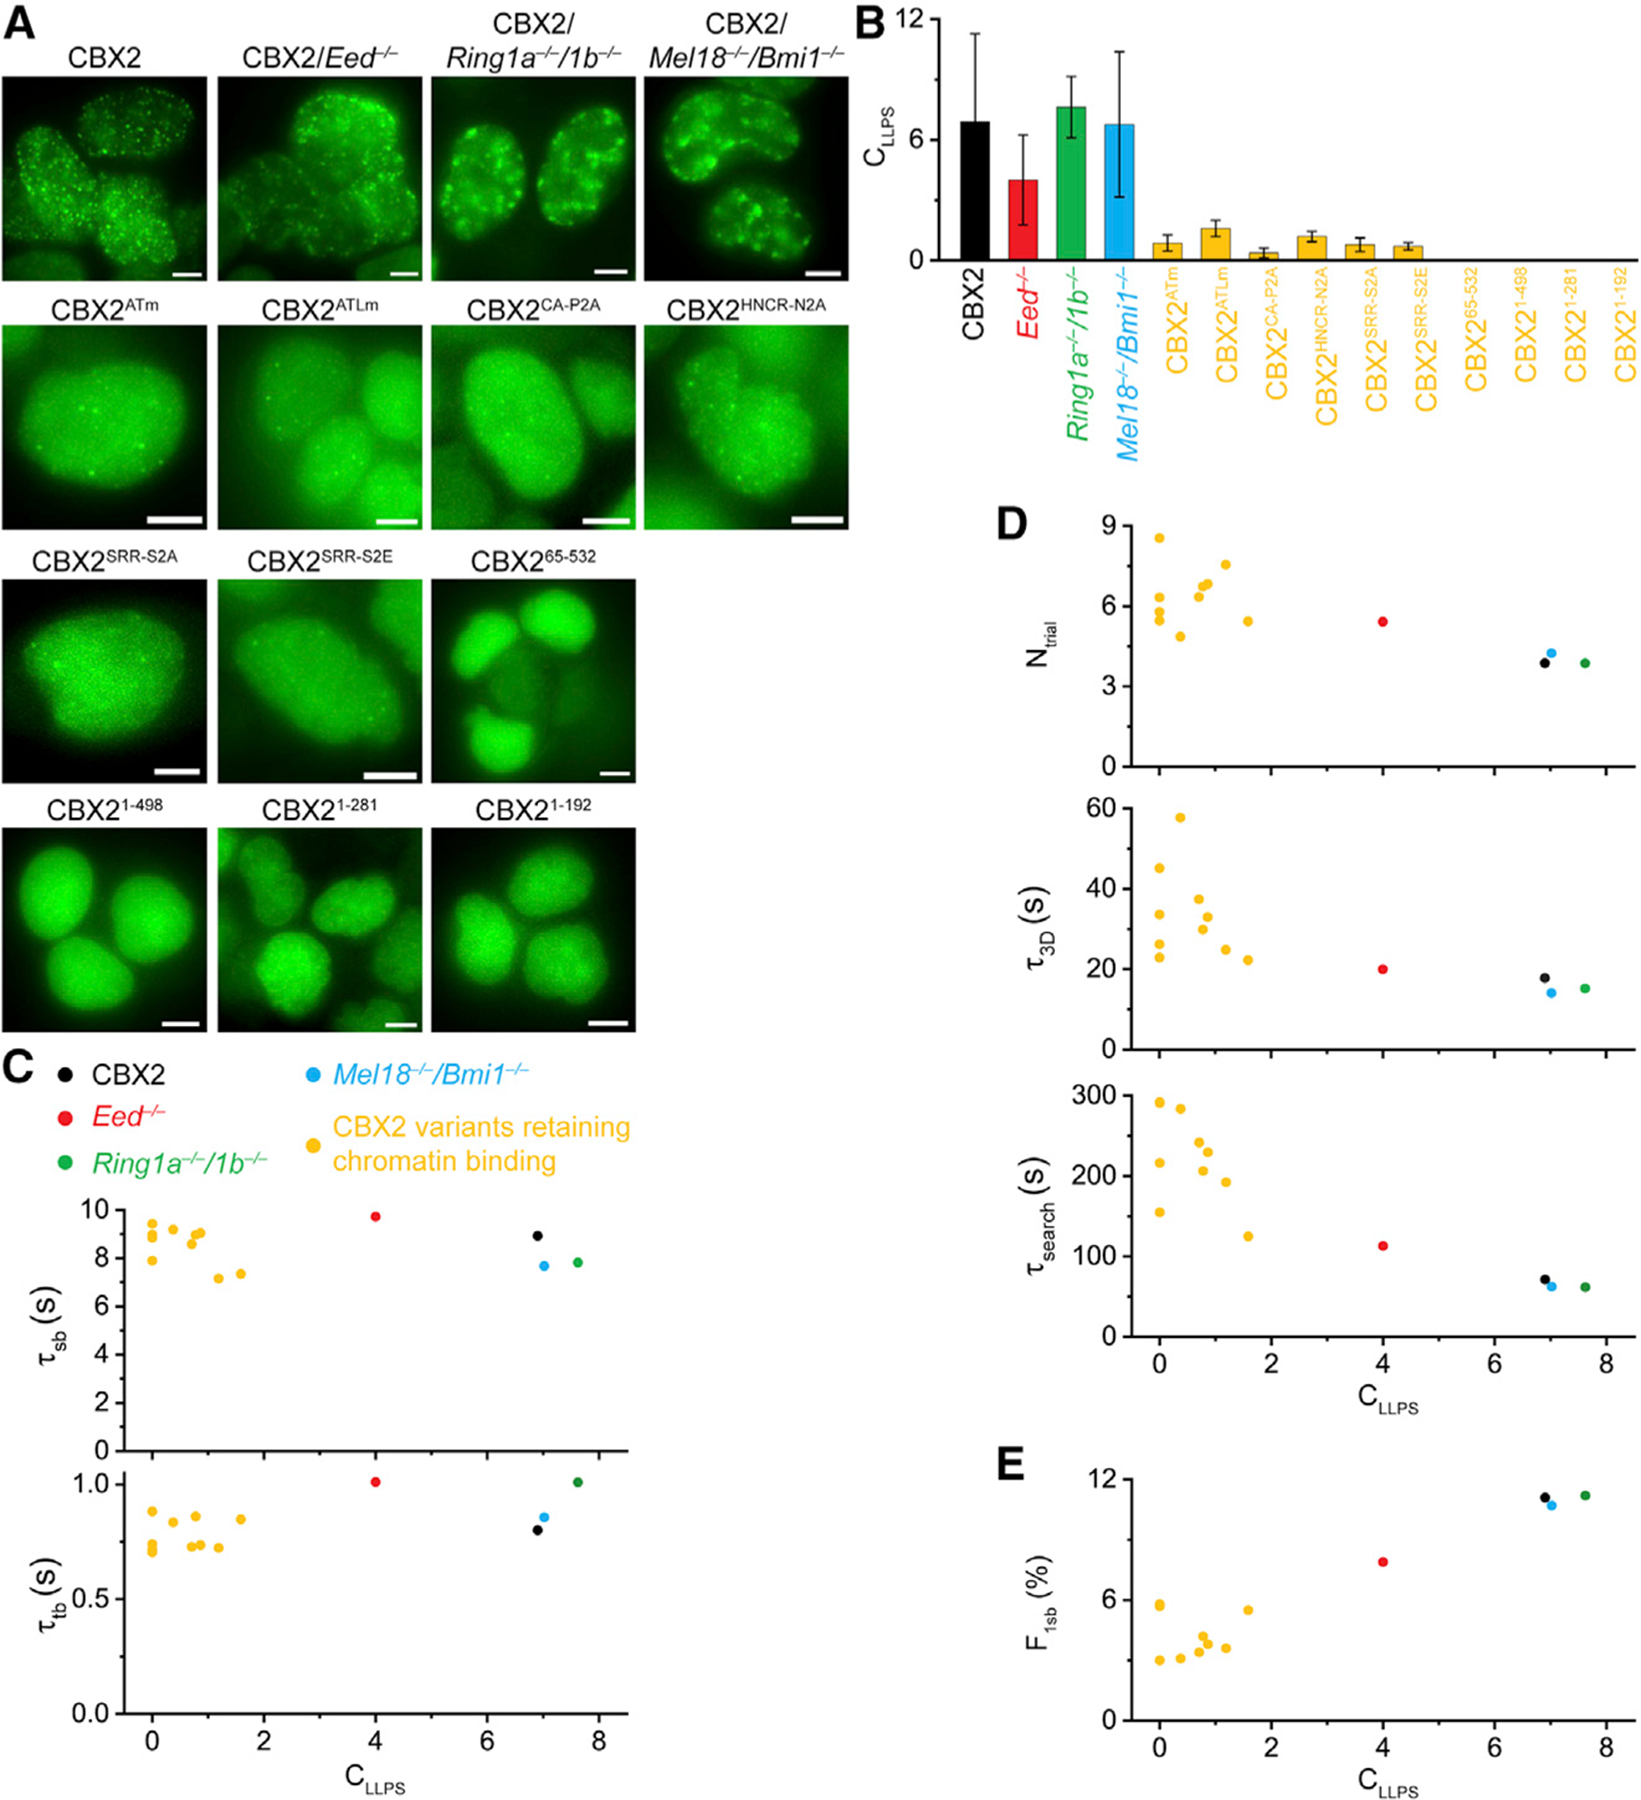
(A) Example live-cell epifluorescence images for CBX2 and its variants in wild-type mESCs as well as for CBX2 in PcG-knockout mESCs. Scale bar, 5.0 μm.
(B) CLLPS for CBX2 and its variants in wild-type mESCs as well as for CBX2 in PcG-knockout mESCs. Error bars represent SD.
(C–E) Dependence of τtb, τsb, Ntrial, τ3D, τsearch, and F1sb on CLLPS for CBX2 and its variants.
To investigate whether there is a correlation between the capacity of LLPS and the target-search process, we plotted CLLPS versus τtb and τsb, respectively (Figure 6C). Although the CLLPS of CBX2 variants were different from that of CBX2 in wild-type mESCs, their chromatin-binding stability remained consistent or similar, suggesting that phase-separated condensates have no noticeable effects on the chromatin-binding stability. We then plotted CLLPS versus Ntrial, τ3D, and τsearch (Figure 6D). The number of trials, the 3D free diffusion time, and the target-search time of CBX2 variants decreased when their LLPS capacity increased, indicating that LLPS speeds up the target-search process. Finally, we plotted CLLPS versus F1sb (Figure 6E). The specific chromatin-bound fraction of CBX2 variants increased when their LLPS capacity increased. As a result, our data indicate that LLPS speeds up the target-search process through a reduced number of sampling non-specific sites and a shortened 3D free diffusion time, thereby increasing the genomic occupancy.
Phase-Separated Condensates Alter the Target-Search Pathway of CBX2
The direct correlation between the capacity of CBX2 to undergo LLPS with its target-search process prompted us to investigate the binding and target-search pathway of CBX2 inside and outside condensates. We labeled CBX2 with a high concentration of HaloTag TMR ligand and a low concentration of JF646 in live cells, which allows condensates to be marked using TMR and molecules to be tracked using JF646. We recorded epifluorescence images of TMR-labeled condensates before and after live-cell SMT and analyzed cells in which the condensates of CBX2 do not drift or rotate. We sorted single-molecule tracks as free and chromatin-bound ones. We mapped the free and bound tracks onto the epifluorescence images of CBX2 condensates (Figure 7A). We counted the number of bound CBX2 molecules inside and outside condensates. About 70% of bound CBX2 molecules were inside condensates (Figure 7B), suggesting that condensates are repressive sites of target genes.
Figure 7. LLPS Alters the Target-Search Pathway.
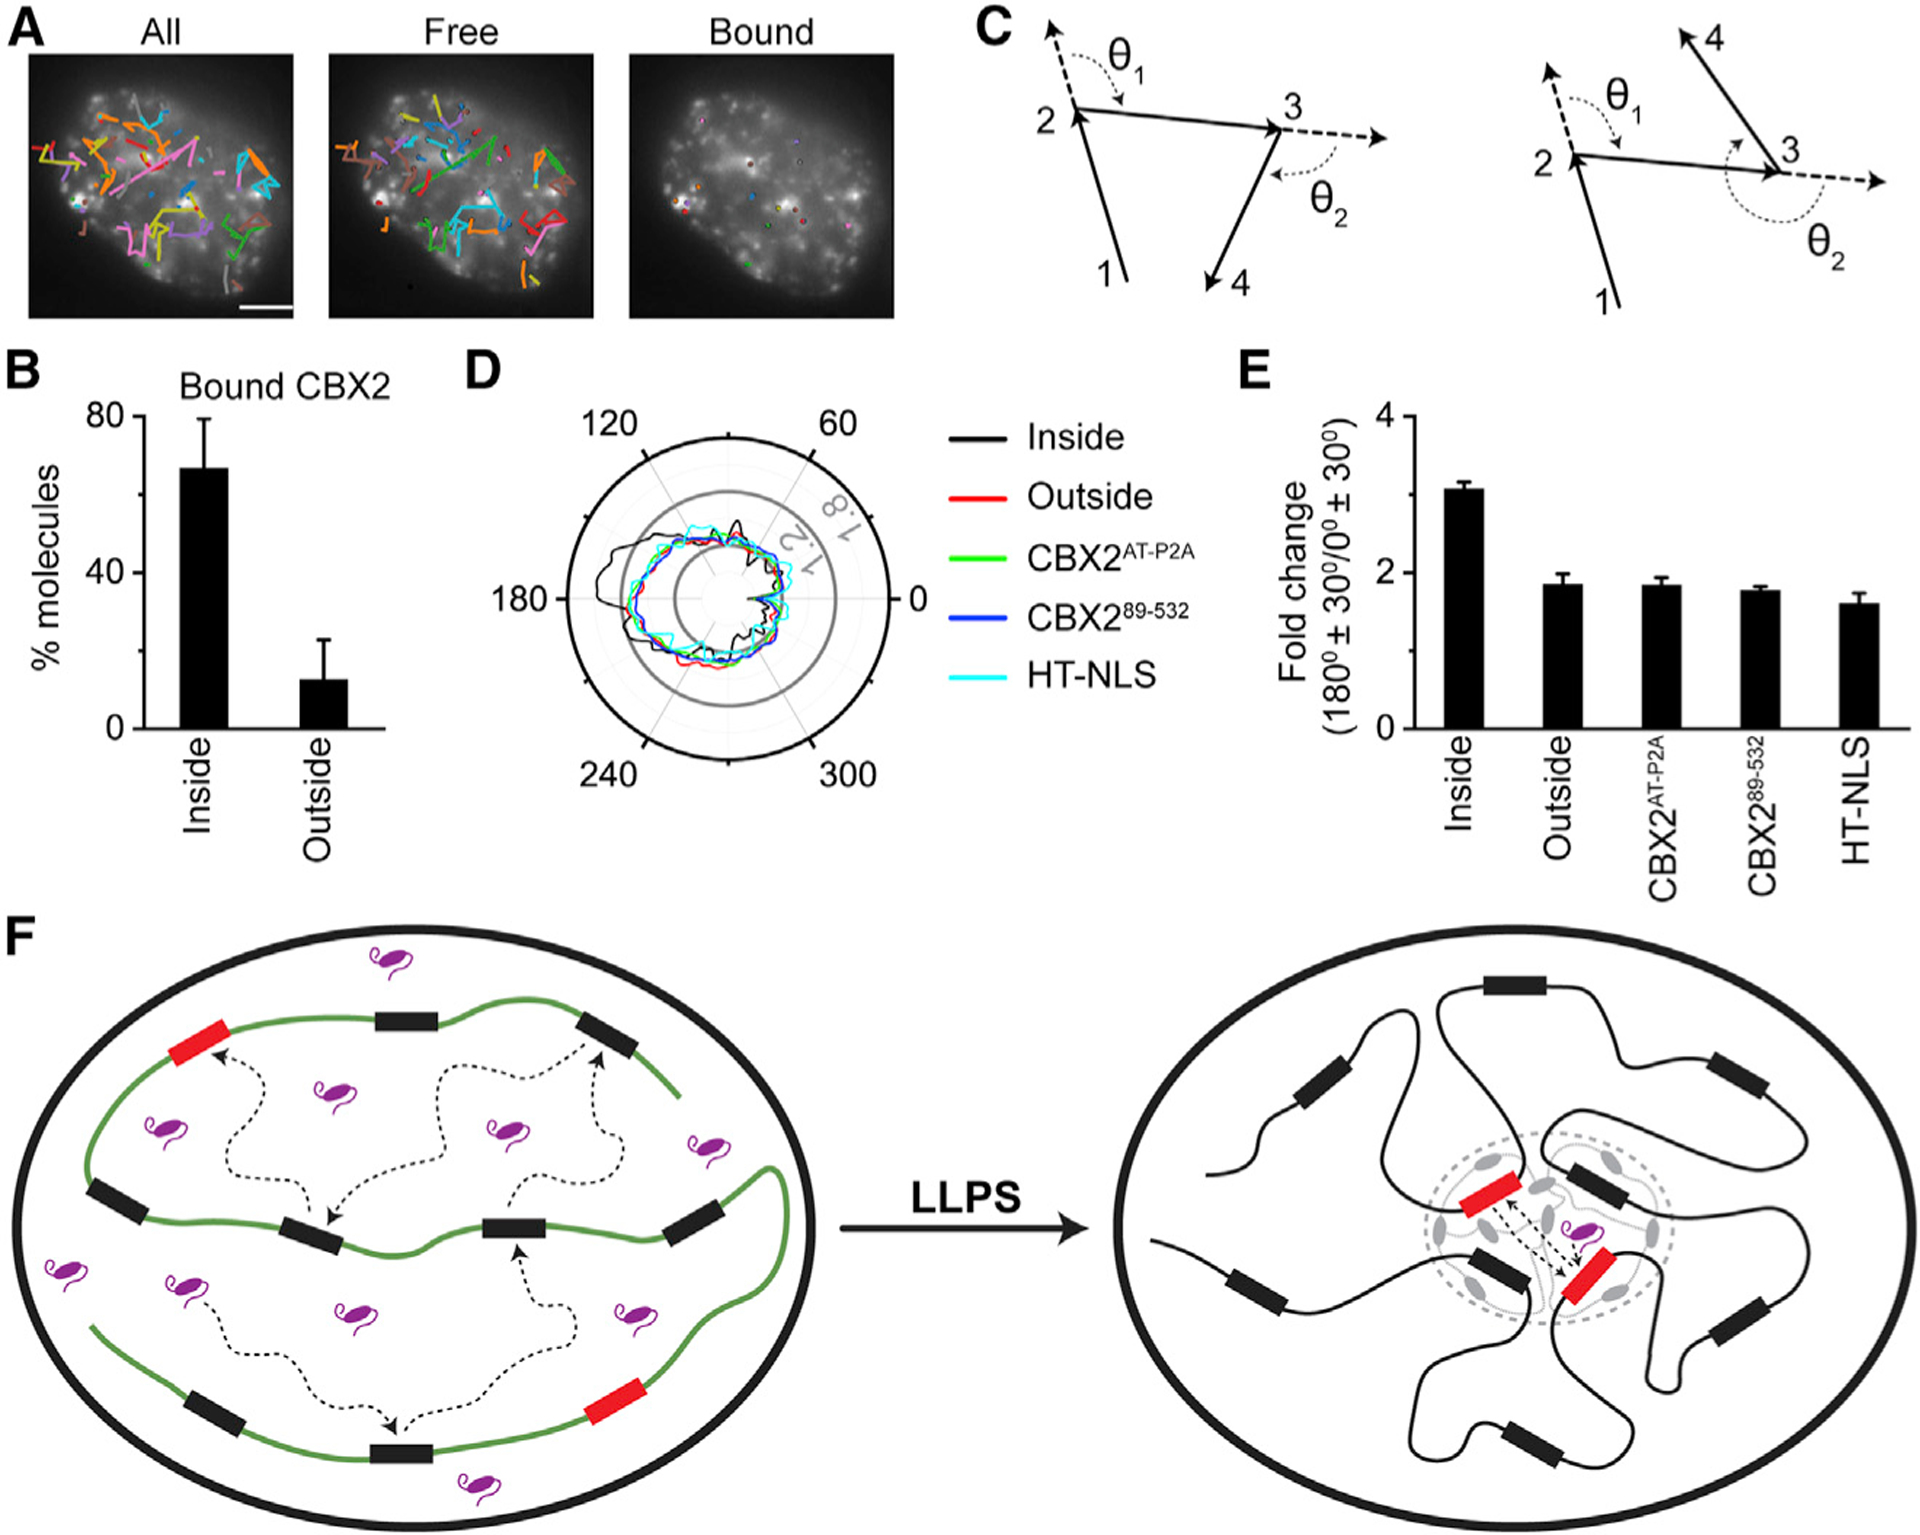
(A) Representative overlay images of SMT trajectories on epifluorescence images of CBX2. The images are represented as total trajectories (left), trajectories not bound to chromatin (middle), and trajectories bound to chromatin (right). The black circles indicate the start position of trajectories. The colors of trajectories are randomly assigned for each image. Scale bar, 5.0 μm.
(B) Percentile of chromatin-bound CBX2 molecules that are inside and outside of condensates. Error bars represent SD.
(C) Examples of the angular distribution between consecutive steps of single-molecule tracking traces.
(D) Representative angular distribution for diffusive CBX2 inside and outside of condensates as well as for CBX2AT-P2A, CBX289–532, and HT-NLS in whole cells. The major ticks of radial scale are 0.6%, 1.2%, and 1.8%.
(E) Quantification of the relative probability of moving backward compared with moving forward ([180° ± 30°]/[0° ± 30°]) for diffusive CBX2 inside and outside of condensates as well as for CBX2AT-P2A, CBX289–532, and HT-NLS in whole cells. Error bars represent SD.
(F) A proposed mechanism underpinning that CBX2 undergoes LLPS to form condensates, which then speeds up the target-search kinetics of CBX2, thereby enhancing its genomic occupancy. Our data indicate that phase-separated condensates shorten the target-search process through reducing the 3D free diffusion time and the number of non-specific trials.
As condensates increase the local concentration and binding sites of CBX2, we speculated that CBX2 should be able to revisit the same or adjacent binding sites. Recent studies have shown that clusters and compartments facilitate DNA-binding factors to explore the same or adjacent target sites repetitively (Hansen et al., 2020; McSwiggen et al., 2019a). Thus, CBX2 should have a greater chance of moving backward inside condensates than outside condensates. To test this hypothesis, we analyzed the angle formed by consecutive displacements (Figure 7C). We selected unbound molecules with diffusion coefficients above 0.1 μm2/s for analysis, because localization uncertainties of bound molecules would skew the angular distribution. We analyzed trajectories that were inside and outside condensates. CBX2 diffused more anisotropically inside condensates than outside condensates (Figure 7D). As controls, we studied the angular distribution of HT-NLS as well as CBX2AT-P2A and CBX289–532, both of which do not bind chromatin or form condensates. Their angular distributions were similar to each other as well as to CBX2 outside condensates (Figure 7D).
If CBX2 has a greater chance of moving backward than that of moving forward, we should be able to see that CBX2 has a larger fraction at 180° ± 30° than that at 0° ± 30°. To quantitatively compare the chance of moving backward relative to moving forward, we quantified the fraction of CBX2 at 180° ± 30° as well as that at 0° ± 30° and determined their ratio (Figure 7E). We found that when CBX2 is inside condensates, it has a 3.1-fold greater chance of moving backward than that of moving forward; however, when CBX2 is outside condensates, it has 1.8-fold more chance of moving backward than that of moving forward (Figure 7E). These data indicate that the chance of CBX2 moving backward inside condensates is greater than that outside condensates. As controls, the likelihood of moving backward of CBX2 outside condensates were similar to that of HT-NLS, CBX2AT-P2A, and CBX289–532 (Figure 7E). We estimated the target-search process of CBX2 inside condensates in which CBX2 is ~10-fold faster in locating its target sites through shortening 3D free diffusion time by ~4 fold and reducing trials for sampling non-specific sites by ~3 fold compared with CBX2 defective in LLPS. These data are consistent with the model that phase-separated condensates facilitate CBX2 to revisit the same or adjacent sites repetitively, thereby enhancing the target-search efficiency (Figure 7F).
DISCUSSION
It has been proposed that phase-separated condensates can facilitate the efficiency and specificity of biochemical reactions (Banani et al., 2017; Hyman et al., 2014; Shin and Brangwynne, 2017); however, obtaining the direct experimental evidence and understanding the underlying mechanisms remain challenging in live cells, partly because of the unavailability of techniques. Here, by leveraging live-cell SMT, we uncover that CBX2 nucleates on chromatin to assemble CBX-PRC1 repressive condensates that speed up the target-search process of CBX2, thereby achieving a high level of genomic occupancy.
LLPS Accelerates the Target-Search Process
Our results demonstrate that phase-separated condensates accelerate target-search efficiency. We show that CBX2 uses a sampling mechanism to locate its target sites by exploring the nucleus through alteration between 3D free diffusion and sampling non-specific sites. We indicate that the 3D free diffusion time is much longer than the 1D sliding time, suggesting that 3D free diffusion dominates the target-search process. This is consistent with epigenetic factors CBX7 and PRC2 as well as transcription factors in mammalian cells (Chen et al., 2014; Normanno et al., 2015; Tatavosian et al., 2018). CBX2 samples target sites differently inside condensates compared with outside condensates. CBX2 is more likely to move backward inside condensates than outside condensates, which facilitates CBX2 to revisit the same or adjacent sites repeatedly inside condensates. Intuitively, repetitive visiting of the same or adjacent binding sites would reduce the length of 3D free diffusion time and the sampling of non-specific sites. Consistent with this intuition, our experimental data demonstrate that condensates accelerate the target-search process through shortening 3D free diffusion time and reducing the number of non-specific sites sampled.
Our results uncover a novel mechanism by which the genomic occupancy level of chromatin-binding factors can be regulated by phase-separated condensates. We show that phase-separated condensates can enhance the genomic occupancy level of CBX2 by ~4-fold. Genomic occupancy is determined by the residence time and the target-search time. These properties can be modified in a non-redundant fashion in living cells. The residence time is characterized by the intrinsic properties of chromatin-binding factors and their target sites and can be modulated through post-translational modifications or protein-protein interactions, thereby affecting the genomic occupancy level. Our data demonstrate that LLPS can enhance the genomic occupancy level by reducing the target search time. As LLPS can more rapidly respond to environmental stimuli and stresses, such as pH and temperature (Banani et al., 2017; Hyman et al., 2014; Shin and Brangwynne, 2017), it may be advantageous in controlling genomic occupancy compared with modulating residence time. Further studies will be necessary to dissect the molecular links underlying the LLPS of Polycomb proteins, binding stability, target-search efficiency, and transcriptional outputs.
Nucleating of CBX2 on Chromatin for LLPS
Our results reveal that H3K27me3 is not the seed of LLPS of CBX2. Consistently, previous studies have shown that CBX2 has a very weak affinity for H3K27me3 (Bernstein et al., 2006; Kaustov et al., 2011; Tardat et al., 2015) and compacts chromatin independently of H3K27me3 (Grau et al., 2011). Our results demonstrate that knockout of RING1A/RING1B or BMI1/MEL18 has no effect on the residence time of CBX2, indicating that formation of the CBX2-PRC1 complex is not required for the nucleation of CBX2 on chromatin. This is supported by the fact that CBX2 can form condensates independently of RING1A/RING1B or BMI1/MEL18. These PRC1 subunit-lacking CBX2 condensates may mediate local compaction of chromatin, which is consistent with previous studies demonstrating that CBX2 compacts chromatin independently of other CBX2-PRC1 subunits (Grau et al., 2011; Lau et al., 2017). If the core subunits of CBX2-PRC1 are not necessary, it leaves only CBX2 as a possible source of nucleation.
Our observations indicate that CBX2 nucleates on chromatin through the AT-hook motif interacting with underlying DNA elements of chromatin. A few lines of evidence, obtained through separate methods, support our conclusion. First, deleting or mutating the AT-hook motif greatly reduces the residence time of CBX2 on chromatin in live cells; however, deleting or mutating other regions has no or minor effects on residence time. Second, CBX2 binds DNA through the AT-hook motif, which is consistent with previous studies reporting that the AT-hook motif binds DNA with nanomolar affinity (Kawaguchi et al., 2017). Third, the in vitro LLPS of CBX2 can be promoted by DNA. Finally, deleting or mutating the AT-hook motif completely prevents the LLPS of CBX2 in live cells. These studies suggest that genetic DNA sequences rather than H3K27me3 nucleate CBX2-PRC1 on chromatin for LLPS. Further studies are needed to identify the DNA sequences within the genome needed for nucleation.
A Scaffold-Adaptor-Client Model for Polycomb Organizing the Genome
PRC1 and PRC2 have been demonstrated to mediate long-range promoter-promoter or promoter-distal site interactions as well as local compaction (Eskeland et al., 2010; Francis et al., 2004; Grau et al., 2011; Isono et al., 2013; Joshi et al., 2015; Kundu et al., 2017; Lau et al., 2017; Schoenfelder et al., 2015); however, there is a lack of a model to unify previous observations. Our data suggest a scaffold-adaptor-client model by which the CBX-PRC1 complexes integrate genetic information and epigenetic modifications to organize the genome through LLPS. Our scaffold-adaptor-client phase separation model is developed on the basis of a previous scaffold-client model (Banani et al., 2016, 2017). Here, we assign CBX2-PRC1 as the scaffold, CBX7-PRC1 as the adaptor, and H3K27me3-marked chromatin as the client in mESCs. We hypothesize that CBX7-PRC1 recruits H3K27me3-marked chromatin into the established CBX2-PRC1 condensates through interactions between CBX7 and H3K27me3 and polymerization of PHC between CBX2-PRC1 and CBX7-PRC1. Our hypothesized model is supported by the following observations. First, among the three CBX-PRC1 complexes in mESCs, CBX6 does not form condensates. Thus, it is less likely that CBX6-PRC1 is the scaffold or the adaptor in mESCs. As CBX2 undergoes LLPS to form condensates and CBX7 forms condensates without undergoing LLPS in mESCs, it is plausible to assume that CBX2-PRC1 is the scaffold and CBX7-PRC1 is the adaptor. The model explains how the adaptor CBX7-PRC1 can be enriched in the CBX2-PRC1 scaffold to form condensates without undergoing LLPS. Second, CBX2-PRC1 exhibits the properties of a scaffold, as CBX2 phase separates to form condensates independently of the CBX-PRC1 subunits; however, the condensate formation of CBX-PRC1 subunits depends on CBX2 (Tatavosian et al., 2019). Finally, CBX7-PRC1 is the adaptor because (1) the CBX7 subunit interacts with H3K27me3-marked chromatin (Zhen et al., 2016), and (2) the PHC subunit can polymerize via head-to-tail interaction of the SAM domain (Kim et al., 2002). The PHC polymerization between CBX2-PRC1 and CBX7-PRC1 can bring the client (H3K27me3-marked chromatin) into the scaffold (CBX2-PRC1 condensates). Consistently, disrupting the polymerization of PHC impairs the long-range interactions of Polycomb target genes (Isono et al., 2013; Kundu et al., 2017; Wani et al., 2016).
The scaffold-adaptor-client phase separation model presented here can unify previous observations. For example, studies have reported that the long-range promoter-promoter interactions are lost in Eed–/– mESCs (Joshi et al., 2015). Our model predicts that CBX7-PRC1 cannot interact with promoters that do not have H3K27me3. Therefore, these promoters cannot be brought into the CBX2-PRC1 condensates, leading to a loss of long-range interactions. Studies have also shown that the long-range interactions are lost in Ring1b–/– mESCs (Eskeland et al., 2010; Schoenfelder et al., 2015). As RING1B is the assemblage of PRC1 (Blackledge et al., 2020; Fursova et al., 2019; Leeb and Wutz, 2007), removal of RING1B disrupts the complex formation of CBX2-PRC1 and CBX7-PRC1. Thus, CBX7 on its own cannot bring the distal regions or promoters into the CBX2 condensates. Our model is a multicomponent scaffoldadaptor-client model. It will be interesting to investigate whether and how other CBX2-PRC1 subunits regulate the LLPS of CBX2 in living cells, as intracellular LLPS is composition dependent (Riback et al., 2020). Taken together, our model can unify previous 3D genomic studies and genetic analysis and provides a novel example of LLPS organizing the genome via the integration of genetic DNA and epigenetic modifications. This novel and testable hypothesis should inspire future studies of functional and mechanistic roles of LLPS in genome organization.
STAR★METHODS
RESOURCE AVAILABILITY
Lead Contact
Further information and requests for resources and reagents should be directed to and will be fulfilled by the Lead Contact, Xiaojun Ren (xiaojun.ren@ucdenver.edu).
Materials Availability
All unique/stable reagents generated in this study are available from the Lead Contact with a completed Materials Transfer Agreement.
Data and Code Availability
Original/source data for figures in the paper is available upon request. Code is available upon request. This study did not generate datasets.
EXPERIMENTAL MODEL AND SUBJECT DETAILS
PGK12.1 mESCs (Penny et al., 1996) were provided by Dr. Neil Brockdorff (University of Oxford, UK). Cbx2–/– mESCs (Katoh-Fukui et al., 1998), Eed–/– mESCs (Endoh et al., 2008), Ring1a–/–/Ring1bfl/fl; Rosa26::CreERT2 mESCs (Endoh et al., 2008), and Mel18–/–/Bmi1–/– mESCs (Elderkin et al., 2007) were provided by Haruhiko Koseki (RIKEN Center for Integrative Medical Sciences, Japan). HEK293T cells were provided by Dr. Tom Kerppola (University of Michigan, Ann Arbor). PGK12.1 mESCs expressing HT-CBX4, HT-CBX6, HT-CBX7, HT-CBX8, or HT-NLS were generated previously (Zhen et al., 2016). HT-CBX2/Eed–/– mESCs, HT-CBX2/Ring1a–/–/Ring1bfl/fl; Rosa26::CreERT2 mESCs and HT-CBX2/Mel18–/–/Bmi1–/– mESCs were reported previously (Tatavosian et al., 2019). HT-CBX2 variants and HT-PRC1 subunits were stably integrated into the genome of PGK12.1 mESCs as noted in the key resource table.
KEY RESOURCES TABLE
| REAGENT or RESOURCE | SOURCE | IDENTIFIER |
|---|---|---|
| Antibodies | ||
| Anti-HaloTag® pAb | Promega | Cat#G9281 |
| Anti-RING1B mAb | MBL Life Science | Cat#D139–3 |
| Goat anti-Mouse IgG (H+L) Highly Cross-Adsorbed Secondary Antibody, Alexa Fluor 488 | Life Technologies | Cat#A-11029; RRID: AB_2534088 |
| Goat anti-Rabbit IgG (H+L) Cross-Adsorbed Secondary Antibody, Alexa Fluor 568 | Life Technologies | Cat#A11011; RRID: AB_143157 |
| Anti-PHC1 antibody (mAb) | Active Motif | Cat#39723; RRID: AB_2713961 |
| Bacterial and Virus Strains | ||
| DH5α | Life Technologies | Cat#18265–017 |
| Rosetta 2 (pLysS) host strains | Novagen | Cat#71403 |
| Chemicals, Peptides, and Recombinant Proteins | ||
| ANTI-FLAG® M2 affinity gel | Millipore | Cat#A2220 |
| Doxycycline hyclate | Sigma Life Science | Cat#D9891 |
| Fetal Bovine Serum (FBS) | VWR | Cat#97068–085 |
| FLAG® Peptide | Sigma-Aldrich | Cat#F3290 |
| FluoroBrite DMEM Live-cell Imaging Medium | Life Technologies | Cat#A1896701 |
| GSH-Sepharose 4B beads | GE Healthcare | Cat#17–--01 |
| HaloTag® TMR Ligand | Promega | Cat#G8251 |
| IPTG | IBI Scientific | Cat#IB02105 |
| Janelia Fluor® 549 HaloTag® Ligand | Promega | Cat#GA1110 |
| Janelia Fluor® 646 HaloTag® Ligand | Promega | Cat#GA1120 |
| Leukemia Inhibitor Factor | Purified in lab | N/A |
| Polyethylene glycol (PEG) | Rigauku Reagents | Cat#1008062 |
| SYBR Gold | Invitrogen | Cat#S11494 |
| Critical Commercial Assays | ||
| Amicon Ultra Centrifugal Filter Units | Merck Millipore | Cat#UFC501024 |
| Bradford Assay | Thermo Scientific | Cat#1856209 |
| CoverWell perfusion chamber gasket | Thermo Scientific | Cat#C18139 |
| Novex 4–20% Tris-Glycine Protein gel | Life Technologies | Cat#EC6026BOX |
| NuPAGE 4–12% Bis-Tris Protein Gel | Invitrogen | Cat#NP0321BOX |
| Spectra/Por 1 Dialysis Membrane | Spectrum Labs | Cat#132645T |
| Experimental Models: Cell Lines | ||
| Human: HEK293T | Tatavosian et al., 2019 | N/A |
| Mouse: PGK12.1: Cbx2−/− | Katoh-Fukui et al., 1998 | N/A |
| Mouse: PGK12.1: Eed−/− | Endoh et al., 2008 | N/A |
| Mouse: PGK12.1: HT-CBX2/Eed−/− | Tatavosian et al., 2019 | N/A |
| Mouse: PGK12.1: HT-CBX2/Mel18−/−/Bm1i−/− | Tatavosian et al., 2019 | N/A |
| Mouse: PGK12.1: HT-CBX2 | Zhen et al., 2016 | N/A |
| Mouse: PGK12.1: HT-CBX2/Ring1a−/−/Ring1bfl/fl; Rosa26::CreERT2 | Tatavosian et al., 2019 | N/A |
| Mouse: PGK12.1: HT-CBX21−192 | This study | N/A |
| Mouse: PGK12.1: HT-CBX21−281 | This study | N/A |
| Mouse: PGK12.1: HT-CBX21−498 | This study | N/A |
| Mouse: PGK12.1: HT-CBX265−532 | This study | N/A |
| Mouse: PGK12.1: HT-CBX289−532 | This study | N/A |
| Mouse: PGK12.1: HT-CBX2ATLm | This study | N/A |
| Mouse: PGK12.1: HT-CBX2ATL-P2A | This study | N/A |
| Mouse: PGK12.1: HT-CBX2ATm | This study | N/A |
| Mouse: PGK12.1: HT-CBX2AT-P2A | This study | N/A |
| Mouse: PGK12.1: HT-CBX2CA-P2A | This study | N/A |
| Mouse: PGK12.1: HT-CBX2cd | This study | N/A |
| Mouse: PGK12.1: HT-CBX2hncr-P2A | This study | N/A |
| Mouse: PGK12.1: HT-CBX2HPCR-P2A | This study | N/A |
| Mouse: PGK12.1: HT-CBX2SRR-S2A | This study | N/A |
| Mouse: PGK12.1: HT-CBX2SRR-S2E | This study | N/A |
| Mouse: PGK12.1: HT-CBX4 | Zhen et al., 2016 | N/A |
| Mouse: PGK12.1: HT-CBX6 | Zhen et al., 2016 | N/A |
| Mouse: PGK12.1: HT-CBX7 | Zhen et al., 2016 | N/A |
| Mouse: PGK12.1: HT-CBX8 | Zhen et al., 2016 | N/A |
| Mouse: PGK12.1: HT-MEL18 | This study | N/A |
| Mouse: PGK12.1: HT-NLS | Zhen et al., 2016 | N/A |
| Mouse: PGK12.1: HT-PHC1 | This study | N/A |
| Mouse: PGK12.1: HT-RING1B | This study | N/A |
| Mouse: Mel18−/−/Bmi1−/− | Elderkin et al., 2007 | N/A |
| Mouse: PGK12.1 | Penny et al., 1996 | N/A |
| Mouse: Ring1a−/−/Ring1bfl/fl; Rosa26::CreERT2 | Endoh et al., 2008 | N/A |
| Oligonucleotides | ||
| Major Satellite DNA: | IDT | N/A |
| 5′-GGACCTGGAATATGGCG | ||
| AGAAAACTGAAAATCACGG | ||
| AAAATGAGAAATACACACTTTAG-3′ | ||
| AT-mutated satellite DNA: | IDT | N/A |
| 5′-GGACCTGGAGTCTGGCG | ||
| AGAGAGCTGAGACTCACGG | ||
| ACACTGAGAGACACACACCTGAG-3′ | ||
| Recombinant DNA | ||
| Plasmid: pGEX-6P-1-GST-CBX2AT-P2A-FLAG | This study | N/A |
| Plasmid: pGEX-6P-1-GST-CBX2-FLAG | Tatavosian et al., 2019 | N/A |
| Plasmid: pMD2.G | Zhen et al., 2016 | N/A |
| Plasmid: pSPAX2 | Zhen et al., 2016 | N/A |
| Plasmid: pTRIPZ (M1)-CERULEAN-MEL18 | Zhen et al., 2016 | N/A |
| Plasmid: pTRIPZ (M1)-CERULEAN-PHC1 | Zhen et al., 2016 | N/A |
| Plasmid: pTRIPZ (M1)-HT-CBX2 | Zhen et al., 2016 | N/A |
| Plasmid: pTRIPZ (M1)-HT-CBX21−192 | This study | N/A |
| Plasmid: pTRIPZ (M1)-HT-CBX21−281 | This study | N/A |
| Plasmid: pTRIPZ (M1)-HT-CBX21−498 | This study | N/A |
| Plasmid: pTRIPZ (M1)-HT-CBX265−532 | This study | N/A |
| Plasmid: pTRIPZ (M1)-HT-CBX289−532 | This study | N/A |
| Plasmid: pTRIPZ (M1)-HT-CBX2ATLm | This study | N/A |
| Plasmid: pTRIPZ (M1)-HT-CBX2ATL-P2A | This study | N/A |
| Plasmid: pTRIPZ (M1)-HT-CBX2ATm | This study | N/A |
| Plasmid: pTRIPZ (M1)-HT-CBX2AT-P2A | This study | N/A |
| Plasmid: pTRIPZ (M1)-HT-CBX2CA-P2A | This study | N/A |
| Plasmid: pTRIPZ (M1)-HT-CBX2cd | This study | N/A |
| Plasmid: pTRIPZ (M1)-HT-CBX2hncr-P2A | This study | N/A |
| Plasmid: pTRIPZ (M1)-HT-CBX2HPCR-P2A | This study | N/A |
| Plasmid: pTRIPZ (M1)-HT-CBX2SRR-S2A | This study | N/A |
| Plasmid: pTRIPZ (M1)-HT-CBX2SRR-S2E | This study | N/A |
| Plasmid: pTRIPZ (M1)-HT-MEL18 | This study | N/A |
| Plasmid: pTRIPZ (M1)-HT-PHC1 | This study | N/A |
| Plasmid: pTRIPZ (M1)-HT-RING1B | This study | N/A |
| Plasmid: pTRIPZ (M1)-YFP-RING1B | Zhen et al., 2014 | N/A |
| Protein: pGEX-6P-1-GST-CBX2-FLAG | This study | N/A |
| Protein: pGEX-6P-1-GST-CBX2AT-P2A-FLAG | This study | N/A |
| Software and Algorithms | ||
| Adobe Illustrator | Adobe Inc | N/A |
| Adobe Photoshop | Adobe Inc | N/A |
| ImageJ | NIH | https://imagej.nih.gov/ |
| MATLAB | MathWorks | N/A |
| OriginLab | OriginLab Corporation | N/A |
| SlideBook 6.0 Software | 3i | N/A |
| Spot-On | Hansen et al., 2018 | N/A |
| U-track | Jaqaman et al., 2008 | https://github.com/DanuserLab/u-track |
| Other | ||
| Alpha Pan-Apochromat 100 × /1.40 Oil immersion Objective | Zeiss, Germany | N/A |
| Alpha Pan-Apochromat 100 × /1.46 Oil immersion Objective | Zeiss, Germany | N/A |
| Axio Observer D1 Microscope | Zeiss, Germany | N/A |
| Brightline® single-band laser filter set (Semrock; excitation filter: FF02–482/18–25, emission filter: FF01–525/45–25, and dichroic mirror: Di02-R488–25 × 36) | Semrock | N/A |
| Brightline® single-band laser filter set (Semrock; excitation filter: FF01–561/14, emission filter: FF01–609/54, and dichroic mirror: Di02-R561–25 × 36) | Semrock | N/A |
| Brightline® single-band laser filter set (Semrock; excitation filter: BLP01–635R-25, emission filter: FF01–640/14–25, and dichroic mirror: Di02-R635–25 × 36) | Semrock | N/A |
| ChemiDoc XRS+ System | Bio-Rad | N/A |
| Evolve 512 × 512 EMCCD camera | Photometrics; Tuscon, AZ | Cat#1708265 |
| Single Channel Temperature Controller | Warner Instruments | Cat#TC-324 |
| Solid-State LaserStack | 3i | N/A |
| Sonicator | Vibra-cell | VCX130 |
METHOD DETAILS
Maintenance of Mammalian Cells
PGK12.1 (wild-type) mESCs were grown in culture medium composed of: Dulbecco’s Modified Eagle Medium (DMEM; Sigma Aldrich; D5796) supplemented with 15% Fetal Bovine Serum (FBS; VWR; 97068–085), 80.0 μm β-mercaptoethanol (GIBCO; 31350–010), 2.0 mM L-Glutamine (Sigma; G7513), 0.1 mg/mL Penicillin-Streptomycin (GIBCO; 15140–122), 1 3 MEM Non-Essential Amino Acids (GIBCO; 11140–050), 10.0 mg/mL Ciprofloxacin (Sigma Life Science; 17850), and 103 units/mL Leukemia Inhibitor Factor (purified in lab) at 37°C in 5% CO2. HEK293T cells were grown in MEF culture medium composed of: DMEM supplemented with 10% FBS, 80.0 μm β-mercaptoethanol, 2.0 mM L-Glutamine, 0.1 mg/mL Penicillin-Streptomycin, 10.0 μg/mL Ciprofloxacin at 37°C in 5% CO2.
The Ring1b gene in Ring1a–/–/Ring1bfl/fl; Rosa26::CreERT2 mESCs was deleted by administering 1.0 μm 4-Hydroxytamoxifen (Sigma Aldrich; H7904) for 2 days as described previously (Tatavosian et al., 2019; Zhen et al., 2014; Zhen et al., 2016). Subsequently, Ring1a–/–/Ring1bfl/fl; Rosa26::CreERT2 mESCs were referred to as Ring1a–/–/Ring1b–/– mESCs for simplicity.
Plasmids
The pTRIPZ (M1)-HT-CBX2 plasmid has been described previously (Tatavosian et al., 2019; Zhen et al., 2016). To express CBX2 variants fused with HaloTag in mESCs, the Cbx2 sequence in pTRIPZ (M1)-HT-CBX2 was substituted with the Cbx2 variant sequence as follows: (1) CBX2ATm, substitution of PRG with AAA; (2) CBX2ATLm, substitution of PRG with AAA; (3) CBX2SRR-S2A, substitution of SKSKSSSSSSSSTSSSSSS with SKSKASASASASTASASAA; (4) CBX2SRR-S2E, substitution of SKSKSSSSSSSSTSSSSSS with SKSKESESESESTESESEE; (5) CBX2CD, amino acid 1–65 of CBX2; (6) CBX265−532, deletion of the CD domain (amino acid 1–65); (7) CBX21−498, deletion of Cbox region (amino acid 498–532); (8) CBX2CA-P2A, substitution of KEVQNRKR with AEVQNAAA; (9) CBX2AT-P2A, substitution of KRPRGRPRK with IAPAGAPAA; (10) CBX289−532, deletion of CD and AT-hook region (amino acid 1–89); (11) CBX2ATL-P2A, substitution of RGPRGR with AGPAGA; (12) CBX21−192, deletion of C terminus (amino acid 192–532); (13) CBX21−281, deletion of C terminus (amino acid 281–532); (14) CBX2HPCR-P2A, substitution of RKKRGRK with AAAAGAA; and (15) CBX2HNCR-N2A, substitution of DEEDD with AAAAA.
To express HT-RING1B in mESCs, Yfp was replaced with HaloTag in pTRIPZ (M1)-YFP-RING1B (Zhen et al., 2014). To express HT-MEL18 and HT-PHC1 in mESCs, Cerulean was replaced with HaloTag in pTRIPZ (M1)-CERULEAN-MEL18 (Zhen et al., 2014) and pTRIPZ (M1)-CERULEAN-PHC1 (Zhen et al., 2014), respectively.
The pGEX-6P-1-GST-CBX2-FLAG plasmid has been described previously (Tatavosian et al., 2019). To generate the recombinant protein CBX2AT-P2A, the Cbx2AT-P2A sequence was amplified from the pTRIPZ (M1)-HT-CBX2AT-P2A plasmid. Then, Cbx2AT-P2A was used to replace the Cbx2 sequence in the pGEX-6P-1-GST-CBX2-FLAG plasmid to generate pGEX-6P-1-GST-CBX2AT-P2A -FLAG.
Establishing Cell Lines
HEK293T cells were plated in a 100-mm dish to reach 90%–100% confluency in the next 24 h. Cells were transfected by calcium phosphate precipitation with 21.0 μg pSPAX2, 10.5 μg pMD2.G, 21.0 μg pTRIPZ (M) vector containing fusion gene, and 250.0 μm calcium chloride (Sigma-Aldrich; C7902). 12 h after transfection, cells were washed once with MEF culture medium and then incubated with MEF culture medium for 48 h. Virus-containing medium was harvested and centrifuged at 1,000 × g to remove cell debris. A single-cell suspension of PGK12.1 mESCs was mixed with the harvested medium supplemented with 8.0 μg/mL polybrene (Sigma-Aldrich; H9268) and then incubated at 37°C in 5% CO2 with mixing every 2 h. After 5–8 h, cells were plated dropwise into a 100-μm dish. 12 h after transduction, medium was replaced with 10.0 mL fresh culture medium. 48–72 h after transduction, cells were cultured in fresh culture medium containing 1.0–2.0 μg/mL puromycin (Sigma-Aldrich; P8833). Cells expressing fusion gene were selected with puromycin for at least 1 week before experimentation.
Generating Recombinant Proteins
To generate and purify recombinant CBX2 and its variant CBX2AT-P2A, the pGEX-6P-1-GST-CBX2-FLAG vector containing the Cbx2 fusion gene was first transformed into Rosetta 2 (pLysS) host strains (Novagen; 71403). A single colony was used to inoculate 5.0 mL of LB medium (Molecular Biologicals International, Inc.; MBPE-1050) containing 100.0 μg/mL ampicillin (Sigma; A9518) while shaking overnight at 250–300 rpm, 37°C. The next morning, 1.0 L of fresh LB was seeded with 1.0 mL of overnight culture. After shaking at 37°C for 5–6 h, protein expression was induced overnight at 18°C in the presence of 1.0 mM IPTG (IBI Scientific; IB02105) with continued shaking. After centrifugation at 4,000 × g for 20 min at 4°C to harvest cells, the supernatant was discarded, and cell pellets were then resuspended in 25.0 mL lysis buffer (50.0 mM HEPES pH 7.5 (Sigma Life Science; H4034), 1.6 M KCl (Sigma Life Science; P9541), 0.5 mM MgCl2 (Sigma Life Science; M8266), 0.5 mM EDTA (Sigma-Aldrich; EDS), 1.0 mM DTT (ITW Reagents; A2948), 1.0 mg/mL lysozyme (Sigma; L6876), 20.0 μg/mL RNase A (Invitrogen; 12091–021), protease inhibitor (Sigma-Aldrich; S8830), and 0.2 mM PMSF (Sigma-Aldrich; 93482)) in a 50-mL Falcon tube.
Liquid nitrogen and an ice-water bath were used to completely freeze and thaw cells three times, and cells were then disrupted by sonication (VCX130, Vibra-Cell) for 5 min at 65% amplitude, using 15 s on and 45 s off cycles. 10% NP-40 was added to the solution for a final concentration of 0.1%, and the solution was rocked gently for 30 min at 4°C to increase the solubility of the protein. Cell debris was pelleted by centrifugation at 10,000 × g for 20 min at 4°C, and the supernatant was transferred to new Falcon tube. In order to precipitate nucleic acids, 10% polyethylenimine (PEI; Sigma-Aldrich; P3143) in 20.0 μm HEPES pH 7.5 was added dropwise to the lysate while being slowly vortexed to achieve a final concentration of 0.3%. The mixture was incubated while rocking for 30 min at 4°C and then centrifugated at 20,000 × g for 20 min.
The supernatant was transferred to a new tube with 0.5 mL of GSH-Sepharose 4B beads (GE Healthcare; 17-0756-01) pre-washed with PBS pH 7.4 (Sigma-Aldrich; D8537) and incubated on the rocker for 1 h at 4°C. The sample was then centrifuged at 500 × g for 3 min to collect the beads. To prevent debris from limiting solution flow through column, the beads were washed with washing buffer (20.0 mM HEPES pH 7.5, 0.5 M KCl, 0.2 mM EDTA, 1.0 mM DTT, and 0.2 mM PMSF) before being collected again by centrifugation at 500 × g for 3 min and then transferred to a column. Protein-bead complex was then washed in the column two more times using washing buffer flowing by gravity. To elute recombinant protein, protein-bead complex was incubated with 0.5 mL of 80.0 mM reduced L-glutathione at pH 8.0 (Sigma-Aldrich; G4251) in washing buffer for 10 min and eluted from the GSH beads three times.
The collected protein was rocked with 0.1 mL pre-washed anti-FLAG-M2 affinity gel beads (Sigma; A2220) overnight at 4°C. The beads were collected by centrifugation at 500 × g for 3 min at 4°C and washed three times using washing buffer supplemented with 1.0 M KCl. To elute, the recombinant protein was incubated with 0.5 mL Flag Elution Buffer (0.4 mg/mL Flag Peptides (Sigma-Aldrich; F3290) in washing buffer supplemented with 1.0 M KCl) for 1 h on the rocker at 4°C and then centrifuged at 2,000 × g for 2 min at 4°C. The supernatant (FLAG-tagged purified protein) was transferred into a new tube and centrifuged again at 17,000 × g for 15 min at 4°C before being transferred to a final tube.
Recombinant protein underwent dialysis in a Spectra/Por 1 Dialysis Membrane (Spectrum Labs; 132645T) placed in 1.0 L dialysis buffer (PBS pH 7.4, 1.0 M KCl, and 0.1 mM DTT) for 72 h while changing the dialysis buffer. The purified protein was loaded into a 0.5 mL Amicon Ultra Centrifugal Filter Unit (Merck Millipore; UFC501024) column filter and concentrated by centrifuging at 14,000 × g for 30 min at 4°C. The column was then inverted into a new centrifuge tube and centrifuged at 1,000 3 g for 2 min at 4°C to elute the sample. Recombinant protein was resolved by NuPAGE 4%–12% Bis-Tris Protein Gel (Invitrogen, NP0321BOX) and stained using Bio-Safe Coomassie G-250 Stain (Bio-Rad, 161–0786) to determine its purity and identity. Protein concentration was quantified by the Bradford assay (Thermo Scientific; 1856209). Proteins were aliquoted and stored in −80°C.
Electrophoretic Mobility Shift Assay
Oligonucleotides of major satellite DNA and AT-mutated satellite DNA (IDT; refer to key resource table) were annealed in buffer (50.0 mM Tris-HCl and 50.0 mM NaCl (Sigma; S3014)) at 95°C for 10 min covered in foil. Purified recombinant CBX2 protein was added to EMSA binding buffer (20.0 mM HEPES pH 7.6, 0.1 M KCl, 2.0 mM EDTA pH 8.0, 0.01% NP-40, 1.0 mM DTT, and 0.1 mg/mL bovine serum albumin (BSA; Sigma; A7906)) supplied with 0.5 μm major satellite DNA. The reaction mixture was incubated for 20 min at room temperature and then resolved by using Novex 4%–20% Tris-Glycine Protein Gel (Life Technologies; EC6026BOX). Gel was run for 2 h on ice and then stained with SYBR Gold (Invitrogen; S11494) in TAE Buffer for 30–40 min while shaking gently. ChemiDoc XRS+ System (Bio-Rad; 1708265) was used to image the gel. SYBR Gold was visualized at 300 nm ultraviolet light under optimal exposure time between 0.5–1.0 s.
Optical Setup for Epifluorescence
An Axio Observer D1 Microscope (Zeiss, Germany) equipped with an Alpha Plan-Apochromat 100 × /1.40 Oil immersion Objective (Zeiss, Germany) and an Evolve 512 × 512 EMCCD camera with pixel size 16.0 μm (Photometrics; Tucson, AZ) was used for in vitro condensate formation, immunofluorescence, and live-cell imaging. A Brightline® single-band laser filter set (Semrock; excitation filter: FF01–561/14, emission filter: FF01–609/54, and dichroic mirror: Di02-R561–25 × 36) was used for the excitation and emission of HaloTag® TMR ligand (Promega; G8251) or Alexa Fluor 568-labeled goat anti-rabbit (Life Technologies; A11011). A Brightline® single-band laser filter set (Semrock; excitation filter: FF02–482/18–25, emission filter: FF01–525/45–25, and dichroic mirror: Di02-R488–25 × 36) was used for the excitation and emission of Alexa Fluor 488-labeled goat anti-mouse (Life Technologies; A11029). The microscope and EMCCD camera were controlled by the computer via SlideBook 6.0 software (3i). Images were processed and presented using Adobe PhotoShop (Adobe Inc).
In vitro Condensate Formation
Purified recombinant CBX2 protein was diluted using dialysis buffer to desired concentrations of 25.0 μm, 12.5 μm, 6.3 μm, and 3.1 μm. 1.0 μL of diluted protein was added to 9.0 μL of reaction mixture A (50.0 mM Tris-HCl pH 7.4, 100 mM NaCl, 10% Glycerol (Sigma-Aldrich; G5516), and 0.1 μm DTT), of reaction mixture B (50.0 μm Tris-HCl pH 7.4, 100 μm NaCl, 10% Glycerol, 0.1 mM DTT, 20% PEG (Rigaku; 1008062)), of reaction mixture C (50.0 mM Tris-HCl pH 7.4, 100 mM NaCl, 10% Glycerol, 0.1 mM DTT, and 4.0 μm major satellite DNA), and of reaction mixture D (50.0 mM Tris-HCl pH 7.4, 100 mM NaCl, 10% Glycerol, 0.1 μm DTT, 20% PEG, and 4.0 μm major satellite DNA), respectively. The mixture was incubated at room temperature for 20 min. The 10.0 mL reaction sample was then loaded into a CoverWell perfusion chamber gasket (Thermo Fisher Scientific; C18139) adhered to a clean coverslip and then incubated for 5 min to allow the condensates to settle down to the surface. DIC images of condensates were acquired by using an Axio Observer D1 Microscope as described in “Optical Setup for Epifluorescence and Brightfield Imaging.” The number of condensates per frame and the size of each were quantified by using ImageJ (NIH; https://imagej.nih.gov/).
Immunofluorescence
HT-CBX2/PGK12.1 mESCs were cultured in the absence of or in the presence of 1.0 μg/mL doxycycline (Sigma Life Sciences; D9891) for 72 h. Cells were then seeded to glass coverslips and cultured for an additional 24 h. Only cells cultured with 1.0 μg/mL doxycycline were incubated with 100.0 nM HaloTag® TMR ligand for 15 min. Following dye incubation, cells were washed once with culture medium and then fresh culture medium was added to allow 30 min of recovery time at 37°C in 5% CO2. This process was repeated for a second 30 min recovery period. Cells both with or without doxycycline were then washed with PBS pH 7.4 once and fixed with 1% paraformaldehyde (Sigma; P6148) for 10 min. The fixed cells were permeabilized with 0.2% Triton X-100 (Sigma; T9284) for 10 min and then washed with PBS pH 7.4. Permeabilized cells were then treated with blocking buffer (basic blocking buffer (10.0 mM PBS pH 7.4, 0.1% Triton X-100, and 0.05% Tween 20 (Sigma; P7949)) supplemented with 3% goat serum (Sigma; G6767) and 3% BSA) for 1 h followed by two washes using basic blocking buffer.
Primary antibodies, anti-PHC1 (Active Motif; 39723; 1:100 dilution), anti-RING1B (MBL; D139–3; 1:100 dilution), and anti-HaloTag (Promega, G9281; 1:100 dilution) were diluted with blocking buffer. Cells cultured in the absence of doxycycline were incubated with a solution of anti-PHC1+anti-HaloTag or anti-RING1B+anti-HaloTag. Cells cultured in the presence of 1.0 μg/mL doxycycline were incubated with a solution of anti-PHC1 or anti-RING1B. After 2 h incubation with primary antibodies at room temperature, cells were washed with PBS pH 7.4 three times followed by washing with basic blocking buffer twice, each time gently shaking for 5 min. Secondary antibodies, Alexa Fluor 488-labeled goat anti-mouse (1:1000 dilution) and Alexa Fluor 568-labeled goat anti-rabbit (1:1000 dilution) were diluted with blocking buffer. Cells cultured in the absence of doxycycline were incubated with a solution of Alexa 488+Alexa 568. Cells cultured in the presence of 1.0 μg/mL doxycycline were incubated with a solution Alexa 488. After staining the cells with secondary antibodies for 2 h at room temperature, the cells were washed with PBS pH 7.4 three times then incubated in basic blocking buffer twice as previously described. Cells were then prepared for imaging by mounting the coverslips onto slides using ProLong Antifade reagents (Life Technologies; P7481). Fluorescent images were acquired using an Axio Observer D1 Microscope as described in “Optical Setup for Epifluorescence and Brightfield Imaging.”
Live-cell Imaging of Condensates
Transgenic mESCs harboring HT-Cbx2 or its variants were cultured with varying doxycycline concentrations (0.0 μg/mL, 0.1 μg/mL, 0.4 μg/mL, and 1.0 μg/mL) for 72 h at 37°C in 5% CO2. Cells were then seeded to gelatin-coated cover-glass bottom dishes and cultured for an additional 24 h at 37 C in 5% CO2. Cells were then incubated with 20.0 nM HaloTag® TMR ligand for 15 min at 37°C in 5% CO2. Following dye incubation, cells were washed once with culture medium and then fresh culture medium was added to allow 30 min of recovery time at 37°C in 5% CO2. This process was repeated for a second 30 min recovery period. After recovery, cells were washed once with PBS pH 7.4 then FluoroBrite DMEM live-cell imaging medium (Life Technologies; A1896701) supplemented with 10% FBS was added to the imaging plate. Each dish was maintained at 37°C using a single channel temperature controller (TC-324, Warner Instruments) and imaged for less than 90 min. Live-cell images were acquired using an Axio Observer D1 Microscope as described in “Optical Setup for Epifluorescence and Brightfield Imaging.” Visible condensates in cells were quantified using ImageJ.
Optical Setup for Live-cell SMT
An Axio Observer D1 Microscope equipped with an Alpha Plan-Apochromat 100 × /1.46 Oil immersion Objective (Zeiss, Germany) and an Evolve 512 × 512 EMCCD camera with pixel size 16.0 μm was used in live-cell SMT experiments. For tracking experiments, an additional 2.5 × magnification was equipped on the emission pathway. A Solid-state LaserStack (3i) was used to excite Janelia Fluor® 549 HaloTag® Ligand (Promega; GA1110) at 552 nm, and Janelia Fluor® 646 HaloTag® Ligand (Promega; GA1120) at 640 nm, respectively. To avoid stray-light reflection and reduce background from cell auto-fluorescence, the HILO illumination model was used. A Brightline® single-band laser filter set (Semrock; excitation filter: FF01–561/14, emission filter: FF01–609/54, and dichroic mirror: Di02-R561–25 3 36) was used for the excitation and emission spectra of JF549 and HaloTag® TMR ligand. A Brightline® single-band laser filter set (Semrock; excitation filter: BLP01–635R-25, emission filter: FF01–640/14–25, and dichroic mirror: Di02-R635–25 3 36) for the excitation and emission spectra of JF646. To filter the excitation wavelength, a TIRF laser microscope cube (3i) was used. The microscope and EMCCD camera were controlled by the computer via SlideBook 6.0 software.
Live-cell SMT
Over 3 days, transgenic mESCs harboring HT-Cbx2 or its variants were cultured in the absence or the presence of 0.1 μg/mL doxycycline, and then seeded to gelatin-coated cover-glass bottom dishes. The cells were cultured for an additional 24 h at 37°C in 5% CO2. To obtain 5–20 labeled molecules per frame, cells were incubated with a range of 10.0–50.0 pM JF549 HaloTag® Ligand for 15 min at 37°C in 5% CO2. The cells were then washed and incubated in fresh culture medium for 30 min at 37°C in 5% CO2. After recovery, cells were washed once with PBS pH 7.4 and then FluoroBrite DMEM live-cell imaging medium supplemented with 10% FBS was added into the imaging plate. A single channel temperature controller was used to maintain a constant temperature of 37°C during the 90 min of imaging. Live-cell time lapses were acquired using an Axio Observer D1 Microscope as described in “Optical Setup for Live-cell Single-Molecule Tracking.” Below are the instrumental parameters controlled by SlideBook 6.0 software used in this study:
| Conditions | Population | Residence Time |
|---|---|---|
| Intensification | 200–700 | 500–700 |
| Number of frames | 100 | 400 |
| Dark time (ms) | 0 or 20 | 170 |
| Exposure time (ms) | 30 or 10 | 30 |
| Laser power (mW) | 7.5 | 2.25 |
| TIRF angle | 6.65–6.80 | 6.65–6.80 |
Live-cell SMT of CBX2 in Condensates
HT-CBX2/PGK12.1 mESCs were cultured with 0.4 μg/mL or 1.0 μg/mL doxycycline for 3 days. The cells were seeded to gelatincovered cover-glass bottom dish and then cultured for an additional 24 h at 37°C in 5% CO2. To obtain 5–20 labeled molecules per frame for single-molecule tracking, cells were incubated with 0.3 nM JF646 HaloTag® Ligand for 15 min at 37°C in 5% CO2 and then incubated with 20.0 nM HaloTag® TMR Ligand for 10 min at 37°C in 5% CO2. Following dye incubation, cells were washed once with culture medium and then fresh culture medium was added to allow 30 min of recovery time at 37°C in 5% CO2. This process was repeated for a second 30 min recovery period. Next, cells were washed once with PBS pH 7.4, then FluoroBrite DMEM live-cell imaging medium supplemented with 10% FBS was added to the imaging plate. Each dish was maintained at 37°C using a single channel temperature controller and imaged for less than 90 min. A live-cell image of HT-CBX2 condensates was first taken using the excitation and emission spectra of HaloTag® TMR Ligand to mark distribution of HT-CBX2. Then live-cell single-molecule tracking of HT-CBX2 was acquired using the excitation and emission spectra of JF646 HaloTag® Ligand followed by another live-cell image of HT-CBX2 condensates. Live-cell images and time lapses were acquired using an Axio Observer D1 Microscope as described in “Optical Setup for Live-cell Single-Molecule Tracking.” Below are the instrumental parameters controlled by SlideBook 6.0 software used in this study for live-cell single-molecule tracking:
| Conditions | Population |
|---|---|
| Intensification | 300 |
| Number of frames | 50 |
| Dark time (ms) | 0 |
| Exposure time (ms) | 30 |
| Laser power (mW) | 30 |
| TIRF angle | 6.65–6.80 |
Single-Molecule Localization and Tracking
To track and link single particles, U-track algorithms (Jaqaman et al., 2008) were applied in MATLAB (MathWorks) and are listed below:
| Parameters: | ||
|---|---|---|
| Step 1: Detection | Gaussian Mixture-Model Fitting | Gaussian Standard Deviation = 1.7 pixels |
| Camera Bit Depth: 16 | ||
| Local Maxima Detection: | ||
| Alpha-value for Comparison with Local Background = 0.05 | ||
| Do Not Check “Use Rolling Window Time-Averaging” | ||
| Do Not Check “Use Absolute Background” | ||
| Gaussian Fitting at Local Maxima: | ||
| Check “Iterate to Estimate Gaussian Standard Deviation” | ||
| Maximum Number of Iterations = 10 | ||
| Check “Do Iterative Gaussian Mixture-Model Fitting” | ||
| Alpha values: | ||
| Residuals = 0.05 Distance = 0.05 | ||
| Amplitude = 0.05 Final = 0 | ||
| Input and Output: | ||
| Step 2: Tracking | Tracking Parameters | Parameters: |
| Problem Dimensionality = 2 | ||
| Maximum Gap to Close = 5 Frames for Population or 1 Frames for Residence | ||
| Maximum Length of Track Segments from First Step = 1 Frame | ||
| Check “Do segment merging” | ||
| Check “Do segment splitting” | ||
| Do Not Check “ Plot histogram of gap lengths after gap closing” | ||
| Check “Show calculation progress in command line” | ||
| Do Not Check “Export tracking result to matrix format” | ||
| Cost Functions: | ||
| Step 1: frame-to-frame linking: | ||
| Check “Allow direct motion position propagation” | ||
| Check “Allow instantaneous direction reversal” | ||
| Brownian Search Radius (in pixels): | ||
| Lower Bound = 1 | ||
| Upper Bound = 20 for Population or 10 for Residence | ||
| Multiplication Factor for Brownian Search Radius Calculation = 3 | ||
| Check “Use nearest neighbor distance to expand Brownian search radius” | ||
| Number of Frames for Nearest Neighbor Distance Calculation = 20 for Population or 10 for Residence. | ||
| Do Not Check “Plot histogram of linking distances” | ||
| Step 2: gap closing, merging and splitting: | ||
| Brownian + Directed motion models | ||
| Brownian Search Radius (in pixels): | ||
| Lower Bound = 1 | ||
| Upper Bound = 20 for Population or 10 for Residence | ||
| Multiplication Factor for Brownian Search Radius Calculation = 3 | ||
| Check “Use nearest neighbor distance to expand Brownian search radius” | ||
| Number of Frames for Nearest Neighbor Distance Calculation = 20 for Population and 10 for Residence | ||
| How to expand the Brownian search radius with gap length: | ||
| Scaling Power in Fast Expansion Phase = 0.5 | ||
| Scaling Power in slow Expansion Phase = 0.01 | ||
| Gap length to transition from Fast to Slow Expansion = 5 for Population or 1 for Residence | ||
| Penalty for Increasing Gap Length = 1.5 | ||
| Check “In merging and splitting, consider ratio of intensities before and after merge/split: | ||
| Ratio of Intensity: Min Allowed = 0.5 Max Allowed = 2 | ||
| Leave it Blank “Value of search Radius Lower Bound for Merging/Splitting (in pixels) ” | ||
| Check “Allow direct motion position propagation” | ||
| Check “Allow instantaneous direction reversal” | ||
| Minimum Track Segment Lifetime for Classification as Linear or Random (in frames) = 5 | ||
| Multiplication Factor for Linear Search Radius Calculation = 3 | ||
| How to scale the linear motion search radius with time: | ||
| Scaling Power in Fast Expansion Phase = 0.5 | ||
| Scaling Power in Slow Expansion Phase = 0.01 | ||
| Gap length to transition from Fast to Slow Expansion = 5 for Population or 1 for Residence | ||
| Maximum Angle Between Linear Track Segments (in degree) = 30 | ||
| Kalman Filter Functions | ||
| Kalman functions = Brownian + Directed motion models | ||
| Parameters: | ||
| Do Not Check “Initial velocity estimate (in pixels/frame) ” | ||
| Do Not Check “Reference point for initial velocity estimate (in pixels) ” | ||
| Check “None of the two above” | ||
| Step 3: Track analysis | Motion Analysis | Motion analysis parameters: |
| Problem Dimensionality = 2 | ||
| Check “Check and analyze asymmetric tracks” | ||
| Alpha value for asymmetry determination = 0.1 | ||
| Alpha value for moment scaling spectrum analysis = 0.05 | ||
| Method for calculation the confinement radius: “mean positional standard deviation” |
Determining Binding Dynamics
A stack of images taken with 30 ms integration time and 170 ms dark time was used to study binding dynamics. The image stack was visually analyzed for any cell drift or rotation during imaging. Images without visible drift were uploaded to U-track for tracking and linking single particles with parameters as described above. The tracking results were exported as an Excel file. The maximum likelihood diffusion coefficient (Dm) per track was then calculated.
| (Eq.1) |
where is the mean squared step size and τ equals 200 ms. Molecules with Dm≤0.032 μm2/s were considered chromatin-bound and the track length of individual particles was considered their dwell time. After correction for photobleaching, the cumulative frequency distribution of dwell times was used to extract residence time and chromatin-bound fraction. The normalized cumulative frequency distributions were fit with a one- or two-component exponential decay function based on the F-test implemented in OriginLab (OriginLab Corporation) as described previously (Tatavosian et al., 2019).
| (Eq.2) |
where (1 – f1sb) is the fraction of bound PRC1 proteins on non-specific sites (note: f1tb = 1 – f1sb), f1sb is the fraction of bound PRC1 proteins on specific sites, τsb is the residence time of PRC1 proteins on specific sites, and τtb is the residence time of PRC1 proteins on non-specific sites. Abbreviations “tb” and “sb” will be used in the text for the transient/non-specific- bound population and the stable/specific-bound population, respectively.
Determining Target-Search Dynamics
To investigate the target-search dynamics, 30 ms integration time without interval or 10 ms integration time with 20 ms interval was performed. The image stacks were visually checked as above and loaded onto U-track for analysis using tracking and linking parameters described above. The distributions of displacements were analyzed by using Spot-On, which was developed by Hansen et al. based on a kinetic modeling framework described by Mazza (Hansen et al., 2017; Hansen et al., 2018; Mazza et al., 2012). The displacement histograms were fit with the 3-state model by using MATLAB.
| (Eq.3) |
where F1, F2, and F3 are the chromatin-bound fraction, the confined diffusion fraction, and the free diffusion fraction, respectively, with a sum equal to 1.0. Spot-on utilizes σ as the single-molecule localization error. ZCORR is a correction factor for de-focalization bias that considers the probability of molecules moving out of the axial detection range, ΔZ, during delay time Δτ = 30 ms.
| (Eq.4) |
| (Eq.5) |
where the coefficients (a, b) are from Monte Carlo simulations for a given diffusion constant and are implemented in Spot-On. The parameters used in the fitting have been described previously.
Using the chromatin-bound fraction (F1) within cells, the fraction of the transient/non-specific-bound population (F1tb) and the stable/specific-bound population (F1sb) were respectively calculated, as follows.
| (Eq.6) |
| (Eq.7) |
The target-search kinetics were estimated as described previously. Briefly, the target-search time needed to find a specific site was computed as follows.
| (Eq.8) |
where Ntrail is the average number of non-specific interactions by which one molecule needs to encounter a specific site Ntrail = 1/f1sb and τ3D is the average free time between two binding events .
By considering the system at equilibrium, the relationship among the specific-bound fraction (F1sb), the residence time on specific site (τsb) and the target-search time (τsearch) was calculated as follows.
| (Eq.9) |
Thus, the specific-bound fraction is determined by the residence time and the target-search time.
To determine the target-search dynamics several assumptions were made as described previously (Tatavosian et al., 2018). The XY movement is projected to reflect the 3D diffusion of the HaloTag-labeled molecules because it is assumed that the molecules diffuse isotopically along the three-dimensional axes X, Y and Z. It was also assumed that the estimation of bound CBX2 molecules was unaffected by motion blur. The effects of motion blur on the estimation of chromatin-bound molecules have previously been systematically measured under the optic setup used in this study. Motion blur was found to have caused a slight overestimation of bound molecules, but this did not affect conclusions (Tatavosian et al., 2018). Hence, it was assumed that the estimation of bound CBX2 molecules was unaffected by motion blur. It was also assumed that the state transition between a bound molecule and an unbound molecule with the lag time (30 ms) is negligible.
Angular Distribution
To analyze the angular distributions of trajectories, only the trajectories that were annotated as diffusing were considered since locations of bound molecules could not be accurately located, which would lead to molecules being highly anisotropic (Hansen et al., 2020; McSwiggen et al., 2019a). Then, the diffusion coefficients of individual molecules were calculated. Molecules whose diffusion coefficients were above 0.1 μm2/s were selected for angular distribution analysis. When tracking a single particle’s motion in a plane, the directional change of the particle can be described by the relative angle θi between the position vectors in two consecutive steps, i→i+1 and i+1→i+2 (for illustration purpose: i = 2, thus steps 2→3→4.) If only the vector inner product is used for defining this angle, the range of θi is [0, 180] (or [0, π]), and the angular distribution to [180, 360] may be artificially symmetrized to get a full [0, 360] distribution. However, as shown in Figure 7C, steps 2→3→4 may lead to two different relative directions with respect to the first step although they have the samecos θ2. To account for this situation, a combination of the inner and cross products was used as described below.
The motion of the particle is recorded in x-y plane. The normalized vector is defined as , where . The unit vector along z axis is denoted as . Thereby, angle θ2 is defined by
If is along the positive z-direction, angle θ2 is in the range [0, 180], otherwise it is in the range [180, 360]. Simply put,
where sin θ2 ∝ (X3 − X2)(Y4 − Y3) − (X4 − X3)(Y3 − Y2) that is, only the sign of sin θ2 is needed for determining the range of the angle.
For the statistical analysis of angular distribution, Lorentzian broadening of the probability density function was employed, which provides a smoother graph representation than the raw histograms.
Molecules Inside and Outside Condensates
Epifluorescence images were recorded at the beginning and the end of each movie, which were used to mark condensates and assess the drift of condensates. The images were used to generate ‘before’ and ‘after’ images of the cell in the field of view. The colocalization of the ‘before’ and ‘after’ images were analyzed. The movies where the colocalization shows no drift of condensates were selected for further analysis. To analyze the spatial distribution of bound and free molecules, trajectories were sorted as either bound or free based on diffusion coefficients: molecules with D < 0.032 μm2/s as bound and molecules with D > 0.032 μm2/s as free. Bound and free trajectories were mapped onto ‘before’ or ‘after’ images and then the number of bound molecules inside and outside of condensates were counted. To analyze the angular distribution of molecules inside and outside of condensates, trajectories were mapped onto epifluorescence images and manually sorted as ‘inside’, ‘outside’ or ‘transverse’ condensates. If localization(s) of a trajectory occurred in both ‘inside’ and ‘outside’ condensates, that trajectory was labeled ‘transverse’ without further analysis. The diffusion coefficients of molecules were calculated and the angular distribution of molecules whose diffusion coefficient is above 0.1 μm2/s were analyzed as described above.
QUANTIFICATION AND STATISTICAL ANALYSIS
For the bar plots of residence times (Figures 1H–1J, 2D, 2G, and 3C), the standard deviation is the error from fitting. For other plots with error bars, data are from three independent experiments. The number of cells and the number of trajectories used in the figures from single-molecule experiments are listed Table S1.
Supplementary Material
Highlights.
CBX2 binds chromatin independently of H3K27me3 and CBX-PRC1 complex
CBX2 nucleates on chromatin to assemble condensates through interacting with DNA
LLPS accelerates the target search of CBX2 by reducing diffusion time and trials
Transcriptional condensates facilitate CBX2 to visit target sites repetitively
ACKNOWLEDGMENTS
We acknowledge the previous students of the Ren lab for participation in early aspects of this work and the current students of the Ren lab for stimulating discussion during the writing process. This work was supported by the National Institute of General Medical Sciences (NIGMS) (award R01GM135286 to X.R.) and the Office of Research Services (ORS) at the University of Colorado Denver.
Footnotes
SUPPLEMENTAL INFORMATION
Supplemental Information can be found online at https://doi.org/10.1016/j.celrep.2020.108248.
DECLARATION OF INTERESTS
The authors declare no competing interests.
REFERENCES
- Alberti S, Gladfelter A, and Mittag T (2019). Considerations and challenges in studying liquid-liquid phase separation and biomolecular condensates. Cell 176, 419–434. [DOI] [PMC free article] [PubMed] [Google Scholar]
- Annunziata O, Asherie N, Lomakin A, Pande J, Ogun O, and Benedek GB (2002). Effect of polyethylene glycol on the liquid-liquid phase transition in aqueous protein solutions. Proc. Natl. Acad. Sci. U S A 99, 14165–14170. [DOI] [PMC free article] [PubMed] [Google Scholar]
- Aranda S, Mas G, and Di Croce L (2015). Regulation of gene transcription by Polycomb proteins. Sci. Adv 1, e1500737. [DOI] [PMC free article] [PubMed] [Google Scholar]
- Banani SF, Rice AM, Peeples WB, Lin Y, Jain S, Parker R, and Rosen MK (2016). Compositional control of phase-separated cellular bodies. Cell 166, 651–663. [DOI] [PMC free article] [PubMed] [Google Scholar]
- Banani SF, Lee HO, Hyman AA, and Rosen MK (2017). Biomolecular condensates: organizers of cellular biochemistry. Nat. Rev. Mol. Cell Biol 18, 285–298. [DOI] [PMC free article] [PubMed] [Google Scholar]
- Bernstein E, Duncan EM, Masui O, Gil J, Heard E, and Allis CD (2006). Mouse polycomb proteins bind differentially to methylated histone H3 and RNA and are enriched in facultative heterochromatin. Mol. Cell. Biol 26, 2560–2569. [DOI] [PMC free article] [PubMed] [Google Scholar]
- Blackledge NP, Farcas AM, Kondo T, King HW, McGouran JF, Hanssen LLP, Ito S, Cooper S, Kondo K, Koseki Y, et al. (2014). Variant PRC1 complex-dependent H2A ubiquitylation drives PRC2 recruitment and polycomb domain formation. Cell 157, 1445–1459. [DOI] [PMC free article] [PubMed] [Google Scholar]
- Blackledge NP, Rose NR, and Klose RJ (2015). Targeting Polycomb systems to regulate gene expression: modifications to a complex story. Nat. Rev. Mol. Cell Biol 16, 643–649. [DOI] [PMC free article] [PubMed] [Google Scholar]
- Blackledge NP, Fursova NA, Kelley JR, Huseyin MK, Feldmann A, and Klose RJ (2020). PRC1 catalytic activity is central to polycomb system function. Mol. Cell 77, 857–874.e9. [DOI] [PMC free article] [PubMed] [Google Scholar]
- Boehning M, Dugast-Darzacq C, Rankovic M, Hansen AS, Yu T, Marie-Nelly H, McSwiggen DT, Kokic G, Dailey GM, Cramer P, et al. (2018). RNA polymerase II clustering through carboxy-terminal domain phase separation. Nat. Struct. Mol. Biol 25, 833–840. [DOI] [PubMed] [Google Scholar]
- Boija A, Klein IA, Sabari BR, Dall’Agnese A, Coffey EL, Zamudio AV, Li CH, Shrinivas K, Manteiga JC, Hannett NM, et al. (2018). Transcription factors activate genes through the phase-separation capacity of their activation domains. Cell 175, 1842–1855.e16. [DOI] [PMC free article] [PubMed] [Google Scholar]
- Bracha D, Walls MT, Wei MT, Zhu L, Kurian M, Avalos JL, Toettcher JE, and Brangwynne CP (2018). Mapping local and global liquid phase behavior in living cells using photo-oligomerizable seeds. Cell 175, 1467–1480.e13. [DOI] [PMC free article] [PubMed] [Google Scholar]
- Case LB, Zhang X, Ditlev JA, and Rosen MK (2019). Stoichiometry controls activity of phase-separated clusters of actin signaling proteins. Science 363, 1093–1097. [DOI] [PMC free article] [PubMed] [Google Scholar]
- Chen J, Zhang Z, Li L, Chen BC, Revyakin A, Hajj B, Legant W, Dahan M, Lionnet T, Betzig E, et al. (2014). Single-molecule dynamics of enhanceosome assembly in embryonic stem cells. Cell 156, 1274–1285. [DOI] [PMC free article] [PubMed] [Google Scholar]
- Cho WK, Spille JH, Hecht M, Lee C, Li C, Grube V, and Cisse II (2018). Mediator and RNA polymerase II clusters associate in transcriptiondependent condensates. Science 361, 412–415. [DOI] [PMC free article] [PubMed] [Google Scholar]
- Chong S, Dugast-Darzacq C, Liu Z, Dong P, Dailey GM, Cattoglio C, Heckert A, Banala S, Lavis L, Darzacq X, and Tjian R (2018). Imaging dynamic and selective low-complexity domain interactions that control gene transcription. Science 361, 378. [DOI] [PMC free article] [PubMed] [Google Scholar]
- Cooper S, Dienstbier M, Hassan R, Schermelleh L, Sharif J, Blackledge NP, De Marco V, Elderkin S, Koseki H, Klose R, et al. (2014). Targeting polycomb to pericentric heterochromatin in embryonic stem cells reveals a role for H2AK119u1 in PRC2 recruitment. Cell Rep 7, 1456–1470. [DOI] [PMC free article] [PubMed] [Google Scholar]
- de Napoles M, Mermoud JE, Wakao R, Tang YA, Endoh M, Appanah R, Nesterova TB, Silva J, Otte AP, Vidal M, et al. (2004). Polycomb group proteins Ring1A/B link ubiquitylation of histone H2A to heritable gene silencing and X inactivation. Dev. Cell 7, 663–676. [DOI] [PubMed] [Google Scholar]
- Elderkin S, Maertens GN, Endoh M, Mallery DL, Morrice N, Koseki H, Peters G, Brockdorff N, and Hiom K (2007). A phosphorylated form of Mel18 targets the Ring1B histone H2A ubiquitin ligase to chromatin. Mol. Cell 28, 107–120. [DOI] [PubMed] [Google Scholar]
- Endoh M, Endo TA, Endoh T, Fujimura Y, Ohara O, Toyoda T, Otte AP, Okano M, Brockdorff N, Vidal M, and Koseki H (2008). Polycomb group proteins Ring1A/B are functionally linked to the core transcriptional regulatory circuitry to maintain ES cell identity. Development 135, 1513–1524. [DOI] [PubMed] [Google Scholar]
- Eskeland R, Leeb M, Grimes GR, Kress C, Boyle S, Sproul D, Gilbert N, Fan Y, Skoultchi AI, Wutz A, and Bickmore WA (2010). Ring1B compacts chromatin structure and represses gene expression independent of histone ubiquitination. Mol. Cell 38, 452–464. [DOI] [PMC free article] [PubMed] [Google Scholar]
- Francis NJ, Kingston RE, and Woodcock CL (2004). Chromatin compaction by a polycomb group protein complex. Science 306, 1574–1577. [DOI] [PubMed] [Google Scholar]
- Fursova NA, Blackledge NP, Nakayama M, Ito S, Koseki Y, Farcas AM, King HW, Koseki H, and Klose RJ (2019). Synergy between variant PRC1 complexes defines polycomb-mediated gene repression. Mol. Cell 74, 1020–1036.e28. [DOI] [PMC free article] [PubMed] [Google Scholar]
- Gallego LD, Schneider M, Mittal C, Romanauska A, Gudino Carrillo RM, Schubert T, Pugh BF, and Köhler A (2020). Phase separation directs ubiquitination of gene-body nucleosomes. Nature 579, 592–597. [DOI] [PMC free article] [PubMed] [Google Scholar]
- Gibson BA, Doolittle LK, Schneider MWG, Jensen LE, Gamarra N, Henry L, Gerlich DW, Redding S, and Rosen MK (2019). Organization of chromatin by intrinsic and regulated phase separation. Cell 179, 470–484.e21. [DOI] [PMC free article] [PubMed] [Google Scholar]
- Grau DJ, Chapman BA, Garlick JD, Borowsky M, Francis NJ, and Kingston RE (2011). Compaction of chromatin by diverse Polycomb group proteins requires localized regions of high charge. Genes Dev. 25, 2210–2221. [DOI] [PMC free article] [PubMed] [Google Scholar]
- Guo YE, Manteiga JC, Henninger JE, Sabari BR, Dall’Agnese A, Hannett NM, Spille JH, Afeyan LK, Zamudio AV, Shrinivas K, et al. (2019). Pol II phosphorylation regulates a switch between transcriptional and splicing condensates. Nature 572, 543–548. [DOI] [PMC free article] [PubMed] [Google Scholar]
- Hansen AS, Pustova I, Cattoglio C, Tjian R, and Darzacq X (2017). CTCF and cohesin regulate chromatin loop stability with distinct dynamics. eLife 6, e25776. [DOI] [PMC free article] [PubMed] [Google Scholar]
- Hansen AS, Woringer M, Grimm JB, Lavis LD, Tjian R, and Darzacq X (2018). Robust model-based analysis of single-particle tracking experiments with Spot-On. eLife 7, e33125. [DOI] [PMC free article] [PubMed] [Google Scholar]
- Hansen AS, Amitai A, Cattoglio C, Tjian R, and Darzacq X (2020). Guided nuclear exploration increases CTCF target search efficiency. Nat. Chem. Biol 16, 257–266. [DOI] [PMC free article] [PubMed] [Google Scholar]
- Huth JR, Bewley CA, Nissen MS, Evans JN, Reeves R, Gronenborn AM, and Clore GM (1997). The solution structure of an HMG-I(Y)-DNA complex defines a new architectural minor groove binding motif. Nat. Struct. Biol 4, 657–665. [DOI] [PubMed] [Google Scholar]
- Hyman AA, Weber CA, and Jülicher F (2014). Liquid-liquid phase separation in biology. Annu. Rev. Cell Dev. Biol 30, 39–58. [DOI] [PubMed] [Google Scholar]
- Isono K, Endo TA, Ku M, Yamada D, Suzuki R, Sharif J, Ishikura T, Toyoda T, Bernstein BE, and Koseki H (2013). SAM domain polymerization links subnuclear clustering of PRC1 to gene silencing. Dev. Cell 26, 565–577. [DOI] [PubMed] [Google Scholar]
- Izeddin I, Recamier V, Bosanac L, Cisse II, Boudarene L, Dugast-Darzacq C, Proux F, Benichou O, Voituriez R, Bensaude O, et al. (2014). Single-molecule tracking in live cells reveals distinct target-search strategies of transcription factors in the nucleus. eLife 3, e02230. [DOI] [PMC free article] [PubMed] [Google Scholar]
- Jaqaman K, Loerke D, Mettlen M, Kuwata H, Grinstein S, Schmid SL, and Danuser G (2008). Robust single-particle tracking in live-cell time-lapse sequences. Nat. Methods 5, 695–702. [DOI] [PMC free article] [PubMed] [Google Scholar]
- Joshi O, Wang SY, Kuznetsova T, Atlasi Y, Peng T, Fabre PJ, Habibi E, Shaik J, Saeed S, Handoko L, et al. (2015). Dynamic reorganization of extremely long-range promoter-promoter interactions between two states of pluripotency. Cell Stem Cell 17, 748–757. [DOI] [PubMed] [Google Scholar]
- Katoh-Fukui Y, Tsuchiya R, Shiroishi T, Nakahara Y, Hashimoto N, Noguchi K, and Higashinakagawa T (1998). Male-to-female sex reversal in M33 mutant mice. Nature 393, 688–692. [DOI] [PubMed] [Google Scholar]
- Kaustov L, Ouyang H, Amaya M, Lemak A, Nady N, Duan S, Wasney GA, Li Z, Vedadi M, Schapira M, et al. (2011). Recognition and specificity determinants of the human cbx chromodomains. J. Biol. Chem 286, 521–529. [DOI] [PMC free article] [PubMed] [Google Scholar]
- Kawaguchi T, Machida S, Kurumizaka H, Tagami H, and Nakayama JI (2017). Phosphorylation of CBX2 controls its nucleosome-binding specificity. J. Biochem 162, 343–355. [DOI] [PubMed] [Google Scholar]
- Kim CA, Gingery M, Pilpa RM, and Bowie JU (2002). The SAM domain of polyhomeotic forms a helical polymer. Nat. Struct. Biol 9, 453–457. [DOI] [PubMed] [Google Scholar]
- Kondo T, Isono K, Kondo K, Endo TA, Itohara S, Vidal M, and Koseki H (2014). Polycomb potentiates meis2 activation in midbrain by mediating interaction of the promoter with a tissue-specific enhancer. Dev. Cell 28, 94–101. [DOI] [PubMed] [Google Scholar]
- Kundu S, Ji F, Sunwoo H, Jain G, Lee JT, Sadreyev RI, Dekker J, and Kingston RE (2017). Polycomb repressive complex 1 generates discrete compacted domains that change during differentiation. Mol. Cell 65, 432–446.e5. [DOI] [PMC free article] [PubMed] [Google Scholar]
- Larson AG, Elnatan D, Keenen MM, Trnka MJ, Johnston JB, Burlingame AL, Agard DA, Redding S, and Narlikar GJ (2017). Liquid droplet formation by HP1α suggests a role for phase separation in heterochromatin. Nature 547, 236–240. [DOI] [PMC free article] [PubMed] [Google Scholar]
- Lau MS, Schwartz MG, Kundu S, Savol AJ, Wang PI, Marr SK, Grau DJ, Schorderet P, Sadreyev RI, Tabin CJ, and Kingston RE (2017). Mutation of a nucleosome compaction region disrupts Polycomb-mediated axial patterning. Science 355, 1081–1084. [DOI] [PMC free article] [PubMed] [Google Scholar]
- Leeb M, and Wutz A (2007). Ring1B is crucial for the regulation of developmental control genes and PRC1 proteins but not X inactivation in embryonic cells. J. Cell Biol 178, 219–229. [DOI] [PMC free article] [PubMed] [Google Scholar]
- Lu H, Yu D, Hansen AS, Ganguly S, Liu R, Heckert A, Darzacq X, and Zhou Q (2018). Phase-separation mechanism for C-terminal hyperphosphorylation of RNA polymerase II. Nature 558, 318–323. [DOI] [PMC free article] [PubMed] [Google Scholar]
- Margueron R, and Reinberg D (2011). The Polycomb complex PRC2 and its mark in life. Nature 469, 343–349. [DOI] [PMC free article] [PubMed] [Google Scholar]
- Mazza D, Abernathy A, Golob N, Morisaki T, and McNally JG (2012). A benchmark for chromatin binding measurements in live cells. Nucleic Acids Res. 40, e119. [DOI] [PMC free article] [PubMed] [Google Scholar]
- McSwiggen DT, Hansen AS, Teves SS, Marie-Nelly H, Hao Y, Heckert AB, Umemoto KK, Dugast-Darzacq C, Tjian R, and Darzacq X (2019a). Evidence for DNA-mediated nuclear compartmentalization distinct from phase separation. eLife 8, e47098. [DOI] [PMC free article] [PubMed] [Google Scholar]
- McSwiggen DT, Mir M, Darzacq X, and Tjian R (2019b). Evaluating phase separation in live cells: diagnosis, caveats, and functional consequences. Genes Dev. 33, 1619–1634. [DOI] [PMC free article] [PubMed] [Google Scholar]
- Morey L, Pascual G, Cozzuto L, Roma G, Wutz A, Benitah SA, and Di Croce L (2012). Nonoverlapping functions of the Polycomb group Cbx family of proteins in embryonic stem cells. Cell Stem Cell 10, 47–62. [DOI] [PubMed] [Google Scholar]
- Nair SJ, Yang L, Meluzzi D, Oh S, Yang F, Friedman MJ, Wang S, Suter T, Alshareedah I, Gamliel A, et al. (2019). Phase separation of ligand-activated enhancers licenses cooperative chromosomal enhancer assembly. Nat. Struct. Mol. Biol 26, 193–203. [DOI] [PMC free article] [PubMed] [Google Scholar]
- Normanno D, Boudarène L, Dugast-Darzacq C, Chen J, Richter C, Proux F, Bénichou O, Voituriez R, Darzacq X, and Dahan M (2015). Probing the target search of DNA-binding proteins in mammalian cells using TetR as model searcher. Nat. Commun 6, 7357. [DOI] [PMC free article] [PubMed] [Google Scholar]
- Penny GD, Kay GF, Sheardown SA, Rastan S, and Brockdorff N (1996). Requirement for Xist in X chromosome inactivation. Nature 379, 131–137. [DOI] [PubMed] [Google Scholar]
- Plys AJ, Davis CP, Kim J, Rizki G, Keenen MM, Marr SK, and Kingston RE (2019). Phase separation of Polycomb-repressive complex 1 is governed by a charged disordered region of CBX2. Genes Dev. 33, 799–813. [DOI] [PMC free article] [PubMed] [Google Scholar]
- Reeves R, and Nissen MS (1990). The A.T-DNA-binding domain of mammalian high mobility group I chromosomal proteins. A novel peptide motif for recognizing DNA structure. J. Biol. Chem 265, 8573–8582. [PubMed] [Google Scholar]
- Ren X, Vincenz C, and Kerppola TK (2008). Changes in the distributions and dynamics of polycomb repressive complexes during embryonic stem cell differentiation. Mol. Cell. Biol 28, 2884–2895. [DOI] [PMC free article] [PubMed] [Google Scholar]
- Riback JA, Zhu L, Ferrolino MC, Tolbert M, Mitrea DM, Sanders DW, Wei MT, Kriwacki RW, and Brangwynne CP (2020). Composition-dependent thermodynamics of intracellular phase separation. Nature 581, 209–214. [DOI] [PMC free article] [PubMed] [Google Scholar]
- Sabari BR, Dall’Agnese A, Boija A, Klein IA, Coffey EL, Shrinivas K, Abraham BJ, Hannett NM, Zamudio AV, Manteiga JC, et al. (2018). Coactivator condensation at super-enhancers links phase separation and gene control. Science 361, 379. [DOI] [PMC free article] [PubMed] [Google Scholar]
- Sanulli S, Trnka MJ, Dharmarajan V, Tibble RW, Pascal BD, Burlingame AL, Griffin PR, Gross JD, and Narlikar GJ (2019). HP1 reshapes nucleosome core to promote phase separation of heterochromatin. Nature 575, 390–394. [DOI] [PMC free article] [PubMed] [Google Scholar]
- Schoenfelder S, Sugar R, Dimond A, Javierre BM, Armstrong H, Mifsud B, Dimitrova E, Matheson L, Tavares-Cadete F, Furlan-Magaril M, et al. (2015). Polycomb repressive complex PRC1 spatially constrains the mouse embryonic stem cell genome. Nat. Genet 47, 1179–1186. [DOI] [PMC free article] [PubMed] [Google Scholar]
- Schuettengruber B, Bourbon HM, Di Croce L, and Cavalli G (2017). Genome Regulation by Polycomb and Trithorax: 70 Years and Counting. Cell 171, 34–57. [DOI] [PubMed] [Google Scholar]
- Senthilkumar R, and Mishra RK (2009). Novel motifs distinguish multiple homologues of Polycomb in vertebrates: expansion and diversification of the epigenetic toolkit. BMC Genomics 10, 549. [DOI] [PMC free article] [PubMed] [Google Scholar]
- Shin Y, and Brangwynne CP (2017). Liquid phase condensation in cell physiology and disease. Science 357, eaaf4382. [DOI] [PubMed] [Google Scholar]
- Shrinivas K, Sabari BR, Coffey EL, Klein IA, Boija A, Zamudio AV, Schuijers J, Hannett NM, Sharp PA, Young RA, et al. (2019). Enhancer features that drive formation of transcriptional condensates. Mol. Cell 75, 549–561.e7. [DOI] [PMC free article] [PubMed] [Google Scholar]
- Simon JA, and Kingston RE (2013). Occupying chromatin: Polycomb mechanisms for getting to genomic targets, stopping transcriptional traffic, and staying put. Mol. Cell 49, 808–824. [DOI] [PMC free article] [PubMed] [Google Scholar]
- Steffen PA, and Ringrose L (2014). What are memories made of? How Polycomb and Trithorax proteins mediate epigenetic memory. Nat. Rev. Mol. Cell Biol 15, 340–356. [DOI] [PubMed] [Google Scholar]
- Strom AR, Emelyanov AV, Mir M, Fyodorov DV, Darzacq X, and Karpen GH (2017). Phase separation drives heterochromatin domain formation. Nature 547, 241–245. [DOI] [PMC free article] [PubMed] [Google Scholar]
- Tardat M, Albert M, Kunzmann R, Liu Z, Kaustov L, Thierry R, Duan S, Brykczynska U, Arrowsmith CH, and Peters AH (2015). Cbx2 targets PRC1 to constitutive heterochromatin in mouse zygotes in a parent-oforigin-dependent manner. Mol. Cell 58, 157–171. [DOI] [PubMed] [Google Scholar]
- Tatavosian R, Zhen CY, Duc HN, Balas MM, Johnson AM, and Ren X (2015). Distinct cellular assembly stoichiometry of Polycomb complexes on chromatin revealed by single-molecule chromatin immunoprecipitation imaging. J. Biol. Chem 290, 28038–28054. [DOI] [PMC free article] [PubMed] [Google Scholar]
- Tatavosian R, Duc HN, Huynh TN, Fang D, Schmitt B, Shi X, Deng Y, Phiel C, Yao T, Zhang Z, et al. (2018). Live-cell single-molecule dynamics of PcG proteins imposed by the DIPG H3.3K27M mutation. Nat. Commun 9, 2080. [DOI] [PMC free article] [PubMed] [Google Scholar]
- Tatavosian R, Kent S, Brown K, Yao T, Duc HN, Huynh TN, Zhen CY, Ma B, Wang H, and Ren X (2019). Nuclear condensates of the Polycomb protein chromobox 2 (CBX2) assemble through phase separation. J. Biol. Chem 294, 1451–1463. [DOI] [PMC free article] [PubMed] [Google Scholar]
- Vincenz C, and Kerppola TK (2008). Different polycomb group CBX family proteins associate with distinct regions of chromatin using nonhomologous protein sequences. Proc. Natl. Acad. Sci. U S A 105, 16572–16577. [DOI] [PMC free article] [PubMed] [Google Scholar]
- Wang H, Wang L, Erdjument-Bromage H, Vidal M, Tempst P, Jones RS, and Zhang Y (2004). Role of histone H2A ubiquitination in Polycomb silencing. Nature 431, 873–878. [DOI] [PubMed] [Google Scholar]
- Wang R, Ilangovan U, Robinson AK, Schirf V, Schwarz PM, Lafer EM, Demeler B, Hinck AP, and Kim CA (2008). Structural transitions of the RING1B C-terminal region upon binding the polycomb cbox domain. Biochemistry 47, 8007–8015. [DOI] [PMC free article] [PubMed] [Google Scholar]
- Wang L, Gao Y, Zheng X, Liu C, Dong S, Li R, Zhang G, Wei Y, Qu H, Li Y, et al. (2019). Histone modifications regulate chromatin compartmentalization by contributing to a phase separation mechanism. Mol. Cell 76, 646–659.e6. [DOI] [PubMed] [Google Scholar]
- Wani AH, Boettiger AN, Schorderet P, Ergun A, Münger C, Sadreyev RI, Zhuang X, Kingston RE, and Francis NJ (2016). Chromatin topology is coupled to Polycomb group protein subnuclear organization. Nat. Commun 7, 10291. [DOI] [PMC free article] [PubMed] [Google Scholar]
- Zamudio AV, Dall’Agnese A, Henninger JE, Manteiga JC, Afeyan LK, Hannett NM, Coffey EL, Li CH, Oksuz O, Sabari BR, et al. (2019). Mediator condensates localize signaling factors to key cell identity genes. Mol. Cell 76, 753–766.e6. [DOI] [PMC free article] [PubMed] [Google Scholar]
- Zhen CY, Duc HN, Kokotovic M, Phiel CJ, and Ren X (2014). Cbx2 stably associates with mitotic chromosomes via a PRC2- or PRC1-independent mechanism and is needed for recruiting PRC1 complex to mitotic chromosomes. Mol. Biol. Cell 25, 3726–3739. [DOI] [PMC free article] [PubMed] [Google Scholar]
- Zhen CY, Tatavosian R, Huynh TN, Duc HN, Das R, Kokotovic M, Grimm JB, Lavis LD, Lee J, Mejia FJ, et al. (2016). Live-cell single-molecule tracking reveals co-recognition of H3K27me3 and DNA targets polycomb Cbx7-PRC1 to chromatin. eLife 5, e17667. [DOI] [PMC free article] [PubMed] [Google Scholar]
Associated Data
This section collects any data citations, data availability statements, or supplementary materials included in this article.
Supplementary Materials
Data Availability Statement
Original/source data for figures in the paper is available upon request. Code is available upon request. This study did not generate datasets.