

Abstract
Background
Depression is one of the most pressing public health problems and also highly prevalent comorbid condition among diabetes mellitus (DM) patients. Depression may impact lifestyle decisions and ability to poorly perform tasks which are risk factors for DM. For reducing the impact of depression among DM patients in developing countries, it is crucial to identify and assess associated risk factors of depression among DM patients, thereby designing effective management techniques. In line with this, the current study applies the Bayesian framework, which pools prior information and current data, to find factors associated with depression among DM patients.
Methods
A hospital-based cross-sectional study was conducted at Adama Hospital and Medical College (AHMC) from March to April 2019. Data was entered into the Epi-data 3.1 then exported to the R software 3.4.4. Bayesian logistic regression models were fitted to the data using the Markov chain Monte Carlo (MCMC) algorithm. Estimates of model parameters including adjusted odds ratio (AOR) with 95% credible intervals (CI) were calculated.
Results
A total of 359 adults with DM were included in the analysis. The prevalence of depression among diabetic patients was 9.22% (95% CI: 6.4% to 12.7%). Higher fasting blood sugar level (AOR = −1.012; HPD CI: (1.0020, 1.025)), having diabetic complication (AOR = 0.1876; HPD CI: (0.0214, 0.671)), history of hospital admission (AOR = 0.2865; HPD CI: (0.0711, 0.7318)), low medication adherence (AOR = 29.29; HPD CI: (3.383, 92.26)), and taking both insulin and oral antidiabetic medication (AOR = 24.46; HPD CI: (15.20, 49.37) were significantly and strongly associated with depression among DM patients.
Conclusions
Prevalence of depression among diabetes patients in the catchment area of Adama Hospital, Ethiopia, was found to be very low. Higher fasting blood sugar level, diabetic complication, history of hospital admission, low medication adherence, and taking both insulin and oral antidiabetic medication were found to be strong predictors of prevalence of depression among DM patients. Based on the findings, we recommend that integrating screening and treating of depression, early detection and management of diabetic complication, and giving counseling to improve medication adherence is an effective approach for lowering the impact of depression on DM patients.
1. Introduction
Diabetes mellitus (DM) is a chronic disease which affects almost every organ in the human body. Globally prevalence of diabetes is increasing at an alarming rate affecting 463 million people. The World Health Organization (WHO) projected that 300 and 700 million people will suffer from diabetes by 2025 and 2045, respectively [1, 2]. The burden of diabetes is even higher in developing countries and in Ethiopia; systematic review result showed that prevalence of DM is between 2% and 6.5% [3].
Depression is one of the public health problems characterized by a state of low mood and aversion to activity that can affect a person's thoughts, behavior, feelings, and sense of wellbeing. It is one of the highly prevalent comorbid conditions among diabetic patients. Globally, depression is the second-leading cause of disability, and diabetic patients have been reported to be more likely to develop depression than nondiabetes people with estimated 15%-20% of people with diabetes struggling with moderate to severe form of depression [4–6].
Prevalence of depression among DM patients varies across countries with 8.3% % in the USA [7] to 71.8% in Iran [8], and in Ethiopia, it is ranging from 15.4 to 64.9% [9–15] with 39.73% pooled prevalence [16]. The presence of depression among diabetic patients increases the noncompliance to the medical treatment, decreases the quality of life, increases the risk of complication, results in poor prognosis, and increases mortality. Mortality from DM increases by 1.5-fold for patients with depression [17].
The occurrence of depression among diabetes is attributed to different factors. Studies indicated that burden of complications, financial stress, poor overall health status, knowledge of diabetes, poor social support and physical disability, and poor glycemic control are major factors associated with the presence of depression among DM patients [10, 18]. Smoking habit, increased number of comorbidities, higher level of cholesterol, and higher body mass index are also associated with depression among DM patients [19, 20].
Reducing the prevalence of depression among diabetes patients by designing effective management evidence on associated factors of depression among DM patients is crucial. For that reason, various studies have been piloted at different part of Ethiopia using classical logistic regressions with small datasets [9–15]. However, for small datasets, a Bayesian approach is preferred, and the current study applies the Bayesian framework (logistic regressions) which pools the prior information with current data to identify factors associated with depression among DM patients.
2. Methods
2.1. Study Design and Setting
A hospital-based cross-sectional study was conducted at Adama Hospital and Medical College (AHMC) from March to April 2019. The hospital, located in Adama city, Oromia National Regional State at 99 km to the southeast of Addis Ababa, the capital of Ethiopia. It has an outpatient department for chronic illness follow-up, and diabetes treatment is provided 2 days a week.
2.2. Sample Size Determination and Sampling Procedures
Sample size was calculated via the Open Epi software using a single population proportion formula by considering the following assumptions: prevalence of depression among diabetic patients at Felege Hiwot Referral Hospital, Bahir Dar, Northwest Ethiopia (P = 40.4%) [21], 95% confidence level, and 5% margin of error. The calculated sample size was 369, and by adding 10% nonresponse rate, the final sample size became 406. Patients diagnosed with DM who had follow-up for at least six months, age greater than 18 years, and visited the facility (AHMC) during the study period were selected as study participants.
A systematic random sampling method was used to select study participant. The sampling interval was computed by dividing the predictable number of diabetic patients per month into the sample size. The first study participant was selected by a lottery method from patients in the first sampling interval and turned out to be the second in the list, and then, every second person in the remaining sampling intervals was systematically selected until the desired sample size was reached. Details about the sampling method are available elsewhere [22].
2.3. Measurements and Operational Definition
Depression was the response variable that was measured using the Kessler 6 scales [23] which is validated in Ethiopia [24]. This instrument has 6 questions each asking the respondent how often they experienced symptoms during the past 30 days and containing 5-point Likert scales (1 = none of the time, 2 = a little of the time, 3 = some of the time, 4 = most of the times, 5 = all of the time). Then, item scores obtained from the scale were summed, and Serious Psychological Distress was considered when the score is 19 or more.
The explanatory variables included sociodemographic, behavioral (medication adherence and hazardous drinking habits), and clinical characteristics. Data related to sociodemographic and clinical factors were collected by using semistructure and pretested questionnaire which was developed by the principal investigator.
Medication adherence was measured using a 4-item Morisky medication adherence scale (MMAS). A high score indicates low levels of medication adherence [25]. Hazardous drinking was assessed using Fast Alcohol Screening Test (FAST). The Fast Alcohol Screening Test (FAST) is a short screening questionnaire for hazardous drinking comprising four questions. Then, item scores obtained from the scale were summed, and hazardous drinking was considered when the score is 3 or more [26].
Data was collected through face to face interview with document review by clinical nurses after receiving training on how to collect the data using both semistructured and standard questionnaire tools. Variables such as treatment modality (oral hypoglycemic agent, insulin therapy, and both oral hypoglycemic and insulin), diabetes-related complications, fasting blood sugar (records from the last visits were taken), and presence of documented comorbidity were obtained from patients' medical records. Initially, semistructured questionnaire was prepared in English version, then translated into Amharic and Oromiffa (local language) and again back translated to English by another person to check the consistency of the meaning.
2.4. Data Processing and Management
Each questionnaire was checked visually for completeness and consistency. Data was entered into the Epi-data 3.1 then exported to the R software 3.4.4. Finally, using the R software, the data was exported in text format in order to make it suitable for analysis in Win BUGS software [27]. Descriptive statistics and posterior summary statistics were presented and interpreted.
2.5. Statistical Analysis
2.5.1. Likelihood Distribution
The outcome variable was the presence of depression which is typical Bernoulli and modeled via logistic regression using a Bayesian framework to find factors associated with the presence of depression among diabetic patients.
Yi and pi are the status (yes, no) and probability of the presence of depression, respectively, of all diabetic patients j. Assuming Yj has a Bernoulli distribution, Yj < Bernoulli (pj) and modeled covariates Xj and that is logit (pj) = XT jβ + ϵ, where β is the vector of regression coefficients.
2.5.2. Specifying Prior Distributions for the Unknown Parameters
There are 25 unknown parameters (one intercept and 23 slope of the regression, β0, β2, β3, β4, ⋯, β24 and sigma). Let us use proper but noninformative prior; the priors on all parameters are assumed to be normal with mean zero and large variance or low precision (0, precision = 0.0001).
Βj ~ N (0, 0.0001), j ~ 0, 1 ⋯ 10.
2.5.3. Posterior Distribution of the Parameters
Markov Chain Monte Carlo (MCMC) simulation was used to estimate the model parameters using Gibbs sampling in the WinBUGS software [28]. When the MCMC implementation was applied to the data (having a three-chain), convergence of the MCMC samples was assessed using standard tools within the WinBUGS software (kernel density, history plots, autocorrelation plots, and Gelman–Rubin convergence diagnostic). After discarding the initial 40,000 iterations as burn-in, a total of 807,003 iterations are used to obtain final samples of 19998 with thinning 50 to make estimation and final analysis. Estimates of model parameters including AOR with 95% credible intervals were calculated.
2.5.4. Ethics Approval and Consent to Participate
Clearance was obtained from the institutional review board of the University of Gondar with reference number of IPH/180/06/2011. The purpose of the study was well explained, and informed consent was secured from study participants. No personal identifiers, such as name, address, and no private information, was collected.
3. Results
3.1. Sociodemographic Characteristics
A total of 359 adults with DM were included in the analysis with a response rate of 88.4%. The mean age of participants was 51 (±14.51) years with a range of 19 to 82 years. More than half (50.97%) of study participants were male. Near to one third (33.15%) of study participants attended primary education. Two hundred twenty-five (62.67%) of the participants were married, whereas 10 (2.79%) were divorced. Regarding occupation, 216 (60.17%) adults were unemployed, while 76 (21.17%) were employed as office workers (Table 1).
Table 1.
Sociodemographic characteristics of diabetes patients at Adama hospital and medical college, Adama city, East Shewa, Ethiopia 2019.
| Variable | Frequency (n = 359) | Percentage (%) |
|---|---|---|
| Gender | ||
| Female | 176 | 49.03 |
| Male | 183 | 50.97 |
| Residence | ||
| Urban | 306 | 85.24 |
| Rural | 53 | 14.76 |
| Marital status | ||
| Single | 45 | 62.67 |
| Married | 225 | 75.21 |
| Widowed | 64 | 17.83 |
| Separated | 15 | 4.18 |
| Divorced | 10 | 2.79 |
| Educational status | ||
| Uneducated | 60 | 16.71 |
| Primary cycle | 119 | 33.15 |
| Secondary and above | 180 | 50.14 |
| Occupational status | ||
| Unemployed | 216 | 60.17 |
| Employed | 76 | 21.17 |
| Other | 67 | 18.66 |
3.2. Behavioral and Clinical Characteristics
From the total of study participants, 22 (6.13%) were hazardous drinker. The mean (±SD) duration of living with DM was 10.38 (±5.27) years, and the mean (±SD) level of fasting blood sugar was 151.07 (±38.21) mg/dl. The majority of study subjects had type 2 diabetes (312 (86.91%)), 147 (40.95%) had comorbid disease other than DM, 83 (23.12%) had DM complication, more than half, 221 (61.56%) are on oral antidiabetic medications, and 101 (28.13%) had low medication adherence (Table 2).
Table 2.
Behavioral and clinical characteristics of diabetic patients at Adama hospital and medical college, Adama city, East Shewa, Ethiopia 2019.
| Variable | Frequency (n = 359) | Percentage (%) |
|---|---|---|
| Hazardous drinking | ||
| Yes | 22 | 6.13 |
| No | 337 | 93.87 |
| Type of DM | ||
| Type 1 | 47 | 13.09 |
| Type 2 | 312 | 86.91 |
| Types of medication | ||
| Oral | 221 | 61.56 |
| Insulin | 110 | 30.64 |
| Both | 28 | 7.80 |
| Medication adherence | ||
| Low | 101 | 28.13 |
| Medium | 86 | 23.96 |
| High | 172 | 47.91 |
| DM complication | ||
| Yes | 83 | 23.12 |
| No | 276 | 76.88 |
| Chronic illness other than DM | ||
| Yes | 147 | 40.95 |
| No | 212 | 59.05 |
| Hospital admission | ||
| Yes | 104 | 28.97 |
| No | 235 | 71.03 |
DM: diabetes mellitus.
3.3. Prevalence of Depression
The prevalence of depression among diabetes patients was 9.22% (95% CI: 6.4% to 12.7%). The highest prevalence of depression was observed among diabetes patients who are living in urban 32 (10.49%) and taking both oral and insulin medication 6 (21.43%). The prevalence of depression was also higher among diabetes patients who had a history of hospital admission 20 (19.42%), diabetic complication 14 (16.87%), and low medication adherence 21 (20.79%).
3.4. Factors Associated with Depression
To identify factors associated with depression among diabetes patients, we use a Bayesian logistic regression. Particularly, a Gibbs algorithm for all parameters was used to estimate the model parameters given in the Methods section. The convergences of the Gibbs algorithm were checked through MCMC assessment that involves checking the sequence, or Markov chain, for convergence and provides a representative sample from the posterior distribution.
3.5. Checking Convergence
3.5.1. Time Series Plot
According to Figure 1, the three independently generated MCMC chains are well mixed together or overlapped. Based on this, we can conclude that the simulation draws are reasonably converged, and therefore, we can be more confident about the accuracy of posterior inference.
Figure 1.
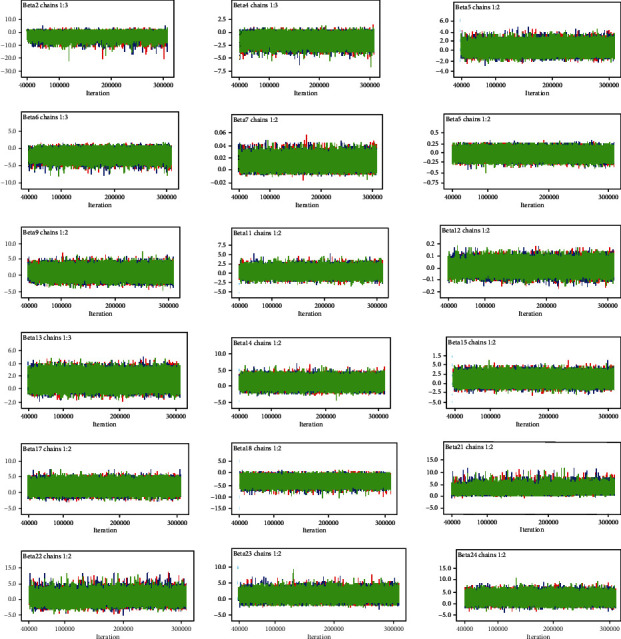
Time series for convergence of coefficients for the predictors.
3.5.2. Density Plot
Density plot is one of the diagnostic plots that are used to check convergence in Bayesian analysis. As we can see from Figure 2, the plots for all parameters have unimodal densities, suggesting that the simulated parameter values were generated from stationary distributions.
Figure 2.
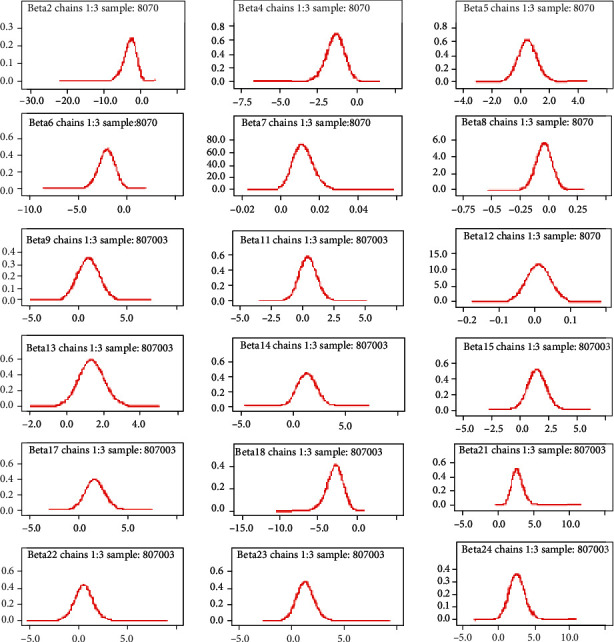
Density plot for convergence of coefficients for the predictors.
3.5.3. Autocorrelation Plot
Autocorrelation plot is another technique used to assess convergence in Bayesian analysis via MCMC. As we can observe from Figure 3 independent generated MCMC samples were attained after a thinning of 50 (50 lags).
Figure 3.
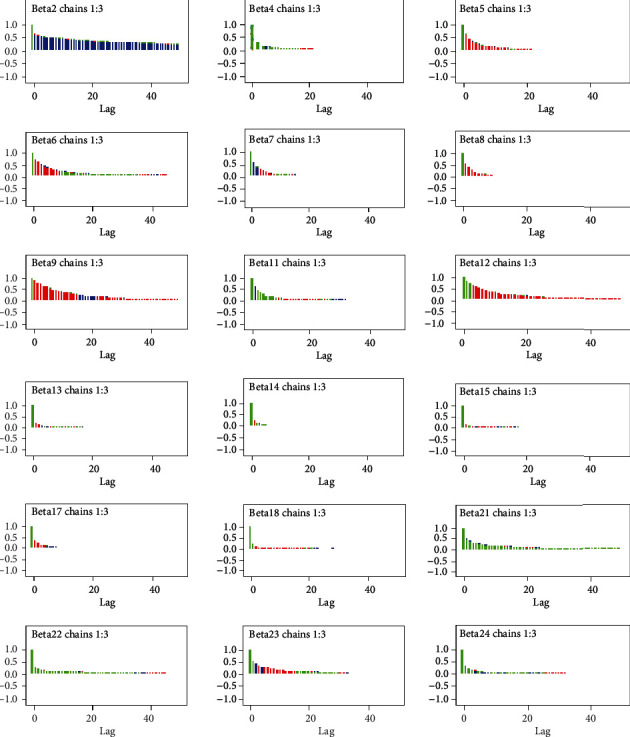
Autocorrelation plot for convergence of coefficients for the predictors.
3.5.4. Gelman–Rubin Statistics
Gelman–Rubin statistic is another method for assessing convergence. It can be applied only when multiple chains, based on different sets of initial values of parameters, are used. From the multiple chains, within and between variances are calculated, and if the ratio of the two is close to 1, then convergence is reached. Figure 4 displays the Gelman–Rubin plots which clearly show convergence has been achieved.
Figure 4.
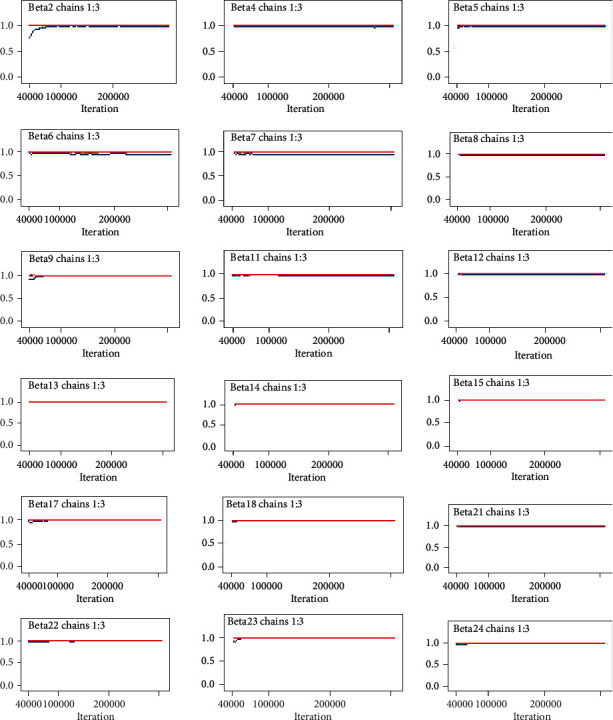
Gelman–Rubin statistic plot of for convergence of coefficients for the predictors.
3.5.5. Assessing the Accuracy of Bayesian Logistic Model Fitting
The posterior summary estimates by the MCMC algorithm, especially by Gibbs sampler, have posterior mean, standard errors, Monte Carlo error, and credible intervals. If the MC error value for each parameter of interest is less than about 5% of its posterior standard error, then the posterior density estimates have accurate posterior estimates.
Accordingly, as we can see from Table 3, MC error for each significant predictor is less than 5% of its posterior standard deviation. This implies convergence and accuracy of posterior estimates are attained, and the model is appropriate to estimate posterior statistics. In view of the result of noninformative prior given in Table 3, considering the credible interval, “fasting blood sugar,” “DM complication,” “hospital admission,” “treatment regimen (both oral and insulin),” “marital status (widowed),” and “educational status (primary)” were significantly and strongly associated with depression among DM patients.
Table 3.
Summary statistics for the posterior distribution of model parameters.
| Parameters (reference) | AOR | MC error | SD | HPD credible intervals | |
|---|---|---|---|---|---|
| Lower (25%) | Upper (75%) | ||||
| β 12 (age) | 1.0100 | <0.0001 | 0.0350 | 0.9435 | 1.0810 |
| Gender (male) | |||||
| β11 (female) | 1.8990 | 0.0063 | 1.7790 | 0.3744 | 1.4530 |
| Marital status (married) | |||||
| β17 (single) | 9.7580 | 0.0468 | 15.640 | 0.8662 | 43.060 |
| β18(widowed) | 0.0853 | <0.0001 | 0.0966 | 0.0060 | 0.3404 |
| β19 (separated) | 9.477 | 0.2147 | 103.00 | 0.0001 | 53.430 |
| β20 (divorced) | 85.71 | 4.181 | 2468.0 | 0.7392 | 389.90 |
| Educational status (secondary and above) | |||||
| β13(primary) | 5.027 | 0.0111 | 4.105 | 1.0680 | 15.52 |
| β14 (uneducated) | 6.024 | 0.0190 | 8.509 | 0.6198 | 24.59 |
| Occupational status (jobless) | |||||
| β15 (employed) | 5.539 | 0.0170 | 5.713 | 0.8245 | 19.76 |
| β16 (other) | 0.4415 | 0.0023 | 0.6374 | 0.0001 | 2.090 |
| Hazardous drinking (no) | |||||
| β3 (yes) | 0.2282 | 0.0028 | 0.5028 | 0.0011 | 1.373 |
| Medication adherence (high) | |||||
| β21(low) | 29.29 | 1.103 | 405.4 | 3.383 | 92.26 |
| β22 (medium) | 3.393 | 0.05873 | 22.02 | 0.2993 | 13.16 |
| Duration lived with DM (β8) | 0.9582 | <0.0001 | 0.0685 | 0.8298 | 1.099 |
| Fasting blood sugar ( β 7) | 1.012 | <0.0001 | 0.0058 | 1.0020 | 1.025 |
| Type of DM (type 2) | |||||
| β9 (type 1) | 5.677 | 0.0522 | 11.27 | 0.3278 | 27.67 |
| DM complication (yes) | |||||
| β6(no) | 0.1876 | <0.0001 | 0.1838 | 0.0214 | 0.671 |
| Chronic illness other than DM (yes) | |||||
| β5 (no) | 2.012 | 0.0068 | 1.6850 | 0.4530 | 6.127 |
| Hospital admission (yes) | |||||
| β4(no) | 0.2865 | <0.0001 | 0.1746 | 0.0711 | 0.7318 |
| Types of medication (oral) | |||||
| β22 (insulin) | 5.366 | 0.0457 | 16.69 | 0.7102 | 20.19 |
| β23(both) | 24.46 | 0.1659 | 81.47 | 15.20 | 49.37 |
DM: diabetes mellitus; HPD: highest posterior density; MC: Monte Carlo; AOR: adjusted odds ratio; SD: standard deviation.
Marital status and educational status are sociodemographical parameters that have significant and strong association with depression among diabetes patients. Holding other variable constant, the odds of depression among widowed diabetic patients will be decreased by 91.47% (HPD CI: (0.0060, 0.3404)) as compared to married diabetic patients. Diabetes patients with primary level of education are 5.027 (HPD CI: (1.0680, 15.52)) times more likely to develop depression than diabetes patients with higher level education while keeping for all other variable constant.
As fasting blood sugar level increase by one unit, the odds of the depression will increase by 1.20% (HPD CI: (1.0020, 1.025)) while making other variable constant. Adjusting for other variables, the odds of depression among diabetes patients who had no diabetic complication is 81.24% (HPD CI: (0.0214, 0.671)) lower than their counterpart.
Keeping other variables constant, the odds of depression among diabetes patients who had no history of hospital admission in past one month is decreased by 71.35% (HPD CI: (0.0711, 0.7318)) as compared to those who had history of hospital admission. Low medication adherents' diabetes patients are 29.29 (HPD CI: (3.383, 92.26)) times more likely to develop depression than high medication adherents while adjusting for other variables.
Types of medication are one of the clinical factors that has a significant and strong association with depression among diabetes patients. Holding other variables constant, the odds of depression is increased by 24.46 times (HPD CI: (15.20, 49.37)) among diabetes patients who are taking both oral antidiabetic medication and insulin as compared to those are taking only oral antidiabetic medication.
4. Discussion
According to the current study, the prevalence of depression among diabetes patients was 9.22% (95% CI: 6.4% to 12.7%). This finding is comparable with studies conducted in Peru (11.2%) [19] and the USA (8.3%) [7]. However, this result is lower than studies conducted in Ethiopia (15.4 to 64.9%) [9–15], Tanzania (30%) [29], Nigeria (30%) [30], Uganda (34.8%) [31], Sudan (44%) [32], Pakistan (14.7%) [33], and Iran (71.8%) [8]. The possible explanation for these differences might be due to the types of diagnostic tools used to assess depression and its respective cut of value used to decide depression has occurred.
Various studies have documented that factors associated with depression among diabetes patients using the classical logistic regression. Risk factors were age [10, 15, 34], gender [14, 15, 35–38], marital status [15, 35, 37, 39], educational status [34, 37, 40], hazardous drinking [38, 39], medication adherence [13, 39], duration lived with DM [9, 14, 35], fasting blood sugar [41], DM complication [10, 12, 14, 36, 37], chronic illness other than DM [14, 34], and types of medication [34].
The present study also demonstrated factors associated with depression among diabetes patients at AHMC using a Bayesian logistic regression. Bayesian inference and frequentist (classical) statistics results are tough to compare; this is because they use different techniques with different tools for decision making. In frequentist (classical) statistics, standard deviation and confidence interval are used to make decision, while in Bayesian statistics, credible interval is used. However, findings from the Bayesian model are given preference, because the technique is more robust and precise than the traditional statistics.
The current study revealed that as fasting blood sugar level increase by one unit, the odd of the depression will increase by 1.20%. This finding can be explained by as blood glucose level increases, the diabetes patients manifesting like polyuria (excessive urination), polydipsia (excessive thirsty), polyphagia (excessive hunger), general weakness, and sleeping disturbances [42], which may lead to develop depression. This can also be defensible as those who have higher blood glucose want more health care services, are incapable to perform their daily activities, and are incompetent to join in different activities, which may lead to depression.
According to our study, the odds of depression among diabetes patients who had no diabetic complication is 81.24% lower than their counterparts. The possible explanation for this result might be, as diabetes patient develops diabetic-related complication, they need a considerable amount of time for healing, so they spend their times on clinic visits, hospitalization, and frequent ulcer dressings. The presence of a foot ulcer also creates anxiety due to a possibility of amputation.
The current study documented that low medication adherents' diabetes patients are 29.29 times more likely to develop depression than high medication adherents. The possible explanation might be good medications are essential in sustaining the optimal level of fasting blood sugar which reduces the chance of depression symptoms among diabetes patients.
According to the present study, the odds of depression is increased by 24.46 times among diabetes patients who are taking both oral antidiabetic medication and insulin than those who are taking only oral antidiabetic medication. This might be due to injection for insulin may cause discomfort, and these group diabetic patients (both oral antidiabetic medication and insulin) are more likely to have poor glycemic control this might eventually lead to develop depression symptoms.
The strength of the present study is using a Bayesian approach rather than classical approach to identify factors associated with depression among diabetes patients. This Bayesian method performs better in the sense of yielding larger coverage probabilities and smaller bias than the classic maximum likelihood approach. It also combined the prior information with present data.
However, this study has some limitations that should be kept in mind when interpreting the results. This study might be prone to social desirability bias since the data were collected through face to face interview. Finally, the study was conducted in a single hospital (AHMC) which limits the generalizability of the finding in Ethiopia.
5. Conclusion
This study documented that the prevalence of depression among diabetes patients in the catchment area of Adama Hospital, Ethiopia, was found to be very low. Higher fasting blood sugar level, diabetic complication, history of hospital admission, low medication adherence, and taking both insulin and oral antidiabetic medication were found to be strong predictors of prevalence of depression among diabetic patients. Based on the findings, we recommend integrating screening and treating of depression; early detection and management of diabetic complication and giving counseling to improve medication adherence is an effective approach for lowering the impact of depression on diabetes patients.
Acknowledgments
We would like to thank the University of Gondar for funding and giving ethical clearance to conduct this research. Additionally, we wish to express our sincere thanks and appreciation to data collectors and supervisors for their support during data collection period. The data collection was financially covered by the University of Gondar.
Abbreviations
- AHMC:
Adama Hospital and Medical College
- AOR:
Adjusted odds ratio
- CI:
Credible interval
- DM:
Diabetes mellitus
- FAST:
Fast alcohol screening test
- HPD:
Highest posterior density
- MC:
Monte Carlo
- MCMC:
Markov chain Monte Carlo
- MMAS:
Medication adherence scale
- SD:
Standard deviation
- WinBUGS:
Win Bayesian using Gibbs sampling
- WHO:
World Health Organization (WHO).
Data Availability
The datasets supporting the conclusions of this article are available upon request to the corresponding author.
Conflicts of Interest
The authors have declared that no competing interests exist.
Authors' Contributions
BS conceptualized the study, collected the data, analyzed the data, and drafted the manuscript. MA, ABW, SAK, and GAD also participated in designed the study, analyzed the data, and critically revised the manuscript. All authors read and approved the final manuscript.
References
- 1.King H., Aubert R. E., Herman W. H. Global burden of diabetes, 1995-2025: prevalence, numerical estimates, and projections. Diabetes Care. 1998;21(9):1414–1431. doi: 10.2337/diacare.21.9.1414. [DOI] [PubMed] [Google Scholar]
- 2.Saeedi P., Petersohn I., Salpea P., et al. Global and regional diabetes prevalence estimates for 2019 and projections for 2030 and 2045: Results from the International Diabetes Federation Diabetes Atlas, 9th edition. Diabetes Research and Clinical Practice. 2019;157, article 107843 doi: 10.1016/j.diabres.2019.107843. [DOI] [PubMed] [Google Scholar]
- 3.Bishu K. G., Jenkins C., Yebyo H. G., Atsbha M., Wubayehu T., Gebregziabher M. Diabetes in Ethiopia: a systematic review of prevalence, risk factors, complications, and cost. Obesity Medicine. 2019;15, article 100132 [Google Scholar]
- 4.Kroenke K., Spitzer R. L. The PHQ-9: a new depression diagnostic and severity measure. Psychiatric Annals. 2002;32(9):509–515. [Google Scholar]
- 5.Katon W. J. The comorbidity of diabetes mellitus and depression. The American Journal of Medicine. 2008;121(11):S8–S15. doi: 10.1016/j.amjmed.2008.09.008. [DOI] [PMC free article] [PubMed] [Google Scholar]
- 6.Mezuk B., Eaton W. W., Albrecht S., Golden S. H. Depression and type 2 diabetes over the lifespan: a meta-analysis. Diabetes Care. 2008;31(12):2383–2390. doi: 10.2337/dc08-0985. [DOI] [PMC free article] [PubMed] [Google Scholar]
- 7.Li C., Ford E. S., Strine T. W., Mokdad A. H. Prevalence of depression among US adults with diabetes: findings from the 2006 behavioral risk factor surveillance system. Diabetes Care. 2008;31(1):105–107. doi: 10.2337/dc07-1154. [DOI] [PubMed] [Google Scholar]
- 8.Khamseh M. E., Baradaran H. R., Rajabali H. Depression and diabetes in Iranian patients: a comparative study. The International Journal of Psychiatry in Medicine. 2007;37(1):81–86. doi: 10.2190/fp64-82v3-1741-842v. [DOI] [PubMed] [Google Scholar]
- 9.Dachew B. A., Birhanu A. M., Alemu F. M., Balcha S. A., Ashenafi T. D. Depression in diabetic patients attending university of gondar hospital diabetic clinic, Northwest Ethiopia. Diabetes, Metabolic Syndrome and Obesity: Targets and Therapy. 2016;9:p. 155. doi: 10.2147/DMSO.S97623. [DOI] [PMC free article] [PubMed] [Google Scholar]
- 10.Dejene S., Negash A., Tesfay K., Jobset A., Abera M. J. J. P. Depression and diabetes in jimma university specialized hospital, Southwest Ethiopia. Journal of Psychiatry. 2014;17(126):p. 2. [Google Scholar]
- 11.Erkie M., Feleke Y., Desalegne F., Anbessie J., Shibre T. Magnitude, clinical and sociodemographic correlate of depression in diabetic patients, Addis Ababa, Ethiopia. Ethiopian Medical Journal. 2013;51(4):249–259. [PubMed] [Google Scholar]
- 12.Habtewold T. D., Alemu S. M., Haile Y. G. Sociodemographic, clinical, and psychosocial factors associated with depression among type 2 diabetic outpatients in Black Lion General Specialized Hospital, Addis Ababa, Ethiopia: a cross-sectional study. BMC Psychiatry. 2016;16(1):p. 103. doi: 10.1186/s12888-016-0809-6. [DOI] [PMC free article] [PubMed] [Google Scholar]
- 13.Mossie T. B., Berhe G. H., Kahsay G. H., Tareke M. Prevalence of depression and associated factors among diabetic patients at Mekelle City, North Ethiopia. Indian Journal of Psychological Medicine. 2017;39(1):p. 52. doi: 10.4103/0253-7176.198947. [DOI] [PMC free article] [PubMed] [Google Scholar]
- 14.Tiki T. Prevalence and associated factors of depression among type 2 diabetes mellitus patients on follow up at ambo general hospital, Oromia regional state, Ethiopia, institutional based cross sectional study. Journal of Depression and Anxiety. 2017;6(1):p. 2167. [Google Scholar]
- 15.Bedaso A., Bekele G., Mekonnen N., Tamiru E. Prevalence of unrecognized depression and associated factors among patients attending medical outpatient department in Adare Hospital, Hawassa, Ethiopia. Neuropsychiatric Disease and Treatment. 2016;12, article 2723 doi: 10.2147/NDT.S118384. [DOI] [PMC free article] [PubMed] [Google Scholar]
- 16.Teshome H. M., Ayalew G. D., Shiferaw F. W., Leshargie C. T., Boneya D. J. The prevalence of depression among diabetic patients in Ethiopia: a systematic review and meta-analysis, 2018. Depression Research and Treatment. 2018;2018:8. doi: 10.1155/2018/6135460.6135460 [DOI] [PMC free article] [PubMed] [Google Scholar]
- 17.Park M., Katon W. J., Wolf F. M. Depression and risk of mortality in individuals with diabetes: a meta-analysis and systematic review. General Hospital Psychiatry. 2013;35(3):217–225. doi: 10.1016/j.genhosppsych.2013.01.006. [DOI] [PMC free article] [PubMed] [Google Scholar]
- 18.Engidaw N. A., Wubetu A. D., Basha E. A. Prevalence of depression and its associated factors among patients with diabetes mellitus at Tirunesh-Beijing general hospital, Addis Ababa, Ethiopia. BMC Public Health. 2020;20(1):1–7. doi: 10.1186/s12889-020-8360-2. [DOI] [PMC free article] [PubMed] [Google Scholar]
- 19.Mir K., Mir K., Malik I., Shehzadi A. Prevalence of co-morbid depression in diabetic population. Journal of Ayub Medical College Abbottabad. 2015;27(1):99–101. [PubMed] [Google Scholar]
- 20.Mendenhall E., Norris S. A., Shidhaye R., Prabhakaran D. Depression and type 2 diabetes in low-and middle-income countries: a systematic review. Diabetes Research and Clinical Practice. 2014;103(2):276–285. doi: 10.1016/j.diabres.2014.01.001. [DOI] [PMC free article] [PubMed] [Google Scholar]
- 21.Wordofa B. P. Prevalence of Depression and Associated Factors among Adult Diabetic Patients Attending Outpatient Department, at Felege Hiwot Referral Hospital, Bahir Dar, Northwest Ethiopia, 2016. Addis Ababa University; 2016. [Google Scholar]
- 22.Tusa B. S., Geremew B. M., Tefera M. A. Heath related quality of life and associated factors among adults with and without diabetes in Adama city East Shewa, Ethiopia 2019; using generalized structural equation modeling. Health and Quality of Life Outcomes. 2020;18:1–13. doi: 10.1186/s12955-020-01337-9. [DOI] [PMC free article] [PubMed] [Google Scholar]
- 23.Kessler R. C., Andrews G., Colpe L. J., et al. Short screening scales to monitor population prevalences and trends in non-specific psychological distress. Psychological Medicine. 2002;32(6):959–976. doi: 10.1017/S0033291702006074. [DOI] [PubMed] [Google Scholar]
- 24.Tesfaye M., Hanlon C., Wondimagegn D., Alem A. Detecting postnatal common mental disorders in Addis Ababa, Ethiopia: validation of the Edinburgh postnatal depression scale and Kessler scales. Journal of Affective Disorders. 2010;122(1-2):102–108. doi: 10.1016/j.jad.2009.06.020. [DOI] [PubMed] [Google Scholar]
- 25.Morisky D. E., Green L. W., Levine D. M. Concurrent and predictive validity of a self-reported measure of medication adherence. Medical Care. 1986;24:67–74. doi: 10.1097/00005650-198601000-00007. [DOI] [PubMed] [Google Scholar]
- 26.Hodgson R., Alwyn T., John B., Thom B., Smith A. The fast alcohol screening test. Alcohol and Alcoholism. 2002;37(1):61–66. doi: 10.1093/alcalc/37.1.61. [DOI] [PubMed] [Google Scholar]
- 27.Lunn D. J., Thomas A., Best N., Spiegelhalter D. Win BUGS-a Bayesian modelling framework: concepts, structure, and extensibility. Statistics and Computing. 2000;10(4):325–337. doi: 10.1023/A:1008929526011. [DOI] [Google Scholar]
- 28.Gelfand A. E., Smith A. F. Sampling-based approaches to calculating marginal densities. Journal of the American Statistical Association. 1990;85(410):398–409. doi: 10.1080/01621459.1990.10476213. [DOI] [Google Scholar]
- 29.Khan Z. D., Lutale J., Moledina S. M. Prevalence of depression and associated factors among diabetic patients in an outpatient diabetes clinic. Psychiatry Journal. 2019;2019:6. doi: 10.1155/2019/2083196.2083196 [DOI] [PMC free article] [PubMed] [Google Scholar]
- 30.James B. O., Omoaregba J. O., Eze G., Morakinyo O. Depression among patients with diabetes mellitus in a Nigerian teaching hospital. South African Journal of Psychiatry. 2010;16(2) [Google Scholar]
- 31.Akena D., Kadama P., Ashaba S., et al. The association between depression, quality of life, and the health care expenditure of patients with diabetes mellitus in Uganda. Journal of Affective Disorders. 2015;174:7–12. doi: 10.1016/j.jad.2014.11.019. [DOI] [PMC free article] [PubMed] [Google Scholar]
- 32.Mirghani H. O., Mohammed O. S., Saadallah A. M. Prevalence of depression among Sudanese patients with type-2 diabetes mellitus. Sudan Journal of Medical Sciences. 2014;9(3):151–155. [Google Scholar]
- 33.Zahid N., Asghar S., Claussen B., Hussain A. Depression and diabetes in a rural community in Pakistan. Diabetes Research and Clinical Practice. 2008;79(1):124–127. doi: 10.1016/j.diabres.2007.07.006. [DOI] [PubMed] [Google Scholar]
- 34.Sunny A. K., Khanal V. K., Sah R. B., Ghimire A. Depression among people living with type 2 diabetes in an urbanizing community of Nepal. PloS One. 2019;14(6, article e0218119) doi: 10.1371/journal.pone.0218119. [DOI] [PMC free article] [PubMed] [Google Scholar]
- 35.Asefa A., Zewudie A., Henok A., Mamo Y., Nigussie T. Depression and its associated factors among diabetes mellitus patients attending selected hospitals in Southwest Ethiopia: a cross-sectional study. Psychiatry Journal. 2020;2020:8. doi: 10.1155/2020/6486030.6486030 [DOI] [PMC free article] [PubMed] [Google Scholar]
- 36.Hyassat D., Al Doseri S., Hashem J., et al. Prevalence, gender differences and associated factors of depression among adults with type 2 diabetes, Jordan. Journal of Depression and Anxiety. 2017;s12:p. S12. [Google Scholar]
- 37.Arambewela M. H., Somasundaram N. P., Jayasekara H. B. P. R., Kumbukage M. P. Prevalence of depression and associated factors among patients with type 2 diabetes attending the diabetic clinic at a tertiary care hospital in Sri Lanka: a descriptive study. Psychiatry Journal. 2019;2019:8. doi: 10.1155/2019/7468363.7468363 [DOI] [PMC free article] [PubMed] [Google Scholar]
- 38.Knychala M. A., Jorge M. L. M. P., Muniz C. K., Faria P. N., Jorge P. T. High-risk alcohol use and anxiety and depression symptoms in adolescents and adults with type 1 diabetes mellitus: a cross-sectional study. Diabetology & Metabolic Syndrome. 2015;7(1):p. 24. doi: 10.1186/s13098-015-0020-9. [DOI] [PMC free article] [PubMed] [Google Scholar]
- 39.Gebre B. B., Anand S., Assefa Z. M. Depression and Its Predictors among Diabetes Mellitus Patients Attending Treatment in Hawassa University Comprehensive Specialized Hospital, Southern Ethiopia. Journal of Diabetes Research. 2020;2020:9. doi: 10.1155/2020/7138513.7138513 [DOI] [PMC free article] [PubMed] [Google Scholar]
- 40.Mezuk B., Eaton W. W., Golden S. H., Ding Y. The influence of educational attainment on depression and risk of type 2 diabetes. American Journal of Public Health. 2008;98(8):1480–1485. doi: 10.2105/AJPH.2007.126441. [DOI] [PMC free article] [PubMed] [Google Scholar]
- 41.Anantha Eashwar V. M., Gopalakrishnan S., Umadevi R. Prevalence of depression in patients with type 2 diabetes mellitus and its association with fasting blood sugar levels, in an urban area of Kancheepuram district, Tamil Nadu. International Journal Of Community Medicine And Public Health. 2017;4(9):3399–3406. [Google Scholar]
- 42.Michael G., Dagnaw W., Yadeta D., et al. Ethiopian National Guideline on Major NCDs 2016. Federal Democratic Republic of Ethiopia, Ministry of Health; 2016. [DOI] [Google Scholar]
Associated Data
This section collects any data citations, data availability statements, or supplementary materials included in this article.
Data Availability Statement
The datasets supporting the conclusions of this article are available upon request to the corresponding author.