Abstract
The World Health Organization has designated Zika virus (ZIKV) as a dangerous, mosquito-borne pathogen that can cause severe developmental defects. The primary goal of this work was identification of small molecules as potential ZIKV inhibitors that target the viral envelope glycoprotein (ZIKV E) involved in membrane fusion and viral entry. A homology model of ZIKV E containing the small molecule β-octyl glucoside (BOG) was constructed, on the basis of an analogous X-ray structure from dengue virus, and >4 million commercially available compounds were computationally screened using the program DOCK6. A key feature of the screen involved the use of similarity-based scoring to identify inhibitor candidates that make similar interaction energy patterns (molecular footprints) as the BOG reference. Fifty-three prioritized compounds underwent experimental testing using cytotoxicity, cell viability, and tissue culture infectious dose 50% (TCID50) assays. Encouragingly, relative to a known control (NITD008), six compounds were active in both the cell viability assay and the TCID50 infectivity assay, and they showed activity in a third caspase activity assay. In particular, compounds 8 and 15 (tested at 25 μM) and compound 43 (tested at 10 μM) appeared to provide significant protection to infected cells, indicative of anti-ZIKV activity. Overall, the study highlights how similarity-based scoring can be leveraged to computationally identify potential ZIKV E inhibitors that mimic a known reference (in this case BOG), and the experimentally verified hits provide a strong starting point for further refinement and optimization efforts.
The World Health Organization has identified Zika virus (ZIKV), from the family Flaviviridae and genus Flavivirus, as a dangerous, mosquito-borne virus that is prevalent in tropical and subtropical regions around the world.1 While most of the presentations in adults are generally mild and include fever, rash, headaches, and muscle and joint pain, the flavivirus has the potential to manifest microcephaly in the fetuses of pregnant women.2−4 The virus, while initially thought to be spread only from mosquitos to humans, has shown the ability to be transmitted vertically (from mother to fetus), sexually, and through blood transfusion.4 Due to the severity of the developmental defects caused by the disease, in conjunction with the discovery of multiple modes of transmission, it has become imperative to identify means of preventing viral infection.
The 10.8 kb single-stranded RNA genome of ZIKV encodes three structural and seven nonstructural proteins in the form of a single polypeptide. The single polypeptide is processed into capsid (C), precursor membrane (PrM), and envelope (E) proteins in addition to the seven nonstructural proteins (NS1, NS2A, NS2B, NS3, NS4A, NS4B, and NS5).5−7 The study presented here focuses on targeting the structural envelope protein called glycoprotein E, abbreviated in this manuscript as ZIKV E.
ZIKV E, a 416-residue protein comprised of three domains (DI–DIII),5,8 is an important component of the viral membrane in fully mature viral particles and upon host cell recognition is responsible for meditating viral–host membrane fusion. The membrane fusion event is similar to that characterized previously in other flaviviruses, notably, West Nile and dengue.8 ZIKV E exists as a homodimer on the viral cell surface. In the main route of entry, the virus, after binding to its receptor, is taken up into the cell by clathrin-mediated endocytosis (2–10 min).9 The clathrin coat is shed, and the virus is then encapsulated inside the cellular vesicle by the endosomal membrane. As the endosome matures into a late endosome, while being transported along microtubules under the direction of Rab family GTPases, the pH decreases gradually, and the E protein mediates fusion between the viral envelope and the endosomal membrane, releasing the viral genome into the cell cytosol (10–15 min).9
It is believed that the low-pH environment of the endosome spurs a conformational reorganization of the glycoprotein homodimers into homotrimers.5,8 These changes enable fusion loops located at the tip of DII to insert themselves into the target membrane, and then three ZIKV E monomers assemble to form a trimeric structure. Several small rearrangements in DI and DIII release enough energy to initiate fusion pore formation, ultimately leading to the viral capsid being released into the host cell (Figure 1).8 If key conformational changes in ZIKV E can be obstructed, it is hypothesized10 that viral replication can be prevented, a strategy previously employed in the development of entry inhibitors targeting HIV.11−13
Figure 1.
Steps leading to membrane fusion mediated by ZIKV E. The host membrane is colored gray, and the viral membrane orange. ZIKV E domains are colored red (DI), yellow (DII), or blue (DIII), and stem peptides green. Figure adapted from ref (80).
To date, several groups have explored development of inhibitors targeting ZIKV E14 and the analogous protein from dengue virus (DENV E).15 Focusing on small molecule development, in 2003, Modis et al.10 reported an X-ray structure of DENV E [Protein Data Bank (PDB) entry 1OKE] that contained a co-crystallized detergent β-octyl glucoside (BOG) molecule. The authors posited that the ligand binding pocket occupied by BOG, formed at the interface of domains D1 and DII (Figure 2), could be used as a template to help identify small molecule inhibitors that prevent fusion in DENV E and related flaviviruses.10 Subsequent studies by a number of groups16−29 led to the identification of several classes of compounds believed to target the DENV E, and more recently ZIKV E, BOG site. In particular, the study by de Wispelaere et al.27 provided strong evidence that the BOG pocket is a pharmacologically important and “druggable” site for development of small molecule inhibitors targeting flavivirus.
Figure 2.
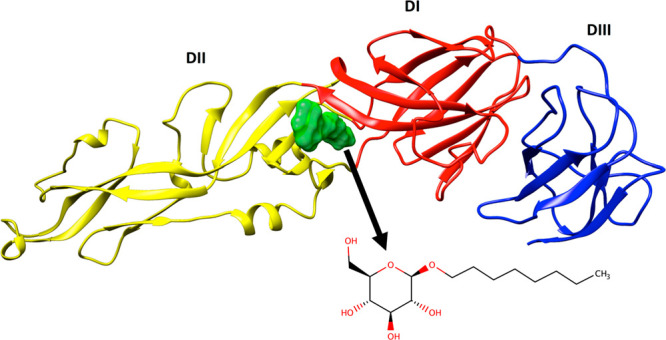
Ribbon depiction of DENV E complexed with BOG (green surface) colored by the three domains (DI in red, DII in yellow, and DIII in blue) from PDB entry 1OKE.10 The inset shows the two-dimensional structure of BOG.
This work seeks to leverage new features implemented by our group into the computer program DOCK630 to identify small organic molecules compatible with ZIKV E through targeting the analogous BOG binding site interface originally observed in DENV E. A specific goal was to employ similarity-based scoring methods, for which the BOG molecule was used as a reference, to identify compounds that make similar interactions based on their footprint similarity (FPS),31,32 pharmacophore matching similarity (FMS),33 Hungarian matching similarity (HMS),34 and volume overlap similarity (VOS) scores (see Methods for descriptions of each function). The focus is to identify top-scoring compounds for subsequent experimental testing across different scoring “spaces” that include to a greater or lesser extent biases toward the proposed ZIKV E–BOG interface.
The primary objectives of this study are (1) to construct and refine an atomic-level homology model for ZIKV E complexed with BOG based on the DENV template, (2) to virtually screen a large library (>4 million) of commercially available small organic molecules to the BOG site and prioritize the results, (3) to experimentally test the most promising compounds, and (4) to computationally characterize the most active hits using molecular dynamics simulations and free energy calculations to assess energetic and geometric stability in the BOG pocket.
Methods
Homology Modeling of ZIKV E Complexed with BOG
At the time the study was initiated, no crystal structures of ZIKV E were available (with or without BOG) for virtual screening. To circumvent this issue, a homology model was constructed on the basis of the analogous protein from dengue virus (DENV E) containing the ligand BOG. The PDB entry used to construct the model was 1OKE,10 which shares ∼74% similarity and ∼55% identity according to sequence alignments generated using BLAST35 (see Results and Discussion). The DENV E template was manually mutated to the correct ZIKV E sequence used in the experimental studies (strain MR766) with the program MOE36 after accounting for three one-residue mutations and one two-residue insertion that were modeled using other aligned flavivirus X-ray structures37−41 not containing gaps at those positions. When possible, side chain rotamers were placed to be coincident with the original DENV E side chains. The ZIKV E homology model complexed with BOG was then relaxed via energy minimization and short molecular dynamics simulations with positional restraints using the AMBER42 suite of programs in conjunction with ff14SB,43 TIP3P,44 and GAFF45 plus AM1BCC46 force field parameters for the protein, water, and ligand, respectively.
To assess the overall accuracy of the ZIKV E homology model, several methods were employed. First, it was compared to a lower-resolution cryo-EM structure of the entire ZIKV (PDB entry 5IRE)7 and demonstrated a fold nearly identical to that of the E protein structure found on the viral surface.47 The homology model was also compared to a higher-resolution ZIKV E crystal structure (without BOG) in complex with an antibody (PDB entry 5JHM)5 that was published after our screening campaign was underway (see Results and Discussion). The online servers MolProbity48 and PROCHECK49 were also used to check the accuracy of various facets of the homology model with respect to the original DENV-E template (see Results and Discussion).
Docking Setup
The ZIKV E/BOG model was subsequently prepared for docking using well-tested setup protocols30 previously employed by our group in successful virtual screening campaigns targeting HIV gp41,50−53 fatty acid binding protein,54,55 botulinum neorotoxin,56,57 HER2,58 and Ebola glycoprotein 2.59 Briefly, we start by extracting the MD-relaxed coordinates for the protein (ZIKV E) and reference ligand (BOG) and saving them separately in the MOL2 format required for DOCK6. Then, docking spheres are generated over the surface of the protein corresponding to regions of high concavity.60 Spheres within 8 Å of the reference ligand were retained and used to guide docking of candidate molecules. Next a bounding box was constructed that included an 8 Å margin in the x, y, and z dimensions from the reference ligand. The bounding box was then decomposed into a docking grid with a spacing of 0.3 Å with electrostatic (ES) and van der Waals (VDW) energies being computed and stored at each grid point.61 The ES interactions employed a distance-dependent dielectric of 4r, and the VDW term employed a softened 6-9 potential; together, they define the DOCK single-grid energy (SGE) score. Figure 3 provides a visual representation of the overall setup.
Figure 3.
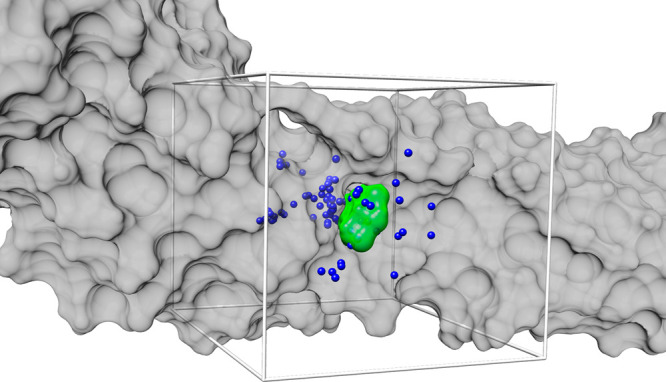
Docking setup targeting the BOG ligand binding site showing ZIKV E as a gray surface, the BOG reference ligand as a green surface, docking spheres colored blue, and the docking grid bounding box colored light gray.
Virtual Screening Protocol
For the virtual screen, a library containing more than 4 million “druglike” molecules (N = 4121252) was downloaded from the ZINC62 database in MOL2 format. The molecules were prefiltered on the basis of several criteria, including a formal charge range from −2 to +2, a molecular weight range from 250 to 500 g/mol, and a logP range from −1 to 5. These filtering criteria help narrow the chemical search space and focus the prioritization further down the line. The entire library was then docked into the ZIKV E homology model by means of the FLX protocol, as outlined in previous work,50−59 using the docking grids as defined above. After FLX docking, each docked pose was energy minimized off the grid in Cartesian space using a harmonic restraint and nine different scoring functions were used to generate nine individual “Primary Rank” lists comprised of the 100000 top-scoring compounds as ranked by each function.
Scoring functions employed in this work include the following: (1) DOCK Cartesian energy (DCEVDW+ES) score, which quantifies the sum of the protein–ligand nonbonded ES and VDW energies; (2) footprint similarity (FPSVDW+ES) score, which quantifies the degree of Euclidian overlap between per-residue ES and VDW energy decompositions for a reference (i.e., BOG) and a candidate ligand (i.e., from a screen) and can be broken down into individual (3) FPSES and (4) FPSVDW components; (5) pharmacophore matching similarity (FMS) score, which quantifies similarity between two compounds in terms of pharmacophore feature overlap; (6) Hungarian matching similarity (HMS) score, which provides an RMSD-like measure between two compounds based on atom type pair comparisons and three-dimensional (3D) distance; (7) volume overlap similarity (VOS) score, which quantifies similarity between two compounds on the basis of an overlap between all ligand atoms, hydrophobic and hydrophilic atoms, or positively and negatively charged atoms; (8) total (TOT) score, which combines DCEVDW+ES and FPSVDW+ES; and (9) descriptor (DES) score, which is a user-defined weighted sum of any of the scoring functions mentioned above. Each of the nine “primary rank” lists, each comprised of 100000 molecules, was then re-ranked using all nine scoring functions again to derive 81 unique “secondary rank” lists (9 × 9 = 81 lists total) from which the 1000 top-scoring members each were saved for compound selection.
The two-stage ranking scheme outlined above helps guarantee diversity in the compounds chosen for experimental characterization and allows for multiple avenues of chemical space to be explored using data from the same large-scale docking experiment. Additionally, unlike in earlier work in which we employed only DCEVDW+ES as the primary rank function, the updated protocol employed here guarantees that the top compound in each of the nine scoring spaces can be identified from the entire group of 4 million compounds docked (instead of 100000 as in earlier work). Docked compounds were then prioritized using a variety of criteria, including their energy and similarity scores, 3D visualization, and other molecular properties (discussed in Results and Discussion). A subset of available compounds was purchased through vendors MolPort (www.molport.com) and Enamine (www.enamine.net) for experimental testing. Figure 4 outlines the overall procedure.
Figure 4.
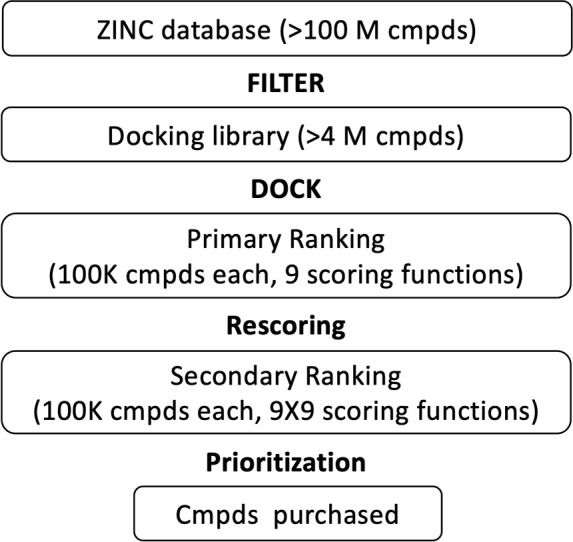
Virtual screening workflow.
Aggregation, PAINS, and Promiscuity Filters
To probe whether the activity of hit compounds might be a result of nonspecific effects, we employed the following online search tools: (1) The server Aggregate Advisor (advisor.bkslab.org)63 was used to assess if any hits were previously reported to be, or were similar to, colloidal aggregators. (2) The servers SWISS ADME,64 CBLigand,65 and FAF-Drugs66 were used to assess if any hits had potential PAINS liabilities. (3) The server Pubchem67 was used to assess if any hits had been previously reported to have experimental activity against other targets, which could suggest promiscuity.
Molecular Dynamics and Free Energy Calculations
MD simulations for the most promising hit compounds were performed to assess the energetic and geometric stability in the binding pocket and obtain free energy of binding estimates. Methods and numerical results from the MD simulations are provided in the Supporting Information.
Compounds and Controls
Candidate inhibitors were obtained from the chemical sourcing supplier Molport (www.molport.com). NITD008 (NR-36199) was obtained through BEI Resources, National Institute of Allergy and Infectious Diseases (NIAID), National Institutes of Health (NIH), as part of the World Reference Center for Emerging Viruses and Arboviruses (WRCEVA) program. Emricasan is an antiapoptotic pan-caspase inhibitor (Sigma). All compounds and controls were dissolved in dimethyl sulfoxide (DMSO).
Cell Lines and Virus
Vero cells (ATCC CCL-81) were cultured in Dulbecco’s modified Eagle’s medium (Corning) supplemented with 10% heat-inactivated FBS (Gemini Bio-Products) containing 100 μg/mL streptomycin and 100 units/mL penicillin (DMEM-PS-10% FBS) in a 37 °C incubator with a 5% CO2 atmosphere.
Zika strain MR766 (NR-50065) was obtained through BEI Resources, NIAID, NIH, as part of the WRCEVA program. The virus was propagated in Vero cells. Briefly, 80–90% confluent cells were infected with a MOI of 0.01. The virus was allowed to adsorb for 1 h at 37 °C. Infection medium (DMEM-PS-2% FBS) was added, and the cells were incubated for 7–10 days until a cytopathic effect (CPE) was observed, at which point the supernatant was collected and clarified by low-speed centrifugation followed by filtration with a 0.45 μm pore size filter (Millipore). The filtered supernatant was flash-frozen and stored at −80 °C.
Infectious units (IU) of virus stocks were determined by an end point dilution assay and calculated using the Reed and Muench method.68−70 Briefly, Vero cells were plated onto a 96-well plate. Aliquots of serial dilutions of the virus were added to the wells and then scored for the presence of CPE.
Cell Viability Assay and Compound Cytotoxicity
Vero cells were seeded at a density of 1 × 10⁴ cells/well in 96-well tissue culture treated plates (Greiner). The next day, the medium was removed and the cells were infected with virus that had been pretreated with selected compounds or controls at 37 °C for 1 h. Plates were incubated for 3 days. Cell viability was measured using the CellTiter-Fluor Cell Viability Assay (Promega) according to the manufacturer’s protocol using a Spectra Max M5 plate reader (Molecular Devices). All experiments were performed in triplicate. The experiment was performed in the absence of virus to determine the toxicity of the selected compounds and controls.
The 50% Tissue Culture Infectious Dose (TCID50) Assay
TCID50 values were determined by an end point dilution assay. Briefly, Vero cells were seeded at a density of 2 × 10⁴ cells/well in a 96-well plate. The next day, the medium was replaced with serial dilutions of the virus or virus that had been pretreated with selected compounds or controls at 37 °C for 1 h. After 6 days at 37 °C, the cells were fixed with 3.7% formaldehyde, washed, and stained with crystal violet. The wells were scored for the presence of CPE, and the TCID50 value was calculated using the Reed and Muench method.68−70
Caspase Activity Assay
Caspase activity was measured using a luciferase reporter. Briefly, Vero cells were seeded at a density of 1 × 10⁴ cells/well in 96-well tissue culture treated plates (Greiner). The next day, the medium was removed and the cells were infected with virus that had been pretreated with selected compounds or controls at 37 °C for 1 h. Plates were incubated for 3 days. Cell viability was first measured using the CellTiter-Fluor Cell Viability Assay (Promega), and then caspase activity was measured using the Caspase-Glo 3/7 Assay System (Promega) according to the manufacturer’s protocol using a Spectra Max M5 plate reader (Molecular Devices). All experiments were performed in triplicate. Additionally, for the dose–response assay, the 50% inhibitory concentration (IC50) was computed and plotted using Prism 8.4 (GraphPad Software, La Jolla, CA).
Results and Discussion
Homology Model Validation for the ZIKV E/BOG Complex
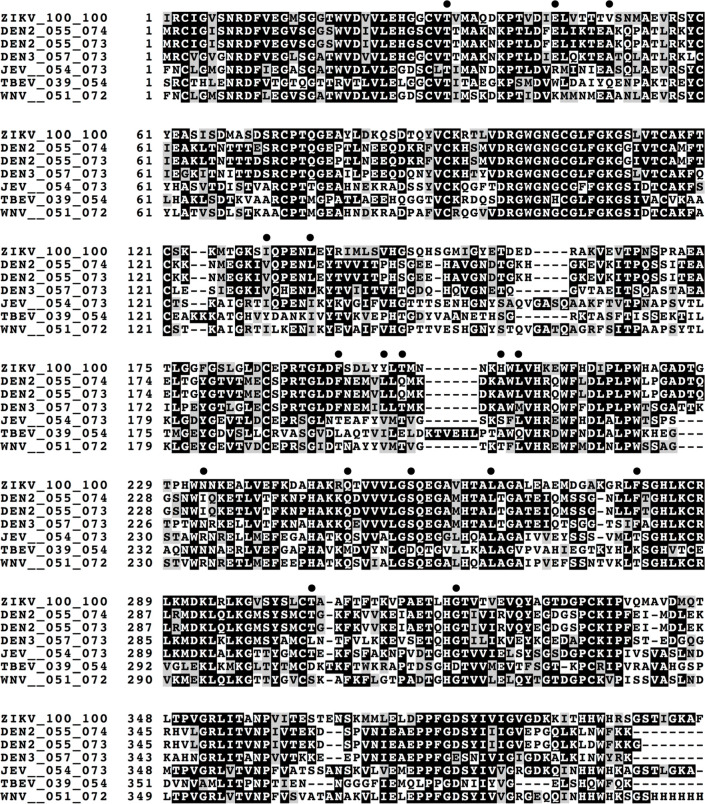
The ZIKV E structure used in this study for virtual screening and molecular dynamics simulations was constructed via homology modeling using publicly available coordinates (PDB entry 1OKE)10 of the analogous dengue virus protein (DENV E) complexed with BOG as described in Methods. Figure 5 shows sequence alignments using BLAST for ZIKV E (sequence 1) with the DENV E template from PDB entry 1OKE (sequence 2) and other analogous proteins for which crystallographic structures were available: dengue, Japanese encephalitis virus, tick-borne encephalitis virus, and West Nile virus. Here, values next to each sequence ID represent the percent identity and percent similarity compared to the first ZIKV sequence (top row). The relatively high levels of identity (55%) and similarity (74%) between ZIKV E and DENV E help to ensure that atomic-level models for Zika complexed with BOG can be built with a high degree of confidence. The even higher levels of identity (65%) and similarity (76%) for residues within 5 Å of BOG in the 1OKE template (filled circles) suggest it may be possible to design compounds that could target both viruses.
Figure 5.
Comparison of sequences (first 399 residues only) of glycoprotein E from Zika virus (ZIKV) with available X-ray structures of glycoprotein E from dengue virus type 2 (DEN2, PDB entry 1OKE), dengue virus type 2 (DEN2, PDB entry 1TG8), dengue virus type 3 (DEN3, PDB entry 1UZG), Japanese encephalitis virus (JEV, PDB entry 3P54), tick-borne encephalitis virus (TBEV, PDB entry 1SVB), and West Nile virus (WNV, PDB entry 2HG0). Multisequence alignments and this figure were generated using Clustal Omega (www.ebi.ac.uk) and Boxshade (embnet.vital-it.ch) servers. Filled circles represent residues within 5 Å of BOG based on PDB entry 1OKE (DEN2, sequence 2).
The coordinates of the refined ZIKV E homology model were submitted to two online servers, MolProbity48 and PROCHECK,49 to assess the integrity of the 3D structure (Table 1). The atom–atom contact clashes, Ramachandran backbone dihedral angle distributions, and bond lengths and angle distributions were assessed, among other criteria. As expected, on the basis of the high level of sequence similarity, the ZIKV E model overall shows comparable and, interestingly in some cases, improved scores relative to the crystal structure template used to create the model. For example, MolProbity analysis shows more favorable scores in five of six categories (Table 1, bold entries), including the overall MolProbity score of 2.33 (ZIKV E) versus 3.10 (DENV E). This is likely a result of the model being subjected to energy minimization and equilibration steps. Analysis using the program PROCHECK also suggests a reasonable homology model with most of the eight categories yielding similar values, although, in this case, the model outscored the template in only three of the eight categories. Overall, the homology model appears to be comparable to the template in terms of favorable characteristics from a protein structure perspective.
Table 1. Structure Validation for the ZIKV E/BOG Homology Model.
| 1OKE templatea (DENV E) | homology modela (ZIKV E) | |||
|---|---|---|---|---|
| atom contacts | Clashscore | 21.37 (59th percentile) | 4.46 (95th percentile) | |
| MolProbity | protein geometry | poor rotamers | 32 (9.36%) | 19 (5.94%) |
| favored rotamers | 280 (81.87%) | 273 (85.31%) | ||
| Ramachandran outliers | 6 (1.53%) | 8 (2.25%) | ||
| Ramachandran favored | 354 (90.31%) | 323 (90.99%) | ||
| MolProbity score | 3.10 (24st percentile) | 2.33 (57th percentile) | ||
| PROCHECK | Ramachandran plot | most favored | 81.8% | 84.3% |
| additional allowed | 17.6% | 14.0% | ||
| generously allowed | 0.6% | 1.2% | ||
| disallowed | 0.0% | 0.6% | ||
| residue stereochemistry | Morris classification | 1,2,3 | 1,2,2 | |
| bad contacts | 6 | 1 | ||
| overall properties | G-factors | 0.13 | –0.34 | |
| planar groups | 98.4% | 92.2% |
Bold entries indicate more favorable characteristics.
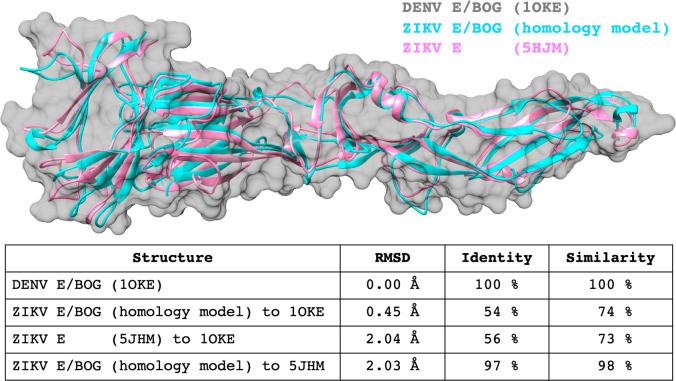
Figure 6 shows backbone comparisons among the DENV E/BOG template (PDB entry 1OKE), the final, refined ZIKV E/BOG homology model, and a structure of ZIKV E without BOG (PDB entry 5JHM) published after our study was initiated. As expected, both ZIKV E structures show tight backbone overlap compared to DENV E. Specifically, compared to the DENV E template (PDB entry 1OKE), the refined ZIKV E/BOG homology model yielded a backbone RMSD of 0.45 Å and the subsequently reported ZIKV E structure without BOG yields a backbone RMSD of 2.04 Å. An alignment between the ZIKV E/BOG homology model and the ZIKV X-ray structure without BOG is also reasonable (2.03 Å). The nonperfect identity (97%) between the ZIKV E/BOG model and the published ZIKV E X-ray structure (PDB entry 5HJM) results from minor differences in virus strain (MR766 vs SZ01). For this work, we chose to construct a homology model using the same amino acid sequence of the ZIKV E construct to be employed in the experimental testing of candidate inhibitors. Overall, the structural analysis strongly suggests that the ZIKV E/BOG homology model can be used for virtual screening.
Figure 6.
Backbone alignment comparisons for the DENV E/BOG template (PDB entry 1OKE, gray surface), the refined ZIKV E/BOG homology model (cyan), and a ZIKV E structure without BOG (PDB entry 5JHM, pink) published after this study was initiated. Backbone RMSD values computed with Chimera.71 Sequence identity and similarity computed with BLAST.35
Virtual Screen Outcomes and Compound Selection
Visual inspection of the docking results using Chimera,71 coupled with consideration of a number of molecular properties, including the molecular weight, the number of rotatable bonds, the number of chiral centers, the formal charge, the number of Lipinski violations, the presence of intermolecular hydrogen bonds, among others, led us to prioritize 149 compounds from among the 9 × 9 = 81 lists of top-scored molecules derived from primary rank and secondary rank protocols as described in Methods. Of the 149 prioritized compounds, 11 were found in two of the 10 lists considered and one appeared in three of 10. Of the 137 remaining unique compounds, vendor availability led us to purchase 53 compounds for experimental testing. For the 12 compounds that appeared in more than one list, only two were available for purchase. As suggested by a reviewer, a potential useful approach would have been to identify similar compounds that are available and employ docking to identify equally or nearly equally good matches. Table 2 outlines which primary rank and secondary rank methods comprised the 10 different lists used in prioritization and purchase.
Table 2. Primary Rank and Secondary Rank Prioritization and Purchase Criteria for Compounds Docked to ZIKV E.
| list number | primary ranka | secondary ranka | no. of compounds prioritized | no. of compounds purchased |
|---|---|---|---|---|
| 1 | DCEVDW+ES | FPSVDW+ES | 21 | 11 |
| 2 | DCEVDW+ES | FPSVDW | 26 | 8 |
| 3 | DCEVDW+ES | FPSES | 17 | 10 |
| 4 | DCEVDW+ES | VOS | 17 | 3 |
| 5 | DCEVDW+ES | TOT | 5 | 4 |
| 6 | DES | DCEVDW+ES | 5 | 2 |
| 7 | FPSVDW+ES | FPSVDW+ES | 9 | 5 |
| 8 | FPSES | VOS | 7 | 4 |
| 9 | TOT | VOS | 9 | 1 |
| 10 | VOS | DCEVDW+ES | 33 | 5 |
| total | 149 | 53 |
See Methods for scoring function definitions.
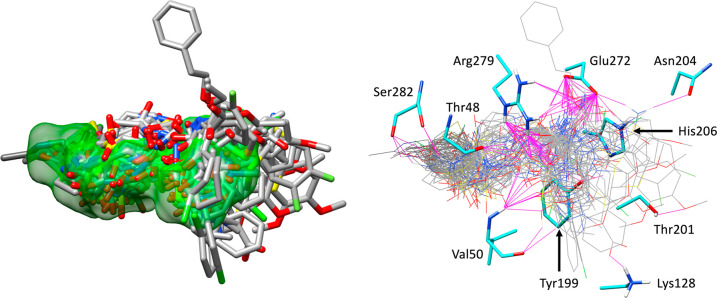
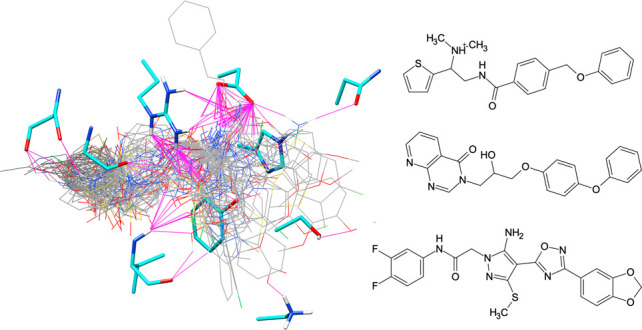
It should be noted that although the virtual screening protocol presented here led to 81 different rank-ordered lists, ultimately, a subset of only 10 lists was retained in this first selection round (Table 2). However, this does not preclude the possibility that it would be worthwhile to pursue or examine compounds in other lists more carefully at some future date. Favorable protein–ligand interactions are known to be fundamental for binding; thus, five of the 10 lists in Table 2 include DCEVDW+ES as the primary rank scoring function. However, as larger molecules with higher molecular weights tend to produce more favorable DCEVDW+ES energies, consideration of MW bias is also important. The similarity-based methods employed in Table 2 as secondary rank scoring functions help to alleviate MW bias while at the same time enable the identification of compounds with features similar to those of a user-defined reference (in this case, BOG). For example, secondary ranking based on FPSVDW+ES, FPSVDW+ES, or FPSES (Table 2, lists 1–3), in this case, can be used to identify candidates that make van der Waals and/or electrostatic footprints (per residue energy maps) similar to those of BOG. Importantly, FPS methods have the ability to identify new compounds that make comparable interactions to a known reference in per-residue energy space but with diverse chemical topology. Volume overlap similarity (VOS) scoring is another secondary ranking function in Table 2 that can also reduce potential MW bias through matching the 3D property-based volume of a reference ligand. The goal in both cases is to leverage 3D information about a known binder in an attempt to enrich for compounds that will have experimental activity. The left panel of Figure 7 displays the docked poses of all 53 purchased compounds in the ZIKV E site (protein residues hidden for the sake of clarity) for comparison with the volume envelope made by BOG (green). The right panel of Figure 7 shows the same group of 53 candidates and the binding site residues (cyan) likely involved in hydrogen bonding (magenta, Chimera71), in particular, Glu272 and Arg279. Overall, the DOCK6 poses for the purchased compounds appear to be well-contained within the binding pocket region defined by BOG.
Figure 7.
All 53 purchased compounds (left, gray) as docked into the BOG binding site. Protein residues omitted for the sake of clarity, BOG reference shown as a green surface. Predicted hydrogen bonding interactions (right, magenta) for the 53 candidates (gray) with nearby ZIKV E residues (cyan).
Cytotoxicity of the 53 Candidates Prioritized from the DOCK Virtual Screen
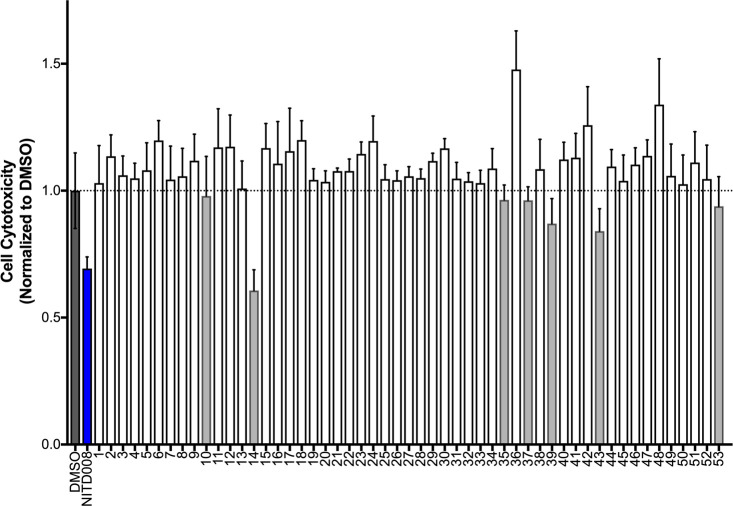
The compound cytotoxicity of the 53 candidates, along with the positive control NITD008, was measured to determine the concentration at which subsequent activity assays would be performed. In general, a majority of compounds showed no cytotoxicity under these conditions at 25 μM (Figure 8). However, seven candidates (gray bars at 10, 14, 35, 37, 39, 43, and 53) showed some cytotoxicity and thus were tested at 10 μM in all subsequent assays. Here, the positive control adenosine analogue NITD008, a known inhibitor with activity against dengue virus,72 West Nile virus,73 tick-born flaviviruses,74 and Zika virus,75 appears to have some cytotoxicity under these same conditions.
Figure 8.
Compound cytotoxicity for 53 candidate compounds and positive control NITD008 (blue). Gray bars represent seven candidates with cytotoxicities of <1 (dashed horizontal bar). Compounds tested in triplicate at 25 μM.
Effect of 53 Candidates on Cell Viability in the Presence of Virus
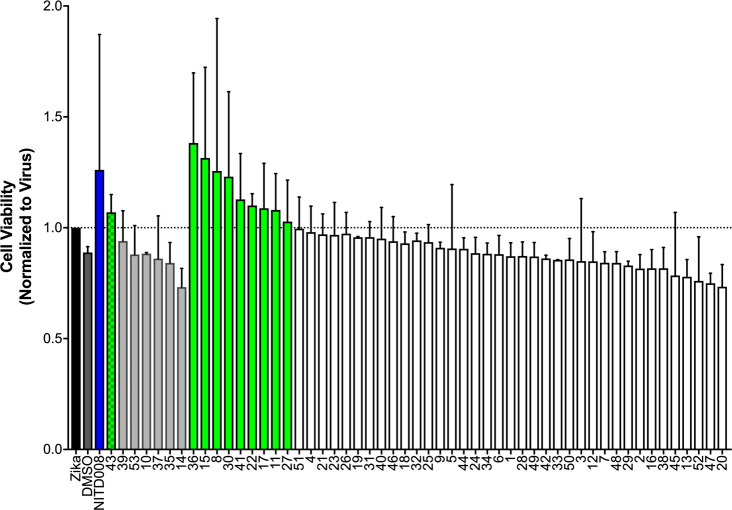
The 53 candidates were then tested in a cell viability assay to assess their capacity to inhibit cell death from Zika infection. Figure 9 presents the results with cell viability ordered from high to low. Encouragingly, relative to the NITD008 control (blue) tested at 25 μM, which is effective at keeping cells alive in the presence of virus, one of the candidates tested at 10 μM and nine of the candidates tested at 25 μM also showed mean cell viability values of >1 (green bars). These 10 compounds (Figure 9, green) were flagged as “preliminary hits” from the cell viability assay.
Figure 9.
Cell viability results for 53 candidate compounds compared to the positive control NITD008 (blue). The data were normalized to ZIKV-infected cells. Values over 1 signifies inhibition of ZIKV-induced cell killing. Candidates 14–43 tested at 10 μM, all other candidates and the control NITD008 tested at 25 μM. Each group ordered by activity from high to low. Green bars represent candidates with mean activity of >1.
Effect of 53 Candidates on TCID50 Infectivity
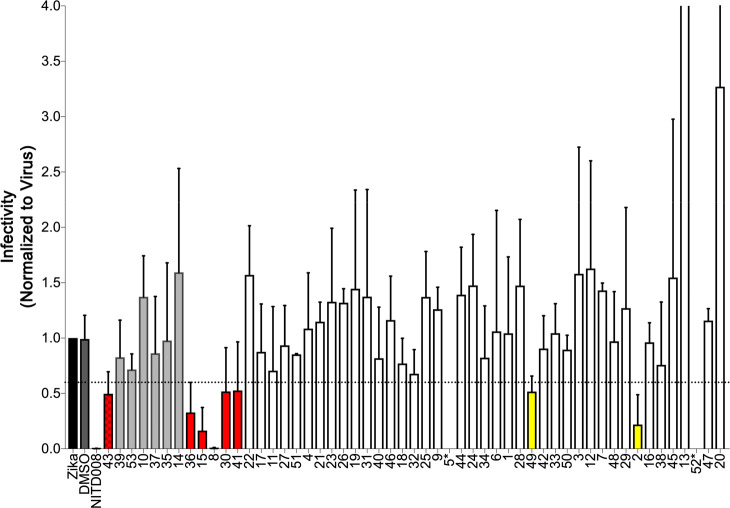
The activity of the 53 candidates was also examined using a TCID50 end point dilution assay as shown in Figure 10. For the sake of simplicity, the ordering of results in Figure 10 is the same as in the cell viability plot (Figure 9). Here, the six compounds colored red are those that inhibited infectivity to a level of <0.6 (Figure 10, dotted line) in the TCID50 assay and showed values of >1.0 in the cell viability assay, signifying inhibition of the cell killing capability of the virus (Figure 9, dotted line). While other preliminary hits from either the cell viability assay (Figure 9, compounds 11, 17, 22, and 27 colored green) or the TCID50 assay (Figure 10, compounds 2 and 49 in yellow) might be worth exploring, we elected to focus our remaining efforts only on the subset of six that showed the best activity across both assays (candidates 8, 15, 30, 36, 41, and 43). Figure 11 illustrates that the six hits (red) cluster into the bottom right quadrant of an X–Y scatter plot (cell viability of >1.0, TCID50 of <0.6) with the known control inhibitor NITD008 (blue). By visual inspection, with the exception of approximately three outliers, it is gratifying that the two assays show a roughly negative linear correlation (as expected).
Figure 10.
TCID50 infectivity results for 53 candidate compounds compared to the positive control NITD008 (blue). Candidates 14 and 43 were tested at 10 μM; all of the other candidates and the NITD008 control were tested at 25 μM. Red bars represent candidates that inhibited infectivity to <0.6 (horizontal dotted line) in the TCID50 assay and >1.0 in the cell viability assay. Yellow bars represent candidates with TCID50 activity but not flagged as active in the cell viability assay. Candidates 5* and 52* did not yield results in the TCID50 assay.
Figure 11.
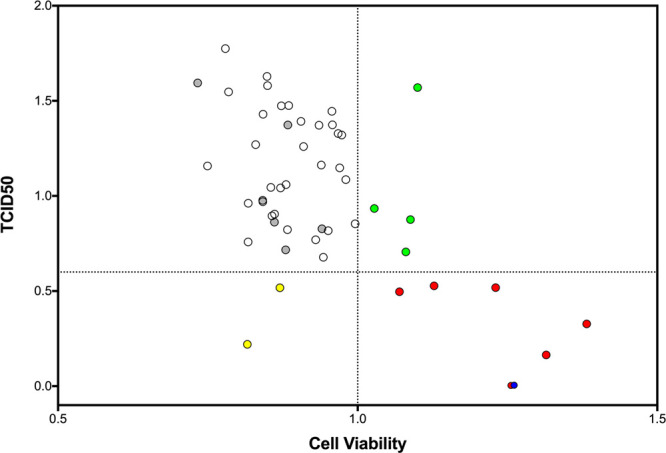
X–Y scatter plot defining activity from cell viability (>1.0 cutoff) and TCID50 (<0.6 cutoff) assays. Compounds colored red (8, 15, 30, 36, 41, and 43) and blue (NITD008 control) were active in both assays. Compounds colored green (11, 17, 22, and 27) or yellow (2 and 49) were active in one assay.
Caspase Activity of the Six Most Promising Hits
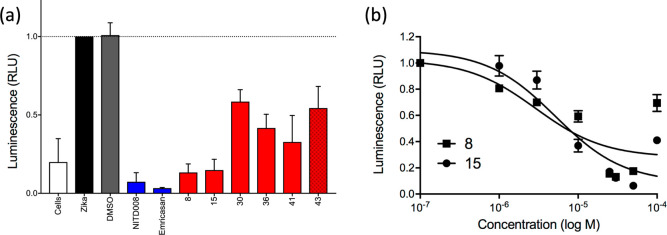
Lastly, as shown in Figure 12a, we employed a caspase activity assay to characterize the six hits (8, 15, 30, 36, 41, and 43) relative to two known controls: NITD008 (ZIKA virus inhibitor) and emricasan (pan-caspase inhibitor). Caspase activity is indicative of programmed cell death; thus, a weaker signal signifies a healthier or more fit population of cells. As expected, cells alone had relatively low caspase activity (Figure 12a, white), while the populations infected with virus (Figure 12a, black) or virus with DMSO (Figure 12a, gray) had high caspase activity. The two positive controls suppressed caspase activity in Zika-infected cells. Encouragingly, the six candidates all showed caspase activity lower than that of virus alone, or virus with DMSO, indicating inhibition of Zika-induced apoptosis. In particular, compounds 8 and 15 (tested at 25 μM) and 43 (tested at 10 μM) appeared to provide significant protection from caspase activation. Figure 12b shows dose–response behavior for compounds 8 and 15 that under these conditions yield estimated IC50 values of 2.9 ± 2.1 and 5.2 ± 1.5 μM, respectively.
Figure 12.
(a) Caspase activity for hit compounds (red) and two controls (blue). Compound 43 tested at 10 μM. All other compounds, including controls, tested at 25 μM. (b) Caspase dose–response results for compounds 8 (■) and 15 (●).
Structures and Properties of the Most Promising Candidates
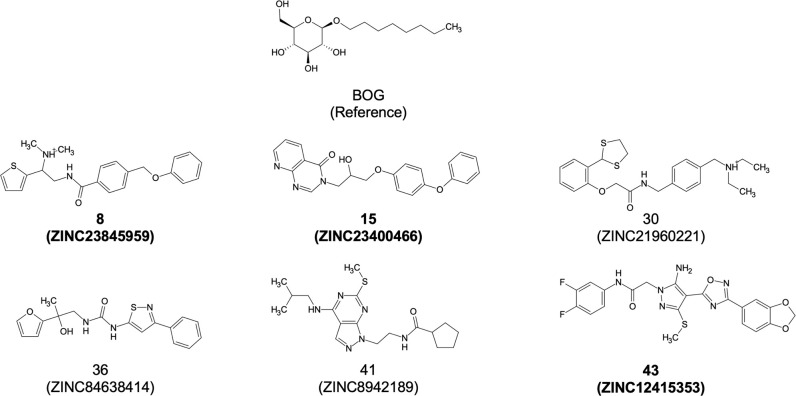
Figure 13 and Table 3 compare the BOG reference with the six hits identified from the virtual screen in terms of their two-dimensional (2D) structures (Marvin Sketch),76 basic molecular properties, and DOCK scores. The 2D structures in Figure 13 highlight that the hits are roughly the same size with respect to BOG, which is likely to be important as larger structures could extend out into a solvent-exposed region of the binding site, which would not favor binding. In terms of properties, Table 3 indicates which primary and secondary scoring functions were used to identify the compounds, along with their molecular weight (MW), the number of ligand rotatable bonds (#RB), the ligand formal charge (FC), the DOCK VDW+ ES energy (DCEVDW+ES), the footprint VDW+ES similarity (FPSVDW+ES), and the volume overlap similarity (VOS) scores. Notably, the six hits all derive from FPSVDW+ES, FPSVDW, or VOS secondary scoring lists (Table 3, Sec Rnk column), which provides compelling evidence that the similarity-based methods applied here can leverage information on a “known binder” to help identify active compounds that can make comparable interactions with the desired target.
Figure 13.
Structures, codes, and ZINC ids for the BOG reference and six hit compounds. Bolded entries indicate the three compounds that appeared to have the greatest activity across the three different assay types (cell viability, TCID50, and caspase).
Table 3. Prioritization Criteria, Molecular Properties, Similarity Scores, Potential Colloidal Aggregation, PAINS, and Promiscuity Alerts for Six Hit Compounds Showing Anti-ZIKV Activity.
| ID | Pri Rnka | Sec Rnkb | MWc | #RBd | FCe | DCEVDW+ESf | FPSVDW+ESg | VOSh | Aggi | PAINSj | Prok |
|---|---|---|---|---|---|---|---|---|---|---|---|
| BOG | 292.37 | 9 | 0 | –41.00 | 0.00 | 1.00 | no | no | no | ||
| 8 | DCEVDW+ES | FPSVDW | 381.52 | 9 | +1 | –54.34 | 9.35 | 0.45 | no | no | no |
| 15 | DCEVDW+ES | VOS | 389.41 | 8 | 0 | –52.50 | 4.77 | 0.56 | no | no | no |
| 30 | DCEVDW+ES | FPSVDW | 431.65 | 11 | +1 | –53.84 | 5.81 | 0.35 | no | no | no |
| 36 | FPSES | VOS | 343.41 | 8 | 0 | –46.41 | 4.10 | 0.52 | no | no | no |
| 41 | DCEVDW+ES | FPSVDW+ES | 376.53 | 9 | 0 | –53.87 | 5.21 | 0.52 | no | no | no |
| 43 | DCEVDW+ES | FPSVDW+ES | 486.46 | 8 | 0 | –55.00 | 6.15 | 0.36 | no | no | no |
| average (N = 6)l | ⟨401.50⟩ | ⟨8.8⟩ | ⟨0.33⟩ | ⟨−52.66⟩ | ⟨5.90⟩ | ⟨0.46⟩ | |||||
Primary scoring function used to rank docked compounds.
Secondary scoring function used to rerank the top 100000 compounds ranked by the primary scoring function.
Molecular weight (grams per mole).
Number of ligand rotatable bonds.
Ligand formal charge.
DCEVDW+ES = DOCK VDW + ES energy (kilocalories per mole).
FPSVDW+ES = footprint VDW+ES similarity score (kilocalories per mole).
Volume overlap similarity score.
Aggregate Advisor63 server employed to check for colloidal aggregation.
Pubchem67 server employed to check for promiscuity (i.e., was the compound previously reported to have activity against other targets?). Compound 43 was reported as having been tested against three other targets but found to be inactive.
Average values for the six hit compounds.
Despite their roughly similar size (Figure 13, 2D pictures) and number of rotatable bonds (Table 3, #RB), it is interesting to note that the average MW of the six hits is significantly larger than for BOG (average values of 401.50 g/mol vs 292.37 g/mol). The increased MWs stem from a replacement of the BOG alkane tail with larger, more hydrophobic ringed structures (Figure 13), which leads to enhanced DCEVDW+ES interactions with the targeted site (average of −52.66 kcal/mol vs −41.00 kcal/mol). Examination of other properties reveals that four of the six hits have the same ligand formal charge (Table 3; FC = 0) as BOG, and the generally favorable (closer to zero) footprint similarity scores (Table 3; average FPSVDW+ES of 5.90) indicate reasonable molecular mimicry of BOG in terms of steric and electrostatic attributes (see the next section).
Table 3 also indicates whether these six compounds were previously reported as being related to a known colloidal aggregator, contained potential PAINS liabilities, or were promiscuous in terms of showing activity in multiple assays or assay types across different targets. On the basis of available online searching tools that include Aggregate Advisor63 (colloidal aggregation), SWISS ADME,64 CBLigand,65 FAF-Drugs66 (PAINS), and Pubchem67 (promiscuity), none of the six hits had been previously flagged for these undesirable properties. At the time of the searches, only 43 (ZINC12415353) had been reported as being screened against other targets (Klebsiella pneumoniae, FANCM/RMI) but was found to be inactive.77
Predicted Binding Geometries for Hit Compounds
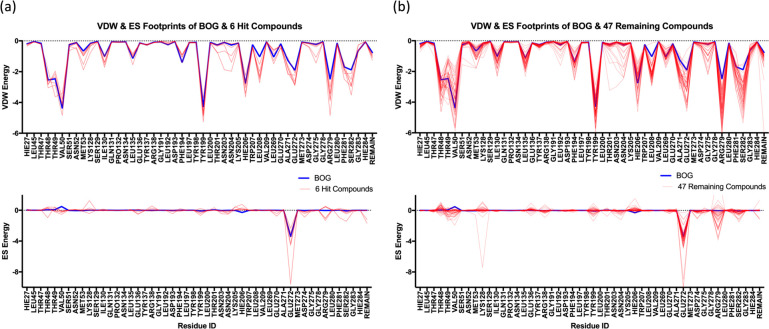
Visualization of DOCK poses (Figure 14) for the six hits showed, as expected, that the compounds are well-contained within the BOG binding envelope (green surface) and that the larger hydrophobic groups are positioned toward the back of the pocket normally occupied by the alkane tail of BOG. Quantitatively, the accompanying footprint plots (Figure 15) illustrate how docked compounds (red lines) can mimic the interaction patterns made by the BOG reference (blue lines) in terms of specific VDW or ES interactions (position and magnitude). For example, as shown in Figure 15a, the six hits show significant overlap with the patterns made by BOG, including the nine most favorable peaks (≳−2 kcal/mol) at residues Thr48, Thr49, Val50, Tyr99, His206, Glu272, Arg279, Phe281, and Ser282 in the VDW plots (top), and the most favorable peak (∼−3 kcal/mol) at residue Glu272 in the ES plots (bottom). The dominant Glu272 electrostatic interaction made by BOG and the six hits in Figure 15b, and to a lesser extent the smaller favorable peak observed at Arg279 for some of the compounds, coincide with hydrogen bonds as illustrated in Figure 14 (magenta lines).
Figure 14.
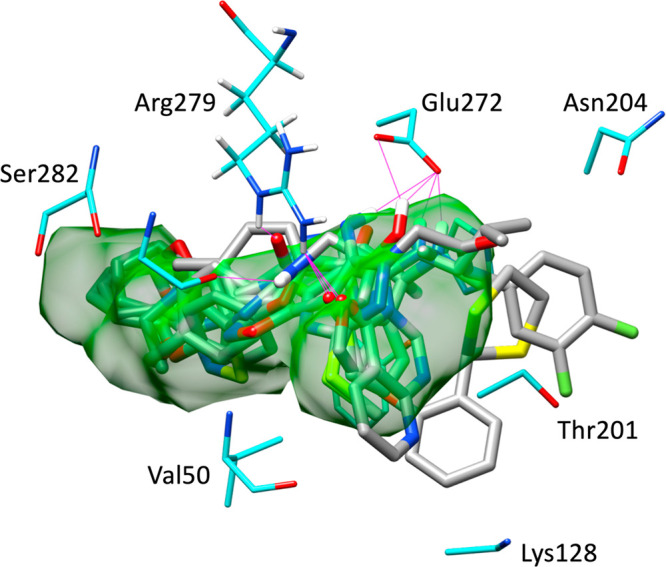
DOCK-predicted binding poses for the six hit compounds (gray) compared to BOG (green surface) in the ZIKV E binding site (cyan). Potential hydrogen bonds colored magenta.
Figure 15.
Footprint comparisons for experimentally tested compounds (red lines) compared to the BOG reference (blue lines) grouped into (a) the six most active hits and (b) the 47 remaining compounds separated into VDW (top panels) and ES (bottom panels) per-residue contributions. Energies in kilocalories per mole.
Conversely, Figure 15b shows footprints for the remaining 47 tested compounds that yielded lower or less consistent activity across both assays (cell viability and TCID50). Interestingly, on a case-by-case basis, inspection reveals that some ligands in the inactive group (Figure 15b, top) make less favorable VDW interactions compared to BOG (or the active group in Figure 15a, top) at specific residues such as Thr49, Val50, Ile130, Leu135, Phe194, and His206. A slightly unfavorable ES interaction with Arg279 for a number of the inactive candidates was also observed (Figure 15b, bottom). This could suggest that targeting these residues (or combinations thereof) is most important for activity. On the contrary, because many ligands in the inactive group yield more favorable interactions at specific residues, an increased interaction energy alone is insufficient to explain the activity trends. In any event, as a general rule, the six compounds in the active group (Figure 15a) appear to more tightly mimic the footprint made by the BOG reference than the inactive group (Figure 15b).
Energetic and Geometric and Stability for Hit Compounds
As an additional means to characterize the most promising compounds, all-atom molecular dynamics (MD) simulations were employed to simulate each ZIKV E complex to evaluate energetic and geometric stability (four independent runs each) starting from each DOCK pose. To gauge energetic stability, free energies of binding (ΔGbind) were estimated via the MM-GBSA single-trajectory method with errors estimated using ACF and BASEM analysis as in previous work (see Table S1).55,78,79 For BOG, the analysis yielded a favorable (average) ΔGbind value of −38.17 kcal/mol (Table S1). As expected, average ΔGbind values for the hits were also favorable, although the values were reduced compared to that of BOG [−24.02 to −33.46 kcal/mol vs −38.17 kcal/mol (Table S1)]. This was somewhat surprising given that the initial DCEVDW+ES scores for the hits were in fact more favorable than BOG [−46.41 to −55.00 kcal/mol vs −41.00 kcal/mol (Table 3)]. The conflicting results likely stem from inherent differences in the two methods employed (single-point DOCK calculations vs ensemble-based MD calculations that include desolvation). Despite the discrepancy, it is interesting to note that for compound 8 in particular, the two most favorable ΔGbind values obtained were similar to that of BOG [−37.94 and −38.69 kcal/mol vs −38.36 and −40.36 kcal/mol (Table S1)]. Overall, while more computationally expensive methods that employ more complete estimates of entropy would be required to predict relative free energies between these compounds with greater accuracy, the analysis does support that all of the hits interact favorably within the binding site defined by BOG.
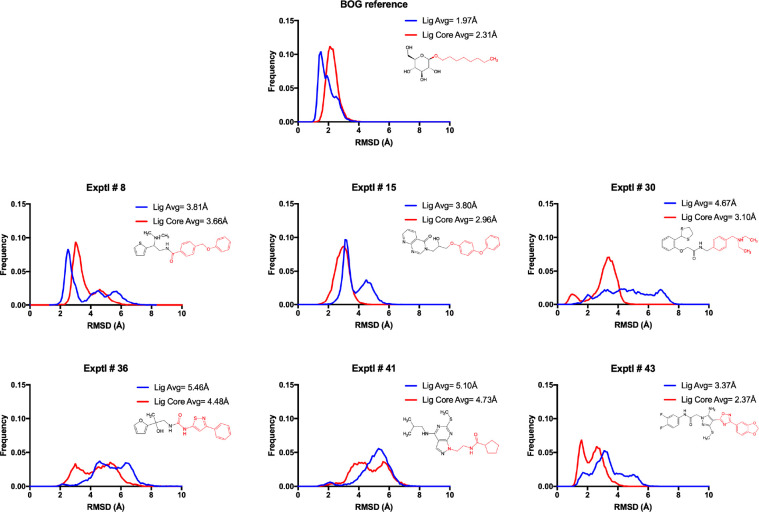
To gauge geometric stability, RMSD values for ligands were computed relative to their respective DOCK pose as shown in Figure 16, which plots aggregate values as histograms. Values for each individual run are listed in Table S1. The simulations of the BOG complex were well-behaved with relatively low RMSDs (average of 1.97 Å), indicating that the compound remained close to the initially modeled conformation. For the six hits, although average RMSDs with respect to the initially docked conformations were larger (3.37–5.46 Å), for three of the compounds (8, 15, and 43), there were also significant populations with smaller RMSDs as a result of several of the independent trajectories being <3.5 Å, for example, 8#1, 8#4, 15#3, 43#1, and 43#3 (see Table S1). For compounds 15 and 43 in particular, inspection of the trajectories revealed that the larger hydrophobic groups positioned in the pocket normally occupied by the BOG alkane tail, which is less solvent exposed than the rest of the pocket, showing fewer fluctuations. Average ligand RMSDs for these “core” regions (cores defined in Figure 16) for 8, 15, and 43 were 3.66, 2.96, and 2.37 Å, respectively (Figure 16, blue vs red histograms). Overall, the MD analysis showed that three of the six hits (and in particular 15 and 43) reasonably maintained their original DOCK-generated binding poses.
Figure 16.
RMSD histograms for BOG (to the initial modeled pose) and six hit compounds (to their initial DOCK poses) from four MD replicates each. The blue curve indicates the RMSD histogram for the full ligand. The red curve considers only the core of the compound. Ligand cores (red atoms in 2D depictions) identified by matching the closest heavy atom in the candidate ligand to the oxygen in the alkane tail of BOG. The analysis accounts for rotation in the region occupied by the polar headgroup of BOG, a phenomenon observed across several MD simulations.
Conclusion
The primary goal of this project was the identification of small molecules that inhibit membrane fusion events required for Zika virus to enter cells, which is mediated in large part by the viral glycoprotein E (ZIKV E) (Figure 1). Toward that end, we developed a homology model of ZIKV E (Figure 3) and employed the program DOCK6 to screen >4 million compounds (Figure 4) to a site for which the small molecule BOG (Figure 2) was observed to bind in an X-ray structure of the homologous glycoprotein from dengue virus (Figure 5). The procedure led to the prioritization of 149 compounds from which 53 were purchased for experimental testing (Table 2 and Figure 7). The objective was to identify potential ZIKV E inhibitors by mimicking BOG in terms of per-residue contributions (molecular footprints) or other metrics (pharmacophore overlap, Hungarian overlap, and volume overlap).
The purchased compounds were experimentally tested using a compound cytotoxicity assay (Figure 8), a cell viability assay (Figure 9), and a TCID50 end point dilution assay (Figure 10) to identify candidates that could inhibit Zika infection relative to a known positive control (NITD008). Encouragingly, 10 compounds showed activity in the cell viability assay (Figure 9, >1.0 cutoff, green), and eight compounds showed activity in the TCID50 end point dilution assay (Figure 10, <0.6 cutoff, red and yellow). Importantly, six of the compounds (8, 15, 30, 36, 41, and 43) were active in both assays. Additional caspase activity assays (Figure 12a) suggested that three of the six hits (8 and 15 tested at 25 μM, 43 tested at 10 μM) provided significant protection indicative of anti-ZIKV activity. Dose–response analysis (Figure 12b) for compounds 8 and 15 yielded estimated IC50 values in the range of 3–5 μM. Although it was not pursued here, in the future, it would be worthwhile to assess the selectivity of the hits against related viruses, including dengue, Japanese encephalitis, tick-borne encephalitis, and West Nile.
An examination of the 2D structures (Figure 13) and 3D poses (Figure 14) showed that the hits are roughly the same size with respect to BOG; however, the flexible tail was replaced by bulkier ring-containing moieties. We hypothesize that these larger, more rigid inhibitor segments can interfere with the conformational changes required for membrane fusion because they would be difficult to deform. None of the six hits contained potential PAINS liabilities or had previously been reported as a colloidal aggregator or promiscuous inhibitor based on online search tools (Table 3). Notably, all of the hits originated from the use of ranking methods that employ similarity-based scoring (Table 3, Sec Rnk column, FPSVDW+ES, FPSVDW, and VOS). Comparison of their molecular footprints showed significant overlap with the BOG reference (Figure 15a), reaffirming the utility of such approaches.
Lastly, all-atom MD simulations were performed to evaluate the energetic (Table S1) and geometric (Figure 16) stability of the hits starting from DOCK-generated poses. All hits were predicted to have a favorable (negative) free energy of binding (MM-GBSA method). Companion RMSDs (Figure 16) showed that for three of the six ligands (8, 15, and 43) there were significant populations in the range of 2–3.5 Å indicating that their bound geometries did not deviate too far from their initial predictions.
In summary, this study has highlighted the utility of using different computational (homology modeling, docking, similarity-based scoring, and molecular dynamics) and experimental (cytotoxicity, cell viability, infectivity, and caspase activity) approaches to target a putative BOG binding site in ZIKV E analogous to that previously identified in DENV E. In particular, the work underscores how atomic-level molecular footprints can be leveraged to identify potential ZIKV E inhibitors. The experimentally verified hits provide a strong starting point for further refinement and optimization efforts, and we hope that the results will be useful to other researchers working to develop small molecule anti-Zika drugs.
Acknowledgments
The authors thank Stony Brook Research Computing and Cyberinfrastructure and the Institute for Advanced Computational Science at Stony Brook University for access to the high-performance LIred and SeaWulf computing systems, the latter of which was made possible by a $1.4 million National Science Foundation grant (1531492). The authors also thank Jasdip Singh for experimental assistance. This work was funded in part by the Stony Brook University Office of the Vice President for Research and National Institutes of Health Grants R35GM126906 (to R.C.R.) and R21AI129306 (to A.J. and R.C.R.).
Glossary
Abbreviations
- BOG
β-octyl glucoside
- DCE
DOCK Cartesian energy
- ES
electrostatic
- FMS
pharmacophore matching similarity
- FPS
footprint similarity
- HMS
Hungarian matching similarity
- MM-GBSA
molecular mechanics generalized Born surface area
- MD
molecular dynamics
- PDB
Protein Data Bank
- RMSD
root-mean-square deviation
- VDW
van der Waals
- VOS
volume overlap similarity
- ZIKV
Zika virus
- ZIKV E
Zika virus glycoprotein E.
Supporting Information Available
The Supporting Information is available free of charge at https://pubs.acs.org/doi/10.1021/acs.biochem.0c00458.
MD protocols and results (RMSD, ΔGbind, ACF%, and BASEM) for ligands that form complexes with ZIKV E (PDF)
Accession Codes
DENV E, P12823; ZIKV E, A0A060H177.
Author Contributions
# S.M.T. and M.S.H. contributed equally to this work.
The authors declare no competing financial interest.
Supplementary Material
References
- Kindhauser M. K.; Allen T.; Frank V.; Santhana R. S.; Dye C. (2016) Zika: the origin and spread of a mosquito-borne virus. Bull. World Health Organ 94, 675–686C. 10.2471/BLT.16.171082. [DOI] [PMC free article] [PubMed] [Google Scholar]
- Barbi L.; Coelho A. V. C.; Alencar L. C. A.; Crovella S. (2018) Prevalence of Guillain-Barre syndrome among Zika virus infected cases: a systematic review and meta-analysis. Braz. J. Infect. Dis. 22, 137–141. 10.1016/j.bjid.2018.02.005. [DOI] [PMC free article] [PubMed] [Google Scholar]
- National Institute of Allergy and Infectious Diseases. https://www.niaid.nih.gov/diseases-conditions/zika-virus (last accessed 2020-04-13).
- Centers for Disease Control and Prevention. https://www.cdc.gov/zika/index.html (last accessed 2020-04-13).
- Dai L.; Song J.; Lu X.; Deng Y. Q.; Musyoki A. M.; Cheng H.; Zhang Y.; Yuan Y.; Song H.; Haywood J.; Xiao H.; Yan J.; Shi Y.; Qin C. F.; Qi J.; Gao G. F. (2016) Structures of the Zika Virus Envelope Protein and Its Complex with a Flavivirus Broadly Protective Antibody. Cell Host Microbe 19, 696–704. 10.1016/j.chom.2016.04.013. [DOI] [PubMed] [Google Scholar]
- Hasan S. S.; Sevvana M.; Kuhn R. J.; Rossmann M. G. (2018) Structural biology of Zika virus and other flaviviruses. Nat. Struct. Mol. Biol. 25, 13–20. 10.1038/s41594-017-0010-8. [DOI] [PubMed] [Google Scholar]
- Sirohi D.; Kuhn R. J. (2017) Zika Virus Structure, Maturation, and Receptors. J. Infect. Dis. 216, S935–S944. 10.1093/infdis/jix515. [DOI] [PMC free article] [PubMed] [Google Scholar]
- Zhang X.; Jia R.; Shen H.; Wang M.; Yin Z.; Cheng A. (2017) Structures and Functions of the Envelope Glycoprotein in Flavivirus Infections. Viruses 9, 338. 10.3390/v9110338. [DOI] [PMC free article] [PubMed] [Google Scholar]
- Owczarek K.; Chykunova Y.; Jassoy C.; Maksym B.; Rajfur Z.; Pyrc K. (2019) Zika virus: mapping and reprogramming the entry. Cell Commun. Signaling 17, 41. 10.1186/s12964-019-0349-z. [DOI] [PMC free article] [PubMed] [Google Scholar]
- Modis Y.; Ogata S.; Clements D.; Harrison S. C. (2003) A ligand-binding pocket in the dengue virus envelope glycoprotein. Proc. Natl. Acad. Sci. U. S. A. 100, 6986–6991. 10.1073/pnas.0832193100. [DOI] [PMC free article] [PubMed] [Google Scholar]
- Eckert D. M.; Kim P. S. (2001) Mechanisms of viral membrane fusion and its inhibition. Annu. Rev. Biochem. 70, 777–810. 10.1146/annurev.biochem.70.1.777. [DOI] [PubMed] [Google Scholar]
- Allen W. J.; Rizzo R. C. (2012) Computer-Aided Approaches for Targeting HIVgp41. Biology 1, 311–338. 10.3390/biology1020311. [DOI] [PMC free article] [PubMed] [Google Scholar]
- Yi H. A.; Fochtman B. C.; Rizzo R. C.; Jacobs A. (2016) Inhibition of HIV Entry by Targeting the Envelope Transmembrane Subunit gp41. Curr. HIV Res. 14, 283–294. 10.2174/1570162X14999160224103908. [DOI] [PMC free article] [PubMed] [Google Scholar]
- Wang L.; Liang R.; Gao Y.; Li Y.; Deng X.; Xiang R.; Zhang Y.; Ying T.; Jiang S.; Yu F. (2019) Development of Small-Molecule Inhibitors Against Zika Virus Infection. Front. Microbiol. 10, 2725. 10.3389/fmicb.2019.02725. [DOI] [PMC free article] [PubMed] [Google Scholar]
- Lim S. P.; Wang Q. Y.; Noble C. G.; Chen Y. L.; Dong H.; Zou B.; Yokokawa F.; Nilar S.; Smith P.; Beer D.; Lescar J.; Shi P. Y. (2013) Ten years of dengue drug discovery: progress and prospects. Antiviral Res. 100, 500–519. 10.1016/j.antiviral.2013.09.013. [DOI] [PubMed] [Google Scholar]
- Li Z.; Khaliq M.; Zhou Z.; Post C. B.; Kuhn R. J.; Cushman M. (2008) Design, synthesis, and biological evaluation of antiviral agents targeting flavivirus envelope proteins. J. Med. Chem. 51, 4660–4671. 10.1021/jm800412d. [DOI] [PMC free article] [PubMed] [Google Scholar]
- Zhou Z.; Khaliq M.; Suk J. E.; Patkar C.; Li L.; Kuhn R. J.; Post C. B. (2008) Antiviral compounds discovered by virtual screening of small-molecule libraries against dengue virus E protein. ACS Chem. Biol. 3, 765–775. 10.1021/cb800176t. [DOI] [PMC free article] [PubMed] [Google Scholar]
- Wang Q. Y.; Patel S. J.; Vangrevelinghe E.; Xu H. Y.; Rao R.; Jaber D.; Schul W.; Gu F.; Heudi O.; Ma N. L.; Poh M. K.; Phong W. Y.; Keller T. H.; Jacoby E.; Vasudevan S. G. (2009) A small-molecule dengue virus entry inhibitor. Antimicrob. Agents Chemother. 53, 1823–1831. 10.1128/AAC.01148-08. [DOI] [PMC free article] [PubMed] [Google Scholar]
- Poh M. K.; Yip A.; Zhang S.; Priestle J. P.; Ma N. L.; Smit J. M.; Wilschut J.; Shi P. Y.; Wenk M. R.; Schul W. (2009) A small molecule fusion inhibitor of dengue virus. Antiviral Res. 84, 260–266. 10.1016/j.antiviral.2009.09.011. [DOI] [PubMed] [Google Scholar]
- Kampmann T.; Yennamalli R.; Campbell P.; Stoermer M. J.; Fairlie D. P.; Kobe B.; Young P. R. (2009) In silico screening of small molecule libraries using the dengue virus envelope E protein has identified compounds with antiviral activity against multiple flaviviruses. Antiviral Res. 84, 234–241. 10.1016/j.antiviral.2009.09.007. [DOI] [PubMed] [Google Scholar]
- Yennamalli R.; Subbarao N.; Kampmann T.; McGeary R. P.; Young P. R.; Kobe B. (2009) Identification of novel target sites and an inhibitor of the dengue virus E protein. J. Comput.-Aided Mol. Des. 23, 333–341. 10.1007/s10822-009-9263-6. [DOI] [PubMed] [Google Scholar]
- Mayhoub A. S.; Khaliq M.; Kuhn R. J.; Cushman M. (2011) Design, synthesis, and biological evaluation of thiazoles targeting flavivirus envelope proteins. J. Med. Chem. 54, 1704–1714. 10.1021/jm1013538. [DOI] [PubMed] [Google Scholar]
- Mayhoub A. S.; Khaliq M.; Botting C.; Li Z.; Kuhn R. J.; Cushman M. (2011) An investigation of phenylthiazole antiflaviviral agents. Bioorg. Med. Chem. 19, 3845–3854. 10.1016/j.bmc.2011.04.041. [DOI] [PMC free article] [PubMed] [Google Scholar]
- Schmidt A. G.; Lee K.; Yang P. L.; Harrison S. C. (2012) Small-molecule inhibitors of dengue-virus entry. PLoS Pathog. 8, e1002627 10.1371/journal.ppat.1002627. [DOI] [PMC free article] [PubMed] [Google Scholar]
- Clark M. J.; Miduturu C.; Schmidt A. G.; Zhu X.; Pitts J. D.; Wang J.; Potisopon S.; Zhang J.; Wojciechowski A.; Hann Chu J. J.; Gray N. S.; Yang P. L. (2016) GNF-2 Inhibits Dengue Virus by Targeting Abl Kinases and the Viral E Protein. Cell Chem. Biol. 23, 443–452. 10.1016/j.chembiol.2016.03.010. [DOI] [PMC free article] [PubMed] [Google Scholar]
- Lian W.; Jang J.; Potisopon S.; Li P. C.; Rahmeh A.; Wang J.; Kwiatkowski N. P.; Gray N. S.; Yang P. L. (2018) Discovery of Immunologically Inspired Small Molecules That Target the Viral Envelope Protein. ACS Infect. Dis. 4, 1395–1406. 10.1021/acsinfecdis.8b00127. [DOI] [PMC free article] [PubMed] [Google Scholar]
- de Wispelaere M.; Lian W.; Potisopon S.; Li P. C.; Jang J.; Ficarro S. B.; Clark M. J.; Zhu X.; Kaplan J. B.; Pitts J. D.; Wales T. E.; Wang J.; Engen J. R.; Marto J. A.; Gray N. S.; Yang P. L. (2018) Inhibition of Flaviviruses by Targeting a Conserved Pocket on the Viral Envelope Protein. Cell Chem. Biol. 25, 1006–1016. 10.1016/j.chembiol.2018.05.011. [DOI] [PMC free article] [PubMed] [Google Scholar]
- Li P. C.; Jang J.; Hsia C. Y.; Groomes P. V.; Lian W.; de Wispelaere M.; Pitts J. D.; Wang J.; Kwiatkowski N.; Gray N. S.; Yang P. L. (2019) Small Molecules Targeting the Flavivirus E Protein with Broad-Spectrum Activity and Antiviral Efficacy in Vivo. ACS Infect. Dis. 5, 460–472. 10.1021/acsinfecdis.8b00322. [DOI] [PMC free article] [PubMed] [Google Scholar]
- Pitts J.; Hsia C. Y.; Lian W.; Wang J.; Pfeil M. P.; Kwiatkowski N.; Li Z.; Jang J.; Gray N. S.; Yang P. L. (2019) Identification of small molecule inhibitors targeting the Zika virus envelope protein. Antiviral Res. 164, 147–153. 10.1016/j.antiviral.2019.02.008. [DOI] [PMC free article] [PubMed] [Google Scholar]
- Allen W. J.; Balius T. E.; Mukherjee S.; Brozell S. R.; Moustakas D. T.; Lang P. T.; Case D. A.; Kuntz I. D.; Rizzo R. C. (2015) DOCK 6: Impact of new features and current docking performance. J. Comput. Chem. 36, 1132–1156. 10.1002/jcc.23905. [DOI] [PMC free article] [PubMed] [Google Scholar]
- Balius T. E.; Mukherjee S.; Rizzo R. C. (2011) Implementation and evaluation of a docking-rescoring method using molecular footprint comparisons. J. Comput. Chem. 32, 2273–2289. 10.1002/jcc.21814. [DOI] [PMC free article] [PubMed] [Google Scholar]
- Balius T. E.; Allen W. J.; Mukherjee S.; Rizzo R. C. (2013) Grid-based molecular footprint comparison method for docking and de novo design: application to HIVgp41. J. Comput. Chem. 34, 1226–1240. 10.1002/jcc.23245. [DOI] [PMC free article] [PubMed] [Google Scholar]
- Jiang L.; Rizzo R. C. (2015) Pharmacophore-based similarity scoring for DOCK. J. Phys. Chem. B 119, 1083–1102. 10.1021/jp506555w. [DOI] [PMC free article] [PubMed] [Google Scholar]
- Allen W. J.; Rizzo R. C. (2014) Implementation of the Hungarian algorithm to account for ligand symmetry and similarity in structure-based design. J. Chem. Inf. Model. 54, 518–529. 10.1021/ci400534h. [DOI] [PMC free article] [PubMed] [Google Scholar]
- Ye J.; McGinnis S.; Madden T. L. (2006) BLAST: improvements for better sequence analysis. Nucleic Acids Res. 34, W6–W9. 10.1093/nar/gkl164. [DOI] [PMC free article] [PubMed] [Google Scholar]
- Molecular Operating Environment (MOE) (2016) Chemical Computing Group Inc., Montreal, QC. [Google Scholar]
- Bressanelli S.; Stiasny K.; Allison S. L.; Stura E. A.; Duquerroy S.; Lescar J.; Heinz F. X.; Rey F. A. (2004) Structure of a flavivirus envelope glycoprotein in its low-pH-induced membrane fusion conformation. EMBO J. 23, 728–738. 10.1038/sj.emboj.7600064. [DOI] [PMC free article] [PubMed] [Google Scholar]
- Luca V. C.; AbiMansour J.; Nelson C. A.; Fremont D. H. (2012) Crystal structure of the Japanese encephalitis virus envelope protein. J. Virol 86, 2337–2346. 10.1128/JVI.06072-11. [DOI] [PMC free article] [PubMed] [Google Scholar]
- Luca V. C.; Nelson C. A.; Fremont D. H. (2013) Structure of the St. Louis encephalitis virus postfusion envelope trimer. J. Virol 87, 818–828. 10.1128/JVI.01950-12. [DOI] [PMC free article] [PubMed] [Google Scholar]
- Nybakken G. E.; Nelson C. A.; Chen B. R.; Diamond M. S.; Fremont D. H. (2006) Crystal structure of the West Nile virus envelope glycoprotein. J. Virol. 80, 11467–11474. 10.1128/JVI.01125-06. [DOI] [PMC free article] [PubMed] [Google Scholar]
- Rey F. A.; Heinz F. X.; Mandl C.; Kunz C.; Harrison S. C. (1995) The envelope glycoprotein from tick-borne encephalitis virus at 2 A resolution. Nature 375, 291–298. 10.1038/375291a0. [DOI] [PubMed] [Google Scholar]
- Case D. A., Ben-Shalom I. Y., Brozell S. R., Cerutti D. S., Cheatham T. E. III, Cruzeiro V. W. D., Darden T. A., Duke R. E., Ghoreishi D., Gilson M. K., Gohlke H., Goetz A. W., Greene D., Harris R., Homeyer N., Izadi S., Kovalenko A., Kurtzman T., Lee T. S., LeGrand S., Li P., Lin C., Liu J., Luchko T., Luo R., Mermelstein D. J., Merz K. M., Miao Y., Monard G., Nguyen C., Nguyen H., Omelyan I., Onufriev A., Pan F., Qi R., Roe D. R., Roitberg A., Sagui C., Schott-Verdugo S., Shen J., Simmerling C. L., Smith J., Salomon-Ferrer R., Swails J., Walker R. C., Wang J., Wei H., Wolf R. M., Wu X., Xiao L., York D. M., and Kollman P. A. (2018) AMBER 2018, University of California, San Francisco, San Francisco. [Google Scholar]
- Maier J. A.; Martinez C.; Kasavajhala K.; Wickstrom L.; Hauser K. E.; Simmerling C. (2015) ff14SB: Improving the Accuracy of Protein Side Chain and Backbone Parameters from ff99SB. J. Chem. Theory Comput. 11, 3696–3713. 10.1021/acs.jctc.5b00255. [DOI] [PMC free article] [PubMed] [Google Scholar]
- Jorgensen W. L.; Chandrasekhar J.; Madura J. D.; Impey R. W.; Klein M. L. (1983) Comparison of simple potential functions for simulating liquid water. J. Chem. Phys. 79, 926–935. 10.1063/1.445869. [DOI] [Google Scholar]
- Wang J.; Wolf R. M.; Caldwell J. W.; Kollman P. A.; Case D. A. (2004) Development and testing of a general amber force field. J. Comput. Chem. 25, 1157–1174. 10.1002/jcc.20035. [DOI] [PubMed] [Google Scholar]
- Jakalian A.; Jack D. B.; Bayly C. I. (2002) Fast, efficient generation of high-quality atomic charges. AM1-BCC model: II. Parameterization and validation. J. Comput. Chem. 23, 1623–1641. 10.1002/jcc.10128. [DOI] [PubMed] [Google Scholar]
- Sirohi D.; Chen Z.; Sun L.; Klose T.; Pierson T. C.; Rossmann M. G.; Kuhn R. J. (2016) The 3.8 A resolution cryo-EM structure of Zika virus. Science 352, 467–470. 10.1126/science.aaf5316. [DOI] [PMC free article] [PubMed] [Google Scholar]
- Chen V. B.; Arendall W. B. 3rd; Headd J. J.; Keedy D. A.; Immormino R. M.; Kapral G. J.; Murray L. W.; Richardson J. S.; Richardson D. C. (2010) MolProbity: all-atom structure validation for macromolecular crystallography. Acta Crystallogr., Sect. D: Biol. Crystallogr. 66, 12–21. 10.1107/S0907444909042073. [DOI] [PMC free article] [PubMed] [Google Scholar]
- Morris A. L.; MacArthur M. W.; Hutchinson E. G.; Thornton J. M. (1992) Stereochemical quality of protein structure coordinates. Proteins: Struct., Funct., Genet. 12, 345–364. 10.1002/prot.340120407. [DOI] [PubMed] [Google Scholar]
- Holden P. M.; Kaur H.; Goyal R.; Gochin M.; Rizzo R. C. (2012) Footprint-based identification of viral entry inhibitors targeting HIVgp41. Bioorg. Med. Chem. Lett. 22, 3011–3016. 10.1016/j.bmcl.2012.02.017. [DOI] [PMC free article] [PubMed] [Google Scholar]
- Holden P. M.; Allen W. J.; Gochin M.; Rizzo R. C. (2014) Strategies for lead discovery: application of footprint similarity targeting HIVgp41. Bioorg. Med. Chem. 22, 651–661. 10.1016/j.bmc.2013.10.022. [DOI] [PMC free article] [PubMed] [Google Scholar]
- Allen W. J.; Yi H. A.; Gochin M.; Jacobs A.; Rizzo R. C. (2015) Small molecule inhibitors of HIVgp41 N-heptad repeat trimer formation. Bioorg. Med. Chem. Lett. 25, 2853–2859. 10.1016/j.bmcl.2015.04.067. [DOI] [PMC free article] [PubMed] [Google Scholar]
- McGee T. D. Jr.; Yi H. A.; Allen W. J.; Jacobs A.; Rizzo R. C. (2017) Structure-based identification of inhibitors targeting obstruction of the HIVgp41 N-heptad repeat trimer. Bioorg. Med. Chem. Lett. 27, 3177–3184. 10.1016/j.bmcl.2017.05.020. [DOI] [PMC free article] [PubMed] [Google Scholar]
- Berger W. T.; Ralph B. P.; Kaczocha M.; Sun J.; Balius T. E.; Rizzo R. C.; Haj-Dahmane S.; Ojima I.; Deutsch D. G. (2012) Targeting fatty acid binding protein (FABP) anandamide transporters - a novel strategy for development of anti-inflammatory and anti-nociceptive drugs. PLoS One 7, e50968 10.1371/journal.pone.0050968. [DOI] [PMC free article] [PubMed] [Google Scholar]
- Zhou Y.; Elmes M. W.; Sweeney J. M.; Joseph O. M.; Che J.; Hsu H. C.; Li H.; Deutsch D. G.; Ojima I.; Kaczocha M.; Rizzo R. C. (2019) Identification of Fatty Acid Binding Protein 5 Inhibitors Through Similarity-Based Screening. Biochemistry 58, 4304–4316. 10.1021/acs.biochem.9b00625. [DOI] [PMC free article] [PubMed] [Google Scholar]
- Teng Y. H.; Berger W. T.; Nesbitt N. M.; Kumar K.; Balius T. E.; Rizzo R. C.; Tonge P. J.; Ojima I.; Swaminathan S. (2015) Computer-aided identification, synthesis, and biological evaluation of novel inhibitors for botulinum neurotoxin serotype A. Bioorg. Med. Chem. 23, 5489–5495. 10.1016/j.bmc.2015.07.040. [DOI] [PubMed] [Google Scholar]
- Zhou Y.; McGillick B. E.; Teng Y. G.; Haranahalli K.; Ojima I.; Swaminathan S.; Rizzo R. C. (2016) Identification of small molecule inhibitors of botulinum neurotoxin serotype E via footprint similarity. Bioorg. Med. Chem. 24, 4875–4889. 10.1016/j.bmc.2016.07.031. [DOI] [PubMed] [Google Scholar]
- Guo J.; Collins S.; Miller W. T.; Rizzo R. C. (2018) Identification of a Water-Coordinating HER2 Inhibitor by Virtual Screening Using Similarity-Based Scoring. Biochemistry 57, 4934–4951. 10.1021/acs.biochem.8b00524. [DOI] [PMC free article] [PubMed] [Google Scholar]
- Singleton C. D.; Humby M. S.; Yi H. A.; Rizzo R. C.; Jacobs A. (2019) Identification of Ebola Virus Inhibitors Targeting GP2 Using Principles of Molecular Mimicry. J. Virol. 93, e00676-19 10.1128/JVI.00676-19. [DOI] [PMC free article] [PubMed] [Google Scholar]
- DesJarlais R. L.; Sheridan R. P.; Seibel G. L.; Dixon J. S.; Kuntz I. D.; Venkataraghavan R. (1988) Using shape complementarity as an initial screen in designing ligands for a receptor binding site of known three-dimensional structure. J. Med. Chem. 31, 722–729. 10.1021/jm00399a006. [DOI] [PubMed] [Google Scholar]
- Meng E. C.; Shoichet B. K.; Kuntz I. D. (1992) Automated Docking with Grid-Based Energy Evaluation. J. Comput. Chem. 13, 505–524. 10.1002/jcc.540130412. [DOI] [Google Scholar]
- Sterling T.; Irwin J. J. (2015) ZINC 15--Ligand Discovery for Everyone. J. Chem. Inf. Model. 55, 2324–2337. 10.1021/acs.jcim.5b00559. [DOI] [PMC free article] [PubMed] [Google Scholar]
- Irwin J. J.; Duan D.; Torosyan H.; Doak A. K.; Ziebart K. T.; Sterling T.; Tumanian G.; Shoichet B. K. (2015) An Aggregation Advisor for Ligand Discovery. J. Med. Chem. 58, 7076–7087. 10.1021/acs.jmedchem.5b01105. [DOI] [PMC free article] [PubMed] [Google Scholar]
- Daina A.; Michielin O.; Zoete V. (2017) SwissADME: a free web tool to evaluate pharmacokinetics, drug-likeness and medicinal chemistry friendliness of small molecules. Sci. Rep. 7, 42717. 10.1038/srep42717. [DOI] [PMC free article] [PubMed] [Google Scholar]
- Wang L.; Ma C.; Wipf P.; Liu H.; Su W.; Xie X. Q. (2013) Target Hunter: an in silico target identification tool for predicting therapeutic potential of small organic molecules based on chemogenomic database. AAPS J. 15, 395–406. 10.1208/s12248-012-9449-z. [DOI] [PMC free article] [PubMed] [Google Scholar]
- Miteva M. A.; Violas S.; Montes M.; Gomez D.; Tuffery P.; Villoutreix B. O. (2006) FAF-Drugs: free ADME/tox filtering of compound collections. Nucleic Acids Res. 34, W738–W744. 10.1093/nar/gkl065. [DOI] [PMC free article] [PubMed] [Google Scholar]
- Kim S.; Chen J.; Cheng T.; Gindulyte A.; He J.; He S.; Li Q.; Shoemaker B. A.; Thiessen P. A.; Yu B.; Zaslavsky L.; Zhang J.; Bolton E. E. (2019) PubChem 2019 update: improved access to chemical data. Nucleic Acids Res. 47, D1102–D1109. 10.1093/nar/gky1033. [DOI] [PMC free article] [PubMed] [Google Scholar]
- Reed L. J.; Muench H. (1938) A simple method of estimating fifty per cent endpoints. Am. J. Epidemiol. 27, 493–497. 10.1093/oxfordjournals.aje.a118408. [DOI] [Google Scholar]
- Davis B. D., Dulbecco R., Eisen H. N., Ginsberg H. S., and Wood B. W. Jr. (1968) Principles of Microbiology and Immunology, pp 666–671, Harper & Row, New York. [Google Scholar]
- Scotti P. D. (1980) Microbial Control of Insect Pests. In New Zealand Department of Scientific and Industrial Research Bulletin (Kalmakoff and Longworth, Eds.) Vol. 228, pp 48–55, Wellington. [Google Scholar]
- Pettersen E. F.; Goddard T. D.; Huang C. C.; Couch G. S.; Greenblatt D. M.; Meng E. C.; Ferrin T. E. (2004) UCSF Chimera--a visualization system for exploratory research and analysis. J. Comput. Chem. 25, 1605–1612. 10.1002/jcc.20084. [DOI] [PubMed] [Google Scholar]
- Yin Z.; Chen Y. L.; Schul W.; Wang Q. Y.; Gu F.; Duraiswamy J.; Kondreddi R. R.; Niyomrattanakit P.; Lakshminarayana S. B.; Goh A.; Xu H. Y.; Liu W.; Liu B.; Lim J. Y.; Ng C. Y.; Qing M.; Lim C. C.; Yip A.; Wang G.; Chan W. L.; Tan H. P.; Lin K.; Zhang B.; Zou G.; Bernard K. A.; Garrett C.; Beltz K.; Dong M.; Weaver M.; He H.; Pichota A.; Dartois V.; Keller T. H.; Shi P. Y. (2009) An adenosine nucleoside inhibitor of dengue virus. Proc. Natl. Acad. Sci. U. S. A. 106, 20435–20439. 10.1073/pnas.0907010106. [DOI] [PMC free article] [PubMed] [Google Scholar]
- Nelson J.; Roe K.; Orillo B.; Shi P. Y.; Verma S. (2015) Combined treatment of adenosine nucleoside inhibitor NITD008 and histone deacetylase inhibitor vorinostat represents an immunotherapy strategy to ameliorate West Nile virus infection. Antiviral Res. 122, 39–45. 10.1016/j.antiviral.2015.07.008. [DOI] [PMC free article] [PubMed] [Google Scholar]
- Lo M. K.; Shi P. Y.; Chen Y. L.; Flint M.; Spiropoulou C. F. (2016) In vitro antiviral activity of adenosine analog NITD008 against tick-borne flaviviruses. Antiviral Res. 130, 46–49. 10.1016/j.antiviral.2016.03.013. [DOI] [PMC free article] [PubMed] [Google Scholar]
- Deng Y. Q.; Zhang N. N.; Li C. F.; Tian M.; Hao J. N.; Xie X. P.; Shi P. Y.; Qin C. F. (2016) Adenosine Analog NITD008 Is a Potent Inhibitor of Zika Virus. Open Forum Infect Dis 3, ofw175 10.1093/ofid/ofw175. [DOI] [PMC free article] [PubMed] [Google Scholar]
- Marvin Sketch (2019) ChemAxon Ltd. [Google Scholar]
- National Center for Biotechnology Information. PubChem Database. CID = 42585226. https://pubchem.ncbi.nlm.nih.gov/compound/42585226 (accessed 2020-06-01).
- McGillick B. E.; Balius T. E.; Mukherjee S.; Rizzo R. C. (2010) Origins of resistance to the HIVgp41 viral entry inhibitor T20. Biochemistry 49, 3575–3592. 10.1021/bi901915g. [DOI] [PMC free article] [PubMed] [Google Scholar]
- Huang Y. L.; Rizzo R. C. (2012) A Water-Based Mechanism of Specificity and Resistance for Lapatinib with ErbB Family Kinases. Biochemistry 51, 2390–2406. 10.1021/bi2016553. [DOI] [PubMed] [Google Scholar]
- Stiasny K.; Kiermayr S.; Bernhart A.; Heinz F. X. (2013) JJ. J. Virol. 87, 9933–9938. 10.1128/JVI.01283-13. [DOI] [PMC free article] [PubMed] [Google Scholar]
Associated Data
This section collects any data citations, data availability statements, or supplementary materials included in this article.


