Abstract
Single nanopore is a powerful platform to detect, discriminate and identify biomacromolecules. Among the different devices, the conical nanopores obtained by the track-etched technique on a polymer film are stable and easy to functionalize. However, these advantages are hampered by their high aspect ratio that avoids the discrimination of similar samples. Using machine learning, we demonstrate an improved resolution so that it can identify short single- and double-stranded DNA (10- and 40-mers). We have characterized each current blockade event by the relative intensity, dwell time, surface area and both the right and left slope. We show an overlap of the relative current blockade amplitudes and dwell time distributions that prevents their identification. We define the different parameters that characterize the events as features and the type of DNA sample as the target. By applying support-vector machines to discriminate each sample, we show accuracy between 50% and 72% by using two features that distinctly classify the data points. Finally, we achieved an increased accuracy (up to 82%) when five features were implemented.
Keywords: nanopore, machine learning, DNA sensing
1. Introduction
For the past three decades, single nanopore technology have emerged as single-molecule sensors and offer many practical uses such as long read DNA sequencing [1,2]. This was achieved by engineering biological nanopores combined with biological machines to control the DNA translocation speed [3,4,5,6,7]. Beside sequencing, biological nanopores provide a nice platform to analyze the DNA substructure such as hairpin [8], the hybridization [9,10], zipping [11] or the interaction with protein [12]. At the beginning of the 2000s, the idea to mimic biological nanopores was demonstrated using different types of thin film. First, thin films of semiconductors (SiN) drilled by transmission electron microscopy or focused ion beam were used to provide nanopores with a low aspect ratio [13,14]. Next, polymer nanopore obtained by the track-etched technique provided a long high-aspect-ratio nanochannel [15,16]. More recently, 2D materials with reduced thickness down to a couple of angstroms, such as metal nitride or oxide, were developed to improve the noise and/or wettability of those low-aspect-ratio nanopore [17,18].
Regardless the type of artificial nanopore (solid-state or polymer), their performance in terms of precision is lower than the biological ones [19]. However, they offer pores of various sizes from a couple of nm up to hundreds of nm allowing the detection of folded proteins, protein assemblies and nanoparticles [20,21,22]. Artificial nanopores can be classified according to their aspect ratio. The 2D materials are the most promising to discriminate single nucleotides with potential applications in DNA sequencing [23,24]. The SiN and other nitride-based materials are the most used for single molecule sensing. They can be drilled by dielectric breakdown making this approach a low-cost technology [25,26]. Their aspect ratio allows discriminating the length of DNA as well as protein shape based on the amplitude of the current blockade but also the dwell time [27,28,29,30,31,32,33]. Solid-state nanopores also show interesting applications in the characterization of DNA knots and DNA-protein binding [34,35,36]. The track-etched nanopores have low resolution but their µm length scale allows increasing the dwell time making the polymer detection easier [37,38]. Even if track-etched nanopores are much less used than SiN membrane nanopores, several biomacromolecules were successfully detected such as proteins [37], DNA from 10 to 100 bp [39,40,41,42], hyaluronic acid [21] and amyloid [33,43]. In addition, they are mechanically robust, with expanded lifetimes up to several weeks [33]. This is particularly useful to investigate the kinetic of protein aggregation as well as their enzymatic degradation [20]. Furthermore, since the dwell time is enhanced in the track-etched nanopore [38], transient conductivity events can be easily detected without the use of a MHz amplifier. Nevertheless, their main limitation is their low resolution to discriminate small polymers. In order to improve their performance, their surfaces can be easily functionalized to tune their properties. Among them, the partial conversion of carboxylic acids into amine moieties [44], the deposition of Al2O3 to tune the pore size [40] or the direct insertion of a biological nanopore [38]. Despite interesting results, the question of how the resolution of track-etched nanopore can be improved without chemical functionalization is still open. By tackling the problem of low resolution, the track-etched nanopore could offer a powerful platform to analyze the DNA size and structure. Indeed, compared to biological nanopore the tip diameter can be tuned to be sensitive to double-strand DNA or chain structure (i.e., knot, or hairpin). In this case, we could consider to determinate the ratio of different structures. Another advantage is the facility to modify the nanopore entrance to generate a specific interaction.
A way to increase resolution of nanopores is the use of machine learning algorithms [45,46], such as those used for DNA sequencing [47,48,49,50]. Moreover, combining the high resolution of biological nanopores and machine learning is a powerful tool to improve the nanopore resolution [51,52] allowing the identification of the protein domains [53], DNA base modification [54] and the C5 cytosine variant of DNA [55]. Here, we sought to apply classic algorithms of machine learning in the case of track-etched nanopores. Usually, the molecule detection by nanopore is characterized by two parameters: the relative current blockade and dwell time. The area of the events is also sometimes considered. There is compelling evidence using SiN nanopores that all these parameters are more or less correlated. We addressed the hypothesis that machine learning, in conjunction with the careful choice of multiple parameters that allow for characterizing the current blockade events, could improve the accuracy of DNA discrimination.
Here, we aim to demonstrate that classic algorithms of machine learning are powerful methods to data analysis of the nanopore sensing experiment. To do so, we have selected oligonucleotides with well-defined DNA sequences (A40/T40, T40 and A10/T10) as small macromolecules. Their detection was achieved through non-functionalized conical nanopore obtained by the track-etched method. The latter has a low resolution to discriminate small macromolecules. It is thus an ideal candidate to evaluate the benefits of the machine learning approach. From the parameter of the current blockade, we establish the correlation degree and then evaluate the accuracy of nanopores to discriminate the sample.
2. Material and Methods
2.1. Material
The A10, A40, T10 and T40 were obtained as previously reported [40]. Briefly, they were synthesized from commercially available phosphoramidite building blocks (Link Technologies Ltd., Bellshill, Scotland) in a 1 μmol scale using an ABI 381A DNA synthesizer by standard phosphoramidite chemistry. Then they were purified by RP-HPLC and characterized by MALDI-TOF MS.
2.2. Track-Etched Nanopore Design
Single conical nanopore was obtained by the track-etched method under dissymmetrical condition as previously reported [56]. Briefly, the single tracks were produced by Xe irradiation (8.98 MeV u-1) (GANIL, SME line, Caen, France) of polyethylene terephthalate (PET) film (thickness 13 µm, biaxial orientation ES301061 Goodfellow). The tracks were activated by UV exposition 12 h per side (Fisher bioblock; VL215.MC, λ = 312 nm) before chemical etching process. The etching of conical nanopore was performed under dissymmetric condition (etchant solution 9 M NaOH and stop solution 1 M KCl 1 M of acetic acid) using the electrostopping method (1 V). After nanopore opening, the tip diameter (dt) of conical nanopores was calculated from the dependence of the conductance G (measured from −100 mV to 100 mV) with KCl concentration 1M, assuming bulk-like ionic conductivity inside the nanopores using Equation (1).
| (1) |
where κ is the conductivity of the solution, L the nanopore length (13 µm) and db the diameter of the base side. db is calculated from the total etching time t using the relationship . The factor 2.5 was determined in our laboratory using multipore membrane track. The pore dimensions used here are α = 0.4° (noted pore 1) and α = 0.8° (noted pore 2).
2.3. DNA Detection and Analysis
The DNA strands were detected using resistive pulse methods [57,58,59]. Briefly, the single conical nanopore was mounted between two Teflon chambers containing the same electrolyte solution (NaCl 3 M, EDTA 1 mM, PBS 50 mM, pH 7.2 or KCl 2 M, EDTA 1 mM, PBS 50 mM, pH 7.2). The current was measured by Ag/AgCl, 1 M KCl electrodes connected to the cell chambers by agar–agar bridges. The working electrode and ground electrode were located in the trans-chamber (base side of the nanopore) and in the cis chamber (tip side of the nanopore), respectively. Electrical measurement was performed using a patch-clamp amplifier (EPC10 HEKA electronics, Lambrecht, Germany).
The polynucleotide samples were added on the cis chamber (tip side of nanopore) to reach a final concentration of 10 nM. Positive bias (250 mV or 500 mV) was then applied to the trans-chamber. Ion current was recorded at a sampling frequency of 100 kHz (for T40 and A40/T40) or 200 kHz (for A10/T10). A Bessel filter at 10 kHz is used. Those experiments were repeated at least 10 times in 8 successive days for each nanopore. The data analysis was performed using a custom-made LabView software with Butterworth filter of 2.5 kHz, 2 orders. The base line fluctuation was corrected using a Savitzky–Golay filter of 2400 side points, 1 order. The detection event was performed using a threshold of 3σ (σ where is the standard deviation of the signal). Each event was characterized by the relative current blockade (ΔI/I0), the dwell time (Δt), the area (AUC), the right (RS) and left slopes (LS). The parameters of the current blockade were analyzed using Matlab and the toolbox “statistical and learning machine”.
3. Results and Discussion
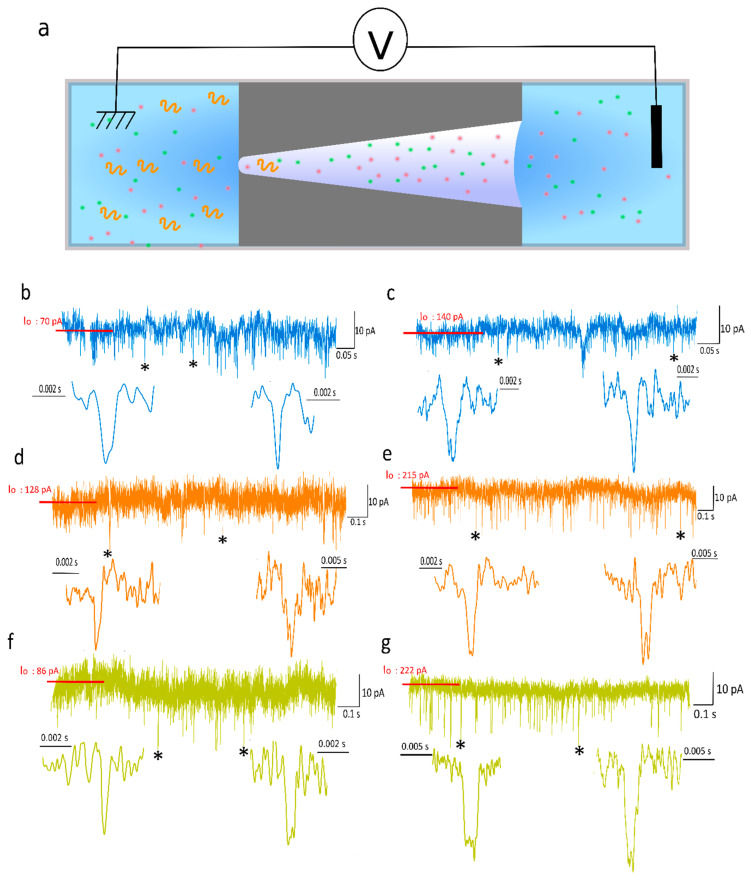
The experimental detection of all DNA samples A10/T10, A40/T40 and T40 were performed from the tip side to the base side under two different electrolyte conditions (NaCl 3 M, EDTA 1 mM, PBS 50 mM, pH 7.2 or KCl 2 M, EDTA 1 mM, PBS 50 mM, pH 7.2) (Figure 1a). Figure 1b–g shows examples of current traces recorded at 250 mV and 500 mV for all samples. From the current traces, the events related to the DNA translocation through the nanopore were detected. These current blockades were usually described by the relative current blockade (ΔI/I0), which is the ratio between the amplitude of the current blockade and the base line current, and the dwell time. These two parameters were first extracted to characterize all the events recorded during our experiments.
Figure 1.
(a) Sketch of DNA sensing using conical nanopore. Examples of current traces and zooms of current blockade recorded for A10/T10 at (b) 250 mV and (c) 500 mV, A40/T40 at (d) 250 mV and (e) 500 mV, T40 at (f) 250 mV and (g) 500 mV. The symbol * identifies the examples of current blockade zoom below each trace. The current traces were obtained using pore 1 dt = 3 nm, db = 200 nm.
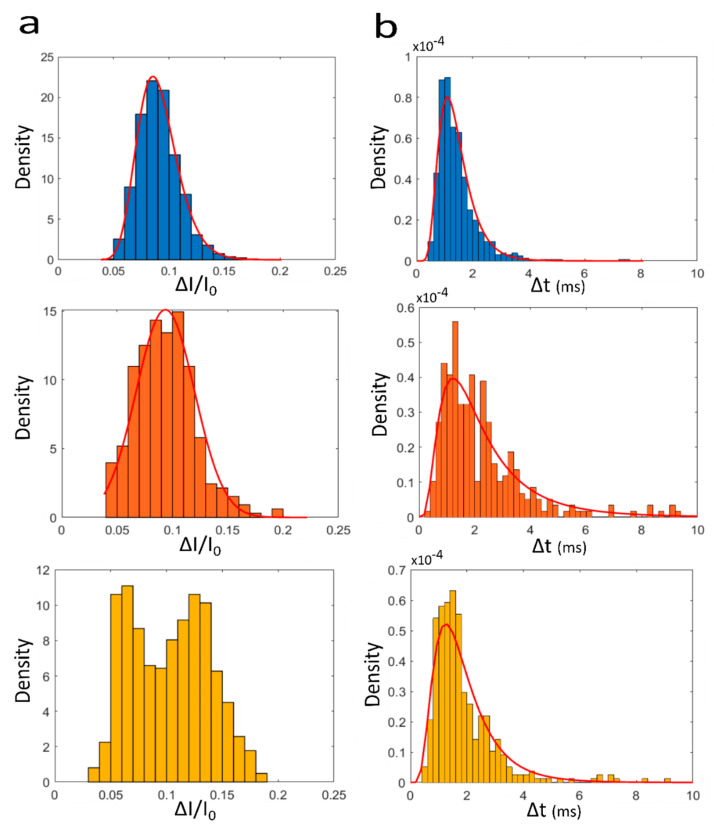
In Figure 2 are reported the distribution histograms of ΔI/I0 obtained for the A10/T10, A40/T40 and T40 at a voltage of 500 mV using pore 1 under KCl 2 M. These distributions are centered at similar values for the three samples: 0.085, 0.093 and 0.066 (another center of distribution is observed at 0.128) for A10/T10, A40/T40 and T40, respectively. The ΔI/I0 distributions of the current blockade recorded at 250 mV are centered on 0.15, 0.09 and 0.12 for A10/T10, A40/T40 and T40, respectively (Figure S1). These values slightly increase for pore 2 (under NaCl 3 M) recorded at 250 mV. The distributions are centered on 0.27, 0.25 and 0.18 for A10/T10, A40/T40 and T40, respectively (Figure S2). Similar observation can be made for the experiments performed at 500 mV where the centers of distribution are 0.31, 0.28, and 0.36 for A10/T10, A40/T40 and T40, respectively (Figure S3).
Figure 2.
Distribution histograms of (a) the amplitude of the relative current blockade (ΔI/I0) and (b) the dwell time (Δt) for the A10/T10 (blue), A40/T40: (orange), T40 (yellow). The events were recorded at 500 mV, the number of events n = 793, 332 and 634 for A10/T10, A40/T40 and T40, respectively. The results were obtained using pore 1 dt = 3 nm, db = 200 nm. The density (di) is the frequency (fi) of event relative to the sample size (n) and the bin width (wi) where wi = 0.01 and 200 for ΔI/I0 and Δt, respectively.
The distribution of Δt for the three samples at 500 mV recorded for pore 1 (and 2) are reported in Figure 2b and Figure S2b. We observe that the distributions are centered close to the same value: 1.07 ms (1.48 ms), 0.95 ms (1.24 ms), and 1.29 ms (1.23 ms) for A10/T10, A40/T40 and T40, respectively. We notice that the time scale (about 1 ms) is in the same range as the one reported for DNA 50 bp [41]. Under 250 mV, the Δt values do not significantly decrease (Figures S2b and S4b). Indeed, the centers of distribution for pore 1 (and 2) are found to be 1.07 ms (1.39 ms), 0.82 ms (1.25 ms) and 0.87 ms (1.30 ms) for A10/T10, A40/T40 and T40.
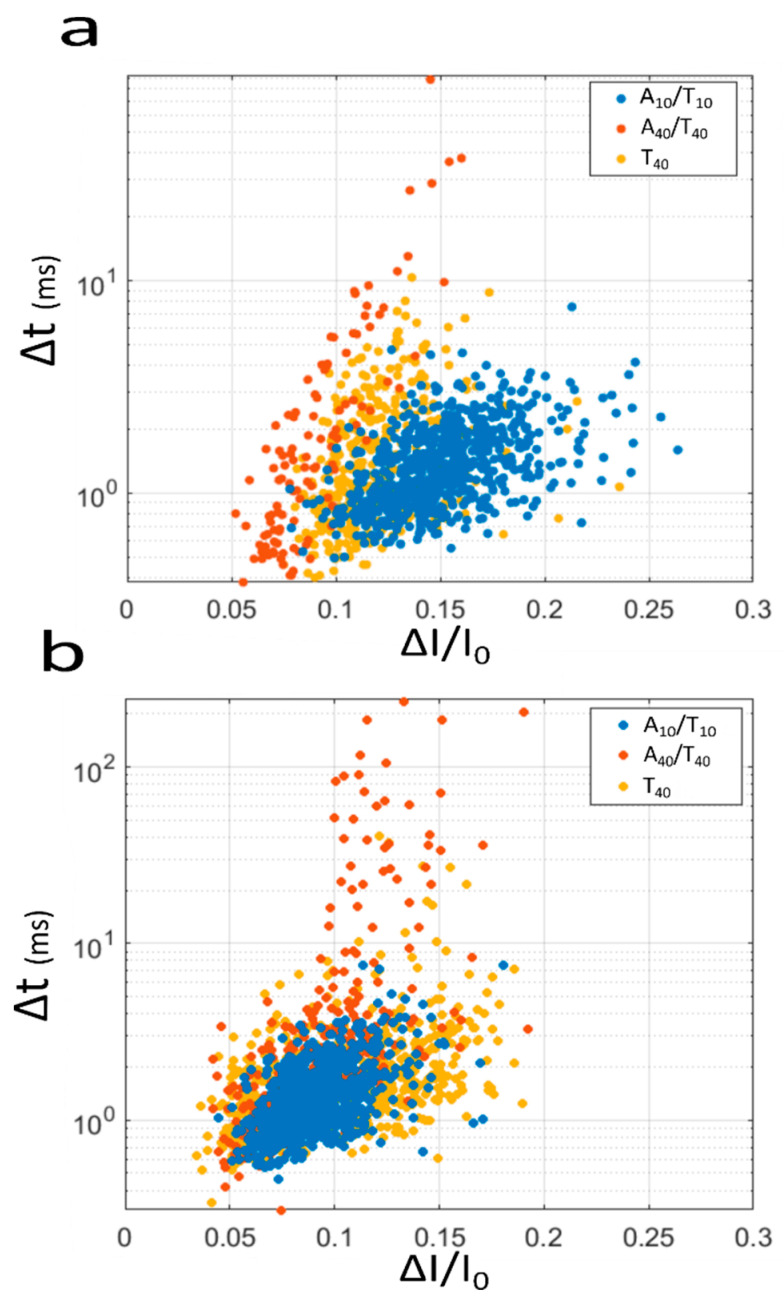
Usually, the ΔI/I0 and Δt are the main parameters to discriminate the sample analyzed by nanopore sensors. Here, we observe a large overlap between the different distributions (Figure 2 and Figures S1–S3) preventing the sample discrimination. The results also indicate that there is no preferential voltage or pore to discriminate them with only one parameter. In Figure 3 are reported two event maps representing the ΔI/I0 vs. Δt of translocation events for the three samples at two different voltages: 250 mV (Figure 3a) and 500 mV (Figure 3b) for pore 1. We observe that the cloud of events overlaps due to the similar distribution of ΔI/I0 and Δt. This overlap makes impossible the discrimination of the DNA samples by a simple clustering analysis. The same trend is observed for pore 2 for the two same voltages (250 and 500 mV, see Figure S4). These observations are not surprising due to the low resolution of track-etched nanopore.
Figure 3.
Scatter plot representing the Δt versus the I/I0 for the A10/T10 (blue), A40/T40 (orange), T40 (yellow) for a voltage of (a) 250 mV and (b) 500 mV. The results were obtained using the pore dt = 3 nm, db = 200 nm. The number of events recorded at 250 mV n = 703, 116 and 382 and at 500 mV n = 793, 332 and 640 for A10/T10, A40/T40 and T40, respectively.
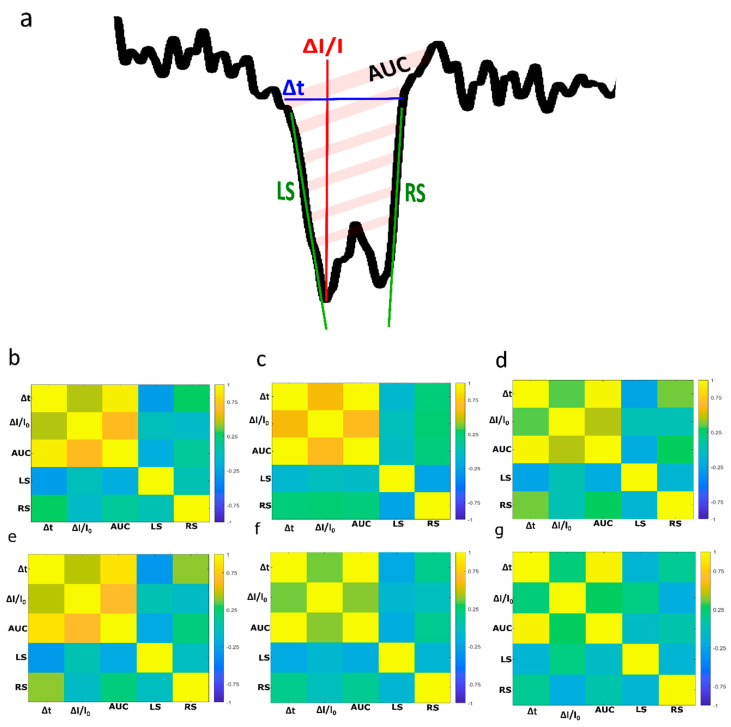
To go further, we attempted to define each current blockade with additional parameters (Figure 4a). First, we considered the surface area of the event (AUC) because it takes into account the eventual current fluctuation during the DNA translocation. We could expect that this parameter is strongly correlated to the Δt and the ΔI/I0. The conical shape of the nanopore can generate a dissymmetrical shape of current blockade events. In that case, the event’s right and left slopes (noted RS and LS, respectively) are expected to be different as previously reported in the case of spherical object [60,61]. Now, we evaluate the correlation degree of these five parameters (Δt, ΔI/I0, AUC, RS and LR). Usually, a positive correlation between the Δt and the ΔI/I0 can be observed if the length of the pore is close to that of the analyte. Indeed, this correlation has been reported for protein detection using SiN nanopore [62]. Conversely, in the case of long DNA strands, the amplitudes of the relative current blockade are not correlated with the dwell time since the nanopore is filled with the polymer strand [63]. Here, we report the correlation heat maps of various parameters for the three samples at a voltage of 250 mV (top line) and 500 mV (bottom line) for pore 1 (Figure 4b) and pore 2 (Figure S5). For all samples and regardless of the pore or the applied voltage, we can observe a strong correlation between Δt and the surface area (~0.90 in mean). Conversely, the correlation between the Δt and ΔI/I0 is low (<0.75). This low correlation degree is also observed between the surface and the ΔI/I0. This could be explained by the current fluctuation during the blockade due to the DNA motion inside the pore. Interestingly, the right and the left slopes do not appear to be correlated to each other (~−0.20 in mean) nor with other parameters.
Figure 4.
(a) Zoom of a translocation event and the representation of variables characterizing events. (b–g) Heat map representing the correlation between the variables characterizing events obtained under 250 mV for (b) A10/T10, (c) A40/T40, (d) T40 and at 500 mV for (e) A10/T10, (f) A40/T40, (g) T40. The results were obtained using the pore dt = 3 nm, db = 200 nm.
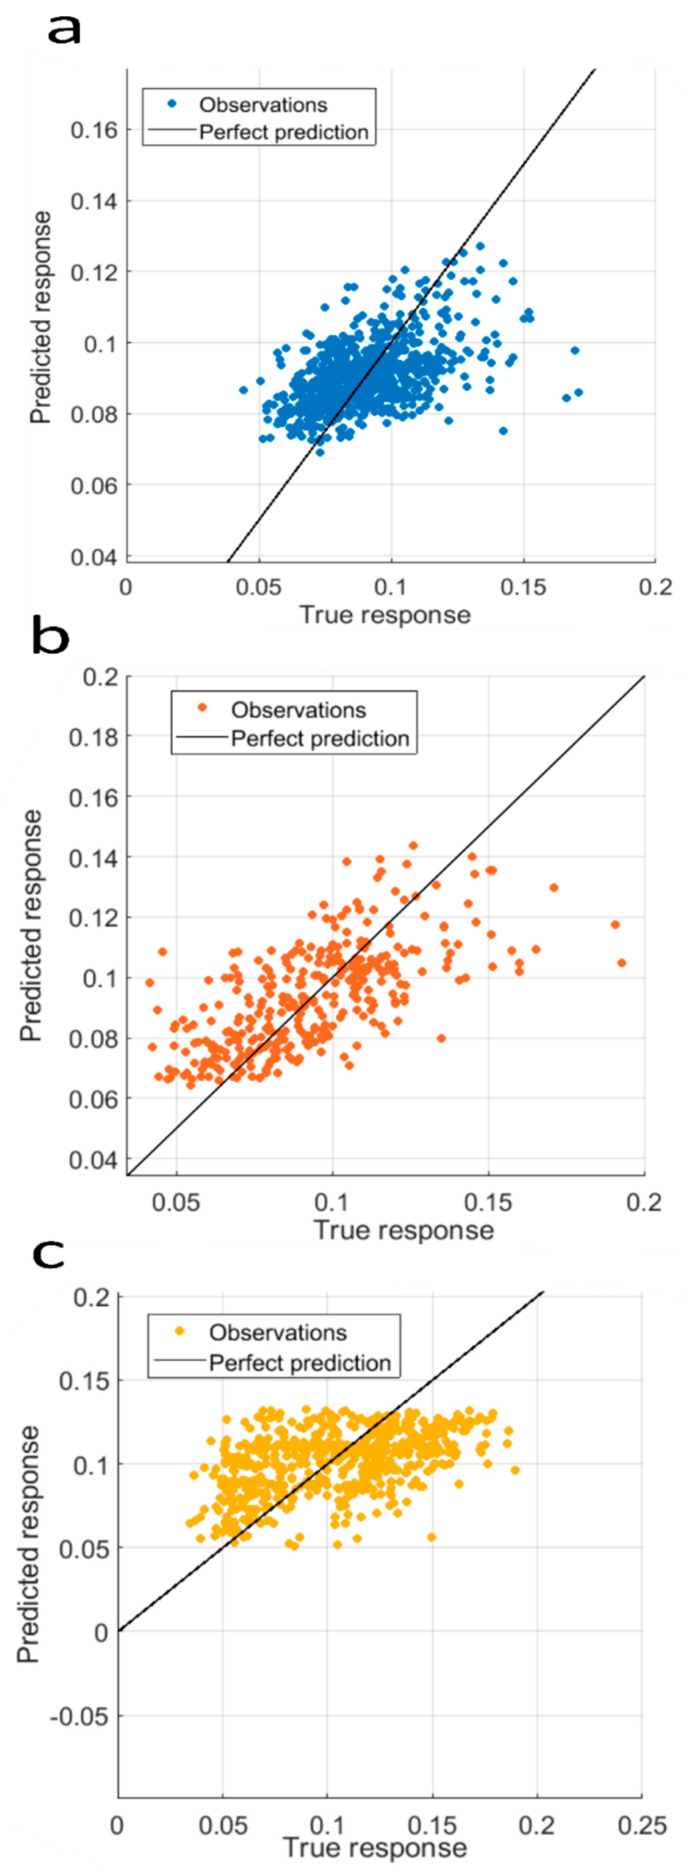
We then attempted to improve sample discrimination using machine learning algorithms. The simplest model involves establishing a linear correlation between two parameters. First, we examined whether ΔI/I0 and the Δt are correlated. In Figure 5 is reported the linear regression analysis performed with ΔI/I0 as response variable and Δt as predictor at a voltage of 500 mV for pore 1. We can observe a low correlation between these two parameters according to a R² about 0.25 in mean. The same analysis for the event recorded at 250 mV and with pore 2 (Figure S6) also provides a low R2 value (about 0.21). This is in good agreement with the heat map and confirms the non-linearity between the ΔI/I0 and the Δt.
Figure 5.
Linear regression performed with I/I0 (response variable) and Δt (predictor) for (a) A10/T10 (R² = 0.23; n = 793), (b) A40/T40 (R² = 0.43; n = 332) (c) T40 (R² = 0.23; n = 634). The results were obtained using the pore dt = 3 nm, db = 200 nm, voltage of 500 mV.
The support vector machine is a class of machine learning algorithm used to solve classification problems. The data training involves finding a way to separate the different samples by using the different parameters that characterize the events. In our case, we have defined the sample A10/T10, A40/T40 or T40 as the target of the algorithm. We have defined as the features the different parameters that characterize the events (ΔI/I0, Δt, AUC, RS and RL). As previously mentioned, the ΔI/I0, Δt are the most commonly used. Thus, we trained the algorithm with these two features and then with five features in order to demonstrate that the added parameters will help to improve the discrimination and to classify the different samples.
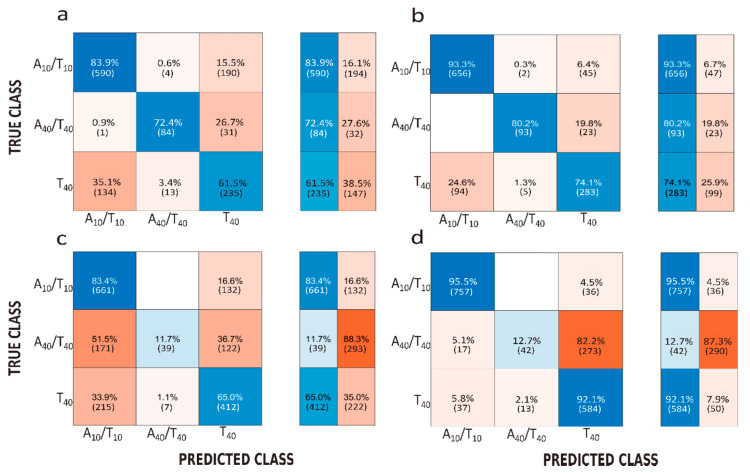
In Figure 6 is reported the confusion matrix for pore 1. Using two features (I/I0 and Δt), the accuracy is 72.6% and 53% for the event recorded at 250 mV and 500 mV, respectively. First, we observe that using machine learning the accuracy is better at 250 mV making this voltage more relevant to discriminate samples. Ignoring the voltage, the best predictions of event parameters were found for the A10/T10. As expected, the use of five features allows for improving the accuracy up to 82.5% and 66.76% at 250 mV and 500 mV, respectively. This improvement of the accuracy is also observed for pore 2 (Figure S7). This weak difference in precision between the two pores is likely due to the different geometries. The best results were obtained with the smaller nanopores. Using five features, the ratio of the true positive is higher for the A10/T10 and T40 than for the A40/T40. This is observed for all experiments except for pore 2 at 250 mV. However, this could be explained by a low number of events (n = 80).
Figure 6.
Confusion matrices representing the accuracy of classification with the support vector machine approach obtained under V = 250 mV using (a) 2 features (ΔI/I0, Δt) and (b) 5 features (ΔI/I0, Δt, AUC, LS, RS) and under 500 mV using (c) 2 features (ΔI/I0, Δt) and (d) 5 features (ΔI/I0, Δt, AUC, LS, RS). The results were obtained using pore 1 dt = 3 nm, db = 200 nm.
4. Conclusions
In summary, three DNA samples named A10/T10, A40/T40 or T40 were detected using conical nanopore with a tip diameter of about 3 nm. The classical parameters used to characterize the event (I/I0 and Δt) do not allow one to discriminate the samples due to a large overlap of their distributions. In addition, the linear regression analysis shows no correlation between these two parameters. Using support vector machines, the different samples were discriminated with accuracy between 50% and 72.6%. The events were then characterized by five parameters that are not correlated to each other except for Δt and the surface area. The introduction of three additional parameters as features (AUC, LS, RS) in the support vector machine algorithm showed 10% improvement of accuracy, which increased to 82.5% for the smallest nanopore at 250 mV. Among the three samples, the best prediction of event parameters was found for the A10/T10.
More generally, our work was motivated to propose a solution to improve the resolution of conical track-etched nanopore. The combination of additional parameters and support vector machine algorithms was found to be a relevant solution to reach this goal. We could expect that such analysis methodology will be applied for single molecule sensing using track-etched nanopores, especially in fields where these nanopores could bring fundamental insights, such as in amyloid detection and characterization.
Acknowledgments
The authors acknowledge E. Balanzat (CIMAP/Caen) for assistance during swift heavy ion irradiation.
Supplementary Materials
The following are available online at https://www.mdpi.com/2079-6374/10/10/140/s1. Figure S1: Distribution histograms of ΔI/I0 and Δt recorded with pore 1 at 250 mV, Figure S2: Distribution histograms of ΔI/I0 and Δt recorded with pore 2 at 500 mV, Figure S3: Distribution histograms of ΔI/I0 and Δt recorded with pore 2 at 250 mV, Figure S4: Scatter plot representing the Δt versus the ΔI/I0 recorded with the pore 2, Figure S5: Heat map representing the correlation between the variables characterizing events obtained under 250 mV. Figure S6: Linear regression performed with ΔI/I0 (response variable) and Δt (predictor), Figure S7: Confusion matrix representing the accuracy of classification with the support vector machine approach obtained under V = 250 mV.
Author Contributions
Conceptualization, S.B.; software, J.-M.J.; validation, S.B., and M.L.; formal analysis, N.M.; investigation, N.M., M.L., M.S., S.B.; resources, J.-J.V., S.M.; writing—original draft preparation, N.M. and S.B.; writing—review and editing, M.L, M.S, J.-J.V., J.T.; visualization, N.M.; supervision, S.B., J.T.; funding acquisition, S.B. and J.T. All authors have read and agreed to the published version of the manuscript.
Funding
This research was funded by Agence Nationale de la Recherche (ANR-19-CE42-0006, NanoOligo). Single tracks have been produced at GANIL (Caen, France) in the framework of an EMIR project.
Conflicts of Interest
The authors declare no conflict of interest.
References
- 1.Deamer D., Akeson M., Branton D. Three decades of nanopore sequencing. Nat. Biotechnol. 2016;34:518–524. doi: 10.1038/nbt.3423. [DOI] [PMC free article] [PubMed] [Google Scholar]
- 2.Kasianowicz J.J., Brandin E., Branton D., Deamer D.W. Characterization of individual polynucleotide molecules using a membrane channel. Proc. Natl. Acad. Sci. USA. 1996;93:13770–13773. doi: 10.1073/pnas.93.24.13770. [DOI] [PMC free article] [PubMed] [Google Scholar]
- 3.Manrao E.A., Derrington I.M., Laszlo A.H., Langford K.W., Hopper M.K., Gillgren N., Pavlenok M., Niederweis M., Gundlach J.H. Reading DNA at single-nucleotide resolution with a mutant MspA nanopore and phi29 DNA polymerase. Nat. Biotechnol. 2012;30:349–353. doi: 10.1038/nbt.2171. [DOI] [PMC free article] [PubMed] [Google Scholar]
- 4.Wloka C., Mutter N.L., Soskine M., Maglia G. Alpha-Helical Fragaceatoxin C Nanopore Engineered for Double-Stranded and Single-Stranded Nucleic Acid Analysis. Angew. Chem. Int. Ed. Engl. 2016;55:12494–12498. doi: 10.1002/anie.201606742. [DOI] [PubMed] [Google Scholar]
- 5.Van der Verren S.E., van Gerven N., Jonckheere W., Hambley R., Singh P., Kilgour J., Jordan M., Wallace E.J., Jayasinghe L., Remaut H. A dual-constriction biological nanopore resolves homonucleotide sequences with high fidelity. Nat. Biotechnol. 2020 doi: 10.1038/s41587-020-0570-8. [DOI] [PMC free article] [PubMed] [Google Scholar]
- 6.Cressiot B., Bacri L., Pelta J. The Promise of Nanopore Technology: Advances in the Discrimination of Protein Sequences and Chemical Modifications. Small Methods. 2020:2000090. doi: 10.1002/smtd.202000090. [DOI] [Google Scholar]
- 7.Asandei A., Di Muccio G., Schiopu I., Mereuta L., Dragomir I.S., Chinappi M., Luchian T. Nanopore-Based Protein Sequencing Using Biopores: Current Achievements and Open Challenges. Small Methods. 2020:1900595. doi: 10.1002/smtd.201900595. [DOI] [Google Scholar]
- 8.Ding Y., Fleming A.M., White H.S., Burrows C.J. Internal vs fishhook hairpin DNA: Unzipping locations and mechanisms in the α-hemolysin nanopore. J. Phys. Chem. B. 2014;118:12873–12882. doi: 10.1021/jp5101413. [DOI] [PMC free article] [PubMed] [Google Scholar]
- 9.Mereuta L., Asandei A., Schiopu I., Park Y., Luchian T. Nanopore-Assisted, Sequence-Specific Detection, and Single-Molecule Hybridization Analysis of Short, Single-Stranded DNAs. Anal. Chem. 2019;91:8630–8637. doi: 10.1021/acs.analchem.9b02080. [DOI] [PubMed] [Google Scholar]
- 10.Ciuca A., Asandei A., Schiopu I., Apetrei A., Mereuta L., Seo C.H., Park Y., Luchian T. Single-Molecule, Real-Time Dissecting of Peptide Nucleic Acid–DNA Duplexes with a Protein Nanopore Tweezer. Anal. Chem. 2018;90:7682–7690. doi: 10.1021/acs.analchem.8b01568. [DOI] [PubMed] [Google Scholar]
- 11.Perera R.T., Fleming A.M., Peterson A.M., Heemstra J.M., Burrows C.J., White H.S. Unzipping of A-Form DNA-RNA, A-Form DNA-PNA, and B-Form DNA-DNA in the α-Hemolysin Nanopore. Biophys. J. 2016;110:306–314. doi: 10.1016/j.bpj.2015.11.020. [DOI] [PMC free article] [PubMed] [Google Scholar]
- 12.Hornblower B., Coombs A., Whitaker R.D., Kolomeisky A., Picone S.J., Meller A., Akeson M. Single-molecule analysis of DNA-protein complexes using nanopores. Nat. Methods. 2007;4:315–317. doi: 10.1038/nmeth1021. [DOI] [PubMed] [Google Scholar]
- 13.Li J., Stein D., McMullan C., Branton D., Aziz M.J., Golovchenko J.A. Ion-beam sculpting at nanometre length scales. Nature. 2001;412:166–169. doi: 10.1038/35084037. [DOI] [PubMed] [Google Scholar]
- 14.Li J., Gershow M., Stein D., Brandin E., Golovchenko J.A. DNA molecules and configurations in a solid-state nanopore microscope. Nat. Mater. 2003;2:611–615. doi: 10.1038/nmat965. [DOI] [PubMed] [Google Scholar]
- 15.Harrell C.C., Lee S.B., Martin C.R. Synthetic single-nanopore and nanotube membranes. Anal. Chem. 2003;75:6861–6867. doi: 10.1021/ac034602n. [DOI] [PubMed] [Google Scholar]
- 16.Heins E.A., Siwy Z.S., Baker L.A., Martin C.R. Detecting single porphyrin molecules in a conically shaped synthetic nanopore. Nano Lett. 2005;5:1824–1829. doi: 10.1021/nl050925i. [DOI] [PubMed] [Google Scholar]
- 17.Liu K., Feng J., Kis A., Radenovic A. Atomically thin molybdenum disulfide nanopores with high sensitivity for DNA translocation. ACS Nano. 2014;8:2504–2511. doi: 10.1021/nn406102h. [DOI] [PubMed] [Google Scholar]
- 18.Schneider G.F., Kowalczyk S.W., Calado V.E., Pandraud G., Zandbergen H.W., Vandersypen L.M.K., Dekker C. DNA translocation through graphene nanopores. Nano Lett. 2010;10:3163–3167. doi: 10.1021/nl102069z. [DOI] [PubMed] [Google Scholar]
- 19.Hall A.R., Scott A., Rotem D., Mehta K.K., Bayley H., Dekker C. Hybrid pore formation by directed insertion of α-haemolysin into solid-state nanopores. Nat. Nanotechnol. 2010;5:874–877. doi: 10.1038/nnano.2010.237. [DOI] [PMC free article] [PubMed] [Google Scholar]
- 20.Giamblanco N., Janot J.-M., Gubbiotti A., Chinappi M., Balme S. Characterization of Food Amyloid Protein Digestion by Conical Nanopore. Small Methods. 2020:1900703. doi: 10.1002/smtd.201900703. [DOI] [Google Scholar]
- 21.Ma T., Janot J.-M., Balme S. Track-Etched Nanopore/Membrane: From Fundamental to Applications. Small Methods. 2020:2000366. doi: 10.1002/smtd.202000366. [DOI] [Google Scholar]
- 22.Lepoitevin M., Ma T., Bechelany M., Janot J.-M., Balme S. Functionalization of single solid state nanopores to mimic biological ion channels: A review. Adv. Colloid Interface Sci. 2017;250:195–213. doi: 10.1016/j.cis.2017.09.001. [DOI] [PubMed] [Google Scholar]
- 23.Feng J., Liu K., Bulushev R.D., Khlybov S., Dumcenco D., Kis A., Radenovic A. Identification of single nucleotides in MoS2 nanopores. Nat. Nanotechnol. 2015;10:1070–1076. doi: 10.1038/nnano.2015.219. [DOI] [PubMed] [Google Scholar]
- 24.Thakur M., Macha M., Chernev A., Graf M., Lihter M., Deen J., Tripathi M., Kis A., Radenovic A. Wafer-Scale Fabrication of Nanopore Devices for Single-Molecule DNA Biosensing using MoS 2. Small Methods. 2020:2000072. doi: 10.1002/smtd.202000072. [DOI] [Google Scholar]
- 25.Kwok H., Briggs K., Tabard-Cossa V. Nanopore fabrication by controlled dielectric breakdown. PLoS ONE. 2014;9:e92880. doi: 10.1371/journal.pone.0092880. [DOI] [PMC free article] [PubMed] [Google Scholar]
- 26.Briggs K., Kwok H., Tabard-Cossa V. Automated fabrication of 2-nm solid-state nanopores for nucleic acid analysis. Small. 2014;10:2077–2086. doi: 10.1002/smll.201303602. [DOI] [PubMed] [Google Scholar]
- 27.Balme S., Coulon P.E., Lepoitevin M., Charlot B., Yandrapalli N., Favard C., Muriaux D., Bechelany M., Janot J.-M. Influence of Adsorption on Proteins and Amyloid Detection by Silicon Nitride Nanopore. Langmuir. 2016;32:8916–8925. doi: 10.1021/acs.langmuir.6b02048. [DOI] [PubMed] [Google Scholar]
- 28.Kowalczyk S.W., Hall A.R., Dekker C. Detection of local protein structures along DNA using solid-state nanopores. Nano Lett. 2010;10:324–328. doi: 10.1021/nl903631m. [DOI] [PubMed] [Google Scholar]
- 29.Larkin J., Henley R., Bell D.C., Cohen-Karni T., Rosenstein J.K., Wanunu M. Slow DNA transport through nanopores in hafnium oxide membranes. ACS Nano. 2013;7:10121–10128. doi: 10.1021/nn404326f. [DOI] [PMC free article] [PubMed] [Google Scholar]
- 30.Venta K., Shemer G., Puster M., Rodríguez-Manzo J.A., Balan A., Rosenstein J.K., Shepard K., Drndić M. Differentiation of short, single-stranded DNA homopolymers in solid-state nanopores. ACS Nano. 2013;7:4629–4636. doi: 10.1021/nn4014388. [DOI] [PMC free article] [PubMed] [Google Scholar]
- 31.Wei R., Gatterdam V., Wieneke R., Tampé R., Rant U. Stochastic sensing of proteins with receptor-modified solid-state nanopores. Nat. Nanotechnol. 2012;7:257–263. doi: 10.1038/nnano.2012.24. [DOI] [PubMed] [Google Scholar]
- 32.Smeets R.M.M., Keyser U.F., Krapf D., Wu M.-Y., Dekker N.H., Dekker C. Salt dependence of ion transport and DNA translocation through solid-state nanopores. Nano Lett. 2006;6:89–95. doi: 10.1021/nl052107w. [DOI] [PubMed] [Google Scholar]
- 33.Giamblanco N., Coglitore D., Janot J.-M., Coulon P.E., Charlot B., Balme S. Detection of protein aggregate morphology through single antifouling nanopore. Sens. Actuators B Chem. 2018;260:736–745. doi: 10.1016/j.snb.2018.01.094. [DOI] [Google Scholar]
- 34.Plesa C., Verschueren D., Pud S., van der Torre J., Ruitenberg J.W., Witteveen M.J., Jonsson M.P., Grosberg A.Y., Rabin Y., Dekker C. Direct observation of DNA knots using a solid-state nanopore. Nat. Nanotechnol. 2016;11:1093–1097. doi: 10.1038/nnano.2016.153. [DOI] [PubMed] [Google Scholar]
- 35.Plesa C., Ruitenberg J.W., Witteveen M.J., Dekker C. Detection of Individual Proteins Bound along DNA Using Solid-State Nanopores. Nano Lett. 2015;15:3153–3158. doi: 10.1021/acs.nanolett.5b00249. [DOI] [PubMed] [Google Scholar]
- 36.Kumar Sharma R., Agrawal I., Dai L., Doyle P.S., Garaj S. Complex DNA knots detected with a nanopore sensor. Nat. Commun. 2019;10:4473. doi: 10.1038/s41467-019-12358-4. [DOI] [PMC free article] [PubMed] [Google Scholar]
- 37.Mara A., Siwy Z., Trautmann C., Wan J., Kamme F. An Asymmetric Polymer Nanopore for Single Molecule Detection. Nano Lett. 2004;4:497–501. doi: 10.1021/nl035141o. [DOI] [Google Scholar]
- 38.Cabello-Aguilar S., Balme S., Chaaya A.A., Bechelany M., Balanzat E., Janot J.-M., Pochat-Bohatier C., Miele P., Dejardin P. Slow translocation of polynucleotides and their discrimination by α-hemolysin inside a single track-etched nanopore designed by atomic layer deposition. Nanoscale. 2013;5:9582–9586. doi: 10.1039/c3nr03683a. [DOI] [PubMed] [Google Scholar]
- 39.Harrell C.C., Choi Y., Horne L.P., Baker L.A., Siwy Z.S., Martin C.R. Resistive-pulse DNA detection with a conical nanopore sensor. Langmuir. 2006;22:10837–10843. doi: 10.1021/la061234k. [DOI] [PubMed] [Google Scholar]
- 40.Thangaraj V., Lepoitevin M., Smietana M., Balanzat E., Bechelany M., Janot J.-M., Vasseur J.-J., Subramanian S., Balme S. Detection of short ssDNA and dsDNA by current-voltage measurements using conical nanopores coated with Al2O3 by atomic layer deposition. Microchim. Acta. 2016;183:1011–1017. doi: 10.1007/s00604-015-1706-2. [DOI] [Google Scholar]
- 41.Kececi K., San N., Kaya D. Nanopore detection of double stranded DNA using a track-etched polycarbonate membrane. Talanta. 2015;144:268–274. doi: 10.1016/j.talanta.2015.06.005. [DOI] [PubMed] [Google Scholar]
- 42.Kaya D., Dinler A., San N., Kececi K. Effect of Pore Geometry on Resistive-Pulse Sensing of DNA Using Track-Etched PET Nanopore Membrane. Electrochim. Acta. 2016;202:157–165. doi: 10.1016/j.electacta.2016.04.014. [DOI] [Google Scholar]
- 43.Giamblanco N., Fichou Y., Janot J.-M., Balanzat E., Han S., Balme S. Mechanisms of Heparin-Induced Tau Aggregation Revealed by a Single Nanopore. ACS Sens. 2020;5:1158–1167. doi: 10.1021/acssensors.0c00193. [DOI] [PubMed] [Google Scholar]
- 44.Zhang Y., Chen X., Wang C., Roozbahani G.M., Chang H.-C., Guan X. Chemically functionalized conical PET nanopore for protein detection at the single-molecule level. Biosens. Bioelectron. 2020;165:112289. doi: 10.1016/j.bios.2020.112289. [DOI] [PMC free article] [PubMed] [Google Scholar]
- 45.Namuduri S., Narayanan B.N., Davuluru V.S.P., Burton L., Bhansali S. Review—Deep Learning Methods for Sensor Based Predictive Maintenance and Future Perspectives for Electrochemical Sensors. J. Electrochem. Soc. 2020;167:37552. doi: 10.1149/1945-7111/ab67a8. [DOI] [Google Scholar]
- 46.Gonzalez-Navarro F.F., Stilianova-Stoytcheva M., Renteria-Gutierrez L., Belanche-Muñoz L.A., Flores-Rios B.L., Ibarra-Esquer J.E. Glucose Oxidase Biosensor Modeling and Predictors Optimization by Machine Learning Methods. Sensors. 2016;16:1483. doi: 10.3390/s16111483. [DOI] [PMC free article] [PubMed] [Google Scholar]
- 47.LaPierre N., Egan R., Wang W., Wang Z. De novo Nanopore read quality improvement using deep learning. BMC Bioinform. 2019;20:552. doi: 10.1186/s12859-019-3103-z. [DOI] [PMC free article] [PubMed] [Google Scholar]
- 48.Smith M.A., Ersavas T., Ferguson J.M., Liu H., Lucas M.C., Begik O., Bojarski L., Barton K., Novoa E.M. Barcoding and demultiplexing Oxford Nanopore native RNA sequencing reads with deep residual learning. BioRxiv. 2019 doi: 10.1101/864322. [DOI] [Google Scholar]
- 49.Zeng J., Cai H., Peng H., Wang H., Zhang Y., Akutsu T. Causalcall: Nanopore Basecalling Using a Temporal Convolutional Network. Front. Genet. 2019;10:1332. doi: 10.3389/fgene.2019.01332. [DOI] [PMC free article] [PubMed] [Google Scholar]
- 50.Landry M., Winters-Hilt S. Analysis of nanopore detector measurements using Machine-Learning methods, with application to single-molecule kinetic analysis. BMC Bioinform. 2007;8:12. doi: 10.1186/1471-2105-8-S7-S12. [DOI] [PMC free article] [PubMed] [Google Scholar]
- 51.Winters-Hilt S., Landry M., Akeson M., Tanase M., Amin I., Coombs A., Morales E., Millet J., Baribault C., Sendamangalam S. Cheminformatics methods for novel nanopore analysis of HIV DNA termini. BMC Bioinform. 2006;7:22. doi: 10.1186/1471-2105-7-S2-S22. [DOI] [PMC free article] [PubMed] [Google Scholar]
- 52.Vercoutere W., Winters-Hilt S., Olsen H., Deamer D., Haussler D., Akeson M. Rapid discrimination among individual DNA hairpin molecules at single-nucleotide resolution using an ion channel. Nat. Biotechnol. 2001;19:248–252. doi: 10.1038/85696. [DOI] [PubMed] [Google Scholar]
- 53.Nivala J., Mulroney L., Li G., Schreiber J., Akeson M. Discrimination among protein variants using an unfoldase-coupled nanopore. ACS Nano. 2014;8:12365–12375. doi: 10.1021/nn5049987. [DOI] [PubMed] [Google Scholar]
- 54.Liu Q., Fang L., Yu G., Wang D., Xiao C.-L., Wang K. Detection of DNA base modifications by deep recurrent neural network on Oxford Nanopore sequencing data. Nat. Commun. 2019;10:2449. doi: 10.1038/s41467-019-10168-2. [DOI] [PMC free article] [PubMed] [Google Scholar]
- 55.Wescoe Z.L., Schreiber J., Akeson M. Nanopores discriminate among five C5-cytosine variants in DNA. J. Am. Chem. Soc. 2014;136:16582–16587. doi: 10.1021/ja508527b. [DOI] [PMC free article] [PubMed] [Google Scholar]
- 56.Lepoitevin M., Jamilloux B., Bechelany M., Balanzat E., Janot J.-M., Balme S. Fast and reversible functionalization of a single nanopore based on layer-by-layer polyelectrolyte self-assembly for tuning current rectification and designing sensors. RSC Adv. 2016;6:32228–32233. doi: 10.1039/C6RA03698H. [DOI] [Google Scholar]
- 57.Bayley H., Martin C.R. Resistive-Pulse Sensing-From Microbes to Molecules. Chem. Rev. 2000;100:2575–2594. doi: 10.1021/cr980099g. [DOI] [PubMed] [Google Scholar]
- 58.Luo L., German S.R., Lan W.-J., Holden D.A., Mega T.L., White H.S. Resistive-pulse analysis of nanoparticles. Annu. Rev. Anal. Chem. (Palo Alto Calif.) 2014;7:513–535. doi: 10.1146/annurev-anchem-071213-020107. [DOI] [PubMed] [Google Scholar]
- 59.DeBlois R.W., Bean C.P. Counting and Sizing of Submicron Particles by the Resistive Pulse Technique. Rev. Sci. Instrum. 1970;41:909–916. doi: 10.1063/1.1684724. [DOI] [Google Scholar]
- 60.Holden D.A., Watkins J.J., White H.S. Resistive-pulse detection of multilamellar liposomes. Langmuir. 2012;28:7572–7577. doi: 10.1021/la300993a. [DOI] [PubMed] [Google Scholar]
- 61.Yang L., Yamamoto T. Quantification of Virus Particles Using Nanopore-Based Resistive-Pulse Sensing Techniques. Front. Microbiol. 2016;7:1500. doi: 10.3389/fmicb.2016.01500. [DOI] [PMC free article] [PubMed] [Google Scholar]
- 62.Larkin J., Henley R.Y., Muthukumar M., Rosenstein J.K., Wanunu M. High-bandwidth protein analysis using solid-state nanopores. Biophys. J. 2014;106:696–704. doi: 10.1016/j.bpj.2013.12.025. [DOI] [PMC free article] [PubMed] [Google Scholar]
- 63.Storm A.J., Storm C., Chen J., Zandbergen H., Joanny J.-F., Dekker C. Fast DNA translocation through a solid-state nanopore. Nano Lett. 2005;5:1193–1197. doi: 10.1021/nl048030d. [DOI] [PubMed] [Google Scholar]
Associated Data
This section collects any data citations, data availability statements, or supplementary materials included in this article.


