

Abstract
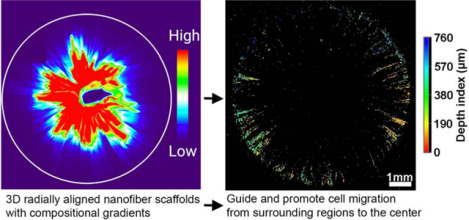
New methods are described for converting two-dimensional (2D) electrospun nanofiber membranes to three-dimensional (3D) hierarchical assemblies with structural and compositional gradients. Pore size gradients are generated by tuning the expansion of 2D membranes in different layers with incorporation of various amounts of a surfactant during the gas-foaming process. The gradient in fiber organizations is formed by expanding 2D nanofiber membranes composed of multiple regions collected by varying rotating speeds of mandrel. The compositional gradient on 3D assemblies consisting of radially aligned nanofibers is prepared by dripping, diffusion, and crosslinking. Bone mesenchymal stem cells (BMSCs) on the 3D nanofiber assemblies with smaller pore size show significantly higher expression of hypoxia related markers and enhanced chondrogenic differentiation compared to BMSCs cultured on the assemblies with larger pore size. The basic fibroblast growth factor (bFGF) gradient can accelerate fibroblast migration from the surrounding area to the center in an in vitro wound healing model. Taken together, 3D nanofiber assemblies with gradients in pore sizes, fiber organizations, and contents of signaling molecules can be used to engineer tissue constructs for tissue repair and build biomimetic disease models for studying disease biology and screening drugs, in particular, for interface tissue engineering and modeling.
Keywords: 3D nanofiber assemblies, gradient, composition, structure, pore size, fiber organization
Graphical Abstract
A new class of 3D nanofiber assemblies with structural and compositional gradients is developed based on electrospinning, gas-foaming expansion, coating, diffusion, encapsulation, and crosslinking. Such assemblies with gradients in pore sizes, fiber organizations, and contents of signaling molecules can be used to engineer tissue constructs for tissue repair and build biomimetic disease models for studying disease biology and screening drugs.
Structural and compositional gradients are ubiquitous in many biological systems, arising through natural selection and optimization.[1,2] One type of gradient is linked to the spatial change of structures including pore size, porosity, and collagen fiber organization. The structures of bones and plant stems alter gradually from the surface with smaller pore size to interior with larger pore size.[1] Similarly, organizations of collagen fibers in the extracellular matrix (ECM) at tendon-to-bone insertion sites transition from uniaxial alignment at tendons, to moderate alignment at fibrocartilage sites, to random organization at bones.[3] Likewise, in articular cartilage, collagen fibers in the superficial zone are parallel to the articular surface, randomly oriented in the middle zone, and perpendicular to the articular surface in the deep zone.[4] The other type of gradient in biological systems is related to a varying degree to the variations in local concentrations/contents of biominerals, inorganic ions, and biomolecules, and water. Compositional gradients play a critical role in developmental biology, tissue homeostasis, and tissue repair by enabling cells to infer their spatial location and determine their fate accordingly.[5–7] Morphogens acting as graded positional cues control cell fate specification in many developing tissues.[8,9] TGF-beta1 is secreted from the bone matrix and activated during bone tissue breakdown carried out by osteoclasts, resulting in a gradient that directs migration of bone mesenchymal stem cells (BMSCs) to bone remodeling sites, thereby balancing bone resorption and formation.[10]
Transforming the ideas of these naturally-occurring gradients into synthetic scaffolds renders tremendous potential to ameliorate their functions for regulating cell responses including distribution, morphology, adhesion (attachment), survival (proliferation), migration, metabolism, and differentiation.[9,11,12] Attempts have been made to fabricate scaffolds with structural (e.g., pore size, fiber organization) and compositional (e.g., minerals, adhesion ligands, growth factors) gradients using 3D printing, microfluidics, contact printing, ultraviolet-assisted capillary molding, porogen, thermally-induced phase separation, deposition, diffusion, etching, buoyancy, and centrifugal force.[2,11–25] However, these methods yield scaffolds that often lack biomimetic nanofibrous architecture, aligned topographic cues, 3D configuration, or high cell seeding efficiency. To maximize the physiological relevance and cell seeding efficiency and direct cell behavior, there is a great need to develop biomimetic 3D scaffolds with incorporation of structural and compositional gradients. We reported, for the first time, the conversion of 2D electrospun poly(ε-caprolactone) (PCL) nanofiber membranes into biomimetic, stem-cell regulating, 3D hierarchical assemblies with structural and compositional gradients. We chose PCL as raw material as it is biodegradable and biocompatible and has been used in many food and drug administration (FDA)-approved medical devices. The present study was based on several of our recent key findings: i) an innovative gas-foaming technology can expand 2D electrospun nanofiber mats in one direction; ii) a new method was invented that can transform 2D nanofiber membranes into 3D objects with hierarchical structure and controlled fiber alignment; iii) the incorporation of a surfactant (pluronic F-127) to nanofibers significantly increases hydrophilicity and subsequent gas bubble stability, resulting in a faster expansion rate of membranes; and iv) gelatin-coated expanded nanofiber scaffolds are superelastic and compressible. [26–31]
We first demonstrated the fabrication of 3D nanofiber scaffolds with structural gradients in pore sizes. By decreasing the amounts of pluronic F-127 incorporated to nanofibers in each successive layer, 2D nanofiber membranes can be converted into 3D assemblies with gradient in pore sizes after the gas-foaming expansion process as each successive layer expanded less than the previous layer. [26–28] Briefly, 1-mm thick PCL/pluronic F-127 nanofiber membranes were prepared by sequential deposition of PCL nanofibers with incorporation of 2%, 1%, 0.5% and 0% pluronic F-127 from bottom to top on the rotating mandrel as illustrated in Figure 1A. Figure 1B shows a typical photograph of an expanded 3D nanofiber scaffold with a pore size gradient following the gas-foaming expansion. The length percentage of each region after expansion significantly increased with increasing the amount of blended pluronic F-127 from 0 to 2% (Figure 1C). Figure 1D shows SEM images of each distinct regions, revealing a gradual increase in pore sizes with increased blended pluronic F-127 content, resulting in a gradual decrease of density (Figure S1). Gap distances in each region ranged from (98.5 ± 40.3) μm, to (271.2 ± 64.5) μm, to (940.7 ± 177.3) μm, and further to (1711.9 ± 225.8) μm which corresponded to 0%, 0.5%, 1% and 2% of pluronic F-127 blend. Regions blended with more pluronic F-127 had lower maximum compressive stress (Figure 1F and Figure 1G). Pluronic F-127 reduces the surface tension and occupies the interface between the gas phase and liquid phase, and inhibits the diffusion of H2 gas, thereby stabilizing H2 gas bubbles and accelerating the expansion of nanofiber membranes.[30] We speculate that the formation of 3D nanofiber scaffolds with gradient in pore sizes were due to regionally different pluronic F-127 concentrations and that the expansion rate of the regions with incorporation of less pluronic F-127 was slower compared to the regions containing more pluronic F-127 (Figure 1H). The 3D nanofiber scaffolds with gradient in pore sizes can be used to create a gradient hypoxic environment that plays an important role in regulating stem cell responses. The hypoxia level can gradually decrease by increasing the pore sizes of regions containing 0 to 2% pluronic F-127 (Figure 1I). The principle of hypoxia gradients rendered by such 3D scaffolds is similar to the rolling of scaffold strip and stacking of paper scaffolds reported earlier, which is mainly due to the slower diffusion of oxygen in the denser region.[32,33] By comparison, the 3D scaffolds developed in this work are more physiologically relevant due to the ECM-mimicking nanofibrous matrix.[34]
Figure 1. Preparation and characterization of a nanofiber scaffold with a discrete gradient in gap distance.
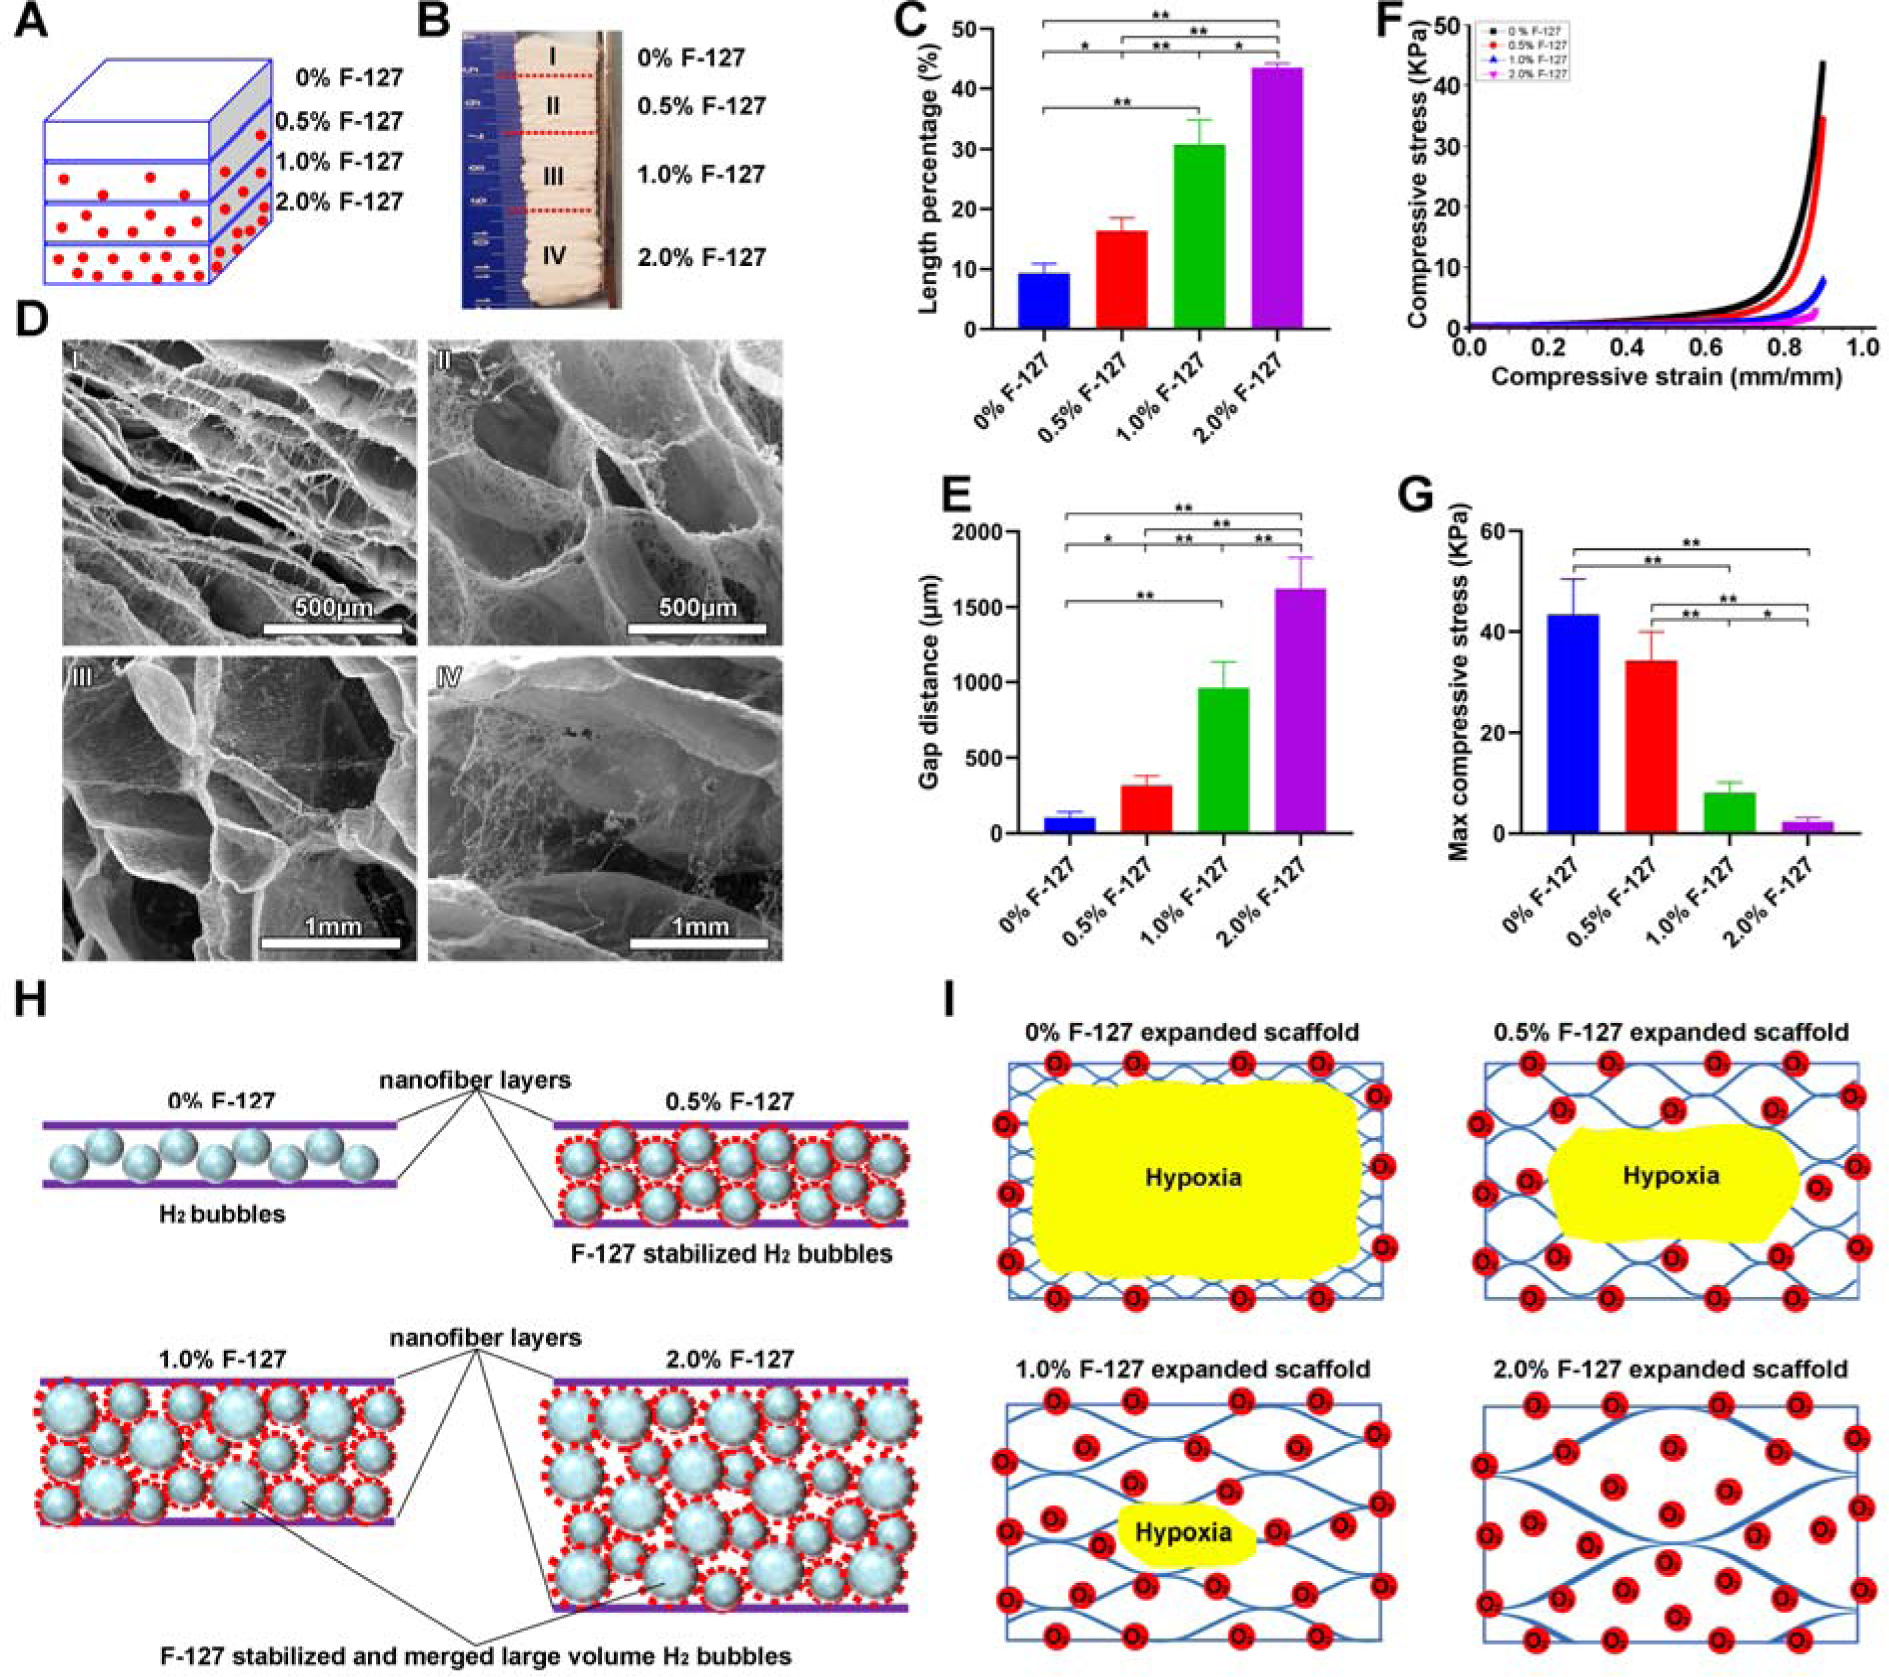
(A) Schematic illustrating a 1-mm thick PCL nanofiber mat consists of 4 regions containing 2%, 1%, 0.5% and 0% F-127 from bottom to top (each region: 250 μm). (B) Photograph of an expanded PCL nanofiber scaffold consisting of 4 regions containing 2%, 1%, 0.5% and 0% F-127 from bottom to top. (C) The length percentage of each region of expanded 3D PCL nanofiber scaffolds. (D) The morphology of cross-sections (Y-Z plane) of each region of expanded PCL nanofiber scaffolds. (E) The gap distance between two adjacent layers in each region of expanded PCL nanofiber scaffolds. (F) The compressive stress-strain curves of each region of expanded PCL nanofiber scaffolds. (G) The maximum compressive stress of each region of expanded PCL nanofiber scaffolds. (H) Schematic illustrating the expansion process of PCL nanofiber mats with blending different amounts of F-127. The F-127 additive not only enhances the hydrophilicity and water penetration of PCL nanofiber mats, and but also stabilizes the formed H2 bubbles. The small H2 bubbles can merge and grow larger in volume with increasing the concentration of F-127, resulting in a higher expansion rate. (I) Schematic showing the oxygen level of each region in expanded PCL nanofiber scaffolds in cell culture medium. * p<0.05, **p<0.01.
To demonstrate the effect of pore size on the cell response, we seeded BMSCs onto expanded, rectangular nanofiber scaffolds (10 mm × 10 mm × 6–8 mm) which were generated following our previous protocols.[26–28] In this study, F-127 was removed by washing with ice water after expansion. In addition, the expanded nanofiber scaffolds were further coated with gelatin to enhance the biocompatibility of scaffolds. To enhance the cell seeding efficiency, the rectangular-shaped scaffolds were immersed in the cell suspension and further expanded to allow cells to penetrate into scaffolds by vacuum for 10 s inspired by the working principle of window blinds, thus facilitating increased cell penetration into scaffolds (Figure S2A). Using this method allows cell seeding efficiency to reach nearly 50%, which is significantly higher than traditional seeding methods without applying vacuum (often < 30%) (Figure S2B).[35] BMSCs-seeded scaffolds were incubated in the proliferation medium for 9 days and subsequently divided into two groups (porous and dense scaffolds) (Figure S2C). The porous group maintained the heights of 6–8 mm, and the dense group was compressed to the heights of around 1 mm (Figure S2D and Figure 2A and 2B). These two groups of scaffolds were further incubated in the chondrogenic and osteogenic differentiation medium for 7 and 14 days (Figure S2E). Figure S2F and S2G show SEM images of the cross sections of the 6–8 mm and 1-mm high scaffolds, indicating the porous and dense structures, which corresponded to the regions containing 1% and 0% pluronic F-127, respectively. The middle of the top, medium, and central layers of porous and dense scaffolds were used for microscopic examination (Figure 2C).
Figure 2. BMSCs culture on expanded nanofiber scaffolds with dense and porous structures.
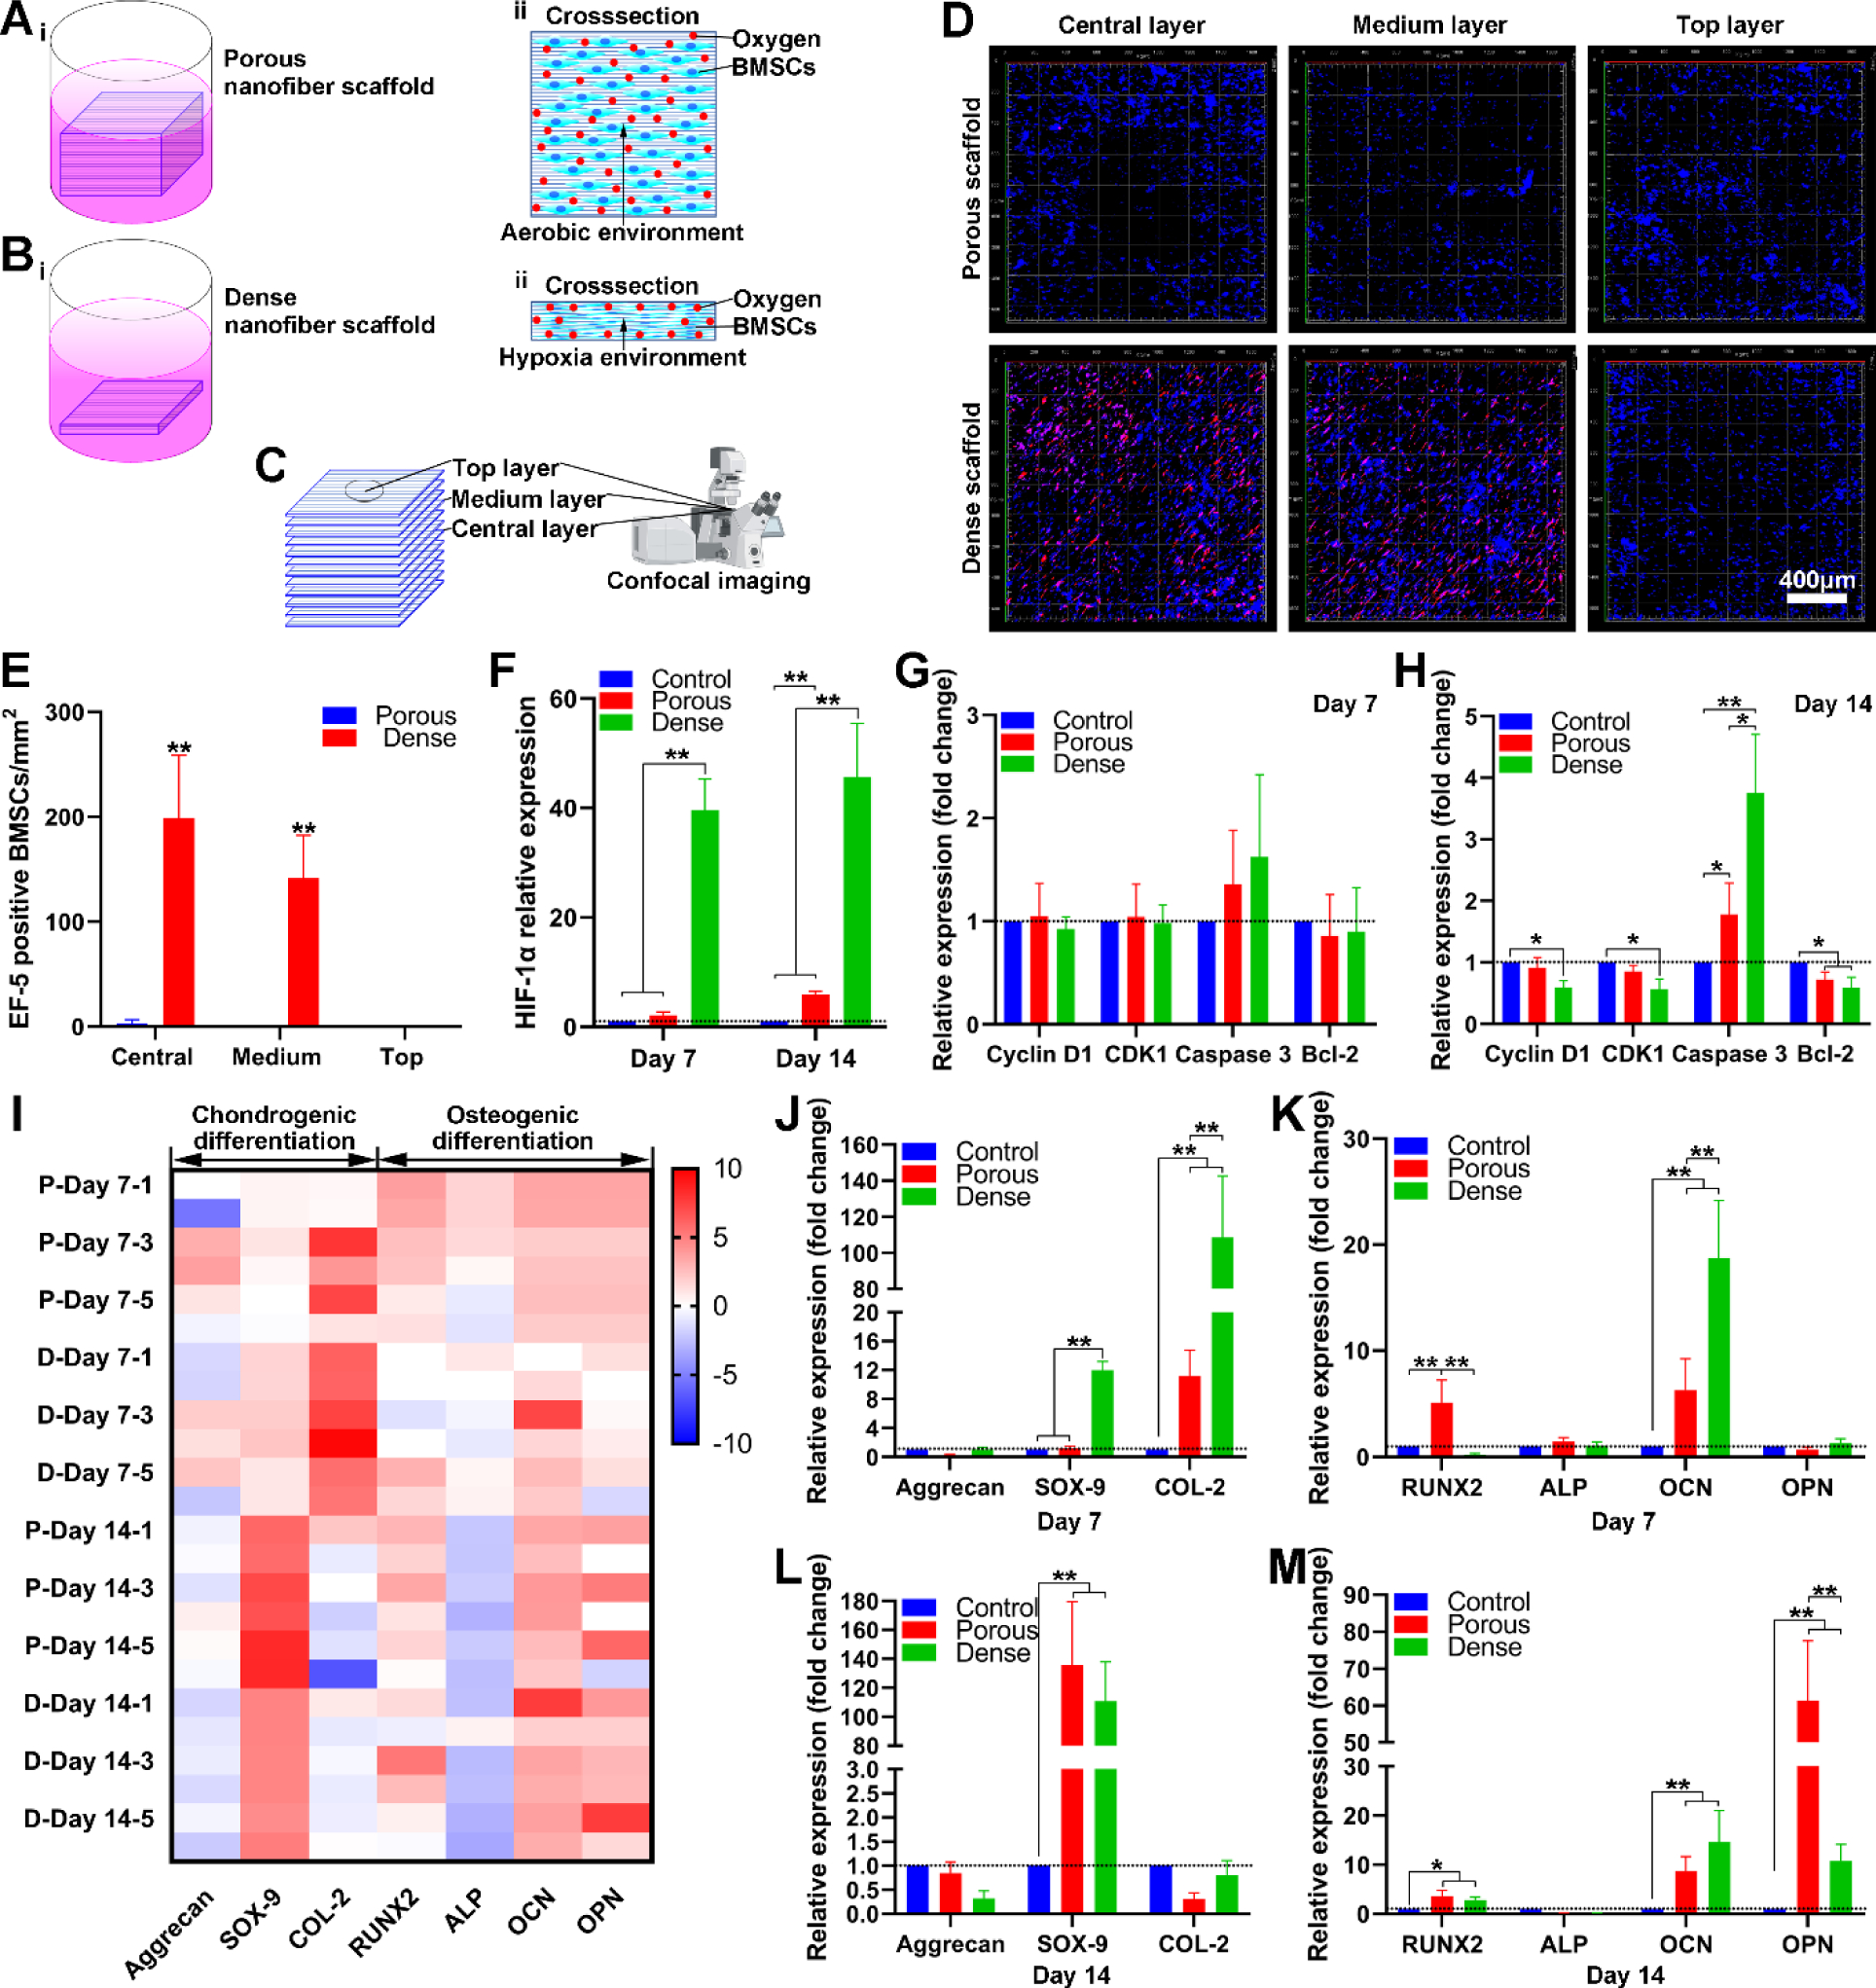
(A) Schematic illustrating BMSCs culture on expanded nanofiber scaffolds with porous structure (i), the cross-section of BMSCs on nanofiber scaffolds with porous structure (ii). (B) Schematic illustrating BMSCs culture on expanded nanofiber scaffolds with dense structure (i), the cross-section of BMSCs seeded nanofiber scaffold with dense structure (ii). (C) Schematic illustrating the top layer, medium layer, and central layer of BMSCs on nanofiber scaffolds. (D) EF-5 staining of BMSCs on nanofiber scaffolds with porous and dense structures after 7 days of culture in the proliferating medium. (E) The quantification of EF-5 positive BMSCs seeded on nanofiber scaffolds with porous and dense structures after 7 days of culture in the proliferating medium. (F) The relative expression of HIF-1α of BMSCs on nanofiber scaffolds with porous and dense structures after culture in the chondrogenic differentiation medium for 7 and 14 days. (G, H) The relative expression Cyclin D1, CDK1, Caspase 3, and Bcl-2 on BMSCs on nanofiber scaffolds with dense and porous structures after culture in the chondrogenic differentiation medium for 7 and 14 days. (I) The heatmap visualizes the chondrogenic and osteogenic differentiation related gene expression profiles of BMSCs on nanofiber scaffolds with dense and porous structures. Blue color indicates down-regulation and red color indicates up-regulation. P-day x-y: Sample y of BMSCs on porous scaffolds after x days of differentiation. D-day-x-y: Sample y of BMSCs on dense scaffolds after x days of differentiation. (J, K) The relative expression of aggrecan, SOX-9, Collagen type 2 of BMSCs on nanofiber scaffolds with dense and porous structures after chondrogenic and osteogenic differentiation for 7 days. (L, M) The relative expression of RUNX-2, ALP, OCN, OPN of BMSCs on nanofiber scaffolds with dense and porous structures after chondrogenic and osteogenic differentiation for 14 days.
Figure 2D and 2E show that BMSCs in the top layers of the porous and dense nanofiber scaffolds had similar expression patterns of (2-(2-Nitro-1H-imidazol1-yl)-N-(2,2,3,3,3-pentafluoropropyl) acetamide) (EF-5), a cellular hypoxic indicator.[33] In contrast, the medium and central layers of the dense scaffolds had a significantly higher number of EF-5 positive cells than the medium and central layers of the porous scaffolds. Compared to the BMSCs on culture plates and porous scaffolds, the BMSCs on the dense scaffolds showed a significant increase in the expression of hypoxia-inducible factor 1-alpha (HIF-1α), a major transcriptional regulator of cellular and developmental responses to hypoxia (Figure 2F).[36] These results indicated that a hypoxic environment could be established in the dense region of expanded 3D nanofiber scaffold with gradient in pore sizes. In addition, BMSCs on both porous and dense groups showed the similar expression of cell cycle-related genes (Cyclin D1 and CDK1), apoptotic (Caspase-3), and anti-apoptotic related genes (Bcl-2) after incubation for 7 days in the chondrogenic differentiation medium (Figure 2G). However, after incubation for 14 days, BMSCs in the dense group showed a decrease in the Cyclin D1 and CDK 1 expression compared to the control (Figure 2H). The expression of Caspase-3 was significantly increased in both porous and dense groups compared to the control, while the expression of Bcl-2 was decreased (Figure 2H). These results suggest that a long-term hypoxic environment may inhibit BMSCs proliferation and promote BMSCs apoptosis.
Gene expression heatmapping showed the upregulation and downregulation of chondrogenic and osteogenic differentiation-related genes of BMSCs on porous and dense scaffolds indicated by red (upregulated) and blue (downregulated) colors (Figure 2I). On one hand, after 7 days of chondrogenic differentiation, relative SOX-9 and type 2 collagen expression of BMSCs on dense scaffolds was dramatically increased relative to cells on the porous scaffolds (Figure 2J). Relative SOX-9 expression of BMSCs on both porous and dense scaffolds was higher than the control after 14 days of chondrogenic differentiation (Figure 2L). The safranin O staining also revealed that more proteoglycans were detected in dense nanofiber scaffolds on both Day 7 and Day 14, with the highest concentrations in the central layers having the highest level of hypoxia (Figure S3B and S3D). On the other hand, after 7 days of osteogenic differentiation, relative RUNX2 expression of BMSCs on porous nanofiber scaffolds was higher than those on both dense scaffolds and controls. In contrast, the OCN expression of BMSCs on the dense scaffolds was higher than those on both porous scaffolds and controls (Figure 2K). After 14 days of osteogenic differentiation, no difference was observed in the expression of RUNX-2, OCN, and OPN of BMSCs on porous or dense scaffolds, but cells on both scaffolds expressed each gene higher than the controls (Figure 2M). Although there was no trend in expression of osteogenic differentiation related genes, the Alizarin Red S staining results indicated a mass of deposited calcium in the central and intermediate layers of the dense scaffolds after 7 days of osteogenic differentiation (Figure S3A). However, no difference was observed in the calcium deposition between the porous and dense scaffolds after 14 days of osteogenic differentiation (Figure S3C). Differences in proteoglycans and deposited calcium were not caused by the disparity of cell numbers on scaffolds (Figure S4).
Taken together, these results indicate that dense nanofiber scaffolds can provide a hypoxic environment and promote chondrogenic differentiation of BMSCs while exerting marginal influence on osteogenic differentiation better than porous scaffolds. Recent studies demonstrated the implantation of BMSCs after osteogenic differentiation or hypoxia preconditioned BMSCs can enhance bone regeneration in vivo compared to undifferentiated cells.[37,38] In addition, chondrogenic differentiation of BMSCs can recapitulate the bone development and endochondral ossification for bone regeneration.[39,40] Therefore, the 3D nanofiber scaffolds with gradients in pore sizes developed in this work show a great potential in engineering heterogeneous tissue constructs for osteochondral repair. After BMSCs seeding and proliferation, expanded scaffolds could be compressed to form a tunable hypoxic environment for regulating chondrogenic differentiation by modulating gene expression, which may offer increased control in cartilage and bone repair. Such nanofiber assemblies could also be used as a biomimetic hypoxia platform for cell biology study.
In addition to 3D nanofiber assemblies with gradients in pore sizes as above-mentioned, we also prepared 3D expanded nanofiber scaffolds with dual gradations in both pore sizes and fiber organizations. Briefly, a 1-mm thick PCL nanofiber mat was first produced by sequential deposition of random fibers, partially aligned fibers, and aligned fibers by increasing the rotating speed of the mandrel during electrospinning (Figure 3A). Next, the fiber mat was expanded to form 3D nanofiber scaffolds using the aforementioned gas-foaming technology (Figure 3B). [26–28] Figure 3C shows SEM images of the cross sections of expanded 3D scaffolds, revealing that pore size increased as fiber alignment increased from randomly oriented, to partially aligned, and to uniaxially aligned. The length percentages of each region were (13.11 ± 0.97) %, (21.31 ± 2.58) %, and (65.57 ± 1.29) % (Figure 3D). Corresponding maximum pore sizes were (98.04 ± 47.62), (460.78 ± 160.77) and (843.13 ± 130.89) μm (Figure 3E). Fiber orientation in each region was computed via OrientationJ, an Image J plugin, which confirmed the gradation of fiber organizations from regions I to III (Figure 3F and 3G). Gradation in pore sizes is attributed to disparity of expansion rates between random, partially aligned, and aligned nanofiber regions, as aligned nanofiber membranes may require smaller forces to expand between nanofiber layers, while random nanofiber membranes require larger forces to separate the sequentially deposited layers due to the fiber entanglement. Scaffolds with dual gradients can be used to recapitulate the native ECM structure while regulating cell response. In addition, 3D scaffolds with graded fiber alignment in parallel can be generated through expansion in a customized mold, coating and crosslinking based on our recent study.[31] These scaffolds could be used to closely mimic ECM fiber organizations at tissue interfaces such as tendon-to-bone insertion site.[3]
Figure 3. Fabrication and characterization of expanded nanofiber scaffolds with dual gradations in both dap distances and fiber organizations.
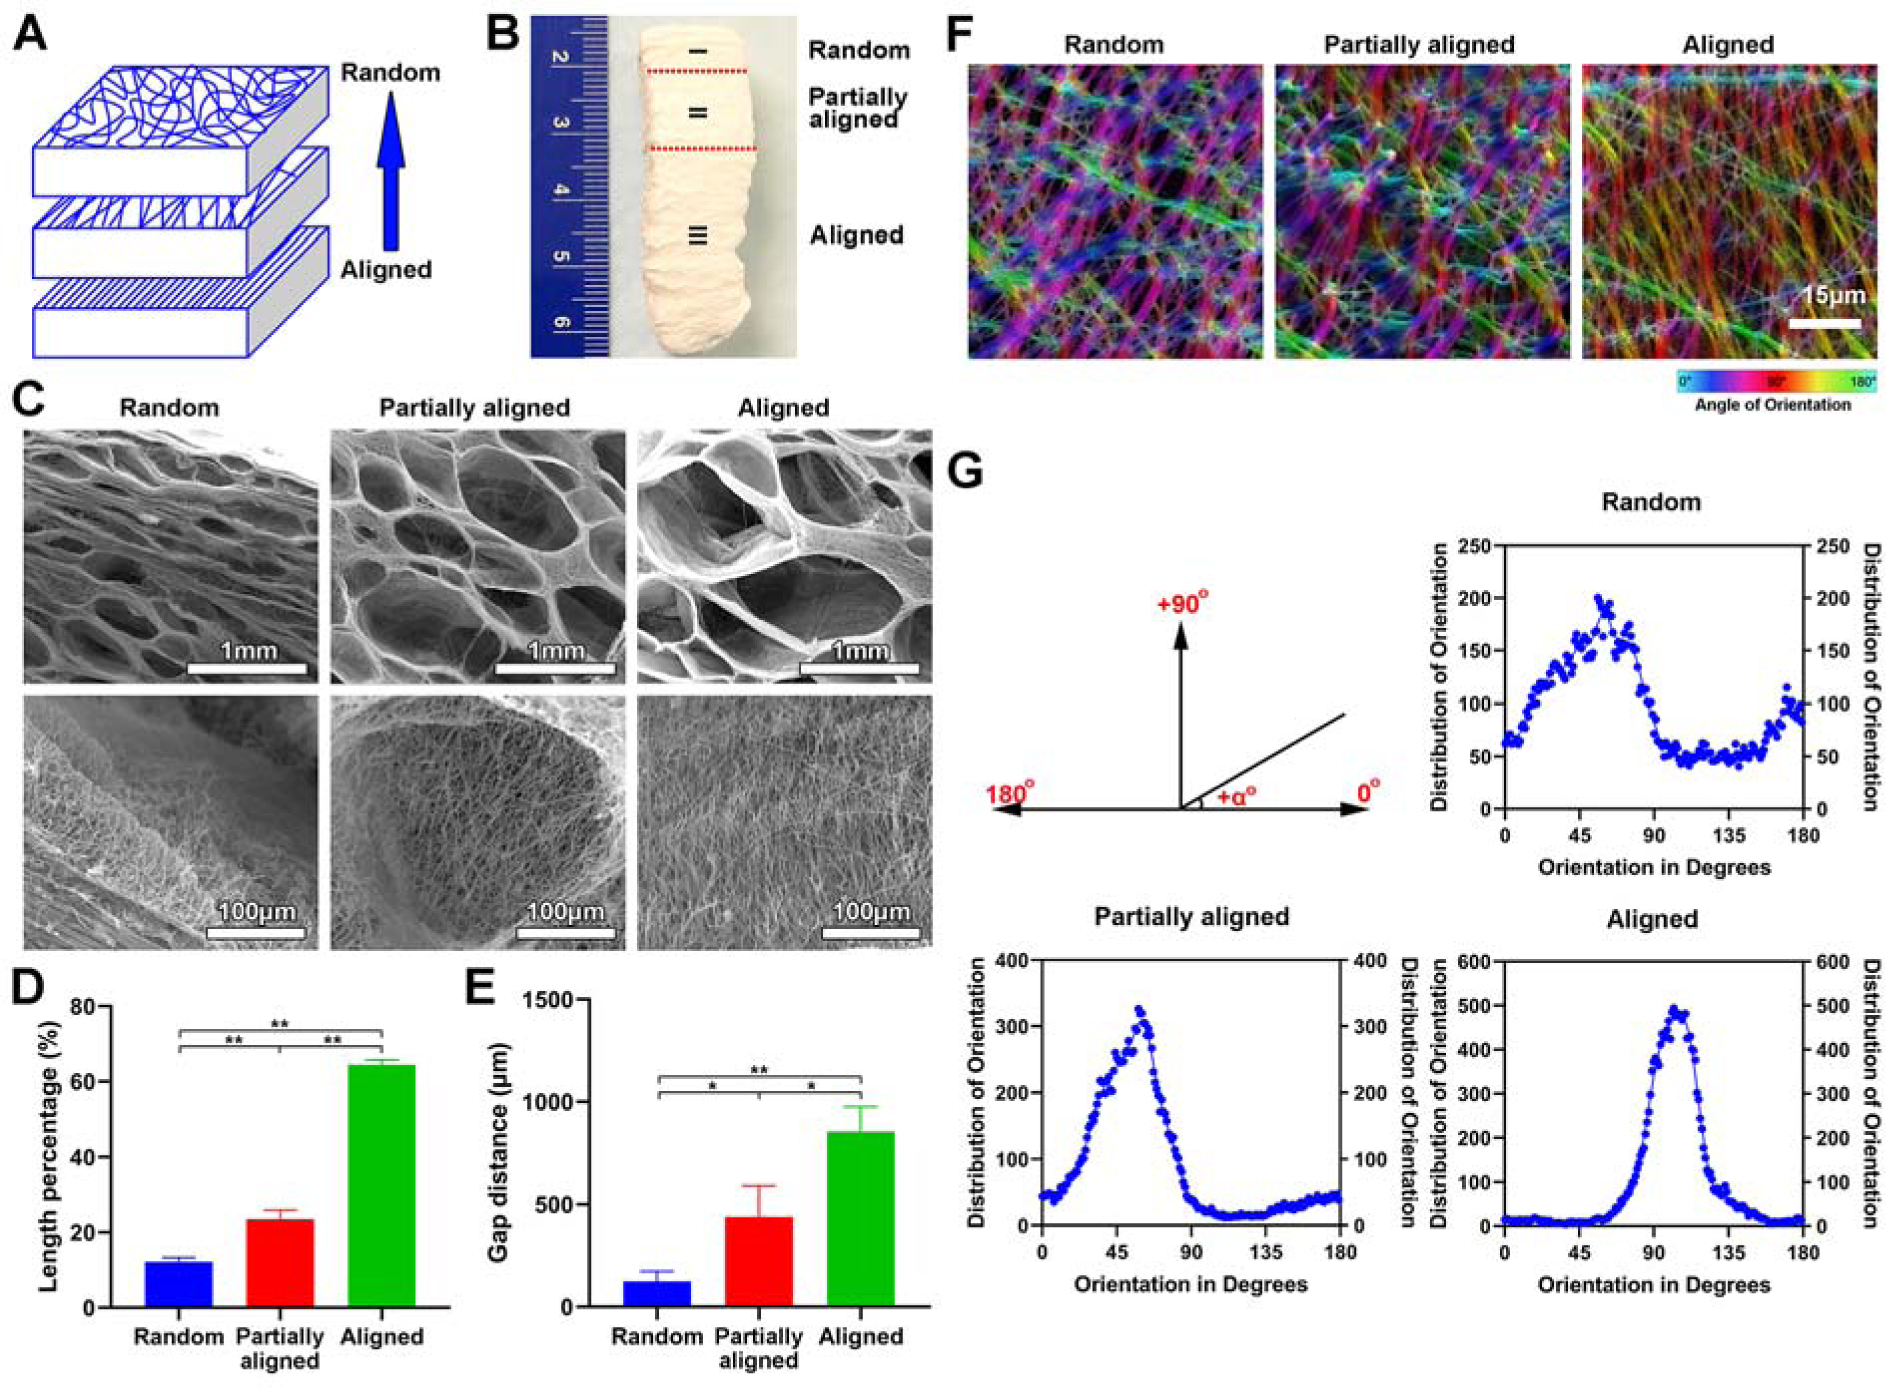
(A) Schematic illustrating the 1-mm thick PCL fiber mat composed of aligned (bottom), partially aligned (middle), and random (top) nanofibers. (B) Photograph of expanded nanofiber scaffolds composed of aligned (bottom), partially aligned (middle), and random (top) nanofibers. (C) The morphology of cross-sections (Y-Z plane) of each region of expanded nanofiber scaffolds composed of aligned (bottom), partially aligned (middle), and random (top) nanofibers. Bottom row: the corresponding highly magnified SEM images showing the nanofiber orientation in each region of expanded nanofiber scaffolds composed of aligned (bottom), partially aligned (middle), and random (top) nanofibers of (B) (top row). (D) The length percentage of each region of expanded nanofiber scaffolds composed of aligned (bottom), partially aligned (middle), and random (top) nanofibers. (E) The gap distance between two adjacent nanofiber layers in each region of expanded nanofiber scaffolds composed of aligned (bottom), partially aligned (middle), and random (top) nanofibers. (F) False-color images of nanofibers in each region of expanded nanofiber scaffolds composed of aligned (bottom), partially aligned (middle), and random (top) nanofibers indicate the angle mapping of fiber orientations. (G) The angle distribution of nanofiber orientations in each region of expanded nanofiber scaffolds composed of aligned (bottom), partially aligned (middle), and random (top) nanofibers.
In addition to the structural gradient, we fabricated 3D nanofiber assemblies with compositional gradients. Following our recently published protocols, we transformed 2D electrospun membranes into 3D scaffolds consisting of radially aligned nanofibers by solids-of-revolution inspired expansion. Briefly, the 2D nanofiber mat is cut into a rectangular shape in liquid nitrogen. Then, one side of the rectangular mat is fixed by thermal treatment. Finally, the rectangular mat with one side fixed is expanded using a gas-foaming technique to generate a cylindrical scaffold consisting of radially aligned nanofibers.[30] Radially-aligned pores were capable of guiding and promoting cell migration from the surrounding tissue to the center of the scaffolds, accelerating wound healing. To demonstrate the formation of compositional gradient, rhodamine aqueous solution was dripped to the center of the transformed 3D scaffold and allowed to diffuse outward. Fluorescent images showed a gradation in rhodamine 6G content along the radial direction of the 3D scaffolds (Figure 4A). Rhodamine 6G diffusion area was increased by increasing the volume of dripped rhodamine solution from 3 μL to 9 μL (Figure 4A, i–iv). Figure 4Av shows the false-color images of 3D scaffolds, allowing visualization of the rhodamine 6G gradients by fluorescent intensity heatmapping. In addition, the rhodamine 6G diffusion also occurred along the axial direction from top to bottom with a depth of 1.0 mm which was equal to the thickness of the scaffold (Figure 4B). To quantify rhodamine 6G gradation, scaffolds were divided by four regions and the relative fluorescence intensities were measured, indicating a gradual decrease from the center to the edge (Figure 4C). To further quantify the rhodamine 6G gradation, ten samples of each region were collected by punching (Figure 4D). The total amount of rhodamine 6G in each region from the center to the edge was 23.12 ± 6.34 μg, 13.76 ± 4.21 μg, 5.02 ± 3.50 μg, and 1.17 ± 0.43 μg, respectively (Figure 4E). Quantified rhodamine amounts showed a similar trend as fluorescent intensity analysis. The cumulative release profiles of rhodamine 6G from 3D gradient scaffolds showed an initial burst release, with a plateau arising within 6 and 24 h, respectively (Figure 4F). Blending Gel-MA with the rhodamine 6G solution and crosslinking can be used to reduce the release rate of rhodamine 6G (Figure 4G).
Figure 4. Preparation and characterization of expanded nanofiber scaffolds with compositional gradients.
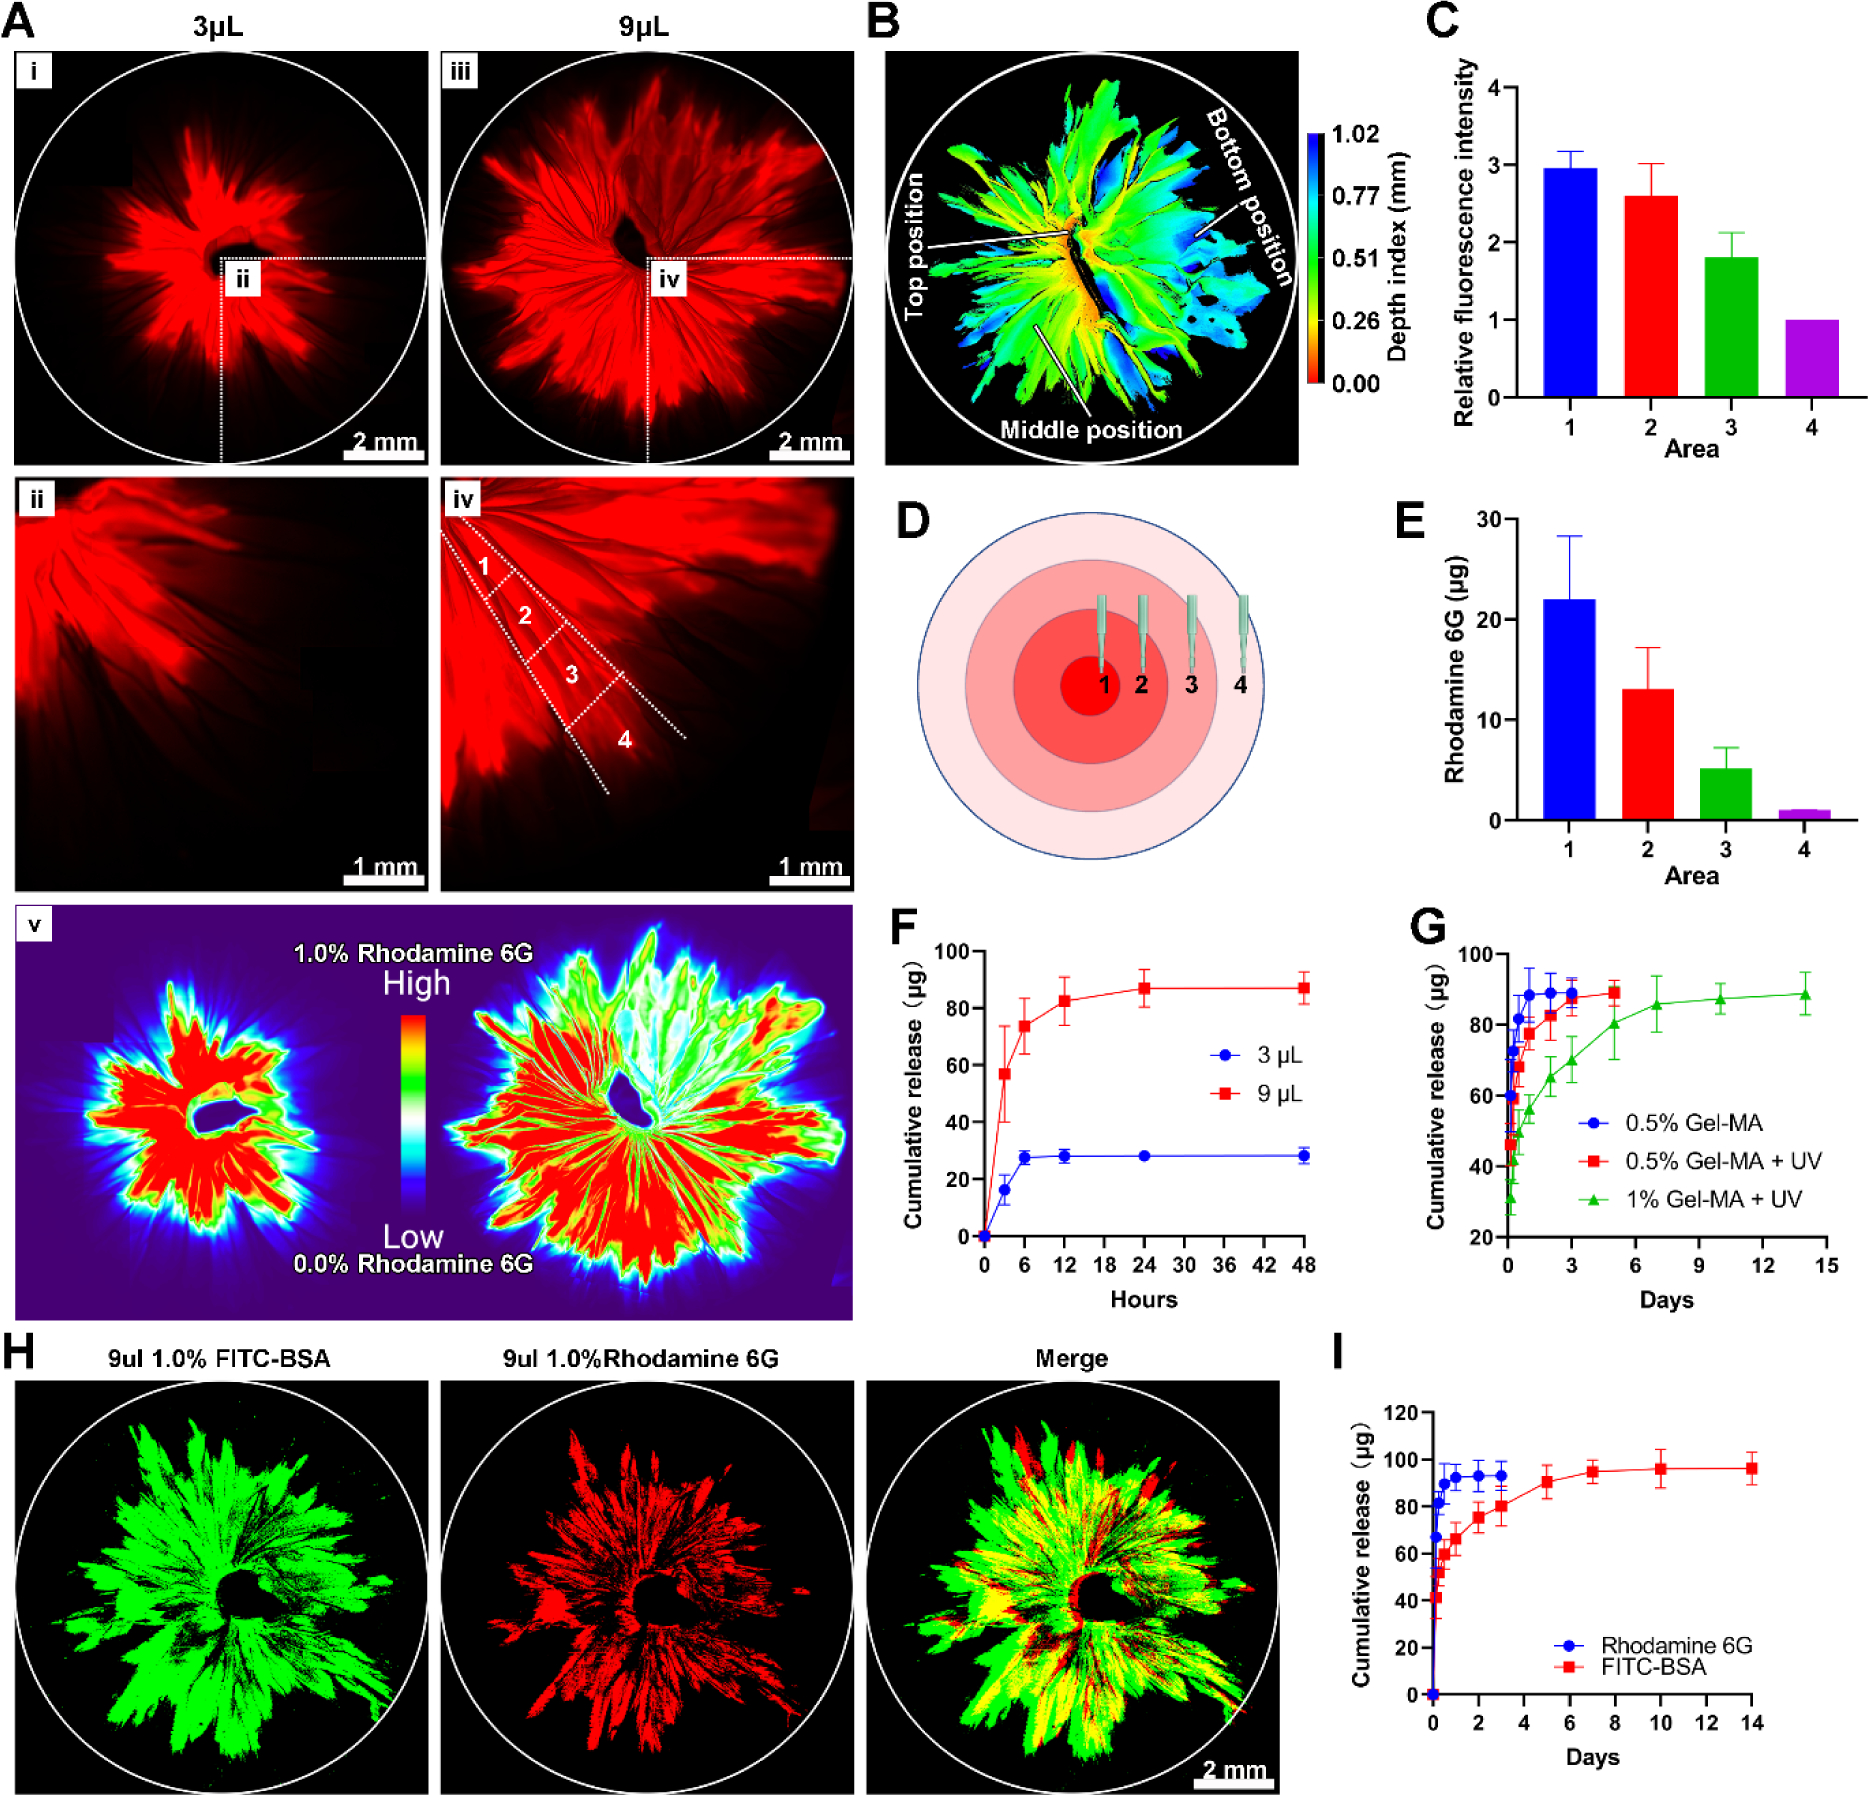
(A) The fluorescent images show a 3D radially aligned nanofiber scaffold with a gradation in rhodamine 6G content along the radial direction. The rhodamine 6G gradient was formed by dripping 3 μL (i & ii) or 9 μL (iii & iv) of 0.3% rhodamine aqueous solution to the center of scaffolds. (v) False-color images of 3D scaffolds consisting of radially aligned nanofibers after dripping 3 μL and 9 μL 0.3% rhodamine aqueous solution to the center of scaffolds. (B) The confocal image indicates dripping was able to load drugs throughout the whole scaffold from top to bottom. (C) Quantification of the fluorescence intensity in each region labeled in (A). (D) Schematic illustrating 10 samples were collected from each region by 1-mm punch. (E) Quantification of total released rhodamine 6G from 10 collected samples of each region labeled in (D). (F) Rhodamine 6G release profiles from 3D radially aligned nanofiber scaffolds after dripping 3 μL and 9 μL of 0.3% rhodamine 6G aqueous solution to the center. (G) Rhodamine 6G release profiles from 3D radially aligned nanofiber scaffolds after dripping 9 μL of 0.3% rhodamine 6G solution containing 0.5% and 1% Gel-MA to the center without and with UV crosslinking. 0.5% Gel-MA: 0.3% rhodamine 6G solution containing 0.5% Gel-MA without UV crosslinking. 0.5% Gel-MA+UV: 0.3% rhodamine 6G solution containing 0.5% Gel-MA with UV crosslinking. 1% Gel-MA+UV: 0.3% rhodamine 6G solution containing 1% Gel-MA with UV crosslinking. (H) The fluorescent images show a 3D radially aligned nanofiber scaffold with dual gradations in rhodamine 6G and FITC-BSA contents along the radial direction from the center to the edge. (I) Rhodamine 6G and FITC-BSA release profiles from 3D radially aligned nanofiber scaffolds with dual gradations in rhodamine 6G and FITC-BSA contents along the radial direction from the center to the edge.
In addition to the gradient of single compound, multi-composition gradients can be achieved based on the same principle. Figure 4H shows the fluorescent images of a 3D radially aligned nanofiber scaffold with dual gradations in rhodamine 6G (red) and FITC-BSA (green) content along the radial direction by successively dripping 1% FITC-BSA Gel-MA solution, crosslinking, and adding 0.3% rhodamine 6G solution. All the rhodamine 6G released within 1 day, while FITC-BSA showed a sustained release over 7 days (Figure 4I).
To examine the effect of compositionally-graded scaffolds on cell response, 3D radially aligned nanofiber scaffolds with graded basic fibroblast growth factor (bFGF) were created using the method above-mentioned as bFGF can promote cell migration, angiogenesis, and ECM deposition during wound healing.[41] To illustrate the recruitment of cells towards the center of the scaffold, an in vitro wound model was first created by seeding GFP-labeled human dermal fibroblasts to Gel-MA hydrogels. After cells reached 90% confluency and an 8-mm diameter defect at the center was created through punching, the 3D radially aligned nanofiber scaffold (8 mm) with graded bFGF was inserted into the defect (Figures 5A, B and S5). Figure 5C shows fluorescent images indicating that more fibroblasts were detected on the bFGF gradient scaffold compared to scaffolds without and with supplement of equivalent dose of free bFGF after 4 and 8 days of incubation. Moreover, detected fibroblasts showed a spatially diverse distribution in all groups. The total number of detected fibroblasts (Figure 5D) and cell-containing surface coverage (Figure 5E) of bFGF gradient scaffolds were markedly higher than the scaffolds with and without supplement of free bFGF. We speculate that cells on the surface of Gel-MA hydrogels could not only migrate directly to the surface of 3D scaffolds, but also migrate downwards along the wall of the punched hole, simultaneously migrating into the scaffolds at varying depths, as evidenced by the 3D distribution of detected fibroblasts (Figure 5F). Based on the same strategy, nanofiber assemblies with gradients in other growth factors, cytokines, peptides, DNA plasmids, microRNA, and siRNA are possible for enhancing their biological functions and facilitating wound healing and tissue regeneration. Furthermore, the combination of multiple biological molecules can achieve better therapeutic effects.[42] 3D nanofiber assemblies with gradient in multiple compositions (e.g., two growth factors) can be produced based on this strategy, which may allow spatial control of various signaling molecules for effectively regulating cell response.
Figure 5. Applications of 3D radially aligned nanofiber scaffolds with a bFGF gradient along the radial direction for wound healing by recruiting cells towards the center.
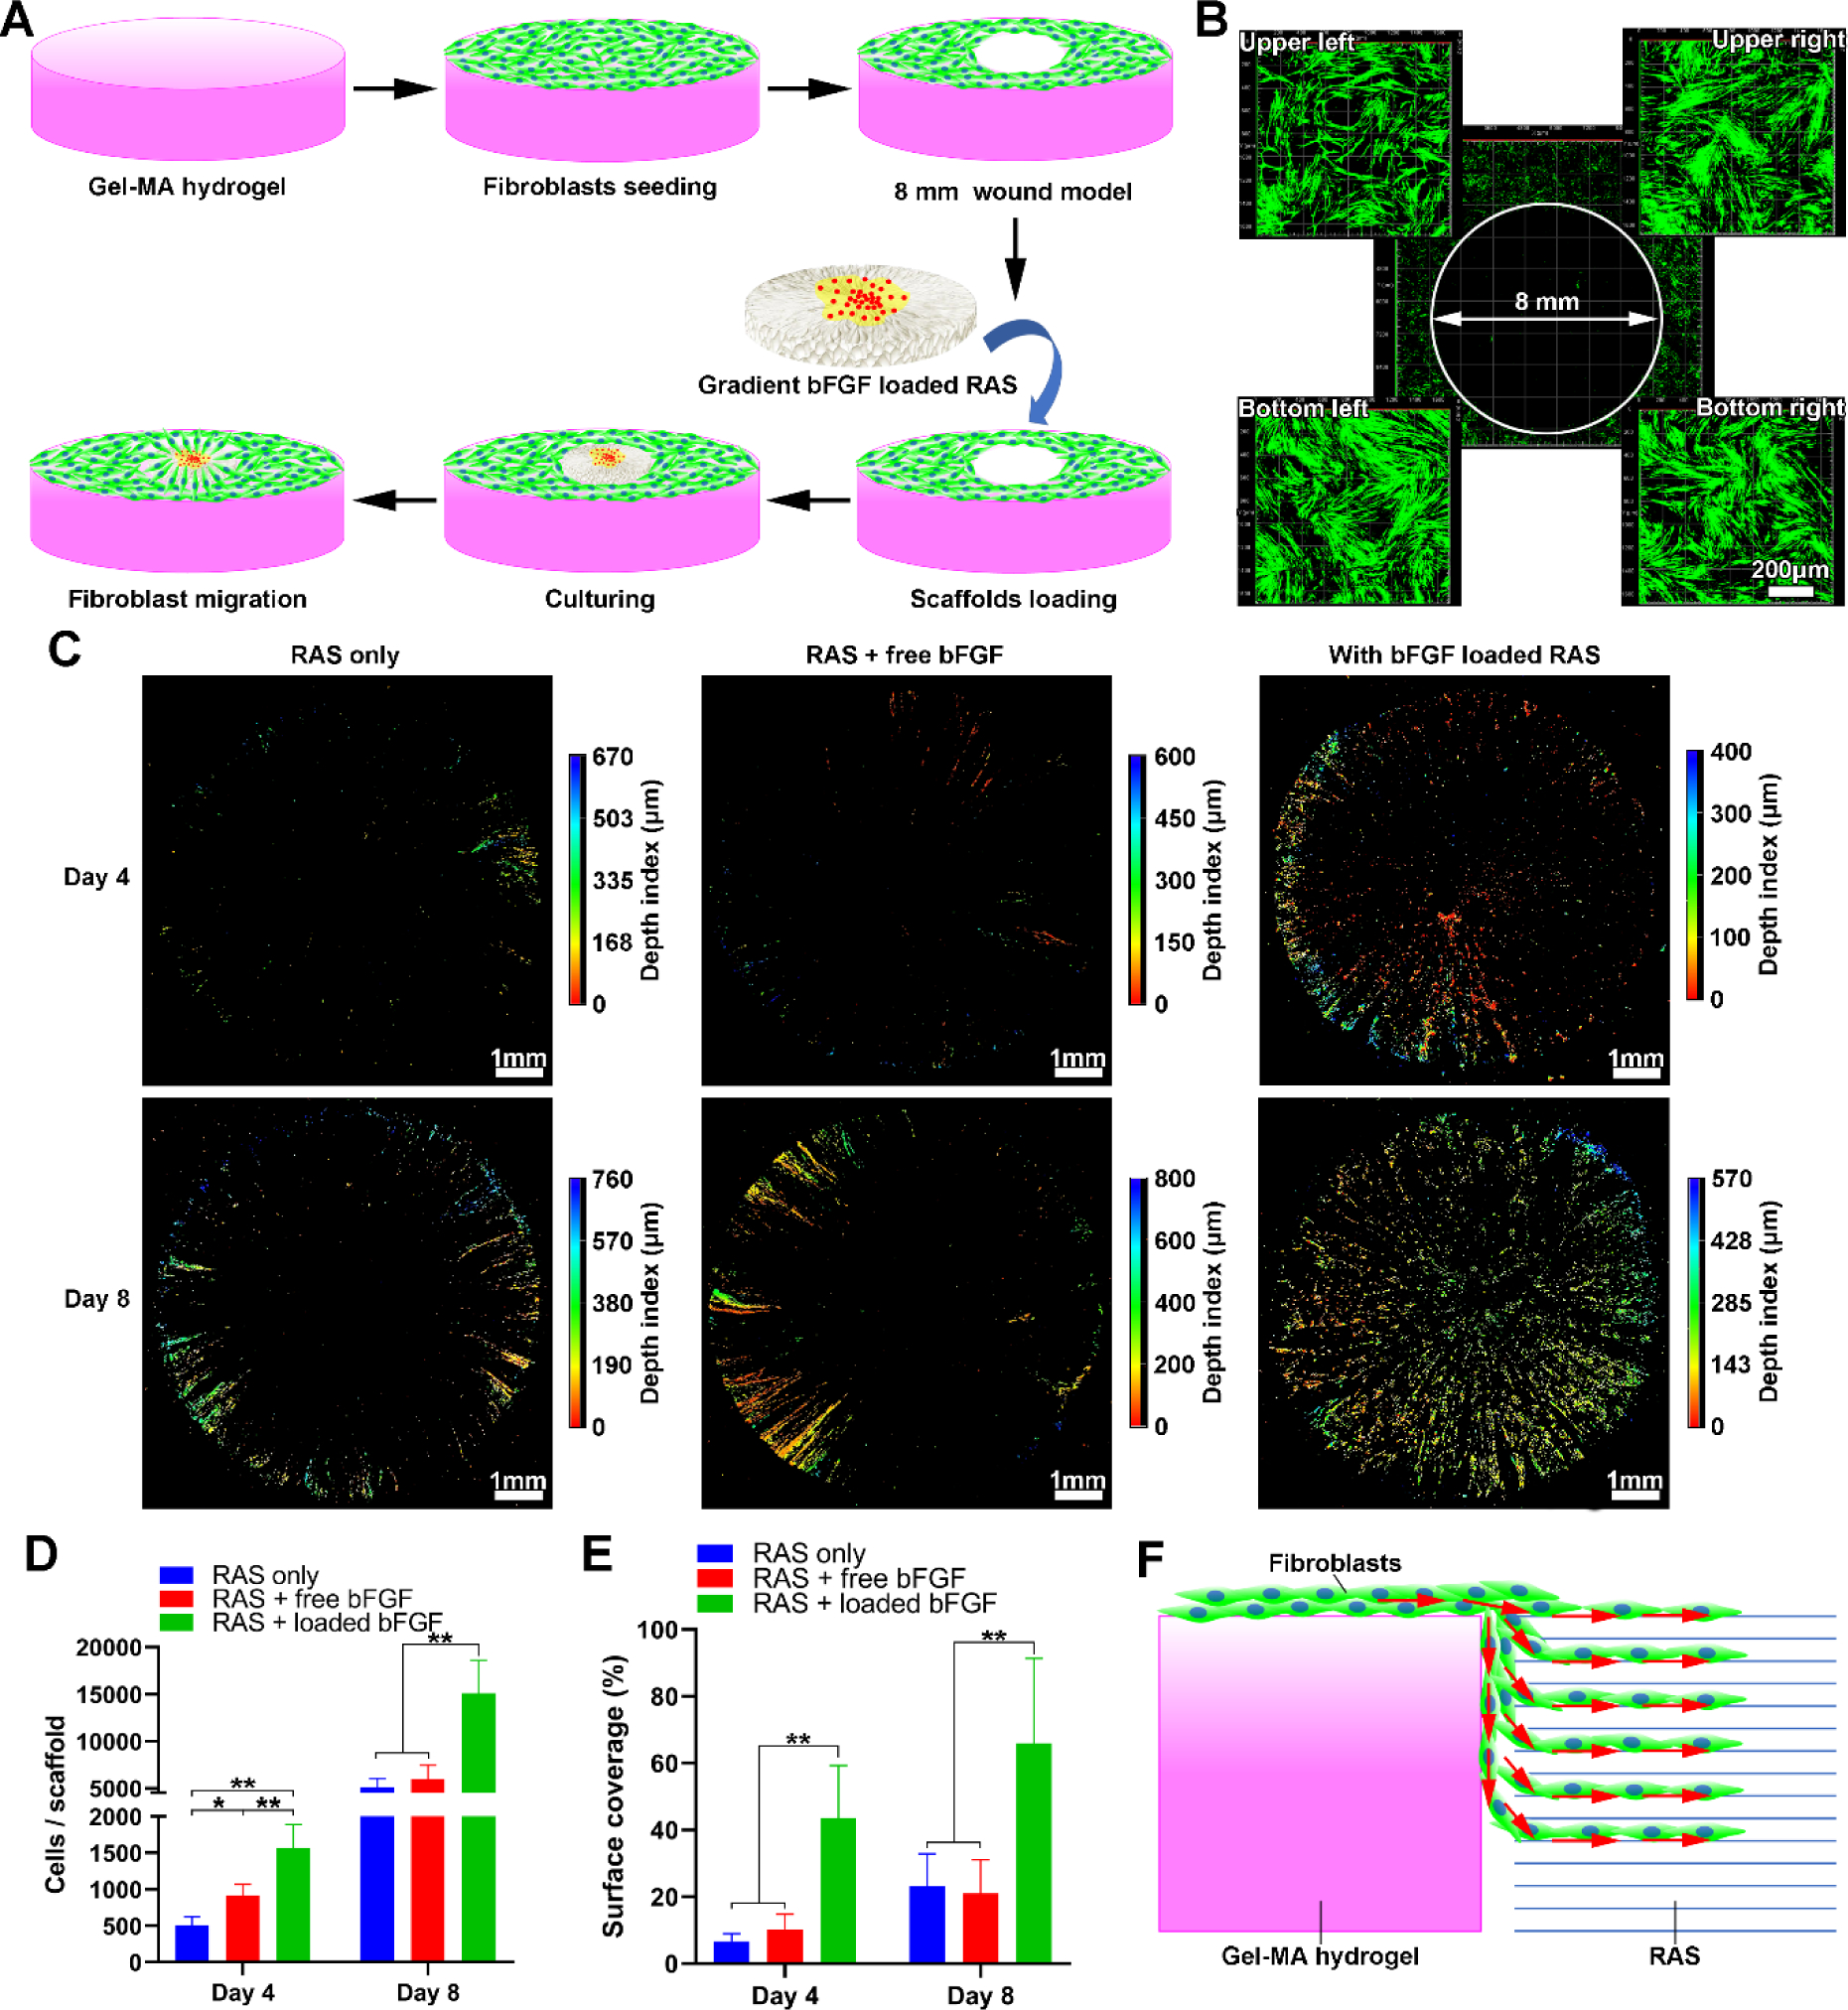
(A) Schematic illustrating the 3D scaffold (8 mm) consisting of radially aligned nanofibers with gradations in the bFGF content that enhances wound healing by guiding and accelerating cell migration. The in vitro wound model (8 mm) is created by punching the Gel-MA hydrogel with GFP-labeled human dermal fibroblasts seeded on the surrounding area. (B) Fluorescent images show GFP-labeled human dermal fibroblasts around the 8-mm hole. (C) Fluorescent images show the migrated GFP-labeled human dermal fibroblasts into 3D scaffolds after 4 and 8 days of culture. (D, E) The quantification of cell counts and surface coverage (%) per scaffold after 4 and 8 days of culture. (F) Schematic illustrating the possible migration routes of GFP-labeled human dermal fibroblasts from the surface of the Gel-MA hydrogel to 3D scaffolds. *p<0.05, **p<0.01. RAS: radially aligned nanofiber scaffolds.
Another method to fabricate compositionally-graded scaffolds is possible by expanding nanofiber mats consisting of sequentially deposited nanofiber layers using rapid depressurization of subcritical CO2 fluids (Figure S6).[29] This strategy could retain the bioactivity and prevent the loss of encapsulated biological molecules, as well as achieve sustained release over a longer period of time than the aforementioned method.
In summary, we have demonstrated new methods for fabricating 3D nanofiber assemblies with gradients in structure and composition. The 3D nanofiber scaffolds with gradients in pore sizes were created by controlling the expansion rate of different regions of 2D nanofiber mats by blending various amounts of pluronic F-127. The dual gradients in pore sizes and fiber organizations from random, to partially aligned, and to aligned were formed by expanding 2D mats consisting of nanofiber layers sequentially deposited onto the mandrel with gradually increasing rotating speeds. In addition, the compositional gradients on 3D nanofiber assemblies were prepared based on the diffusion and encapsulation. We also demonstrated dense regions of expanded scaffolds with graded pore sizes can greatly enhance the expression of hypoxia-related markers and chondrogenic differentiation of BMSCs, and bFGF gradients on 3D radially aligned nanofiber scaffolds can significantly accelerate the migration of human dermal fibroblasts. The 3D nanofiber assemblies with gradations in structure and composition show great promise in regulating cell responses with potential applications in wound healing, tissue repair and regeneration, and tissue modeling.
Supplementary Material
Acknowledgments
This work was partially supported by startup funds from the University of Nebraska Medical Center (UNMC), National Institute of General Medical Science (NIGMS) and National Institute of Dental and Craniofacial Research (NIDCR) of the National Institutes of Health under Award Numbers R01GM123081 and 1R21DE027516, Congressionally Directed Medical Research Program (CDMRP)/Peer Reviewed Medical Research Program (PRMRP) FY19 W81XWH2010207, UNMC Regenerative Medicine Program pilot grant, Nebraska Research Initiative grant, and NE LB606.
Footnotes
Supporting Information
Experimental details are included in the Supporting Information.
References
- [1].Wu X, Jiang P, Chen L, Yuan F, Zhu YT, Proc. Natl. Acad. Sci. U. S. A 2014, 111, 7197. [DOI] [PMC free article] [PubMed] [Google Scholar]
- [2].Uzel SGM, Amadi OC, Pearl TM, Lee RT, So PTC, Kamm RD, Small 2016, 12, 612. [DOI] [PMC free article] [PubMed] [Google Scholar]
- [3].Rossetti L, Kuntz LA, Kunold E, Schock J, Müller KW, Grabmayr H, Stolberg-Stolberg J, Pfeiffer F, Sieber SA, Burgkart R, Nat. Mater 2017, 16, 664. [DOI] [PubMed] [Google Scholar]
- [4].Sophia Fox AJ, Bedi A, Rodeo SA, Sports Health 2009, 1, 461. [DOI] [PMC free article] [PubMed] [Google Scholar]
- [5].Briscoe J, Small S, Development 2015, 142, 3996. [DOI] [PMC free article] [PubMed] [Google Scholar]
- [6].Cox TR, Erler JT, Dis. Model. Mech 2011, 4, 165. [DOI] [PMC free article] [PubMed] [Google Scholar]
- [7].Iismaa SE, Kaidonis X, Nicks AM, Bogush N, Kikuchi K, Naqvi N, Harvey RP, Husain A, Graham RM, NPJ Regen. Med 2018, 3, 1. [DOI] [PMC free article] [PubMed] [Google Scholar]
- [8].Ashe HL, Briscoe J, Development 2006, 133, 385. [DOI] [PubMed] [Google Scholar]
- [9].Li P, Markson JS, Wang S, Chen S, Vachharajani V, Elowitz MB, Science 2018, 360, 543. [DOI] [PMC free article] [PubMed] [Google Scholar]
- [10].Tang Y, Wu X, Lei W, Pang L, Wan C, Shi Z, Zhao L, Nagy TR, Peng X, Hu J, Nat. Med 2009, 15, 757. [DOI] [PMC free article] [PubMed] [Google Scholar]
- [11].Liu Z, Meyers MA, Zhang Z, Ritchie RO, Prog. Mater. Sci 2017, 88, 467. [Google Scholar]
- [12].Singh M, Berkland C, Detamore MS, Tissue Eng. Part B Rev 2008, 14, 341. [DOI] [PMC free article] [PubMed] [Google Scholar]
- [13].Sardelli L, Pacheco DP, Zorzetto L, Rinoldi C, Święszkowski W, Petrini P, J. Appl. Biomater. Func 2019, 17, 2280800019829023. [DOI] [PubMed] [Google Scholar]
- [14].Seidi A, Ramalingam M, Elloumi-Hannachi I, Ostrovidov S, Khademhosseini A, Acta Biomater. 2011, 7, 1441. [DOI] [PubMed] [Google Scholar]
- [15].Jeon O, Alt DS, Linderman SW, Alsberg E, Adv. Mater 2013, 25, 6366. [DOI] [PMC free article] [PubMed] [Google Scholar]
- [16].Lee W, Frank CW, Park J, Adv. Mater 2014, 26, 4936. [DOI] [PubMed] [Google Scholar]
- [17].Pedron S, Becka E, Harley BA, Adv. Mater 2015, 27, 1567. [DOI] [PubMed] [Google Scholar]
- [18].Zhu C, Qiu J, Pongkitwitoon S, Thomopoulos S, Xia Y, Adv. Mater 2018, 30, 1706706. [DOI] [PMC free article] [PubMed] [Google Scholar]
- [19].Li C, Ouyang L, Pence IJ, Moore AC, Lin Y, Winter CW, Armstrong JPK, Stevens MM, Adv. Mater 2019, 31, 1900291. [DOI] [PMC free article] [PubMed] [Google Scholar]
- [20].Gao F, Xu Z, Liang Q, Liu B, Li H, Wu Y, Zhang Y, Lin Z, Wu M, Ruan C, Adv. Funct. Mater 2018, 28, 1706644. [Google Scholar]
- [21].Kim JI, Hwang TI, Lee JC, Park CH, Kim CS, Adv. Funct. Mater 2019, 1907330. [Google Scholar]
- [22].Wang PY, Clements LR, Thissen H, Jane A, Tsai WB, Voelcker NH, Adv. Funct. Mater 2012, 22, 3414. [Google Scholar]
- [23].Park J, Kim D-H, Kim H-N, Wang CJ, Kwak MK, Hur E, Suh K-Y, An SS, Levchenko A, Nat. Mater 2016, 15, 792. [DOI] [PMC free article] [PubMed] [Google Scholar]
- [24].He J, Du Y, Villa‐Uribe JL, Hwang C, Li D, Khademhosseini A, Adv. Funct. Mater 2010, 20, 131. [DOI] [PMC free article] [PubMed] [Google Scholar]
- [25].Li X, Xie J, Lipner J, Yuan X, Thomopoulos S, Xia Y, Nano Lett. 2009, 9, 2763. [DOI] [PMC free article] [PubMed] [Google Scholar]
- [26].Jiang J, Carlson MA, Teusink MJ, Wang H, MacEwan MR, Xie J, ACS Biomater. Sci. Eng 2015, 1, 991. [DOI] [PubMed] [Google Scholar]
- [27].Jiang J, Li Z, Wang H, Wang Y, Carlson MA, Teusink MJ, MacEwan MR, Gu L, Xie J, Adv. Healthc. Mater 2016, 5, 2993. [DOI] [PMC free article] [PubMed] [Google Scholar]
- [28].Chen S, Carlson MA, Zhang YS, Hu Y, Xie J, Biomaterials 2018, 179, 46. [DOI] [PMC free article] [PubMed] [Google Scholar]
- [29].Jiang J, Chen S, Wang H, Carlson MA, Gombart AF, Xie J, Acta Biomater. 2018, 68, 237. [DOI] [PMC free article] [PubMed] [Google Scholar]
- [30].Chen S, Wang H, McCarthy A, Yan Z, Kim HJ, Carlson MA, Xia Y, Xie J, Nano Lett. 2019, 19, 2059. [DOI] [PubMed] [Google Scholar]
- [31].Chen S, John JV, McCarthy A, Carlson MA, Li X, Xie J, Appl. Phys. Rev 2020, 7, 021406. [DOI] [PMC free article] [PubMed] [Google Scholar]
- [32].Derda R, Laromaine A, Mammoto A, Tang SKY, Mammoto T, Ingber DE, Whitesides GM, Proc. Natl. Acad. Sci. U. S. A 2009, 106, 18457. [DOI] [PMC free article] [PubMed] [Google Scholar]
- [33].Rodenhizer D, Gaude E, Cojocari D, Mahadevan R, Frezza C, Wouters BG, McGuigan AP, Nat. Mater 2016, 15, 227. [DOI] [PMC free article] [PubMed] [Google Scholar]
- [34].Ma C, Chang B, Jing Y, Kim H, Liu X, Adv. Sci 2018, 5, 1801037. [DOI] [PMC free article] [PubMed] [Google Scholar]
- [35].Fahimipour F, Dashtimoghadam E, Hasani-Sadrabadi MM, Vargas J, Vashaee D, Lobner DC, Kashi TSJ, Ghasemzadeh B, Tayebi L, Dent. Mater 2019, 35, 990. [DOI] [PMC free article] [PubMed] [Google Scholar]
- [36].Semenza GL, Cell 2012, 148, 399. [DOI] [PMC free article] [PubMed] [Google Scholar]
- [37].Jordahl JH, Solorio L, Sun H, Ramcharan S, Teeple CB, Haley HR, Lee KJ, Eyster TW, Luker GD, Krebsbach PH, Adv. Mater 2018, 30, 1707196. [DOI] [PMC free article] [PubMed] [Google Scholar]
- [38].Zhang J, Feng Z, Wei J, Yu Y, Luo J, Zhou J, Li Y, Zheng X, Tang W, Liu L, Int. J. Biol. Sci 2018, 14, 449. [DOI] [PMC free article] [PubMed] [Google Scholar]
- [39].Dennis SC, Berkland CJ, Bonewald LF, Detamore MS, Tissue Eng. Part B Rev 2015, 21, 247. [DOI] [PMC free article] [PubMed] [Google Scholar]
- [40].Sheehy EJ, Kelly DJ, O’Brien FJ, Mater. Today Bio 2019, 100009. [DOI] [PMC free article] [PubMed] [Google Scholar]
- [41].Yun Y-R, Won JE, Jeon E, Lee S, Kang W, Jo H, Jang J-H, Shin US, Kim H-W, J. Tissue Eng 2010, 1, 218142. [DOI] [PMC free article] [PubMed] [Google Scholar]
- [42].Chen F-M, Zhang M, Wu Z-F, Biomaterials 2010, 31, 6279. [DOI] [PubMed] [Google Scholar]
Associated Data
This section collects any data citations, data availability statements, or supplementary materials included in this article.