

Key Points
Question
Does a combined intervention, including an online weight management program integrated with population health management (additional support and outreach from nonclinical staff), increase weight loss at 12 months among primary care patients compared with the online program only and usual care?
Findings
In this cluster randomized trial of 840 patients with overweight or obesity and a diagnosis of hypertension or type 2 diabetes, the mean weight loss at 12 months was 1.2 kg in the usual care group, 1.9 kg in the online program only group, and 3.1 kg in the combined online program with population health management group. The difference in weight loss between the combined intervention group and either the usual care group or the online program only group was statistically significant.
Meaning
Combining population health management with an online program resulted in a small but statistically significant greater amount of weight loss at 12 months compared with usual care or the online program only.
Abstract
Importance
Online programs may help with weight loss but have not been widely implemented in routine primary care.
Objective
To compare the effectiveness of a combined intervention, including an online weight management program plus population health management, with the online program only and with usual care.
Design, Setting, and Participants
Cluster randomized trial with enrollment from July 19, 2016, through August 10, 2017, at 15 primary care practices in the US. Eligible participants had a scheduled primary care visit and were aged 20 to 70 years, had a body mass index between 27 and less than 40, and had a diagnosis of hypertension or type 2 diabetes. Follow-up ended on May 8, 2019.
Interventions
Participants in the usual care group (n = 326) were mailed general information about weight management. Participants in the online program only group (n = 216) and the combined intervention group (n = 298) were registered for the online program. The participants in the combined intervention group also received weight-related population health management, which included additional support from nonclinical staff who monitored their progress in the online program and conducted periodic outreach.
Main Outcomes and Measures
The primary outcome was weight change at 12 months based on measured weights recorded in the electronic health record. Weight change at 18 months was a secondary outcome.
Results
Among the 840 participants who enrolled (mean age, 59.3 years [SD, 8.6 years]; 60% female; 76.8% White), 732 (87.1%) had a recorded weight at 12 months and the missing weights for the remaining participants were imputed. There was a significant difference in weight change at 12 months by group with a mean weight change of –1.2 kg (95% CI, –2.1 to –0.3 kg) in the usual care group, –1.9 kg (95% CI, –2.6 to –1.1 kg) in the online program only group, and –3.1 kg (95% CI, –3.7 to –2.5 kg) in the combined intervention group (P < .001). The difference in weight change between the combined intervention group and the usual care group was –1.9 kg (97.5% CI, –2.9 to –0.9 kg; P < .001) and the difference between the combined intervention group and the online program only group was –1.2 kg (95% CI, –2.2 to –0.3 kg; P = .01). At 18 months, the mean weight change was –1.9 kg (95% CI, –2.8 to –1.0 kg) in the usual care group, –1.1 kg (95% CI, –2.0 to –0.3 kg) in the online program only group, and –2.8 kg (95% CI, –3.5 to –2.0 kg) in the combined intervention group (P < .001).
Conclusions and Relevance
Among primary care patients with overweight or obesity and hypertension or type 2 diabetes, combining population health management with an online program resulted in a small but statistically significant greater weight loss at 12 months compared with usual care or the online program only. Further research is needed to understand the generalizability, scalability, and durability of these findings.
Trial Registration
ClinicalTrials.gov Identifier: NCT02656693
This cluster randomized trial compares the effects of an online weight management program with vs without a health manager monitoring progress vs usual care on 12-month weight change among adults with overweight or obesity and a diagnosis of hypertension or type 2 diabetes.
Introduction
For 2015-2016, it was estimated that more than 70% of US adults had overweight (body mass index [BMI; calculated as weight in kilograms divided by height in meters squared] between 25-29.9) or obesity (BMI ≥30).1 Overweight and obesity are associated with increased morbidity and mortality from various chronic conditions.2 Even small amounts of weight loss (eg, 3%-5% of body weight) can have important health benefits, and clinical guidelines recommend lifestyle interventions and counseling for all patients with obesity and for patients with overweight who have cardiovascular risk factors or obesity-related comorbidities.3 However, primary care physicians often do not counsel patients about weight due to limited time, training, and systems.4,5,6
Studies have shown that online programs involving web-based lifestyle interventions can help people achieve and maintain weight loss, but there is variability across studies.7,8,9 Some studies also show that online programs may be efficacious and cost-effective in primary care.10,11 However, online programs have not been widely implemented in primary care and it remains unclear whether they are effective and scalable in routine practice.
Population health management is a team-based approach in which nonclinical staff members identify and reach out (typically outside face-to-face visits) to specific groups of patients with unmet preventive and chronic condition care needs.12,13 Population health management has been increasing across primary care and is associated with improved outcomes,14,15 but to our knowledge, it has not previously been used for patients with overweight or obesity.
The purpose of this trial was to examine whether integrating an online weight management program with population health management support would enhance its effectiveness and lead to greater weight loss at 12 months among primary care patients compared with the online program only and with usual care.
Methods
Study Design and Setting
The methods have been described in detail elsewhere16 and the trial protocol and statistical analysis plan appear in Supplement 1. The study was conducted within the Brigham and Women’s Hospital Primary Care Center of Excellence, a group of 15 primary care practices with approximately 170 primary care physicians. The 15 primary care practices were divided into 24 clinics based on preexisting administrative divisions. The study was approved by the Partners human research committee and informed consent was obtained from participants electronically prior to enrollment.
Study Population
Eligible patients were aged 20 to 70 years and had a scheduled primary care visit, a BMI between 27 and less than 40, and a diagnosis of hypertension or type 2 diabetes. Eligible patients also had to speak English or Spanish, have internet access, and be motivated to lose weight. We excluded patients who had undergone or were planning to undergo bariatric surgery, had weight loss of 5% or greater of body weight within the past 6 months, were taking weight loss medications, or had contraindications for weight loss (all inclusion and exclusion criteria appear in Supplement 1). We used the electronic health record (EHR) to identify potentially eligible patients, who were sent a recruitment letter by mail or electronically if they had a patient portal account. Interested patients were screened and a research assistant reviewed the EHR prior to enrollment to confirm that the patient met all criteria.
Randomization
Prior to randomization, the 24 clinics were grouped into 3 strata: hospital-based clinics, community-based clinics, and community health centers (Figure 1). Randomization was stratified by clinic type to ensure balance across the 3 groups. Using a computer algorithm generated by the study biostatistician (E.J.O.), we randomized the 24 primary care clinics to usual care, the online program only, or the combined intervention.
Figure 1. Flow of Participants.
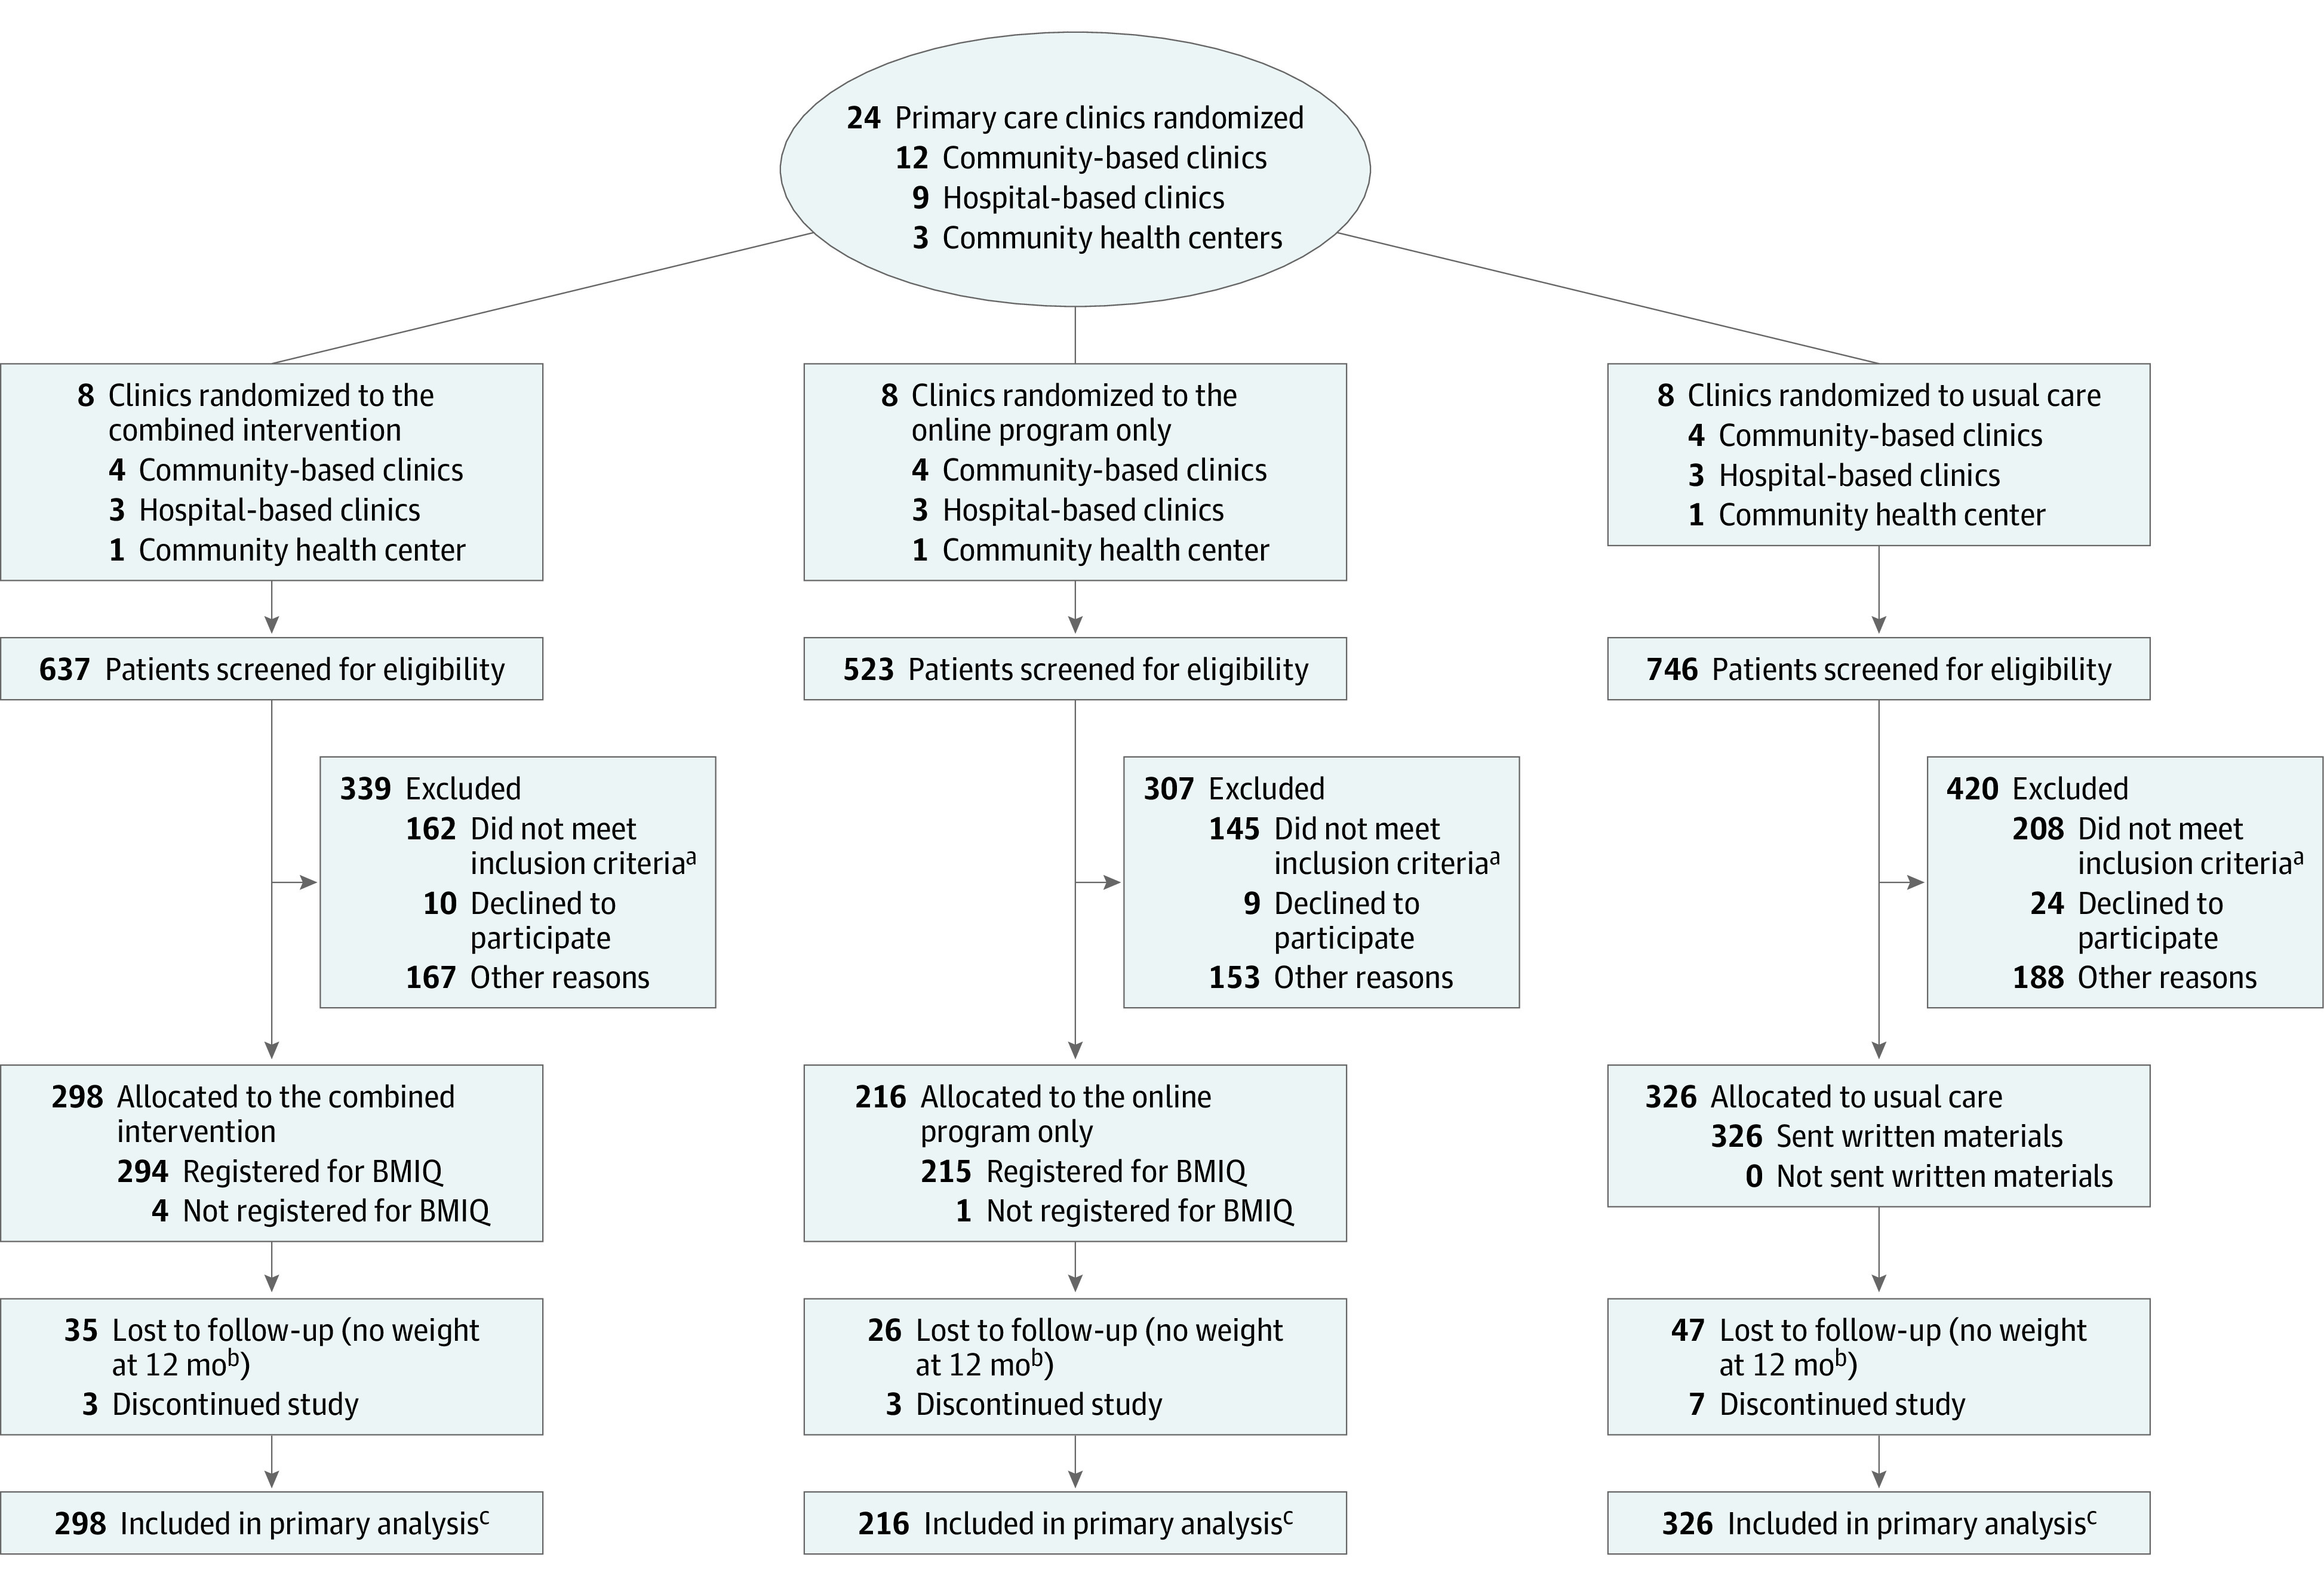
BMIQ (Intellihealth Inc) is the name of the online weight management program.
aThe most common reasons for exclusion were the body mass index was out of the inclusion range (n = 179), lost 5% or greater of body weight within last 6 months (n = 98), did not have hypertension or type 2 diabetes (n = 71), or had a severe mental health condition (n = 63).
bAt 18 months, weight was not recorded for 44 participants in the combined intervention group, 43 participants in the online program only group, and 66 participants in the usual care group.
cFully conditional specification multiple imputation with 25 imputations was used to estimate missing weights and other outcomes and covariates and was based on available data for 91 patient variables.
Interventions
After enrollment, patients were assigned to 1 of the 3 groups based on their primary care clinic. Patients in the usual care group were sent a 1-time mailing with information about weight management, including general recommendations about diet and physical activity. Patients in the online program only group were registered for the online program, were sent instructions about how to use the program, were provided a brief overview from a research assistant by phone, and were contacted by a research assistant approximately 7 days later to address questions.
Based on patient and stakeholder input,16,17 we selected and adapted an evidence-based online weight management program called BMIQ (Intellihealth Inc) (eTable 1 in Supplement 2). This program can be accessed via a computer, tablet, or smartphone and has patient and professional interfaces. The patient interface includes 33 nutrition and behavioral change educational sessions in written and video format (adapted from those used in the Practice-based Opportunities for Weight Reduction at the University of Pennsylvania [POWER-UP] trial18) that were released weekly for the first 16 weeks and then every other week. The patient interface also includes exchange-based meal plans and sample menus and tools for tracking weight, food intake, and activity. The professional interface includes patient monitoring and alerts, progress notes, and reporting features. Patients were assigned to a meal plan with a specific calorie goal based on their starting weight and were offered a brief phone consultation with a registered dietitian.
Patients in the combined intervention group received the same components as the online program only group plus additional support from a population health manager (a nonclinical staff member) who works with the primary care practices. We worked with the population health management team to incorporate additional weight-related support that supplemented the support the population health managers provide as standard care for all patients diagnosed with hypertension or type 2 diabetes. The role of the population health managers was to monitor patients’ progress in the online program and to conduct outreach according to a specific protocol.16 The population health managers did monthly check-in calls with patients and they uploaded a patient summary report from the online program to the EHR every other month. During the monthly calls, the population health managers reviewed patients’ progress, addressed questions, and encouraged patients to use the online program regularly. They also offered patients a second brief phone consultation with a registered dietitian approximately 6 months after enrollment. In some situations (eg, if a patient lost ≥7.5% of their body weight), the population health managers would enter a note in the EHR and send direct messages to patients and primary care physicians in case this affected decisions related to care. In addition, the population health managers would reach out to patients who were not logging into the online program regularly (at least every 2 weeks) and encourage them to log in, view the educational sessions, and track their weight.
Data Collection and Follow-up
The intervention period was 12 months. Patients in all 3 groups received routine care as directed by their primary care physicians and there were no required study visits. If a patient did not have a measured and recorded weight in the EHR at 12 months (±90 days) after enrollment, a research assistant tried to contact the patient to schedule a brief study visit to measure weight. Data on demographic and clinical factors, including measured weight and BMI, were extracted from the EHR at enrollment and at approximately 6, 12, and 18 months after enrollment. Patients in all 3 groups also completed surveys at baseline and at 6, 12, and 18 months after enrollment to assess patient-reported outcomes and satisfaction. Some demographic factors (eg, race/ethnicity using fixed categories) also were assessed on the baseline survey because they could affect weight change, engagement with the interventions, or both. Use of the online program and the number of phone and email contacts with population health managers or other study staff were tracked within the online program.
Outcomes
The primary outcome was weight change at 12 months (±90 days) after enrollment, which was calculated as the difference (in kilograms) between each patient’s measured weight at the initial visit and at the visit approximately 12 months later. Secondary outcomes included weight change at 6 months (±60 days) and at 18 months (±90 days) after enrollment; percentage weight change; weight loss of 5% or greater; changes in measured systolic and diastolic blood pressure level, total cholesterol level, low-density lipoprotein and high-density lipoprotein cholesterol levels, triglycerides level, and hemoglobin A1c level; and changes in self-reported weight-related quality of life,19 diet,20 physical activity,21 health status,22 and confidence in ability to lose weight.23 We also examined use of and satisfaction with the interventions.
Power
Although the primary analysis was designed to compare weight change at 12 months across the 3 groups, we calculated the sample size to have 80% power for subsequent pairwise comparisons. Based on previous studies,24,25 we assumed a mean 12-month weight loss of 0.5 kg in the usual care group, 1.5 kg in the online program only group, and 3.0 kg in the combined intervention group and an SD of 5 kg. Accounting for the within-clinic correlation and assuming 20% attrition, we decided to enroll 840 patients (280 per group), which provided more than 99% power for the primary analysis.
Statistical Analysis
Participants were analyzed according to randomization group and all participants were included. We used repeated-measures mixed-effects linear regression using weights at baseline and at 12 months (because the primary outcome was weight change at 12 months) first and then using weights at baseline and at 6, 12, and 18 months. We included indicators for group and time along with interaction terms to demonstrate the intervention effect. We adjusted for the prespecified covariates (including age, sex, race/ethnicity, educational level, and medical conditions) that could affect weight change. We included clinic type as a fixed effect and clinic, physician, and patient as random effects. The same general modeling approach was used to compare changes in continuous secondary outcomes across the 3 groups. For binary outcomes (eg, weight loss ≥5%, excellent or very good health status), we used mixed-effects logistic regression. We used fully conditional specification multiple imputation to estimate missing weights as well as other missing outcomes and covariates.
To determine whether there was a significant difference in weight change at 12 months by group, we used a global F test with 2 degrees of freedom to examine the statistical significance of the study group × 12-month time point interaction term with an α level of .05. If significant, we proceeded to conduct 2 planned pairwise comparisons to compare weight change in the combined intervention group vs the usual care group and the combined intervention group vs the online program only group.
We used the Holm procedure to account for multiple comparisons with a 2-sided significance level of .025 for the first comparison and level of .05 for the second comparison. Because of the potential for type I error due to multiple comparisons, the findings for the analyses of the secondary end points should be interpreted as exploratory. All analyses were conducted using SAS version 9.4 (SAS Institute Inc).
Results
Study Participants
A total of 26 393 potentially eligible patients were sent information about the study, 1906 were screened, and 840 were enrolled from July 19, 2016, through August 10, 2017. Follow-up ended on May 8, 2019. There were 326 patients in the usual care group, 216 in the online program only group, and 298 in the combined intervention group (Figure 1). At baseline, the mean age of the participants was 59.3 years (SD, 8.6 years), the mean weight was 92.1 kg (101.9 kg for males and 85.6 kg for females), the mean BMI was 32.5 (including both males and females), 60% of participants were female, and 76.8% were White (Table 1). Although most characteristics had similar distributions across the 3 groups, there were a few differences (eg, sex, educational level) due to the randomization by clinic.
Table 1. Baseline Characteristics of Participants.
| Combined intervention | Online program only | Usual care | |
|---|---|---|---|
| No. of total participantsa | 298 | 216 | 326 |
| Demographic data | |||
| Age, mean (SD), y | 60.1 (8.3) | 59.1 (8.8) | 58.7 (8.6) |
| Sex, No. (%) | |||
| Male | 139 (46.6) | 88 (40.7) | 109 (33.4) |
| Female | 159 (53.4) | 128 (59.3) | 217 (66.6) |
| Race/ethnicity, No./total (%) | |||
| Non-Hispanic White | 227/295 (77.0) | 169/215 (78.6) | 249/326 (76.4) |
| Non-Hispanic Black | 31/295 (10.5) | 23/215 (10.7) | 39/326 (12.0) |
| Hispanic | 20/295 (6.8) | 12/215 (5.6) | 24/326 (7.4) |
| Otherb | 17/295 (5.8) | 11/215 (5.1) | 14/326 (4.3) |
| Primary language, No. (%) | |||
| English | 288 (96.6) | 212 (98.2) | 315 (96.6) |
| Spanish | 10 (3.4) | 4 (1.9) | 11 (3.4) |
| Highest level of education, No./total (%) | |||
| High school graduate or less | 14/258 (5.4) | 16/192 (8.3) | 23/288 (8.0) |
| Some college | 50/258 (19.4) | 45/192 (23.4) | 91/288 (31.6) |
| College graduate | 83/258 (32.2) | 66/192 (34.4) | 102/288 (35.4) |
| Master’s, doctorate, or professional degree | 111/258 (43.0) | 65/192 (33.9) | 72/288 (25.0) |
| Employment status, No./total (%) | |||
| Employed (full-time or part-time) | 169/288 (58.7) | 139/213 (65.3) | 206/314 (65.6) |
| Retired | 65/288 (22.6) | 33/213 (15.5) | 63/314 (20.0) |
| Other | 54/288 (18.8) | 41/213 (19.3) | 45/314 (14.3) |
| Health insurance, No. (%) | |||
| Private | 207 (69.5) | 141 (65.3) | 217 (66.6) |
| Medicare | 68 (22.8) | 50 (23.2) | 72 (22.1) |
| Medicaid or VHA | 23 (7.7) | 25 (11.6) | 37 (11.4) |
| Anthropometric data, mean (SD) | |||
| Weight, kg | 92.9 (13.8) | 91.6 (14.4) | 91.8 (14.4) |
| Height, cm | 169.2 (9.9) | 168.7 (9.9) | 167.4 (9.4) |
| Body mass indexc | 32.4 (3.4) | 32.2 (3.2) | 32.7 (3.3) |
| Health and behavior data, No. (%)d | |||
| Hypertension | 287 (96.3) | 211 (97.7) | 312 (95.7) |
| Type 2 diabetes | 83 (27.9) | 49 (22.7) | 73 (22.4) |
| Hypercholesterolemia | 56 (18.8) | 60 (27.8) | 67 (20.6) |
| Obstructive sleep apnea | 56 (18.8) | 36 (16.7) | 53 (16.3) |
| Coronary heart disease or atherosclerosis | 4 (1.3) | 1 (0.5) | 2 (0.6) |
| Non–alcoholic fatty liver disease | 3 (1.0) | 1 (0.5) | 1 (0.3) |
| Use of glucagon-like peptide-1 receptor agonists or sodium-glucose co-transporter-2 inhibitors | 5 (1.7) | 1 (0.5) | 1 (0.3) |
| Any previous weight loss attempts, No./total (%) | 236/266 (88.7) | 182/188 (96.8) | 269/291 (92.4) |
| Motivation to lose weight, mean (SD), pointse | 8.9 (1.1) | 8.9 (1.1) | 8.8 (1.1) |
| Internet use, No./total (%) | |||
| ≤Once per week | 4/260 (1.5) | 2/191 (1.0) | 6/287 (2.1) |
| Several times per week | 8/260 (3.0) | 13/191 (6.8) | 14/287 (4.9) |
| Once per day | 14/260 (5.4) | 9/191 (4.7) | 23/287 (8.0) |
| ≥Several times per day | 234/260 (90.0) | 167/191 (87.4) | 244/287 (85.0) |
Abbreviation: VHA, Veterans Health Administration.
Data are expressed as No./total (%) for the rows with missing data.
Includes American Indian/Alaska Native, Hawaiian/Pacific Islander, those who selected multiple categories, and those who selected other for race on the baseline survey but did not provide their race.
Calculated as weight in kilograms divided by height in meters squared.
Unless otherwise indicated.
Assessed on a scale from 1 to 10 where 1 indicates not at all motivated and 10 indicates completely or extremely motivated. Only patients who reported their level of motivation as 7 or higher were included.26
Changes in Weight and Other Outcomes
Primary Outcome
There were 732 participants (87.1%) with a recorded weight at 12 months (±90 days) and the weights for the remaining participants were imputed. There was a significant difference in weight change at 12 months by group with a mean weight change of –1.2 kg (95% CI, –2.1 to –0.3 kg) in the usual care group, –1.9 kg (95% CI, –2.6 to –1.1 kg) in the online program only group, and –3.1 kg (95% CI, –3.7 to –2.5 kg) in the combined intervention group (P < .001; Table 2). The difference in weight change between the combined intervention group and the usual care group was –1.9 kg (97.5% CI, –2.9 to –0.9 kg; P < .001) and the difference between the combined intervention group and the online program only group was –1.2 kg (95% CI, –2.2 to –0.3 kg; P = .01). There were no significant differences in these effects by sex or educational level (eTable 2 in Supplement 2).
Table 2. Mean Changes in Weight-Related Outcomes.
| Combined intervention | Online program only | Usual care | P value | |
|---|---|---|---|---|
| No. of total participants | 298 | 216 | 326 | |
| Primary analysis: changes from baseline to 12 moa | ||||
| Weight, kg | ||||
| At baseline | 92.1 | 91.4 | 92.3 | |
| Change at 12 mo (95% CI) | –3.1 (–3.7 to –2.5) | –1.9 (–2.6 to –1.1) | –1.2 (–2.1 to –0.3) | <.001b |
| Weight change at 12 mo, % (95% CI) | –3.0 (–3.8 to –2.1) | –1.9 (–2.8 to –1.0) | –1.4 (–2.3 to –0.6) | <.001b |
| Participants had ≥5% weight loss at 12 mo, % (95% CI) | 32.3 (25.8 to 38.8) | 20.8 (14.5 to 27.2) | 14.9 (10.2 to 19.6) | <.001b |
| Confidence in ability to lose weight, pointsc | ||||
| At baseline | 6.5 | 6.8 | 6.8 | |
| Change at 12 mo (95% CI) | 0.5 (0.06 to 0.9) | –0.4 (–0.9 to 0.07) | –0.7 (–1.1 to–0.3) | <.001b |
| Secondary analysis: changes over entire 18-mo follow-up periodd | ||||
| Weight, kg | ||||
| At baseline | 92.1 | 91.4 | 92.3 | <.001e |
| Change at 6 mo (95% CI) | –2.9 (–3.5 to –2.3) | –2.1 (–2.8 to –1.5) | –1.0 (–1.9 to –0.1) | |
| Change at 12 mo (95% CI) | –3.1 (–3.7 to –2.5) | –1.9 (–2.6 to –1.1) | –1.2 (–2.1 to –0.3) | |
| Change at 18 mo (95% CI) | –2.8 (–3.5 to –2.0) | –1.1 (–2.0 to –0.3) | –1.9 (–2.8 to –1.0) | |
| Weight change, % (95% CI) | ||||
| At 6 mo | –2.8 (–3.8 to –1.8) | –2.0 (–3.1 to –0.9) | –1.0 (–1.9 to 0.03) | .01e |
| At 12 mo | –2.9 (–3.9 to –2.0) | –1.7 (–2.8 to –0.6) | –1.2 (–2.1 to –0.2) | |
| At 18 mo | –2.6 (–3.6 to –1.5) | –0.9 (–2.0 to 0.2) | –1.9 (–2.9 to –0.9) | |
| Participants lost ≥5% of body weight, % (95% CI) | ||||
| At 6 mo | 29.5 (21.4 to 37.5) | 22.1 (14.2 to 30.0) | 13.4 (7.8 to 19.0) | .20e |
| At 12 mo | 31.5 (23.4 to 39.5) | 20.4 (13.0 to 27.9) | 12.7 (7.7 to 17.7) | |
| At 18 mo | 31.3 (23.0 to 39.6) | 19.9 (12.5 to 27.3) | 20.9 (14.3 to 27.6) | |
| Aggregate estimate across all 3 time points | 30.7 (22.4 to 39.0) | 20.8 (13.0 to 28.6) | 15.7 (6.2 to 25.1) | <.001e |
Used repeated-measures models including baseline and 12-month time points adjusting for age, sex, race/ethnicity, educational level, and medical conditions (type 2 diabetes, hypertension, and hyperlipidemia). Clinic type (community-based clinic, hospital-based, or community health center) was included as a fixed effect. Clinic, physician, and patient were included as random effects. Fully conditional specification multiple imputation with 25 imputations was used to estimate missing weights and other outcomes and covariates and was based on available data for 91 patient variables.
From global F tests examining the statistical significance of the study group × 12-month time point interaction term.
Assessed on the baseline and follow-up patient surveys using a 10-point Likert scale where 1 indicates “not at all confident” and 10 indicates “very confident.”23
Used repeated-measures models including all time points adjusting for age, sex, race/ethnicity, educational level, and medical conditions (type 2 diabetes, hypertension, and hyperlipidemia). Clinic type (community-based clinic, hospital-based, or community health center) was included as a fixed effect. Clinic, physician, and patient were included as random effects. Fully conditional specification multiple imputation with 25 imputations was used to estimate missing weights and other outcomes and covariates and was based on available data for 91 patient variables. Models also included time × study group interaction terms and no assumption was made that the treatment effects were consistent across time.
From the time × study group interactions. Significant P values indicate that the effects of the interventions diverge from each other over time. For the percentage of patients who lost at least 5% of their body weight, the model showed no significant time × study group interaction (ie, the differences among groups were consistent over time). Another model was run without the interaction terms and the aggregate effect across time reflects the overall differences among the study groups.
Secondary Outcomes
There was a significant difference in the percentage weight change at 12 months by group with mean weight change of –1.4% (95% CI, –2.3% to –0.6%) in the usual care group, –1.9% (95% CI, –2.8% to –1.0%) in the online program only group, and –3.0% (95% CI, –3.8% to –2.1%) in the combined intervention group (P < .001; Table 2). There was a significant difference in the percentage of participants with weight loss of 5% or greater by group; 14.9% (95% CI, 10.2% to 19.6%) of participants in the usual care group, 20.8% (95% CI, 14.5% to 27.2%) of participants in the online program only group, and 32.3% (95% CI, 25.8% to 38.8%) of participants in the combined intervention group lost at least 5% of their body weight (P < .001; Table 2). In addition, there was a significant difference in change in confidence in the ability to lose weight by group with the mean change of –0.7 points (95% CI, –1.1 to –0.3 points) in the usual care group and –0.4 points (95% CI, –0.9 to 0.07 points) in the online program only group; however, the mean change was 0.5 points (95% CI, 0.06 to 0.9 points) in the combined intervention group (P < .001; Table 2). There were no significant differences in other secondary outcomes at 12 months by group (eTable 3 in Supplement 2).
There were significant differences by group in weight change over 18 months (Table 2 and Figure 2). At 18 months, the mean weight change was –1.9 kg (95% CI, –2.8 to –1.0 kg) in the usual care group, –1.1 kg (95% CI, –2.0 to –0.3 kg) in the online program only group, and –2.8 kg (95% CI, –3.5 to –2.0 kg) in the combined intervention group (P < .001). The difference in weight change between the combined intervention group and the usual care group was –0.9 kg (95% CI, –1.9 to 0.2 kg; P = .10) and the difference between the combined intervention group and the online program only group was –1.6 kg (95% CI, –2.7 to –0.5 kg; P = .003). Across the entire 18-month period, the percentage of patients with weight loss of 5% or greater was 15.7% (95% CI, 6.2% to 25.1%) in the usual care group, 20.8% (95% CI, 13.0% to 28.6%) in the online program only group, and 30.7% (95% CI, 22.4% to 39.0%) in the combined intervention group (P < .001).
Figure 2. Mean Weight Change at 6, 12, and 18 Months.

The boxplots were created using the raw data from the first round of multiple imputation. The boxes are staggered horizontally around each time point to avoid superimposition. The boxes indicate the 25th and 75th percentiles of the data, and the horizontal lines within the boxes indicate the median values. The whiskers indicate the highest and lowest values within 1.5 times the interquartile range and the dots outside the whiskers are outliers. The lines show the mean weight change at each time point (indicated by the dots within the boxes) from repeated-measures linear regression models adjusted for age, sex, race/ethnicity, educational level, and medical conditions (type 2 diabetes, hypertension, and hyperlipidemia). Clinic type (community-based clinic, hospital-based, or community health center) was included as a fixed effect. Clinic, physician, and patient were included as random effects. All 840 patients were included in the models. Fully conditional specification multiple imputation with 25 imputations was used to estimate missing weights and other outcomes and covariates and was based on available data for 91 patient variables. The estimates and 95% CIs for the mean weight change from the models appear in Table 2.
Use of Programs and Satisfaction With the Interventions
The use of the online program was not significantly different in the online program only group and the combined intervention group (Table 3). The median number of log-ins over 12 months among participants in the online program only group was 25 and in the combined intervention group was 26 and the median number of sessions viewed was 5 in both groups. During the 12 months, the number of contacts with a research assistant or population health manager was much higher among participants in the combined intervention group than in the online program only group (median of 9 vs 3 contacts, respectively). The percentage of participants who had at least 1 consultation with a dietitian was 37.3% in the combined intervention group vs 28.7% in the online program only group. Participants in the combined intervention group also had higher levels of satisfaction with the online program than participants in the online program only group (29.9% vs 18.1%, respectively, were very satisfied; Table 4).
Table 3. Use of the Online Program and Other Aspects of the Interventions Over 12 Months.
| Combined intervention (n = 298) | Online program only (n = 216) | |||||
|---|---|---|---|---|---|---|
| 0-6 mo | 7-12 mo | 0-12 mo | 0-6 mo | 7-12 mo | 0-12 mo | |
| No. of log-ins per participant, median (IQR) | 22 (4-57) | 1 (0-16) | 26 (5-73) | 23.5 (5-57) | 0.5 (0-16.5) | 25 (5-77) |
| No. of educational sessions viewed per participant, median (IQR)a | 5 (1-12) | 0 (0-2) | 5 (1-16) | 5 (1-14) | 0 (0-1) | 5 (1-16.5) |
| No. of days with weight tracking data per participant, median (IQR) | 16 (10-34) | 8 (0-16) | 21.5 (11-49) | 17.5 (10-33) | 9 (0-13.5) | 22 (11-44) |
| No. of days with food or activity tracking data per participant, median (IQR) | 12 (4-49) | 0 (0-2) | 13 (4-53) | 13 (4-50) | 0 (0-2) | 13 (4-52) |
| No. of contacts per participant with research assistant or population health manager, median (IQR) | 6 (4-8) | 4 (2-6) | 9 (6-13) | 3 (2-3) | 0 (0-1) | 3 (2-4) |
| Had ≥3 educational sessions viewed, No. (%) | 182 (61.1) | 72 (24.2) | 185 (62.1) | 136 (63.0) | 45 (20.8) | 138 (63.9) |
| Consultations with a dietitian, No. (%) | ||||||
| Had ≥1 | 99 (33.2) | 24 (8.1) | 111 (37.3) | 61 (28.2) | 2 (0.9) | 62 (28.7) |
| Had ≥2 | 12 (4.0) | 1 (0.3) | 22 (7.4) | 1 (0.5) | 0 (0) | 2 (0.9) |
Abbreviation: IQR, interquartile range.
The mean number per participant was 7.1 for the combined intervention group and 7.7 for the online program only group at 0-6 months; 2.6 and 2.1, respectively, at 7-12 months; and 9.7 and 9.8 at 0-12 months.
Table 4. Participant Satisfaction With Online Program and Population Health Management Support.
| Combined intervention (n = 298) | Online program only (n = 216) | |||
|---|---|---|---|---|
| 6 mo | 12 mo | 6 mo | 12 mo | |
| No. patients completing survey | 196 | 176 | 125 | 127 |
| Satisfaction with online program, No. (%) | ||||
| Very satisfied | 54 (27.6) | 51 (29.9) | 25 (20.0) | 23 (18.1) |
| Satisfied | 60 (30.6) | 48 (27.3) | 42 (33.6) | 38 (29.9) |
| Neutral | 44 (22.5) | 53 (30.1) | 33 (26.4) | 42 (33.1) |
| Would recommend online program to family or friends, No. (%) | ||||
| Definitely | 91 (46.4) | 82 (46.6) | 53 (52.4) | 49 (38.6) |
| Probably | 66 (33.7) | 57 (32.4) | 42 (33.6) | 43 (33.9) |
| Satisfaction with support or outreach related to online program, No. (%) | ||||
| Very satisfied | 37 (18.9) | 37 (21.0) | ||
| Satisfied | 49 (25.0) | 42 (23.9) | ||
| Neutral | 77 (39.3) | 69 (39.2) | ||
Discussion
In this cluster randomized trial among primary care patients with overweight or obesity and a diagnosis of hypertension or type 2 diabetes, there were significant differences in weight change and other weight-related outcomes by group. Participants in the combined intervention group had the greatest weight loss at 12 months, followed by participants in the online program only group and then by participants in the usual care group. There also were significant differences in weight change at 18 months; however, the difference between the combined intervention group and the usual care group was no longer significant due to weight loss in the usual care group between 12 and 18 months. A possible explanation could be that patients in the usual care group may have engaged in other interventions or programs outside the study but this is difficult to evaluate. In addition, the initial weight loss in the online program only group was not sustained over time.
These findings are consistent with previous studies showing that online weight management programs can be effective for helping people achieve and maintain weight loss,8 including in the primary care setting.10,27 To our knowledge, this is the first study to demonstrate that an online program can be integrated with existing population health management support delivered by nonclinical staff without any specialized training in nutrition or weight counseling and be implemented in routine primary care.
The low use rates for the online program in this study are consistent with previous studies.8,28 For example, in a randomized trial of an online weight management program alone or combined with brief telephone coaching, the median number of sessions completed by participants was 1 in both intervention groups.29 In the current study, use of the online program was not significantly different between the online program only group and the combined intervention group; however, the number of contacts was higher in the combined intervention group and this suggests that additional contacts may explain the difference in weight change between these groups.
There were no significant differences in changes in cardiovascular outcomes, diet, or physical activity by group and this could be due to lack of power, missing data, or insufficient time for these outcomes. Furthermore, the diet and physical activity measures may not have been sensitive enough to detect small differences across groups. In addition, participants in all 3 groups received general information about weight management, diet, and exercise and all participants were eligible for population health management for hypertension, type 2 diabetes, or both as part of standard care.
These results may have broader implications for health care institutions, primary care physicians, and other clinicians. Although the absolute magnitude of weight loss was small, the interventions were integrated with existing care and delivered by nonclinical staff; therefore, they could have a large effect if they are scalable. Even though the overall weight loss was modest, the mean weight loss among patients in the combined intervention group at 12 months was 3.0%, and approximately one-third of patients had weight loss of 5% or greater, suggesting that the intervention could have an important clinical effect.3
This study has many strengths. The interventions were integrated in routine care and leveraged systems-level changes that are now common in primary care. Online weight management programs are generally lower cost and more accessible for patients than face-to-face programs.30 There was adequate power based on the sample size to detect small but clinically meaningful differences in weight change. Most of the data were collected during routine visits, which reduced patient burden and increased generalizability. Patient-reported outcome measures also were used in addition to clinical outcomes.
Limitations
This study has several limitations. First, randomization was done by clinic to decrease the potential for contamination; however, some clinics enrolled patients much faster than other clinics. As a result, the final sample was not equal across the 3 groups and there were some imbalances in characteristics across the groups.
Second, due to the pragmatic nature of the trial, there was heterogeneity in the population health management component of the intervention, as well as limited data on fidelity to the outreach protocol, making it difficult to determine which components of the intervention worked best.
Third, primary care physicians were minimally involved, which may have affected clinical outcomes and patient satisfaction. In addition, the generalizability may be limited, given that the study was conducted at a single institution and the majority of participants were White, well educated, and English-speaking. Further studies are needed to determine whether the interventions are scalable at other institutions and in other populations.
Conclusions
Among primary care patients with overweight or obesity and hypertension or type 2 diabetes, combining population health management with an online program resulted in a small but statistically significant greater weight loss at 12 months compared with usual care or the online program only. Further research is needed to understand the generalizability, scalability, and durability of these findings.
Trial protocol and statistical analysis plan
eTable 1. Enhancements to online program, based on input from patients and other stakeholders
eTable 2. Mean weight change at 12 months according to study group, stratified by sex and educational level
eTable 3. Mean changes in secondary outcomes at 12 months, according to study group
Data sharing statement
References
- 1.National Center for Health Statistics Health, United States, 2018. National Center for Health Statistics; 2019. [PubMed] [Google Scholar]
- 2.National Task Force on the Prevention and Treatment of Obesity Overweight, obesity, and health risk. Arch Intern Med. 2000;160:898-904. doi: 10.1001/archinte.160.7.898 [DOI] [PubMed] [Google Scholar]
- 3.Jensen MD, Ryan DH, Apovian CM, et al. ; American College of Cardiology/American Heart Association Task Force on Practice Guidelines; Obesity Society . 2013 AHA/ACC/TOS guideline for the management of overweight and obesity in adults: a report of the American College of Cardiology/American Heart Association Task Force on Practice Guidelines and the Obesity Society. Circulation. 2014;129(25)(suppl 2):S102-S138. [DOI] [PMC free article] [PubMed] [Google Scholar]
- 4.Ma J, Xiao L, Stafford RS. Adult obesity and office-based quality of care in the United States. Obesity (Silver Spring). 2009;17(5):1077-1085. doi: 10.1038/oby.2008.653 [DOI] [PMC free article] [PubMed] [Google Scholar]
- 5.McAlpine DD, Wilson AR. Trends in obesity-related counseling in primary care: 1995-2004. Med Care. 2007;45(4):322-329. doi: 10.1097/01.mlr.0000254575.19543.01 [DOI] [PubMed] [Google Scholar]
- 6.Stafford RS, Farhat JH, Misra B, Schoenfeld DA. National patterns of physician activities related to obesity management. Arch Fam Med. 2000;9(7):631-638. doi: 10.1001/archfami.9.7.631 [DOI] [PubMed] [Google Scholar]
- 7.Beleigoli AM, Andrade AQ, Cançado AG, Paulo MN, Diniz MFH, Ribeiro AL. Web-based digital health interventions for weight loss and lifestyle habit changes in overweight and obese adults: systematic review and meta-analysis. J Med Internet Res. 2019;21(1):e298. doi: 10.2196/jmir.9609 [DOI] [PMC free article] [PubMed] [Google Scholar]
- 8.Neve M, Morgan PJ, Jones PR, Collins CE. Effectiveness of web-based interventions in achieving weight loss and weight loss maintenance in overweight and obese adults: a systematic review with meta-analysis. Obes Rev. 2010;11(4):306-321. [DOI] [PubMed] [Google Scholar]
- 9.Sorgente A, Pietrabissa G, Manzoni GM, et al. . Web-based interventions for weight loss or weight loss maintenance in overweight and obese people: a systematic review of systematic reviews. J Med Internet Res. 2017;19(6):e229. doi: 10.2196/jmir.6972 [DOI] [PMC free article] [PubMed] [Google Scholar]
- 10.Appel LJ, Clark JM, Yeh HC, et al. . Comparative effectiveness of weight-loss interventions in clinical practice. N Engl J Med. 2011;365(21):1959-1968. doi: 10.1056/NEJMoa1108660 [DOI] [PMC free article] [PubMed] [Google Scholar]
- 11.Smith KJ, Kuo S, Zgibor JC, et al. . Cost effectiveness of an internet-delivered lifestyle intervention in primary care patients with high cardiovascular risk. Prev Med. 2016;87:103-109. doi: 10.1016/j.ypmed.2016.02.036 [DOI] [PubMed] [Google Scholar]
- 12.Chen EH, Bodenheimer T. Improving population health through team-based panel management: comment on “Electronic medical record reminders and panel management to improve primary care of elderly patients”. Arch Intern Med. 2011;171(17):1558-1559. doi: 10.1001/archinternmed.2011.395 [DOI] [PubMed] [Google Scholar]
- 13.Neuwirth EE, Schmittdiel JA, Tallman K, Bellows J. Understanding panel management: a comparative study of an emerging approach to population care. Perm J. 2007;11(3):12-20. doi: 10.7812/TPP/07-040 [DOI] [PMC free article] [PubMed] [Google Scholar]
- 14.Chuang E, Ganti V, Alvi A, Yandrapu H, Dalal M. Implementing panel management for hypertension in a low-income, urban, primary care setting. J Prim Care Community Health. 2014;5(1):61-66. doi: 10.1177/2150131913516497 [DOI] [PubMed] [Google Scholar]
- 15.Kimura J, DaSilva K, Marshall R. Population management, systems-based practice, and planned chronic illness care: integrating disease management competencies into primary care to improve composite diabetes quality measures. Dis Manag. 2008;11(1):13-22. doi: 10.1089/dis.2008.111718 [DOI] [PubMed] [Google Scholar]
- 16.Baer HJ, De La Cruz BA, Rozenblum R, et al. . Integrating an online weight management program with population health management in primary care: design, methods, and baseline data from the PROPS randomized controlled trial (Partnerships for Reducing Overweight and Obesity with Patient-centered Strategies). Contemp Clin Trials. 2020;95:106026. doi: 10.1016/j.cct.2020.106026 [DOI] [PubMed] [Google Scholar]
- 17.Rozenblum R, De La Cruz BA, Nolido NV, et al. . Primary care patients’ and providers’ perspectives about an online weight management program: a qualitative study. J Gen Intern Med. 2019;34(8):1503-1521. doi: 10.1007/s11606-019-05022-6 [DOI] [PMC free article] [PubMed] [Google Scholar]
- 18.Wadden TA, Volger S, Tsai AG, et al. ; POWER-UP Research Group . Managing obesity in primary care practice: an overview with perspective from the POWER-UP study. Int J Obes (Lond). 2013;37(suppl 1):S3-S11. doi: 10.1038/ijo.2013.90 [DOI] [PMC free article] [PubMed] [Google Scholar]
- 19.Kolotkin RL, Crosby RD. Psychometric evaluation of the impact of weight on quality of life-lite questionnaire (IWQOL-lite) in a community sample. Qual Life Res. 2002;11(2):157-171. doi: 10.1023/A:1015081805439 [DOI] [PubMed] [Google Scholar]
- 20.Rifas-Shiman SL, Willett WC, Lobb R, Kotch J, Dart C, Gillman MW. PrimeScreen, a brief dietary screening tool: reproducibility and comparability with both a longer food frequency questionnaire and biomarkers. Public Health Nutr. 2001;4(2):249-254. doi: 10.1079/PHN200061 [DOI] [PubMed] [Google Scholar]
- 21.Paffenbarger RS Jr, Blair SN, Lee IM, Hyde RT. Measurement of physical activity to assess health effects in free-living populations. Med Sci Sports Exerc. 1993;25(1):60-70. doi: 10.1249/00005768-199301000-00010 [DOI] [PubMed] [Google Scholar]
- 22.Ware JE Jr, Gandek B, Kosinski M, et al. . The equivalence of SF-36 summary health scores estimated using standard and country-specific algorithms in 10 countries: results from the IQOLA Project. J Clin Epidemiol. 1998;51(11):1167-1170. doi: 10.1016/S0895-4356(98)00108-5 [DOI] [PubMed] [Google Scholar]
- 23.Bandura A. Self-efficacy: toward a unifying theory of behavioral change. Psychol Rev. 1977;84(2):191-215. doi: 10.1037/0033-295X.84.2.191 [DOI] [PubMed] [Google Scholar]
- 24.Levine DM, Savarimuthu S, Squires A, Nicholson J, Jay M. Technology-assisted weight loss interventions in primary care: a systematic review. J Gen Intern Med. 2015;30(1):107-117. [DOI] [PMC free article] [PubMed] [Google Scholar]
- 25.McTigue KM, Conroy MB. Use of the internet in the treatment of obesity and prevention of type 2 diabetes in primary care. Proc Nutr Soc. 2013;72(1):98-108. doi: 10.1017/S0029665112002777 [DOI] [PubMed] [Google Scholar]
- 26.Befort CA, Greiner KA, Hall S, et al. . Weight-related perceptions among patients and physicians: how well do physicians judge patients’ motivation to lose weight? J Gen Intern Med. 2006;21(10):1086-1090. doi: 10.1111/j.1525-1497.2006.00567.x [DOI] [PMC free article] [PubMed] [Google Scholar]
- 27.Little P, Stuart B, Hobbs FR, et al. . An internet-based intervention with brief nurse support to manage obesity in primary care (POWeR+): a pragmatic, parallel-group, randomised controlled trial. Lancet Diabetes Endocrinol. 2016;4(10):821-828. doi: 10.1016/S2213-8587(16)30099-7 [DOI] [PubMed] [Google Scholar]
- 28.Neve MJ, Collins CE, Morgan PJ. Dropout, nonusage attrition, and pretreatment predictors of nonusage attrition in a commercial web-based weight loss program. J Med Internet Res. 2010;12(4):e69. doi: 10.2196/jmir.1640 [DOI] [PMC free article] [PubMed] [Google Scholar]
- 29.Dennison L, Morrison L, Lloyd S, et al. . Does brief telephone support improve engagement with a web-based weight management intervention? randomized controlled trial. J Med Internet Res. 2014;16(3):e95. doi: 10.2196/jmir.3199 [DOI] [PMC free article] [PubMed] [Google Scholar]
- 30.Gudzune KA, Doshi RS, Mehta AK, et al. . Efficacy of commercial weight-loss programs: an updated systematic review. Ann Intern Med. 2015;162(7):501-512. doi: 10.7326/M14-2238 [DOI] [PMC free article] [PubMed] [Google Scholar]
Associated Data
This section collects any data citations, data availability statements, or supplementary materials included in this article.
Supplementary Materials
Trial protocol and statistical analysis plan
eTable 1. Enhancements to online program, based on input from patients and other stakeholders
eTable 2. Mean weight change at 12 months according to study group, stratified by sex and educational level
eTable 3. Mean changes in secondary outcomes at 12 months, according to study group
Data sharing statement