Abstract
Mutant KRAS modulates the metabolic plasticity of cancer cells conferring growth advantage during hypoxia, but the molecular underpinnings are largely unknown. Using a lipidomic screen, we found that PLCγ1 is suppressed during hypoxia in KRAS-mutant human lung adenocarcinoma cancer cell lines. Suppression of PLCγ1 in hypoxia promotes a less oxidative cancer cell metabolism, reduces the formation of mitochondrial reactive oxygen species and switches tumor bioenergetics towards glycolysis by impairing Ca2+ entry into the mitochondria. This event prevents lipid peroxidation, antagonizes apoptosis and increases cancer cell proliferation. Accordingly, loss-of-function of Plcγ1 in a mouse model of KrasG12D-driven lung adenocarcinoma increased the expression of glycolytic genes, boosted tumor growth and reduced survival. In patients with mutant KRAS lung adenocarcinomas, low PLCγ1 expression correlates with increased expression of hypoxia markers and predicts poor patient survival. Thus, our work reveals a mechanism of cancer cell adaptation to hypoxia with potential therapeutic value.
Introduction
Hypoxia is a common feature of solid tumors1, 2 and it is associated with cancer aggressiveness, treatment-resistance and poor prognosis3. Thus, understanding the mechanisms underlying the adaptation of cancer cells to hypoxia may pave the way to uncover new cancer requirements to target for better therapeutic approaches.
Hypoxia can lead to profound rearrangements in cancer lipid metabolism, including inhibition of fatty acid oxidation (FAO), accumulation of triglycerides in lipid droplets (LDs) and alteration of cellular lipid composition by lowering the desaturation index of fatty acids4–8. These alterations are potentially important in cancer cell adaptation to hypoxia. For instance, there is evidence that the suppression of FAO during hypoxia shifts the metabolism towards a more glycolytic phenotype boosting the survival of cancer cells7. Moreover, LDs can have a key role in limiting reactive oxygen species (ROS)-mediated lipid peroxidation during hypoxia by sequestering unsaturated lipids9, 10. Nevertheless, the identity and contribution of lipid species that are important for cancer cell adaptation to hypoxia are still mostly unknown.
A class of lipids that can ideally mediate cancer signalling adaptations to hypoxia is represented by phosphoinositides (PIs)11, 12. There is strong evidence indicating that the interaction between these phospholipid messengers and their binding proteins has key role in cancer cell signalling13, 14. For example, the level of phosphatidylinositol-3,4,5-trisphosphate [PI(3,4,5)P3] is regulated by PI3K and PTEN, two major signalling nodes in cancer regulation15. Furthermore, phosphatidylinositol 4,5-bisphosphate [PI(4,5)P2], another plasma membrane phosphoinositide, attracts PI3K and other phosphoinositide-modifying enzymes, including phospholipase C (PLC). PLC produces inositol triphosphate (IP3) and diacylglycerol (DAG) which are both potent second messengers mainly implicated in calcium (Ca2+) signalling and protein kinase C regulation (PKC), respectively, and are involved in signalling functions important for protein and membrane trafficking as well as cytoskeleton organization in response to stimuli16, 17. Supporting a role of phosphoinositide signalling in the adaptation of cancer cells to hypoxia, there is evidence that PI3K/AKT signalling increases the transcription and translation of hypoxia-inducible factor 1 (HIF-1), a crucial orchestrator of cellular adaptation to low oxygen environment18, 19. However, the role of other components of the phosphoinositide signalling in the adaptation to hypoxia remains unclear.
Non-small cell lung cancer (NSCLC) constitutes about 85% of all lung malignancies out of which 30% harbour KRAS mutations. In NSCLC, KRAS mutations are associated with aggressive cancers and remarkably the hypoxic phenotype in these tumors is linked to poorer patient survival20, 21. Here, we set to unravel the impact of hypoxia on phosphoinositide signalling and its functional implication in KRAS-driven NSCLC.
Results
Hypoxia suppresses PLCγ1 in KRAS-induced lung cancer
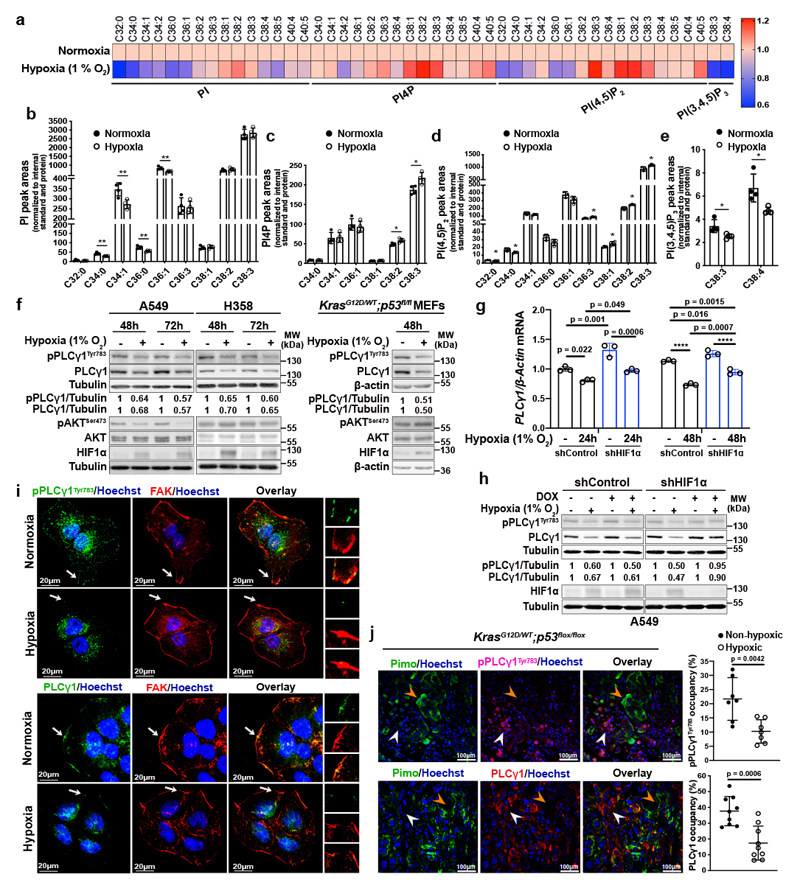
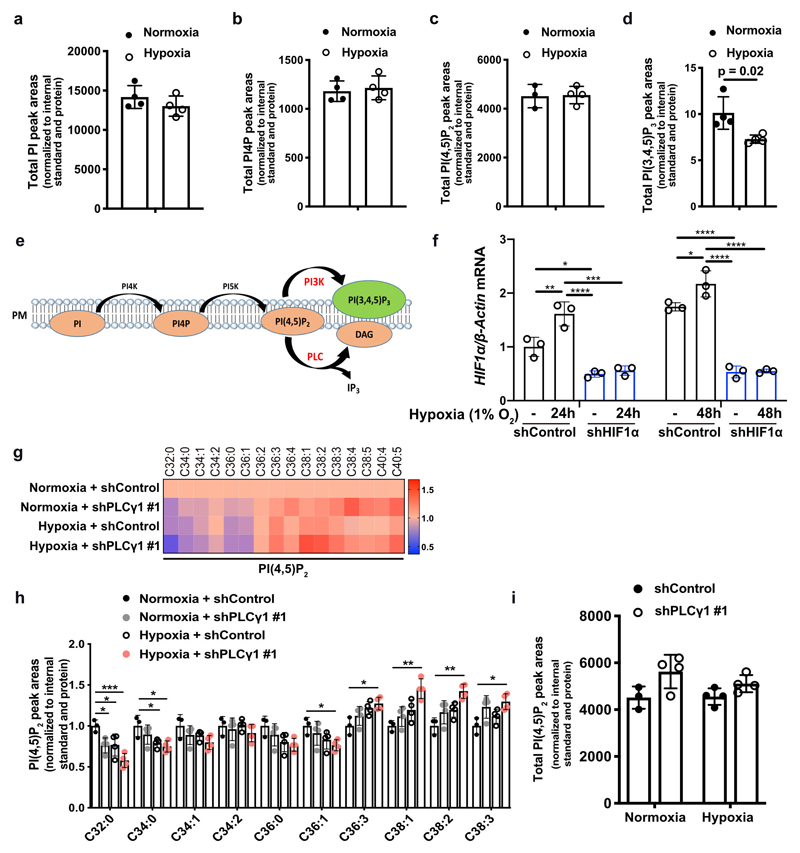
Aiming to identify a lipid signature that could reflect a molecular signalling with putative relevance in cancer hypoxia, we profiled the changes in phosphoinositide signalling in A549 human NSCLC cell line, bearing mutated KRAS22. We focused our analysis on 4 phosphoinositide lipids with a key role in membrane signalling propagation: PI, PI4P, PI(4,5)P2 and PI(3,4,5)P3. The shift to hypoxia (1% O2) did not cause changes in the total amount of PI, PI4P and PI(4,5)P2 but resulted in alterations in their total carbon number and fatty acid saturation level (Fig. 1a-1d and Extended Data Fig. 1a-1c). Among these changes, we found a relative increase in PI4P and PI(4,5)P2 containing C38:1, C38:2 and C38:3 (Fig. 1a, 1c and 1d). The increase in long-chain fatty acids was accompanied by a decrease in saturated C32 and C34 species (Fig. 1a-1d). On the other hand, we could detect only the most abundant PI(3,4,5)P3 lipids, C38:3 and C38:4, which appeared significantly reduced in hypoxia (Fig. 1a, 1e and Extended Data Fig. 1d). Taken together, these data raise the possibility of a perturbation in signalling propagation at the level of PI(4,5)P2 in hypoxia.
Figure 1. Hypoxia alters phosphoinositide fatty acid composition and suppresses PLCγ1.
(a) Heatmap showing lipid fold changes in A549 cells upon shift from normoxia to hypoxia for 48h analyzed by ultra-performance liquid chromatography - tandem mass spectrometry; n = 4 biologically independent samples/group. PI: phosphatidylinositol, PI4P: phosphatidylinositol-4-phosphate, PtdIns(4,5)P2: phosphatidylinositol-4,5-biphosphate, PI(3,4,5)P3: phosphatidylinositol-3,4,5-trisphosphate.
(b-e) Detectable peak areas of the indicated lipid species in A549 cells treated as in (a); n = 4 biologically independent samples/group. Graphs b and d are segmented to highlight less abundant lipids.
(f) Immunoblot analysis in A549, H358 and MEF cells treated as indicated. MEFs were generated from LSL-KrasG12D/WT;p53flox/flox mice and stably transduced with pMSCV-hygro-Cre.
(g) PLCγ1 mRNA expression level in A549 cells (relative to normoxia control at 24h). Cells were transduced with either an empty vector (Tet-pLKO-puro, shControl) or a doxycycline-inducible shRNA against HIF1α and incubated in normoxia or hypoxia for the indicated timepoints; n = 3 biologically independent samples.
(h) Immunoblot analysis of A549 cells transduced as in (g) and incubated in normoxia or hypoxia for 48h.
(i) Representative confocal microscopy images showing immunofluorescence for pPLCγ1Tyr783 or PLCγ1 (green) and FAK (red) in A549 cells incubated in normoxia or hypoxia for 48h. FAK: focal adhesion kinase. Hoechst: nuclei. The white arrows mark the magnified areas reported on the right.
(j) Representative confocal microscopy images showing immunofluorescence for pimonidazole (Pimo), pPLCγ1Tyr783 or PLCγ1 on lung tumors from KrasG12D/WT;p53flox/flox mice (left) and % of pPLCγ1Tyr783 and PLCγ1 occupancy in pimonidazole-negative versus pimonidazole-positive tumor cells (right). pPLCγ1Tyr783: n = 7/PLCγ1: n = 9 biologically independent replicates/group. Mouse FITC- and rabbit FITC anti-pimonidazole were used for pPLCγ1Tyr783/PLCγ1 staining, respectively. White arrow: non-hypoxic area, orange arrow: hypoxic area. Hoechst: nuclei.
The samples in panels f, h derive from the same experiment and the gels/blots were processed in parallel. Graphical data are mean ± SD. Statistical analyses were done using unpaired Student’s t test or one-way ANOVA. * p < 0.05, ** p < 0.01, **** p < 0.0001. Statistical source data and unprocessed immunoblots are provided in Source Data Fig. 1.
PI(4,5)P2 is a substrate for both PI3K and PLC (Extended Data Fig. 1e), thus, we set to understand the impact of hypoxia on these signalling pathways. We focused our analysis on PLCγ1, a PLC isoform that is commonly expressed in lung cancer lesions23, 24. Immunoblot analysis in 2 human mutant KRAS adenocarcinoma cell lines A549 and H358, and in mouse embryonic fibroblasts (MEFs) generated from a mouse model carrying a Cre-activatable KrasG12D allele (LSL-KrasG12D in which LSL denotes Lox-Stop-Lox) and a p53 conditional knockout allele, p53flox/flox (LSL-KrasG12D/WT; p53flox/flox)25, 26, indicated that while hypoxia led to disparate effects on the phosphorylation status of AKT (pAKTSer473/AKT, established readout of PI3K activation27) among the cell lines, it consistently caused a similar degree of reduction in both pPLCγ1Tyr783 (activated PLCγ1)28, 29 and PLCγ1 protein levels (Fig. 1f). Further analysis evidenced that PLCγ1 mRNA levels dropped upon shift to hypoxia (Fig. 1g and Extended Data Fig. 1f, black bars). Notably, knockdown of HIF1α dampened the suppression of PLCγ1 by hypoxia at the protein level and, at least partially, at the transcriptional level, suggesting a HIF1α-dependent mechanism (Fig. 1g, 1h and Extended Data Fig. 1f).
Confocal microscopy experiments in A549 cells evidenced that, in normoxia, both pPLCγ1Tyr783 and PLCγ1 colocalize with focal adhesion kinase (FAK)-rich focal contacts at the cell membrane as well as at perinuclear halos (Fig. 1i). However, 48 hours of hypoxia completely and specifically ablated both pPLCγ1Tyr783 and PLCγ1 from the cell membrane (Fig. 1i). Of note, it has been shown that the recruitment of PLCγ1 to the cell membrane is critical for the subsequent tyrosine phosphorylation at position 783 and activation of the enzyme28, 29.
PLCγ1 knockdown in A549 cells recapitulated the effect of hypoxia by increasing the relative level of PI(4,5)P2 containing C38:1, C38:2 and C38:3 species and decreasing the relative level of PI(4,5)P2 containing C32:0, C34:0, C36:0 species (Extended Data Fig. 1g and 1h). Remarkably, PLCγ1 knockdown cooperated with hypoxia to further accumulate C38:1, C38:2, C38:3 lipid species and suppress C32:0, C34:0, C36:0 species without affecting the total amount of PI(4,5)P2 (Extended Data Fig. 1g-1i). These results further corroborate the cause-effect relationship between hypoxia and PLCγ1 suppression in NSCLC cells.
To functionally support our results in vivo, we assessed the status of pPLCγ1Tyr783 and PLCγ1 in lung tumor tissue derived from LSL-KrasG12D/WT;p53flox/flox mice. To detect the hypoxic lung tumor areas, we injected mice with pimonidazole (hypoxyprobe), a 2-nitroimidazole, and we found positive pPLCγ1Tyr783 and PLCγ1 staining in more than 22% and 35% of the nonhypoxic tumor cells, respectively, while only about 10-15% stained positive in hypoxic tumor cells (Fig. 1j).
Altogether, our data indicate that PLCγ1 is suppressed in hypoxic mutant KRAS lung cancer cells.
PLCγ1 suppression enhances cancer cell survival during hypoxia
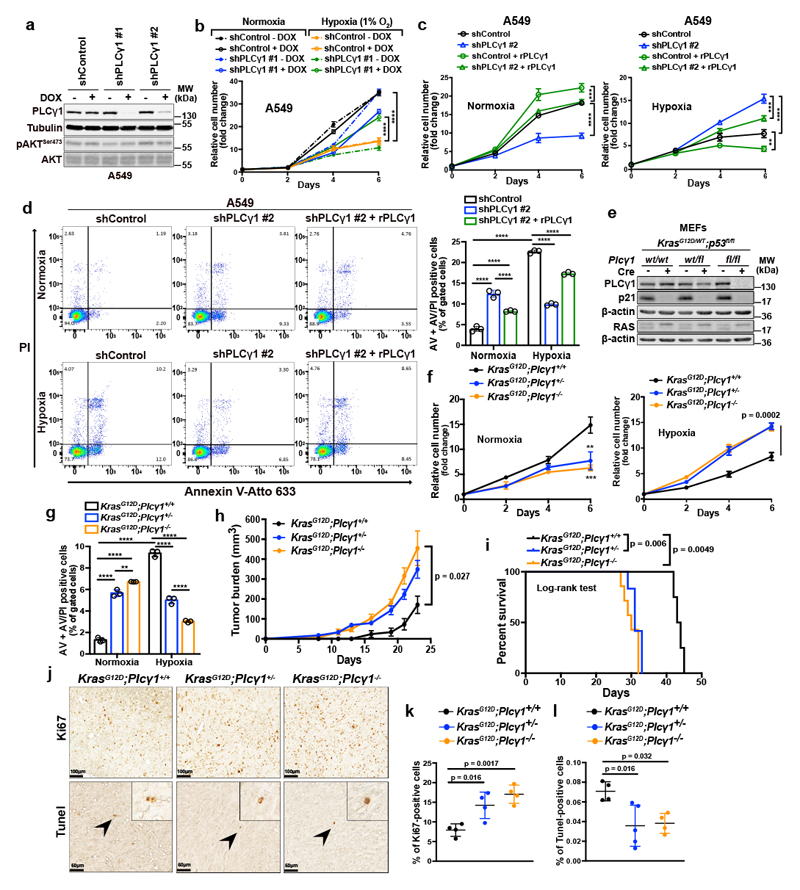
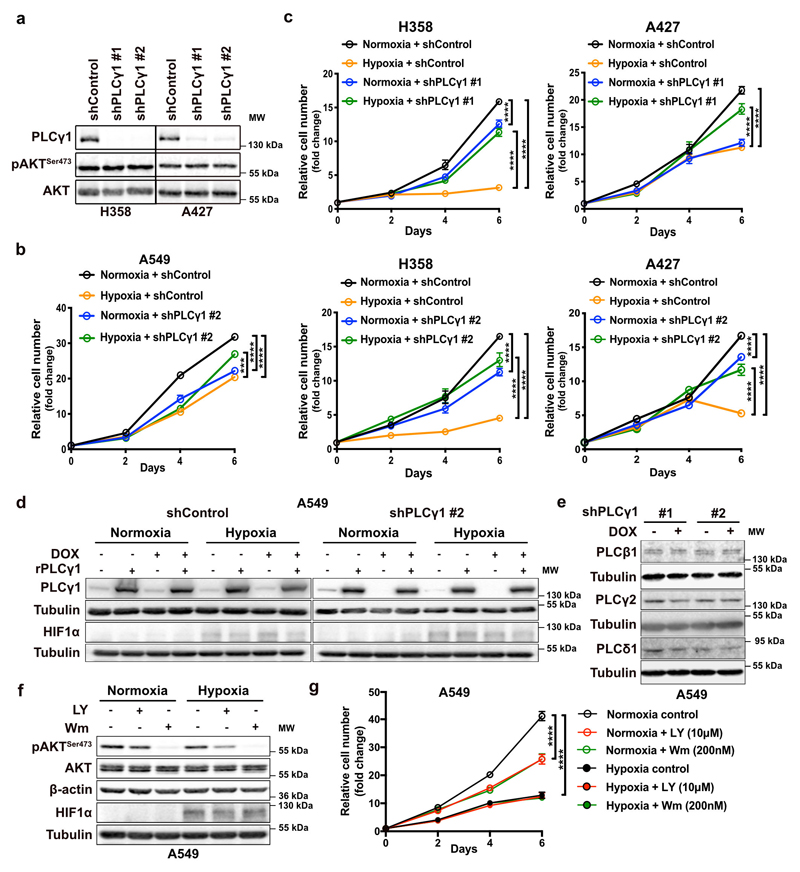
Next, we abolished PLCγ1 via doxycycline-inducible RNAi-mediated knockdown in A549, H358 and A427 NSCLC cell lines harboring a KRAS mutation and assessed proliferation in normoxia or upon shift to hypoxia. In normoxia, PLCγ1 knockdown decreased cancer cell proliferation (Fig. 2a, 2b and Extended Data Fig. 2a-2c). Moreover, the shift from normoxia to hypoxia caused a strong decrease in cancer cell proliferation. Yet, knockdown of PLCγ1 significantly reverted the anti-proliferative effect of hypoxia (Fig. 2b and Extended Data Fig. 2b, 2c). Both the decreased cell proliferation in normoxia and the increased cell proliferation in hypoxia upon PLCγ1 knockdown compared to the controls could be rescued by expression of a shRNA-resistant PLCγ1 (Fig. 2c and Extended Data Fig. 2d). Notably, the overexpression of PLCγ1 in A549 cells bolstered cell proliferation in normoxia while suppressed it in hypoxia (Fig. 2c, shControl empty vector vs shControl rPLCγ1). Of note, PLCγ1 knockdown did not affect the protein level of other PLC isoenzymes, suggesting a lack of compensatory effects (Extended Data Fig. 2e).
Figure 2. PLCγ1 suppression promotes cancer cell survival during hypoxia.
(a) Immunoblot analysis of A549 cells transduced with either an empty vector (Tet-pLKO-puro, shControl) or 2 doxycycline-inducible shRNAs against PLCγ1 and incubated without or with doxycycline (DOX) for 72h.
(b) Relative cell number of A549 cells transduced as in (a) and incubated in normoxia or hypoxia for the indicated timepoints; n = 3. ** p = 0.0015.
(c) Relative cell number of A549 cells transduced as in (a). 24h later, cells were transfected with either pcDNA3.1 empty vector or pcDNA3.1-rPLCγ1: shPLCγ1 #2-resistant PLCγ1 and further incubated in normoxia or hypoxia for the indicated timepoints; n = 3. Normoxia: *** p = 0.0005, hypoxia: ** p = 0.0033, *** p = 0.0006.
(d) Representative panels of Annexin V-Atto 633/Propidium iodide (PI) flow cytometry analysis (left) and relative quantification of Annexin V (AV) + Annexin V/PI (AV/PI)-positive A549 cells (right) treated as in (c); n = 3.
(e) Immunoblot analysis in MEF cells generated from mice of the indicated genotypes and stably transduced with pMSCV-hygro-Cre recombinase where indicated; fl: flox.
(f) Relative cell number of MEF cells transduced as in (e) and treated as indicated; n = 3. ** p = 0.0021, *** p = 0.0008.
(g) Annexin V (AV) + Annexin V/PI (AV/PI)-positive cell quantification by flow cytometry in MEF cells transduced as in (e), incubated in normoxia or hypoxia and analyzed by flow cytometry; n = 3. ** p = 0.0042.
(h, i) Tumor burden quantification (h) and overall survival (i) of immunocompromised mice. MEFs were tranduced as in (e) and injected subcutaneously in mice; n = 5 mice/group (KrasG12D;Plcγ1 +/+, n = 4 mice).
(j-l) Representative images of Ki67 immunohistochemistry (j, top), Tunel assay (j, bottom) and related quantifications (k, l) from tumors generated as in (h); n = 4 mice/group, KrasG12D;Plcγ1 +/- (l) n = 5 mice.
Graphical data are mean ± SD. Statistical analyses were done using one-way ANOVA or log-rank (Mantel-cox) test (when indicated). The n in panels b-d, f, g refers to biologically independent samples/group. **** p < 0.0001. Statistical source data and unprocessed immunoblots are provided in Source Data Fig. 2.
Our results showed a possible association between hypoxia and inhibition of PI3K in A549 cells (Fig. 1f). Treatment of A549 with LY294002 or Wortmannin, two PI3K inhibitors, decreased cancer cell proliferation in normoxic conditions (Extended Data Fig. 2f and 2g). However, neither drug had an impact on cell proliferation in hypoxia, suggesting that the observed change in the PI3K pathway is not relevant in this hypoxic context (Extended Data Fig. 2g).
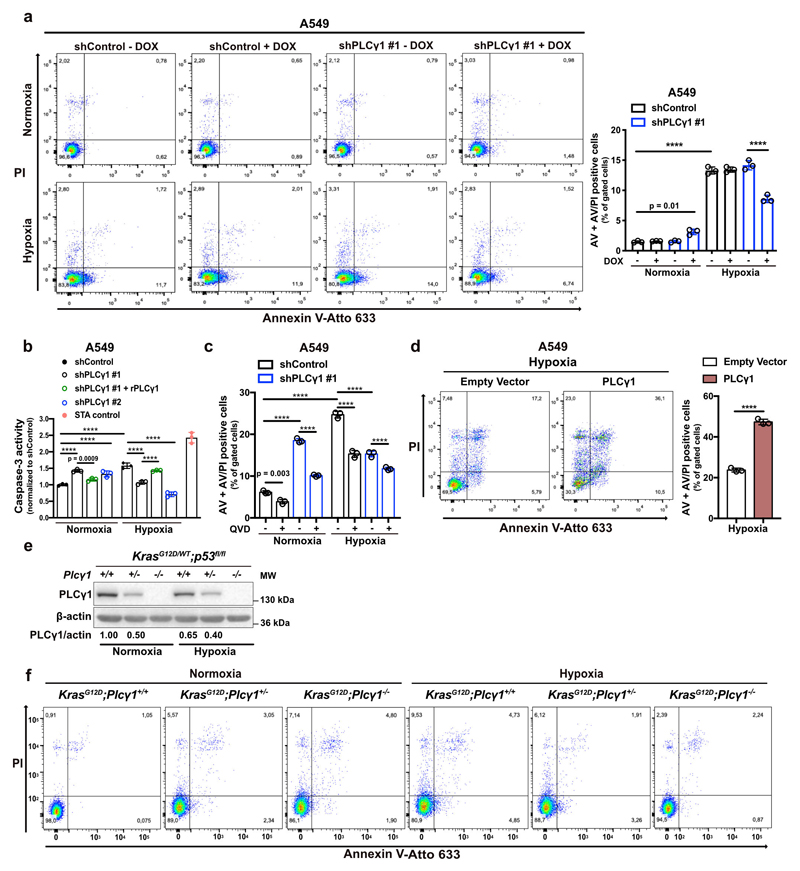
Flow cytometry assessment revealed an increase in Annexin V/propidium iodide (ANN/PI)-positive A549 cells upon PLCγ1 knockdown in normoxia, indicating that PLCγ1 is required for cell survival in this context (Fig. 2d and Extended Data Fig. 3a). Moreover, the shift from normoxia to hypoxia resulted in about 4-fold increase in cell death. However, PLCγ1 knockdown significantly suppressed the hypoxia-induced cell death and this could be rescued by expression of a shRNA-resistant PLCγ1 (Fig. 2d and Extended Data Fig. 3a). These results were additionally confirmed with a caspase-3 activity assay (Extended Data Fig. 3b). Intriguingly, QVD-OPH, a pan-caspase inhibitor, could not completely rescue the hypoxia-induced cell death, suggesting that other cell death mechanisms may be implicated in addition to caspase-dependent apoptosis (Extended Data Fig. 3c). Lastly, we found that overexpression of PLCγ1 in hypoxia caused a 2.5-fold increase in cell death (Extended Data Fig. 3d).
Next, to assess the impact of PLCγ1 suppression in a genetically-defined model, we generated MEFs from a combined Cre-activatable KrasG12D/WT and conditional p53flox/flox alleles (LSL-KrasG12D/WT;p53flox/flox) either wild-type (Plcγ1wt/wt), heterozygous (Plcγ1wt/flox), or homozygous for a Cre-conditional Plcγ1 allele (Plcγ1flox/flox), thereafter named KrasG12D;Plcγ1+/+, KrasG12D;Plcγ1 +/- and KrasG12D;Plcγ1 -/-, respectively. Subsequently, we transduced these MEFs with a Cre-expressing lentiviral construct to concomitantly turn on KrasG12D and knockout p53 and Plcγ1 (Fig. 2e). We found that, in normoxia, the KrasG12D;Plcγ1 +/- and KrasG12D;Plcγ1 -/- cells showed decreased proliferation and increased cell death compared to the KrasG12D;Plcγ1 +/+ cells (Fig. 2f, 2g and Extended Data Fig. 3e, 3f). However, in hypoxia, the KrasG12D;Plcγ1 +/- and KrasG12D;Plcγ1 -/- cells exhibited enhanced proliferation and decreased cell death compared to the hypoxic KrasG12D;Plcγ1 +/+ cells, confirming the results obtained with the human A549 cells (Fig. 2f, 2g and Extended Data Fig. 3e, 3f). Next, we injected the KrasG12D;Plcγ1 +/+, KrasG12D;Plcγ1 +/- and KrasG12D;Plcγ1 -/- cell lines subcutaneously in immunocompromised mice to assess tumor formation in vivo. We found that either partial (KrasG12D;Plcγ1 +/-) or complete suppression of PLCγ1 (KrasG12D;Plcγ1 -/-) resulted in increased tumor burden and decreased survival of mice compared to the mice injected with the KrasG12D;Plcγ1 +/+ cells (Fig. 2h and 2i). The increased tumor burden was due to increased proliferation and decreased apoptosis as shown by the % of Ki67- and Tunel-positive cells, respectively (Fig. 2j-2l). These data suggest that either heterozygous or homozygous deletion of Plcγ1 provide a survival advantage over the hypoxic control cells.
Taken together, these results indicate that the suppression of PLCγ1 hinders the proliferation and survival of lung cancer cells in normoxia, while on the other hand, circumvents the hypoxia-induced stress by promoting their proliferation and survival.
PLCγ1 suppression reduces mitochondrial oxidative metabolism and enhances the glycolytic capacity of cancer cells
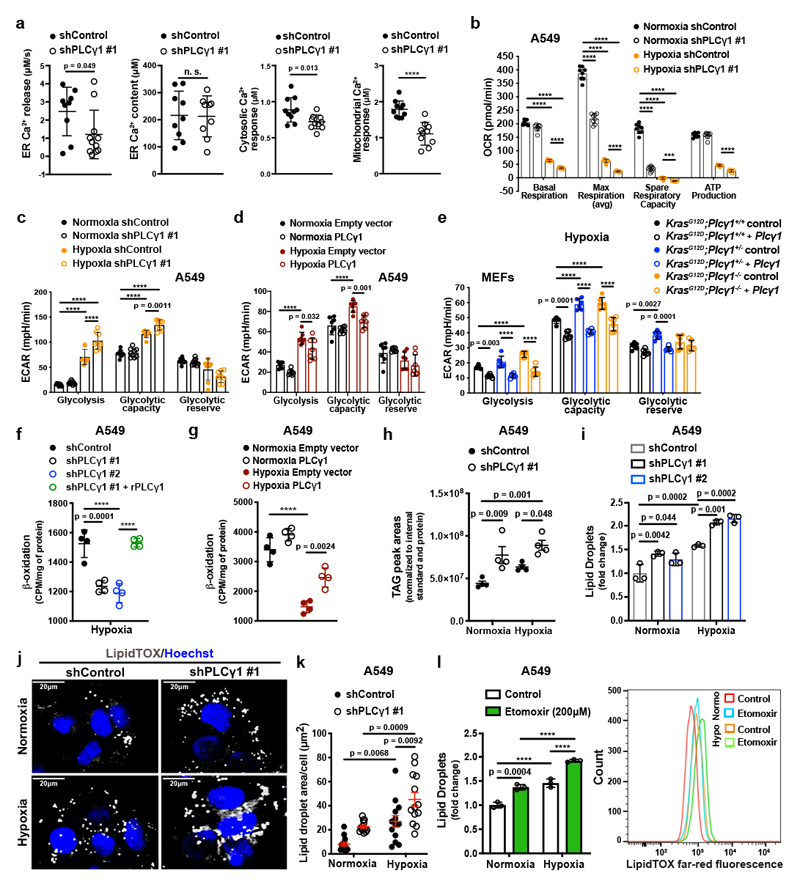
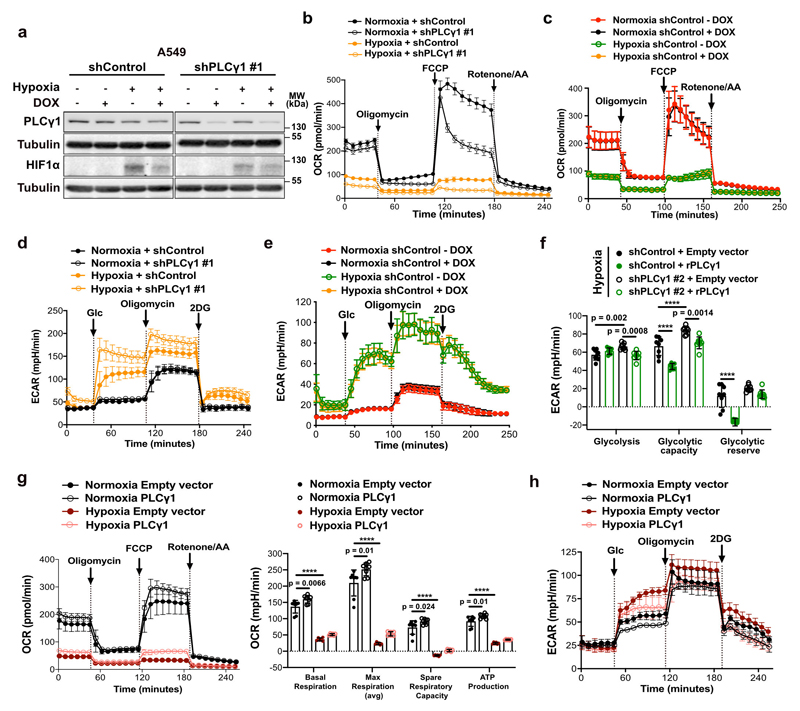
Ca2+ regulates mitochondrial oxidative phosphorylation, thereby contributing to the maintenance of cellular energy homeostasis and viability30–32. PLCγ1, by producing IP3, triggers Ca2+ mobilization from the endoplasmatic reticulum (ER) regulating mitochondrial functionality33–35. PLCγ1 knockdown in A549 cells reduced the rate of histamine-induced Ca2+ release from ER, without altering the luminal ER Ca2+ concentration at rest (Fig. 3a). This resulted in decreased cytosolic and mitochondrial Ca2+ response in PLCγ1 knockdown compared to control cells, confirming that PLCγ1 silencing triggers a sharp functional effect. To assess mitochondrial function, we measured the mitochondrial oxygen consumption rate (OCR), a marker of mitochondrial respiratory capacity and energy production, in A549 cells. We found that in normoxia, PLCγ1 knockdown did not have an impact on basal respiration and mitochondrial ATP production but the maximal respiration and spare respiratory capacity were significantly lower compared to the control cells, suggesting a mild mitochondrial dysfunction that is not apparent under basal conditions but becomes evident only under increased ATP demand (Fig. 3b and Extended Data Fig. 4a-4c). However, in hypoxia, we observed an overall reduction in all the OCR parameters upon PLCγ1 knockdown, suggesting that the cells are unable to maintain an adequate level of mitochondrial respiration (Fig. 3b and Extended Data Fig. 4a-4c). The extent of the metabolic difference between PLCγ1 knockdown in normoxia and hypoxia was evident by the increase in extracellular acidification rate (ECAR) which indicates the rate of glycolysis. Indeed, under basal conditions (unstimulated), glycolysis remained unaltered in normoxia while it increased in hypoxia upon PLCγ1 knockdown, suggesting a metabolic switch from oxidative phosphorylation to aerobic glycolysis (Fig. 3c and Extended Data Fig. 4d, 4e). Importantly, the increased glycolysis upon PLCγ1 knockdown in hypoxia could be rescued by expression of a shRNA-resistant PLCγ1 (Extended Data Fig. 4f). Furthermore, overexpression of PLCγ1 increased OCR in both normoxia and hypoxia (Extended Data Fig. 4g) and decreased glycolysis in hypoxia (Fig. 3d and Extended Data Fig. 4h). Lastly, we found that the KrasG12D;Plcγ1 +/- and KrasG12D;Plcγ1 -/- MEFs evidenced decreased OCR and enhanced glycolysis compared to the KrasG12D;Plcγ1 +/+ control cells in hypoxia (Fig. 3e and Extended Data Fig. 5a-5c). Notably, the enhanced glycolysis of KrasG12D;Plcγ1 +/- and KrasG12D;Plcγ1 -/- MEFs in hypoxia could be rescued by PLCγ1 overexpression (Fig. 3e and Extended Data Fig. 5a-5c).
Figure 3. PLCγ1 suppression decreases mitochondrial respiration and enhances cancer cell glycolytic capacity.
(a) ER Ca2+ release rate (n = 9/11), intraluminal content (n = 9), cytosolic and mitochondrial Ca2+ response (n = 10) in cells transduced with either empty vector (shControl) or doxycycline-inducible shRNA against PLCγ1.
(b) Oxygen consumption rate (OCR) in A549 cells transduced as in (a), incubated with doxycycline for 48h and moved to normoxia or hypoxia for 48h; n = 8.
(c) Extracellular acidification rate (ECAR) in A549 cells transduced and treated as in (b); n normoxia/hypoxia = 9/8.
(d) ECAR in A549 cells transfected with either pcDNA3.1 empty vector or pcDNA3.1-PLCγ1 and incubated for 48h in normoxia or hypoxia; n = 7.
(e) ECAR in MEFs of the indicated genotype transfected with either pcDNA3.1-HA-LIC empty vector or pcDNA3.1-HA-LIC-PLCγ1 and incubated for 48h in hypoxia; n = 6.
(f) β-oxidation of cells transduced with either an empty vector (shControl) or doxycycline-inducible shRNAs against PLCγ1, transfected with pcDNA3.1 empty vector or pcDNA3.1-rPLCγ1 (shRNA-resistant PLCγ1) and incubated for 48h in hypoxia; n = 4.
(g) β-oxidation of cells transfected with either pcDNA3.1 empty vector or pcDNA3.1-PLCγ1 and incubated for 48h in normoxia or hypoxia; n = 4.
(h) Triacylglycerols measured by ultra performance liquid chromatography - tandem mass spectrometry of cells treated as in (b); n = 4/group.
(i) Lipid droplet quantification by flow cytometry (relative to normoxia) of cells transduced as in (b) and stained with LipidTOX (far red); n = 3
(j) Representative confocal fluorescence microscopy images of lipid droplet staining with LipidTOX (far red) in cells treated as in (b). Hoechst: nuclei.
(k) Representative quantification of LD area/cell from (j); n = 13 biologically independent replicates (50 cells/replicate).
(l) Lipid droplet quantification (relative to normoxia) by flow cytometry (left) and representative flow cytometry panel (right) of cells treated as indicated and stained with LipidTOX; n = 3.
Graphical data are mean ± SD. Statistical analyses were done using two-tailed unpaired Student’s t test or one-way ANOVA; n, number of biologically independent samples. **** p < 0.0001. Statistical source data are provided in Source Data Fig. 3.
Our results suggest that PLCγ1 knockdown impairs mitochondrial oxidative metabolism that could result in decreased mitochondrial capacity to oxidize lipids. Indeed, fatty acid oxidation (FAO) decreased upon PLCγ1 knockdown in hypoxia, an effect that was rescued by expression of a shRNA-resistant PLCγ1 (Fig. 3f). Moreover, PLCγ1 overexpression enhanced FAO both in normoxia and hypoxia (Fig. 3g). Since triacylglycerols (TAGs) are a source of fatty acids for mitochondrial FAO, we quantified the total amount of TAGs upon PLCγ1 knockdown. Intriguingly, PLCγ1 knockdown resulted in a major increase in TAGs in both normoxia and hypoxia (Fig. 3h). Staining of LDs with LipidTOX, a LD marker, and measurement by flow cytometry analysis showed that PLCγ1 knockdown results in a significant increase in LDs (Fig. 3i and Extended Data Fig. 5d). Confocal microscopy revealed that this was due to an increase in the LD size upon PLCγ1 knockdown (Fig. 3j and 3k). The accumulation of LDs upon FAO inhibition could be recapitulated by treatment of A549 cells with Etomoxir, a FAO inhibitor, suggesting that TAG accumulation may be due to the reduced mitochondrial capacity to oxidize lipids (Fig. 3l). These results indicate that PLCγ1 inhibition impairs fatty acid catabolism accumulating TAGs in LDs.
Overall, our data suggest that PLCγ1 inhibition mediates a more efficient metabolic reprogramming, thereby improving the adaptation of mutant KRAS cancer cells to hypoxia.
PLCγ1 suppression mediates the adaptation of cancer cells to hypoxia by reducing ROS
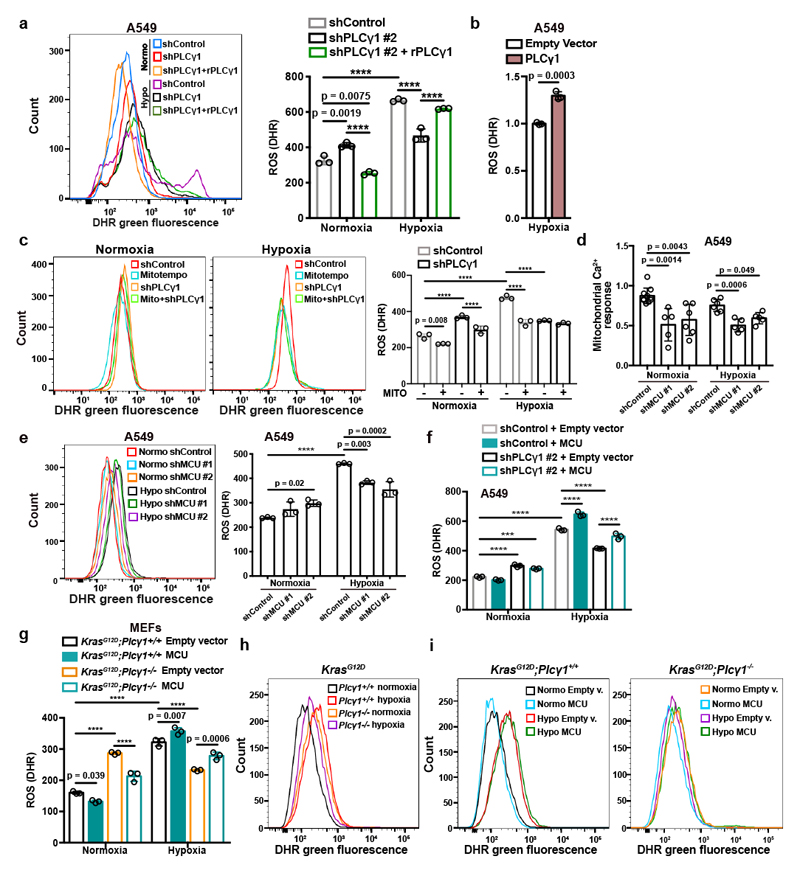
Experimental evidence supports the possibility that exposure of cells to hypoxia, including lung cancer cells, increases ROS production36, 37. Indeed, we found that ROS levels increased by about 2-fold in A549 cells upon shift from normoxia to hypoxia (Fig. 4a and Extended Data Fig. 6a). Nevertheless, PLCγ1 knockdown significantly suppressed ROS production in hypoxia, which was rescued by expression of a shRNA-resistant PLCγ1 (Fig. 4a and Extended Data Fig. 6a). PLCγ1 knockdown also caused a moderate ROS increase in normoxia, which was rescued by expression of a shRNA-resistant PLCγ1 (Fig. 4a). Moreover, overexpression of PLCγ1 in hypoxia, intensified ROS levels, additionally supporting a role of PLCγ1 in modulating ROS production (Fig. 4b). Notably, treatment with the mitochondria-targeted antioxidant, mitoTEMPO, suppressed hypoxia-induced ROS in A549 cells, indicating a mitochondrial source of ROS (Fig. 4c).
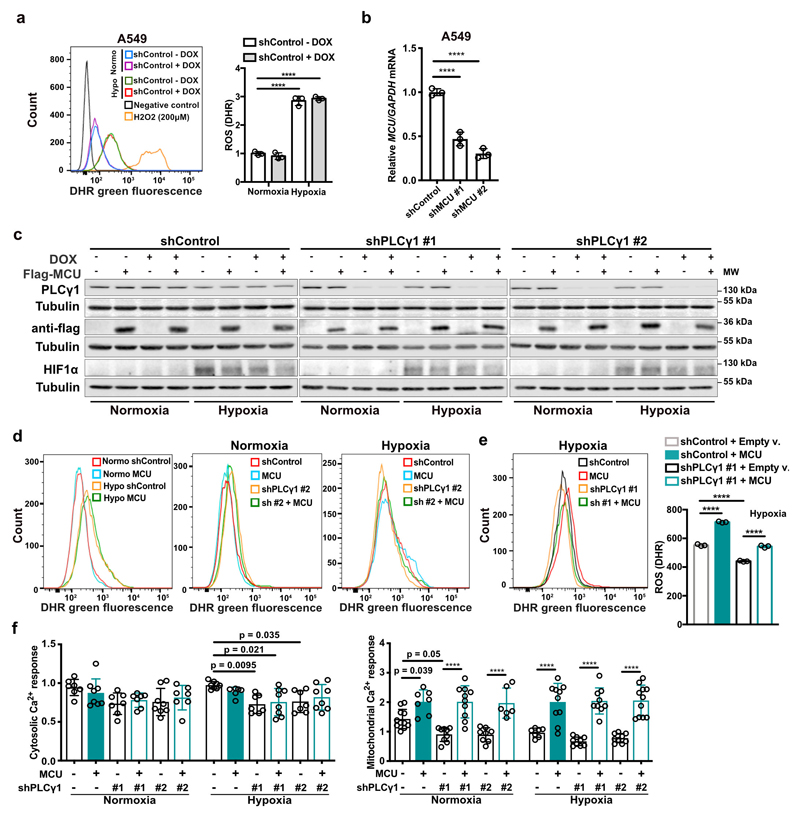
Figure 4. PLCγ1 suppression depletes mitochondrial ROS through impairment of Ca2+ entry into mitochondria.
(a) Representative flow cytometry histogram (left) and quantification of DHR (ROS marker, green) (right) of A549 cells transduced with either an empty vector (Tet-pLKO-puro, shControl) or a doxycycline-inducible shRNA against PLCγ1. Cells were then transfected with either pcDNA3.1 empty vector or pcDNA3.1-rPLCγ1: shPLCγ1 #2-resistant PLCγ1 and incubated in normoxia or hypoxia for 48h. DHR: Dihydrorhodamine; n = 3.
(b) Flow cytometry quantification of DHR (green) in A549 cells (relative to control) transfected with either pcDNA3.1 empty vector or pcDNA3.1-PLCγ1 and moved to hypoxia for 48h. DHR: Dihydrorhodamine; n = 3.
(c) Representative flow cytometry histograms (left) and quantification of DHR (green, right) of A549 cells transduced and treated as in (a). 18h before staining with DHR for analysis cells were treated with 10μM MitoTEMPO. DHR: Dihydrorhodamine. Mito: MitoTEMPO; n = 3.
(d) Mitochondrial Ca2+ response of A549 cells transduced with an empty vector (Tet-pLKO-puro, shControl) or 2 doxycycline-inducible shRNAs against MCU. Cells were then treated with doxycycline for 24h, transfected with appropriate targeted-aequorin probe and histamine-induced Ca2+ measurements were performed after 48h of incubation in normoxia or hypoxia; n/group = 9, 5, 6, 6, 5, 5.
(e) Representative flow cytometry histogram (left) and quantification of DHR (green, right) of A549 cells treated as in (d). DHR: Dihydrorhodamine. n = 3.
(f) Flow cytometry quantification of DHR (green) of A549 cells transduced as in (a). Cells were then transfected with either pcDNA3.1 empty vector or pcDNA3.1-MCU-flag plasmid and incubated in normoxia or hypoxia for 48h. DHR: Dihydrorhodamine; n = 3.
(g-i) Flow cytometry quantification (g) and representative histograms (h and i) of DHR (green) in MEFs of the indicated genotype. MEFs were transfected with either pcDNA3.1 empty vector or pcDNA3.1-MCU-flag plasmid and incubated in normoxia or hypoxia for 48h. DHR: Dihydrorhodamine; n = 3.
Graphical data are mean ± SD. Statistical analyses were done using two-tailed unpaired Student’s t test or one-way ANOVA; n, number of biologically independent samples. **** p < 0.0001. Statistical source data are provided in Source Data Fig. 4.
Ca2+ stimulates the activity of the electron transport chain, which influences mitochondrial ROS production during hypoxia38. Thus, we investigated whether PLCγ1 controls ROS production through the regulation of Ca2+ mobilization to mitochondria. First, we silenced the mitochondrial calcium uniporter (MCU), the machinery responsible for Ca2+ uptake into the matrix39, 40, and assessed ROS production in normoxia or hypoxia upon PLCγ1 knockdown. The silencing of MCU with shRNAs suppressed mitochondrial Ca2+ and decreased ROS formation of A549 cells in hypoxia (Fig. 4d, 4e and Extended Data Fig. 6b). Conversely, MCU overexpression upon PLCγ1 knockdown increased ROS production to a level similar to the hypoxic control (Fig. 4f and Extended Data Fig. 6c-6f). The effect of PLCγ1 suppression on ROS production was also recapitulated in MEFs. Indeed, KrasG12D;Plcγ1 -/- MEFs generated less ROS in hypoxia compared to KrasG12D;Plcγ1 +/+, an effect that could be rescued by MCU overexpression (Fig. 4g-4i and Extended Data Fig. 7a).
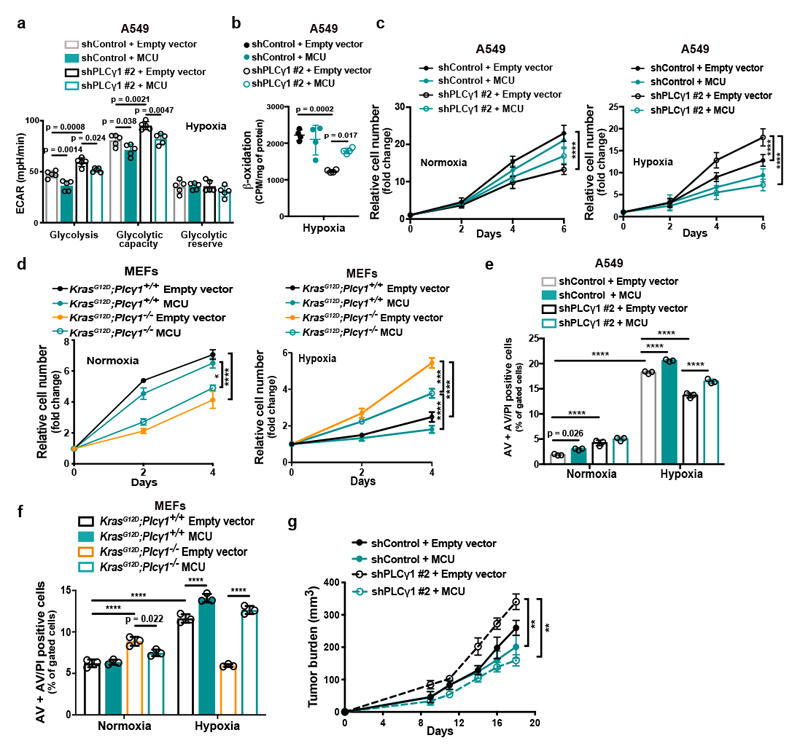
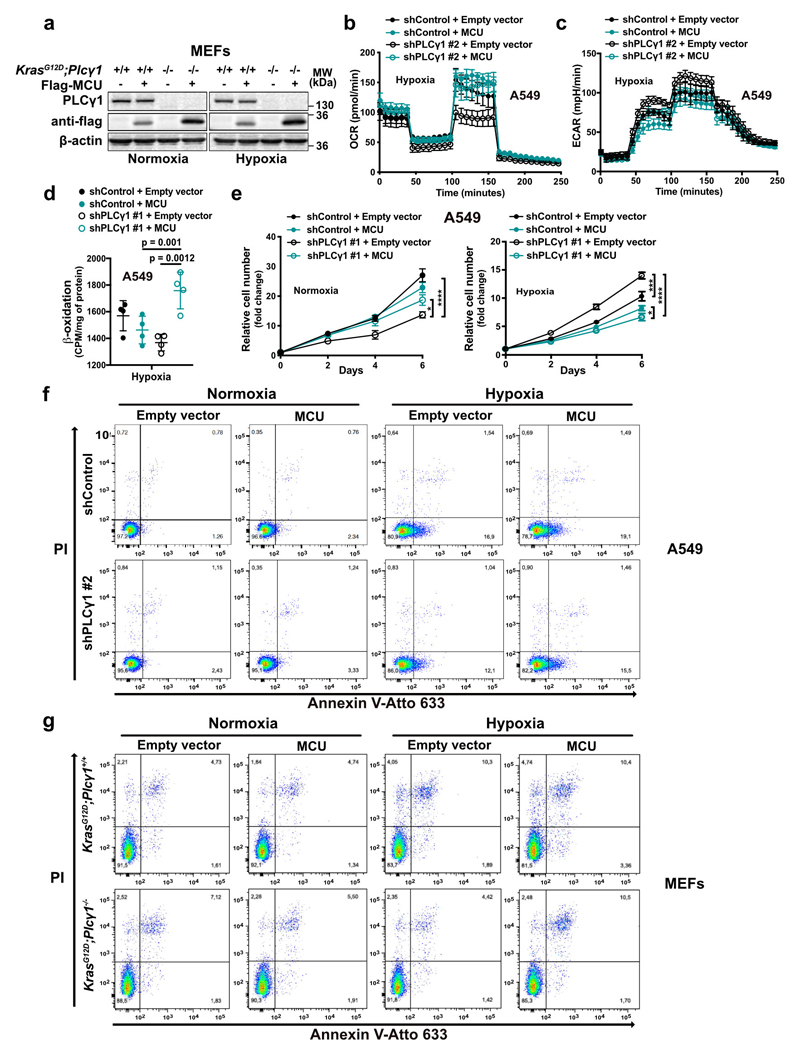
MCU overexpression increased OCR and decreased glycolysis and glycolytic capacity in both control and PLCγ1 knocked down A549 cells during hypoxia (Fig. 5a and Extended Data Fig. 7b, 7c). Furthermore, although MCU overexpression did not affect β-oxidation of control A549 cells in hypoxia, it rescued the decreased β-oxidation caused by PLCγ1 knockdown (Fig. 5b and Extended Data Fig. 7d).
Figure 5. Ca2+ entry into mitochondria prevents the glycolytic shift and impairs the survival of cancer cells to hypoxia.
(a) Bar graph showing extracellular acidification rate (ECAR) and the different parameters in A549 transduced with either an empty vector (Tet-pLKO-puro, shControl) or a doxycycline-inducible shRNA against PLCγ1 (shPLCγ1 #2). Cells were then incubated with doxycycline, transfected with either pcDNA3.1 empty vector or pcDNA3.1-MCU-flag plasmid and incubated in normoxia or hypoxia for 48h; n = 5.
(b) Fatty acid β-oxidation of A549 cells in hypoxia treated as in (a); n = 4.
(c) Relative cell number of A549 cells in normoxia or hypoxia treated as in (a); n = 3.
(d) Relative cell number of the indicated MEFs transfected with either pcDNA3.1 empty vector or pcDNA3.1-MCU-flag plasmid and incubated in normoxia or hypoxia; n = 3. * p = 0.022, *** p = 0.0002.
(e) Annexin V (AV) + Annexin V/PI (AV/PI)-positive cell quantification by flow cytometry analysis in A549 cells treated as in (a) and incubated in normoxia or hypoxia for 72h. The related panels are reported in Extended Data Fig. 7f; n = 3.
(f) Annexin V (AV) + Annexin V/PI (AV/PI)-positive cell quantification by flow cytometry analysis in the indicated MEFs transfected with either pcDNA3.1 empty vector or pcDNA3.1-MCU-flag plasmid and incubated in normoxia or hypoxia. The related panels are reported in Extended Data Fig. 7g; n = 3 .
(g) Tumor burden quantification of A549 cells grown as xenografts in immunocompromised mice. A549 cells were transduced with either pWZL-Hygro empty vector or pWZL-Hygro-MCU-Flag and either with an empty vector control (Tet-pLKO-puro, shControl) or a doxycycline-inducible shRNA against PLCγ1 (shPLCγ1 #2) and injected subcutaneously in mice. Tumors were measured every 2-3 days with a caliper; n = 4 mice/group. ** p = 0.0012.
Graphical data are mean ± SD. Statistical analyses were done using one-way ANOVA; n (a-f), number of biologically independent samples. **** p < 0.0001. Statistical source data are provided in Source Data Fig. 5.
MCU overexpression enhanced the proliferation of PLCγ1 knocked down A549 cells and KrasG12D;Plcγ1 -/- MEFs in normoxia, while completely abolished their enhanced cell proliferation in hypoxia (Fig. 5c, 5d and Extended Data Fig. 7e). Moreover, although cell death was not affected by MCU overexpression in A549 cells, it was significantly suppressed in KrasG12D;Plcγ1 -/- MEFs in normoxia (Fig. 5e, 5f and Extended Data Fig. 7f, 7g). In contrast, MCU overexpression abolished the protection from cell death of PLCγ1 knocked down A549 cells and KrasG12D;Plcγ1 -/- MEFs in hypoxia (Fig. 5e, 5f and Extended Data Fig. 7f, 7g). Extending the relevance of these data, we found that MCU overexpression impaired the subcutaneous A549 xenograft growth in immunocompromised mice and abolished the increased tumor growth of the PLCγ1 knocked down cohort (Fig. 5g).
These results indicate that PLCγ1 suppression hinders ROS production by reducing ER-mitochondria Ca2+ transfer and mitochondrial Ca2+ overload, hence, improving cancer cell survival during hypoxia.
PLCγ1 suppression reduces lipid peroxidation during hypoxia
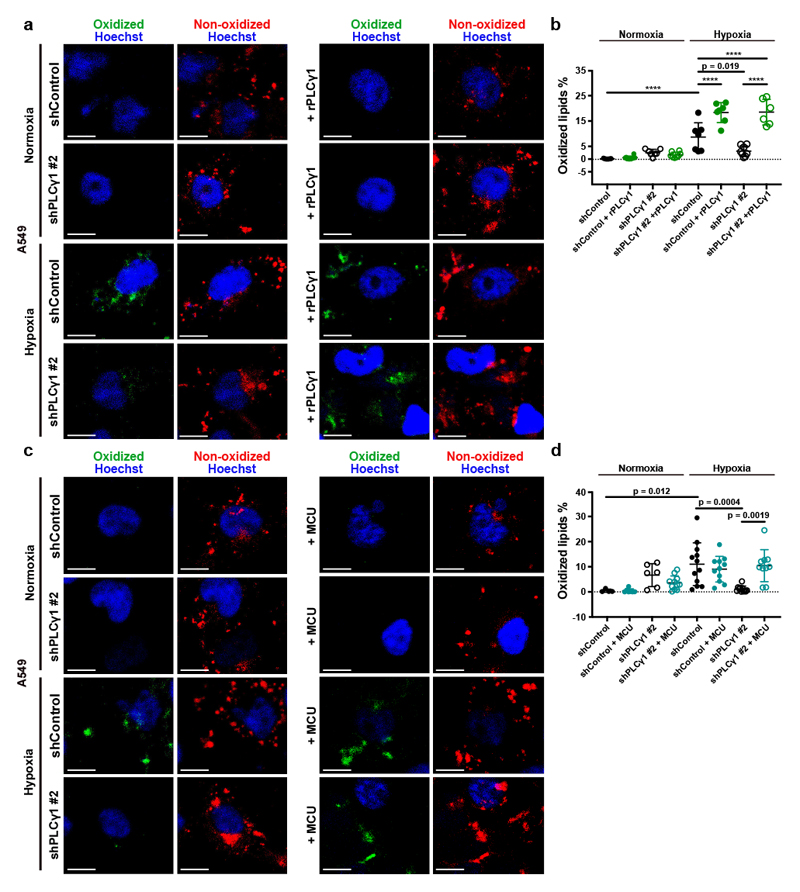
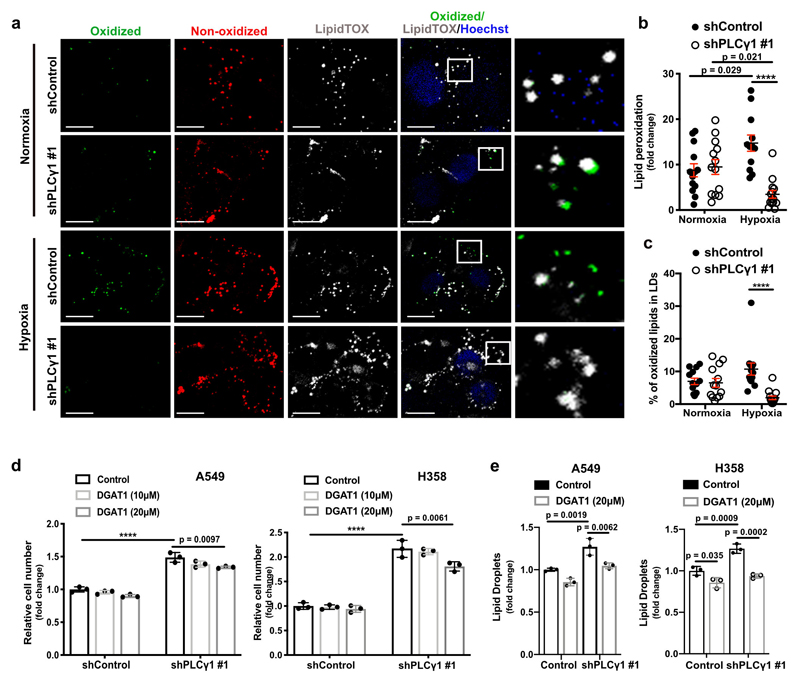
Increased ROS levels in hypoxia is a cause of lipid peroxidation and cellular membrane damage41. Thus, we hypothesized that PLCγ1 inhibition, by lowering ROS, can rescue the harmful effects of hypoxia-induced lipid peroxidation. Confocal microscopy analysis in A549 cells upon staining with the lipid peroxidation sensor, BODIPY 581/591 C11, revealed that hypoxia increased lipid peroxidation by about 10% (Fig. 6a and 6b, solid black dots and Extended Data Fig. 8a, 8b). Strinkingly, PLCγ1 knockdown suppressed the hypoxia-induced lipid peroxidation which was rescued by expression of a shRNA-resistant PLCγ1 (Fig. 6a and 6b). Moreover, co-staining with LipidTOX evidenced increased colocalization of the oxidized lipid fraction with LDs in hypoxia, which was abolished by PLCγ1 knockdown (Extended Data Fig. 8a and 8c). Taken together, these results suggest that PLCγ1 knockdown decreases lipid peroxidation in hypoxia, therefore preventing cell damage.
Figure 6. PLCγ1 suppression reduces hypoxia-induced lipid peroxidation.
(a) Representative confocal microscopy images showing oxidized and non-oxidized lipids in A549 cells. A549 cells were transduced with either an empty vector control (Tet-pLKO-puro, shControl) or a doxycycline-inducible shRNA against PLCγ1 (shPLCγ1 #2). Cells were then incubated in the presence of doxycycline and transfected with either pcDNA3.1 empty vector or pcDNA3.1-rPLCγ1 (shRNA-resistant PLCγ1: rPLCγ1) to rescue the shPLCγ1 #2. Cells were then incubated for additional 48h in normoxia or hypoxia (1% O2), stained with BODIPY 581/591 C11 (green: oxidized lipids / red: non-oxidized lipids) and Hoechst (nuclei in blue) and analyzed by microscopy. Oxidation of the polyunsaturated butadienyl portion of BODIPY 581/591 C11 results in a shift of the fluorescence emission peak from ~590 nm (red) to ~510 nm (green). Scale bars: 20 μm.
(b) Quantification of lipid peroxidation expressed as percent of oxidized lipids from (a); n biologically independent replicates/group = 7, 8, 7, 8, 7, 7, 8 and 6.
(c) Representative confocal microscopy images showing oxidized and non-oxidized lipids in A549 cells previously transduced with either an empty vector control (Tet-pLKO-puro, shControl) or a doxycycline-inducible shRNA against PLCγ1 (shPLCγ1 #2). Cells were then treated with doxycycline for 24h and transfected with either pcDNA3.1 empty vector or pcDNA3.1-MCU-flag. After this, cells were incubated for additional 48h in normoxia or hypoxia (1% O2), stained with BODIPY 581/591 C11 (green: oxidized lipids / red: non-oxidized lipids) and Hoechst (nuclei in blue) and analyzed by microscopy. Scale bars: 20 μm.
(d) Quantification of lipid peroxidation, expressed as percent of oxidized lipids from (c); n biologically independent replicates/group = 4, 7, 6, 11, 12, 11, 11 and 10.
Graphical data are mean ± SD. Statistical analyses were done using one-way ANOVA. **** p < 0.0001. Statistical source data are provided in Source Data Fig. 6.
To examine whether PLCγ1 affects lipid peroxidation through Ca2+ mobilization to the mitochondria, we overexpressed MCU and assessed lipid peroxidation in normoxia or hypoxia upon PLCγ1 knockdown. Consistent with the effect of MCU-induced ROS changes, MCU overexpression in hypoxic PLCγ1 knocked down cells increased lipid peroxidation to a level comparable to the control-treated cells (Fig. 6c and 6d).
Previous evidence suggests that, during oxidative stress LDs sequester and protect unsaturated lipids from lipid peroxidation10. Therefore, the accumulation of TAGs in LDs could contribute to the increased survival upon PLCγ1 knockdown during hypoxia. Nevertheless, inhibition of TAG formation, with a DGAT1 inhibitor (T863), led only to a mild decrease in proliferation upon PLCγ1 knockdown in hypoxia, suggesting a marginal role of LDs in this context (Extended Data Fig. 8d and 8e).
Plcγ1 suppression promotes KrasG12D-driven lung tumor development in mice
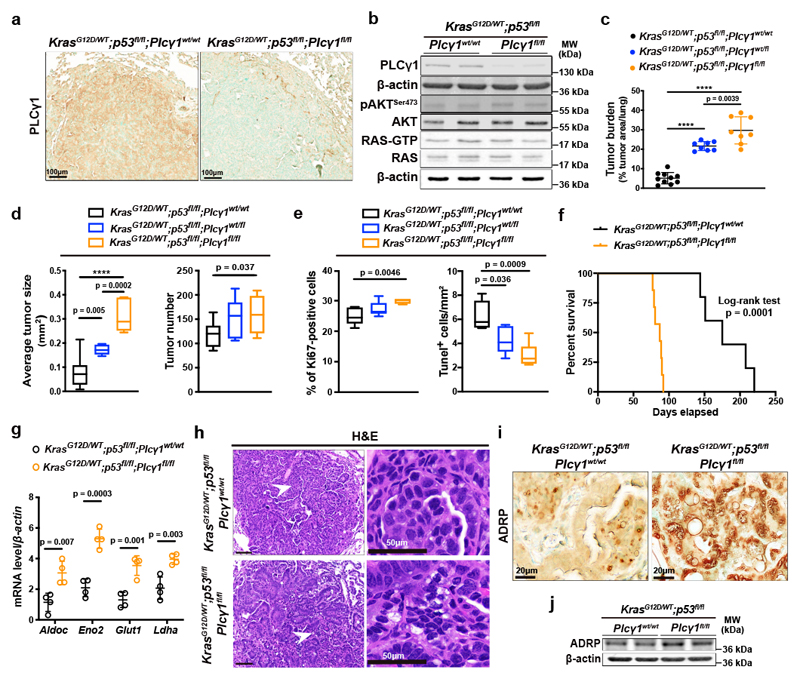
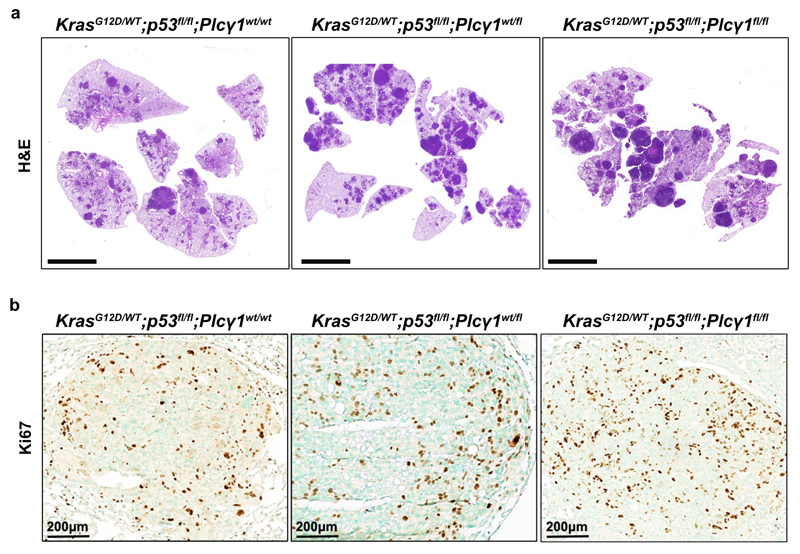
Our in vitro results suggest that PLCγ1 suppression may confer survival advantage during tumorigenesis. To this aim, we generated mice carrying a Cre-activatable KrasG12D allele, homozygous for a conditional p53 knockout allele, and either wild-type, heterozygous or homozygous for a conditional Plcγ1 allele, to generate 3 experimental groups: KrasG12D/WT;p53flox/flox;Plcγ1wt/wt, KrasG12D/WT;p53flox/flox;Plcγ1wt/flox and KrasG12D/WT;p53flox/flox; Plcγ1flox/flox. Adenovirus-mediated Cre delivery to the lungs, results in KrasG12D expression and concomitant p53 and Plcγ1 deletion. IHC staining and immunoblot against PLCγ1 in dissected lung tumors 10 weeks upon Cre delivery (tumor onset), evidenced efficient PLCγ1 depletion in tumors of KrasG12D/WT;p53flox/flox;Plcγ1flox/flox mice compared to the KrasG12D/WT;p53flox/flox;Plcγ1wt/wt control mice (Fig. 7a and 7b). Of note, Plcγ1 deletion did not have an impact on AKT activation or on the activation status of RAS in dissected lung tumors from KrasG12D/WT;p53flox/flox;Plcγ1flox/flox and KrasG12D/WT;p53flox/flox;Plcγ1wt/wt mice (Fig. 7b). Tumor burden quantification 10 weeks after tumor onset, evidenced in both KrasG12D/WT;p53flox/flox;Plcγ1wt/flox and KrasG12D/WT;p53flox/flox;Plcγ1flox/flox mice, a striking increase in lung tumor burden upon KrasG12D induction compared to the KrasG12D/WT;p53flox/flox;Plcγ1wt/wt control littermates, indicating that even a partial Plcγ1 suppression is sufficient to confer a tumor cell survival advantage in vivo (Fig. 7c and Extended Data Fig. 9a). The increased tumor burden was due to increased tumor size and tumor number (Fig. 7d). Indeed, the tumors from KrasG12D/WT;p53flox/flox;Plcγ1wt/flox and KrasG12D/WT;p53flox/flox;Plcγ1flox/flox mice showed increased proliferative capacity and decreased cell death compared to the KrasG12D/WT;p53flox/flox;Plcγ1wt/wt tumors as assessed by Ki67 and Tunel staining, respectively (Fig. 7e and Extended Data Fig. 9b). Next, we generated mouse cohorts to compare the survival of KrasG12D/WT;p53flox/flox;Plcγ1wt/wt mice to KrasG12D/WT;p53flox/flox;Plcγ1flox/flox mice. In agreement with the increased lung tumor growth, the survival rate of the KrasG12D/WT;p53flox/flox;Plcγ1flox/flox mice was significantly reduced compared to KrasG12D/WT;p53flox/flox;Plcγ1wt/wt control mice (Fig. 7f).
Figure 7. Plcγ1 deletion accelerates Kras-driven lung tumorigenesis and results in poor survival.
(a) Representative images of immunohistochemistry against PLCγ1 in mouse lung tissue of the indicated mice 10 weeks after Cre induction.
(b) Representative immunoblot analysis of the indicated targets and RAS activity assay (bottom) in dissected lung tumors of the indicated mice treated as in (a).
(c) Lung tumor burden quantification of mice with the indicated genotype 10 weeks after Cre induction; n mice/group: 10, 8, 8.
(d) Average lung tumor size and tumor number of mice with the indicated genotype 10 weeks after Cre induction. Tumor size n mice/group: 10, 7, 7 and tumor number n mice/group: 10, 8, 7. The box-plots span from the first to third quartile (depicting the median as a line in the middle), the whiskers extend to 1.5 x IQR (interquartile range).
(e) Quantification of Ki67 and number of Tunel-positive cells in mouse lung tumors from LSL-KrasG12D/WT;p53flox/flox;Plcγ1wt/wt (n = 5 mice), LSL-KrasG12D/WT;p53flox/flox;Plcγ1wt/flox (n = 8 mice for Ki67 and 5 mice for Tunel) and LSL-KrasG12D/WT;p53flox/flox;Plcγ1flox/flox (n = 5 mice for Ki67 and 6 mice for Tunel) mice, 10 weeks after Cre induction. The box-plots span from the first to third quartile (depicting the median as a line in the middle).
(f) Kaplan-Meier analysis showing the percent survival of LSL-KrasG12D/WT;p53flox/flox;Plcγ1wt/wt (n = 7 mice/group) and LSL-KrasG12D/WT;p53flox/flox;Plcγ1flox/flox (n = 8 mice/group) mice. Statistical analysis was done using log-rank (Mantel-cox) test.
(g) mRNA level of the indicated genes from dissected mouse lung tumors of the indicated mice 10 weeks after Cre induction; n = 4 mice/group.
(h) Hematoxylin & eosin (H&E) staining of mice with the indicated genotype 10 weeks after Cre induction. Scale bars left: 100 μm. The white arrows mark the magnified area on the right.
(i, j) Representative images of immunohistochemistry (i) and immunoblot for ADRP in mouse lung cancer tissue of the indicated genotype 10 weeks after Cre induction.
Graphical data are mean ± SD. Statistical analyses were done using two-tailed unpaired Student’s t test or one-way ANOVA. **** p < 0.0001. Statistical source data and unprocessed immunoblots are provided in Source Data Fig. 7.
QPCR analysis from dissected lung tumors evidenced that the expression of glycolysis-related genes such as aldolase c (Aldoc), enolase 2 (Eno2), glucose transporter type 1 (Glut1) and lactate dehydrogenase a (Ldha), were significantly higher in tumors of KrasG12D/WT;p53flox/flox;Plcγ1flox/flox mice compared to KrasG12D/WT;p53flox/flox;Plcγ1wt/wt (Fig. 7g). Moreover, tumor histological examination as well as IHC staining and immunoblot against a LD marker, adipose differentiation-related protein (ADRP), revealed that Plcγ1 deletion led to a significant increase in tumor LD accumulation (Fig. 7h-7j).
Overall, our results suggest that the suppression of PLCγ1 promotes KRAS-induced lung cancer.
Low PLCγ1 expression levels correlate with poor patient survival and high expression of hypoxia markers
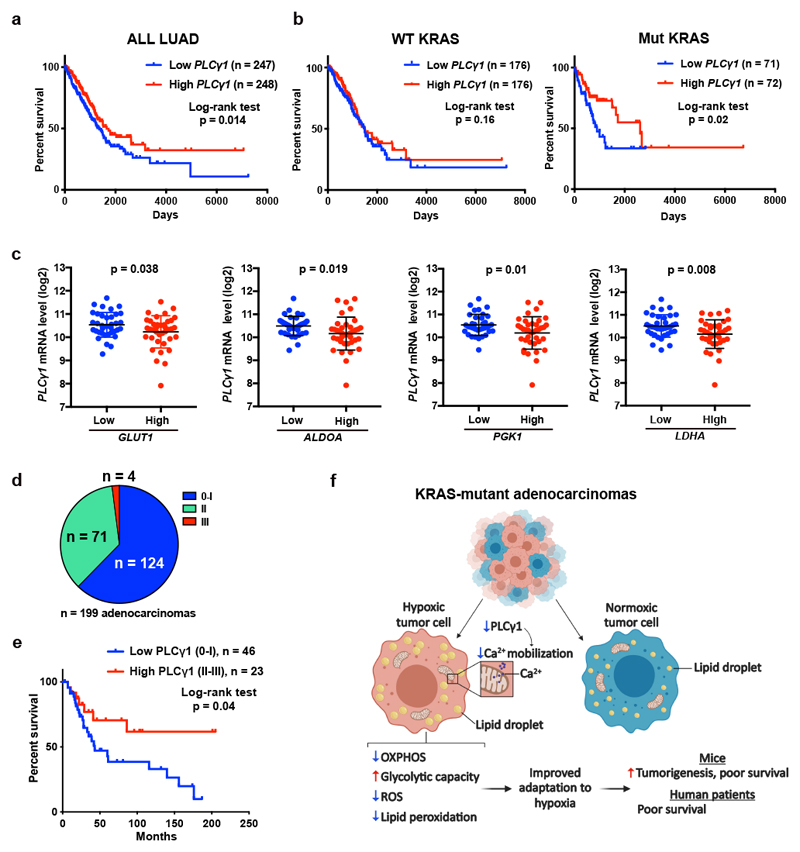
Kaplan-Meier analysis of human lung adenocarcinomas from The Cancer Genome Atlas (TCGA, subset LUAD)42 revealed that PLCγ1 expression positively correlates with patient overall survival (Fig. 8a). Notably, stratification of the LUAD cohort based on KRAS status into wild type- and mutant-KRAS evidenced that the shorter patient survival related to PLCγ1 expression level was due to the mutant KRAS cohort (Fig. 8b).
Figure 8. Low PLCγ1 levels in human lung adenocarcinomas correlate with poor patient survival.
(a, b) Kaplan-Meier analysis from The Cancer Genome Atlas (TCGA, subset LUAD) database containing 495 human lung adenocarcinomas showing the percent survival of PLCγ1-low versus PLCγ1-high lung adenocarcinomas, subset LUAD (a) and after separation of the LUAD cohort into wild type KRAS or mutant KRAS cohorts (b). The stratification in high/low expressing groups were performed by median separation. The number of patients and statistical significance is indicated. Statistical analyses were done using log-rank (Mantel-cox) test.
(c) Expression of PLCγ1 (log2) after quartile-based separation of the mutant KRAS patient cohort from (b) into GLUT1, ALDOA, PGK1 and LDHA low (n = 36) versus high (n = 37) expression corresponding to the first and the fourth quartile, respectively. The data are presented as mean ± SD. Statistical analyses were done using two-tailed unpaired Student’s t test.
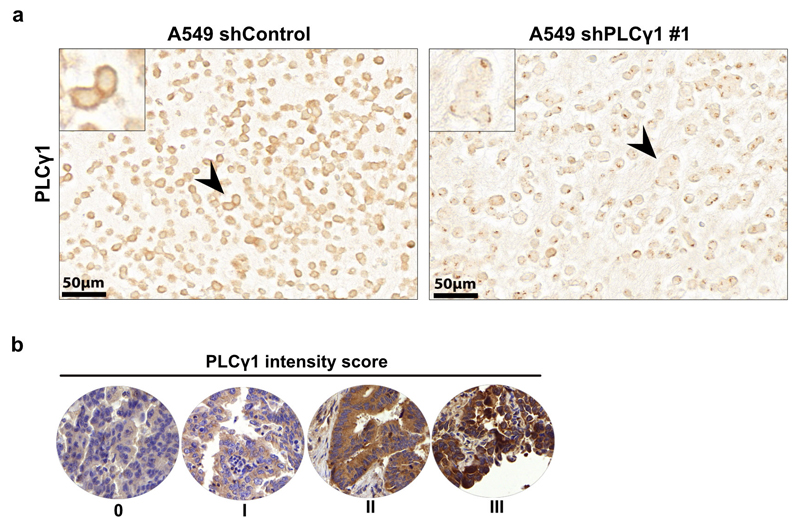
(d) Pie chart showing the number of patients with high PLCγ1 protein levels (score III; n = 4), moderate (score II; n = 71) or negative to very low (score 0-I; n = 124) from a tumor tissue microarray (TMA) comprising 199 human lung adenocarcinomas. The TMA was processed for IHC against total PLCγ1 and the staining intensity was scored by a pathologist. The validation of the antibody is reported in Extended Data Fig. 10a.
(e) Kaplan-Meier analysis showing the percent survival of PLCγ1-low versus PLCγ1-high lung adenocarcinomas for the patients with known survival information that succumbed to lung cancer (n = 23 PLCγ1-high and n = 46 PLCγ1-low) from the TMA described in (d). For the rest of the patients either complete survival information was not available or they succumbed to other causes. The number of patients and statistical significance is indicated. Statistical analysis was done using log-rank (Mantel-cox) test.
(f) Working model for the improved adaptation of cancer cells to hypoxia by PLCγ1 suppression. In hypoxia, PLCγ1 is suppressed leading to decreased Ca2+ entry into the mitochondria, decreased OXPHOS, ROS and lipid peroxidation while increases glycolysis.
N, number of patients. Statistical source data are provided in Source Data Fig. 8.
Low PLCγ1 expression levels in lung tumors of the mutant KRAS cohort was associated with high expression of several hypoxia markers implicated in glycolytic metabolism, such as GLUT1, aldolase A (ALDOA), phosphoglycerate kinase 1 (PGK1) and LDHA (Fig. 8c).
To assess PLCγ1 protein levels in human lung cancer, we performed IHC for PLCγ1 in a human lung adenocarcinoma tissue microarray and we found that, out of 199 samples, 124 samples were either negative or poorly stained for PLCγ1 (62% score 0-I), 71 showed moderate staining intensity (35%, score II) and only 4 samples (3%, score III) evidenced high PLCγ1 protein levels (Fig. 8d and Extended Data Fig. 10a, 10b). These data strongly indicate that the majority of human lung adenocarcinomas have very low PLCγ1 protein levels, providing additional significance to our findings. Remarkably, Kaplan-Meier analysis of these patient samples, stratified based on low (score 0-I) and high (score II-III) PLCγ1 protein levels, evidenced that low PLCγ1 protein levels are associated with poor patient survival (Fig. 8e).
Taken together, these results suggest that the level of PLCγ1 has a predictive value for the overall tumor resilience and patient survival.
Discussion
Hypoxia is a powerful driver of aggressive behavior in solid cancers and has been linked to metabolic reprogramming with suppression of mitochondrial respiration in favor of glycolysis43, 44. In KRAS-driven lung cancer, this metabolic adaptation to hypoxia has been extensively attributed to the effect of HIF1-dependent signalling and transcriptional regulation8. Here, we discovered that, in mutant KRAS-driven lung cancer, the suppression of mitochondrial respiration during hypoxia is highly dependent on PLCγ1 suppression; an effect linking changes of membrane phosphoinositide signalling with a decrease in mitochondrial Ca2+ and oxidative capacity (Fig. 8f).
Previous evidence revealed that in MEFs PLCγ1 attenuates H2O2-induced ROS in normoxia45. These data are in line with our results in normoxia showing that PLCγ1 suppression triggers ROS, while its re-expression reduces ROS. These results uncover a role of PLCγ1 in which, in normoxia, is required to prevent ROS by providing Ca2+ to maintain proper cellular and mitochondrial functionality, while in hypoxia, PLCγ1 must be suppressed to reduce mitochondrial Ca2+ and prevent damage.
Few reports suggest that PLCγ1 loss-of-function exerts anti-tumor actions in other solid cancer models such as breast, prostate and head and neck squamous cell carcinomas46–48. Furthermore, high PLCγ1 expression levels are associated with poor patient survival in hepatocellular carcinoma49. Thus, future studies are warranted to understand if the significance of our findings in cancer hypoxia and tumorigenesis is specific to mutant KRAS lung cancer or is broader.
The suppression of PLCγ1 causes a significant accumulation of LDs, an effect that is expected to exert additional antioxidant effects by reducing substrates for FAO (hence hindering ROS formation), and by directly preventing lipid peroxidation10, 50–52. Thus, it is tempting to speculate that the significance of PLCγ1 inhibition during hypoxia can be even greater in contexts during which ROS levels are strongly elevated in cancer cells, such as radiation treatment or chemotherapy53. Future investigation will be necessary to directly test whether PLCγ1 suppression underlies the therapy resistance of hypoxic tumors.
Methods
Reagents and plasmids
When indicated, knockdown of the protein of interest was induced by administration of 1 μg/ml doxycycline (Fisher Scientific, BP2653) in the culture medium. The rat pcDNA3.1-HA-LIC-PLCγ1 plasmid was a kind gift from Prof. John Sondek54 (UNC Center for Structural Biology, Chapel Hill, USA) and was used to transfect the MEFs. The human pcDNA3.1-PLCγ1 and the shRNA-resistant PLCγ1 (rPLCγ1) constructs that were used to trasfect human cells were custom made by Genscript. The pcDNA3.1-MCU-Flag was provided by Prof. Paolo Pinton55. For the xenograft experiment in Fig. 5g we moved the MCU-Flag from the pcDNA3.1-MCU-Flag into pWZL-Hygro using BamHI/EcoRI restriction sites to generate pWZL-Hygro-MCU-Flag. The tet-pLKO-puro was a gift from Prof. Dmitri Wiederschain (Addgene plasmid #21915)56. pLKO.1 puro (Addgene plasmid #8453), pCMV-VSV-G (Addgene plasmid #8454) and pCMV-dR8.2 dvpr (Addgene plasmid #8455) were a gift from Prof. Bob Weinberg57. pMSCVhygro-Cre was a gift from Prof. Kai Ge (Addgene plasmid #34565)58. The shRNAs were obtained from Sigma Aldrich and cloned into the Tet-pLKO-puro backbone plasmid after digestion with AgeI/ EcoRI. All the constructs were confirmed with sequencing.
Cell lines
The human lung adenocarcinoma cell lines used in this study (A549, H358 and A427) were derived from male patients and were a kind gift from Dr. John Minna (UT Southwestern Medical Center)59. HEK293T cells were obtained from ATCC (CRL-11268). All cell lines were DNA fingerprinted for provenance and tested negative for mycoplasma. Cells were cultured in an incubator at 37°C and 5% CO2 in RPMI-1640 medium or DMEM (HEK293T) containing 10% fetal bovine serum (Thermo Fisher), 100 I.U./mL penicillin and 100 μg/mL streptomycin (Gibco). Mouse embryonic fibroblasts (MEFs) were generated by crossing a KrasG12D/WT;p53flox/flox;Plcγ1wt/flox male mouse with a KrasG12D/WT;p53flox/flox;Plcγ1wt/flox female mouse. Concomitant KrasG12D/WT induction, p53 and, where applicable, Plcγ1 deletion was achieved by infection with pMSCV-hygro-Cre virus followed by selection with 150μg/ml Hygromycin.
Animal studies
Mice were maintained under a temperature of 21°C +/- 2°C, humidity 50% +/- 10% with a standard 12hr light/dark cycle and were fed ad libitum. Genotyping was performed using the KAPA HotStart Mouse Genotyping Kit (Kapa Biosystems, KK7352) and KAPA2G Fast HotStart Genotyping Mix (Kapa Biosystems, KK5621) respectively, according to the manufacturer’s instructions. The mice genotypes were confirmed following the corresponding JaxLab protocols. The PCR for the Plcγ1 genotyping was performed with an annealing temperature of 60°C. See the complete list of oligos used to genotype the mice in Supplementary Table 1.
For intratracheal injections, 2.5 x 10⁷ infectious particles of VVC-U of Iowa-5 Ad5CMVCre (Viral Vector Core, University of Iowa) were delivered to male mice at 8 weeks of age. Mice were sacrificed 10 weeks post induction and lungs were retrieved after anesthesia and perfusion. Tissue for histology was fixed overnight in 4% paraformaldehyde at 4°C before paraffin embedding. Tissue for western blot and mRNA analysis was snap frozen in liquid nitrogen.
For the xenotransplantation studies in vivo, 1 x 10⁶ MEF cells (KrasG12D/WT;p53flox/flox;Plcγ1wt/wt, KrasG12D/WT;p53flox/flox;Plcγ1wt/flox, KrasG12D/WT;p53flox/flox;Plcγ1flox/flox), or A549 cells were injected subcutaneously to male NOD.Cg-Prkdcscid Il2rgtm1Wjl/SzJ (NSG, stock number: 00555760, 61.) mice at 6-8 weeks of age. Doxycycline was provided in the water of the mice. The mice were closely monitored on a daily basis and the size of the tumors was measured with a caliper every 2-3 days. Mice were sacrificed when the tumor volume reached 1000mm3. To investigate tumor tissue hypoxia, mice were injected intraperitoneally with a Hypoxyprobe™-1 (pimonidazole HCl) solution (Hypoxyprobe™ Green Kit, HP6-200) at a dosage of 60 mg/kg body weight, 30 min prior to sacrificing. See the complete list of antibodies in Supplementary Table 1.
Mixed background LSL-KrasG12D/WT;p53flox/flox mice were generated by crossing stock B6.129SS4-krastm4Tyj/J (from JaxLab, Stock number 008179)26, with B6.129P2-Trp53tm1Brn/J (from JaxLab, Stock number 008462) mouse25. The mixed background Cre-inducible LSL-KrasG12D/WT;p53flox/flox;Plcγ1flox/flox mouse model was obtained by crossing LSL-KrasG12D/WT;p53flox/flox mice with B6(Cg)-Plcg1tm1Flh/J (Plcγ1 flox/flox) mice. The Plcγ1flox/flox mice were provided by Tina Schnöder and Florian Heidel, University of Jena, Germany. The LSL-KrasG12D/WT;p53flox/flox;Plcγ1flox/wt mice were backcrossed for eight generations, before creating the experimental groups. Only male littermates were used for the experiments. The study is compliant with all relevant ethical regulations regarding animal research. Experimental procedures were approved by the cantonal veterinary commission and animal welfare officer from the Veterinaerdienst de Kantons Bern.
shRNAs, virus production and transduction
Recombinant lentiviruses were produced by transfecting HEK 293T cells, using the TransIT®-293 Transfection Reagent (Mirus; MIR2705), with pCMV-VSV-G (VSV-G protein), pCMV-dR8.2 (lentivirus packaging vector) and lentiviral constructs, according to the manufacturer’s instructions. Retroviruses were produced by transfecting Ampho cells, using the TransIT®-293 Transfection Reagent, according to the manufacturer’s instructions. See complete list of shRNA sequences in Supplementary Table 1.
Reverse transcription and qPCR
RNA was extracted using the RNAeasy kit, QIAGEN, 74104) and cDNA was synthesized with the RevertAid First Strand cDNA Synthesis Kit (Thermo Scientific, K1622). QPCR was performed in 96 well plates (TreffLab) with FastSybr green (Thermo Scientific, 4367659). The normalization was performed with the ΔΔCT method. The full list of the oligonucleotides can be found in the Supplementary Table 1.
Immunohistochemistry
Immunohistochemistry was conducted on paraffin embedded tissue. All sections used for histological analysis were 5μm thick. Histological characterization and consequent scoring of neoplastic lesions grade of H&E stained sections of lungs were done with supervision and confirmation from a pathologist. Tumor burden was assessed by digital quantification of the area occupied by tumors compared to unaffected tissue using QuPath (open source software, v.0.1.2). Sections were deparaffinized, rehydrated through a graded series of alcohol and subjected to antigen retrieval by boiling for 10 min in antigen retrieval Sodium Citrate buffer (pH 6). Sections were then pretreated for 30 min with 3% hydrogen peroxide (Sigma-Aldrich, 216763) in PBS, washed twice with 0.1 M Tris-Buffered Saline (TBS), blocked for 1h in 2% Bovine Serum Albumin (BSA) in TBS containing 0.1% Polysorbate 20 (TBS-T), 10 min in 2.5% normal horse serum (Vector, S-2012) and incubated with primary antibodies diluted appropriately in blocking solution. The following day sections were washed in TBS-T, incubated with ready to use secondary antibody (Vector, MP-7401) for 1h, or with Mouse on Mouse (M.O.M.®) ImmPRESS® Peroxidase Polymer Anti-Mouse Reagent (Vector, MPX-2402) for 10 min and the staining was revealed with DAB+ solution (Dako, K3467). Tissue sections were then counterstained with Methyl Green (Vector Labs, H-3402), dehydrated and mounted. Apoptotic cells were stained with the DeadEnd Colorimetric TUNEL System (Promega, G7360), according to the manufacturer’s instructions. Stained sections were scanned using a Pannoramic Midi II digital slide scanner (3DHISTECH Ltd) and image analysis was performed using QuPath. See complete list of antibodies used for immunohistochemistry in Supplementary Table 1.
Human TMA staining and patient survival study
The patient-derived TMA and patient survival information was provided by the Institute of pathology, University of Bern and University hospital Basel. In the patient-derived TMA study were included only patients diagnosed with lung adenocarcinomas and only upon first surgical resection without prior treatment. The patients were of mixed age and sex and no selection was applied or any genotypic assessment (i.e. KRAS mutation status) was performed. The use of human samples was approved by the Swiss Association of Research Ethics Committees (Swissethics), Institute: Kantonal Ethikkommission for research. The study is compliant with all relevant ethical regulations regarding research involving human participants and all samples were provided upon patients consent. The full list of patient age and gender is reported in Supplementary Table 2.
TMA IHC staining was carried out using the automated system BOND RX® (Leica Biosystems, Newcastle, UK). All sections were deparaffinized and rehydrated using Dewax solution (Leica Biosystems) at 72 °C for 30 s. Endogenous peroxidase activity was blocked with 3% H2O2 solution (Leica Biosystems) for 5 min. Samples were incubated with the PLCγ1 primary antibody (santa cruz, sc-7290, clone) at RT for 30 min at a 1:200 dilution. The antigen retrieval was performed using Tris-EDTA buffer (pH 9) and citrate buffer (pH 6) at 95 °C for 30 min, respectively. The slides were incubated with the secondary antibody with the Bond Polymer Refine Kit (Leica Biosystems) for 15 min, incubated with the chromogen DAB (3-3′-diaminobenzidine) for 10 min, counterstained with hematoxylin for 5 min, and finally mounted with Aquatex® (Merck Millipore). The TMA was scored by a pathologist specialized in lung pathology (S. A. B.). The intensity of PLCγ1 staining was very homogeneous and stains were scored semi-quantitatively as scores 0–3 according to intensity. Scores 0–1 were considered negative to low and scores 2–3 were combined as high expression pattern.
Immunofluorescence
For immunofluorescence (IF), cells were washed, fixed in 4% paraformaldehyde for 15 min at room temperature. Cells were washed with PBS, permeabilized with PBS + 0.1% TritonX-100 for 5 min and blocked with 5% BSA in PBS for 1h at RT. Cells were then incubated with primary antibody diluted in 5% BSA in PBS for 2h-3h at RT. Primary antibody was detected with Alexa Fluor secondary antibody diluted 1:500 in PBS at RT for 1h in the dark. For IF conducted on paraffin embedded tissue, all stainings with primary antibodies were done after deparaffinization, rehydration through a graded series of alcohol, antigen retrieving by boiling for 10 min in Sodium Citrate buffer (pH 6) and blocking in 2% BSA in PBS-T buffer. Antibodies were diluted in blocking solution and incubation was at 4°C overnight. Secondary fluorescent-tagged antibodies were from molecular probes (Invitrogen). Stained cells and sections were scanned using a Pannoramic Midi II digital slide scanner (3DHISTECH Ltd).
RAS activity assay
For the detection of active RAS, 500μg of mouse protein lysate were used and the assay was performed with the Active Ras Detection Kit according to the manufacturer’s instructions (Cell Signaling Technology, #8821).
Immunoblotting
Cells were lysed in RIPA buffer (50mM Tris-HCl pH 8.0, 150mM NaCl, 1.0% NP-40, 0.5% sodium deoxycholate, 0.1% SDS) or NP40 buffer, to detect phosphorylated proteins (50mM Tris-HCl pH 8.0, 150mM NaCl, 1% NP-40) containing complete EDTA-free protease inhibitors (Roche) and 1mM PMSF. Samples were resolved by SDS-PAGE in Bio-Rad blotting chamber, transferred to nitrocellulose membrane using a semi-dry chamber (Bio Rad) and blocked in 5% BSA. Membranes were then incubated overnight at 4°C with primary antibody diluted in 5% BSA in TBS containing 0.1 % Tween. Secondary fluorescent-tagged antibodies were from Li-Cor biosciences and development was done in Li-Cor fluorescence-chemiluminescence detector. All antibodies and their dilutions are listed in the Supplementary Table 1.
Cell proliferation Assay
Cell proliferation was measured as previously described62. Briefly, cells were plated at low confluency in 24-wells plates (8000 cells/well for A549 and MEFs and 9000 cells/well for H358 and A427) and let proliferate for 2, 4 or 6 days. For the hypoxia experiments, cells were placed in hypoxia chamber (Whitley H35 HEPA hypoxystation). Cell viability was measured by crystal violet (Sigma Aldrich) staining (0.1% in 20% methanol) of adherent cells after 10 min fixation in 4% paraformaldehyde (Sigma Aldrich). After washing twice and air-drying, stained cells were de-colored with 10% acetic acid and OD600 was measured with a spectrophotometer.
Caspase-3 activity assay
Caspase-3 activity was determined using the EnzChek™ Caspase-3 Assay Kit #2 (Invitrogen, E13184). Knockdown was induced with doxycycline for 48h. Following this period, the cells were cultured for 4 days in normoxic or hypoxic conditions, as necessary. For every condition, the samples were run in triplicates, using 1 x 10⁶ cells/replicate. The assay was then performed according to the manufacturer’s instructions and the results were normalized to the protein content.
ROS, LD and Annexin V/PI measurement by flow cytometry
For every flow cytometry analysis, cells were gated according to their forward and side scatter values in order to exclude cell clusters (see Supplementary Fig. 1 for gating information). In the experiments where PLCγ1 was overexpressed, cells were transfected concomitantly with the start of the knockdown induction. Following this period, 4.5 x 10⁵ cells were plated and cultured for 24h in normoxia or hypoxia (1% O2, Whitley H35 HEPA Hypoxystation), as described in the related figure legends. To measure ROS levels, 1 x 10⁶ cells were resuspended in 1μM Dihydrorhodamine 123 (DHR) (Sigma-Aldrich, D1054) in PBS and incubated for 30 min at 37°C. To quench ROS, cells were treated with 10μM MitoTEMPO for 18h prior to staining. For LD measurement, 1 x 10⁶ cells were gently washed with PBS and fixed with 4% paraformaldehyde for 10 min at room temperature. After removing the fixative solution, cells were washed 2 times with PBS to remove residual paraformaldehyde and stained with 1X LipidTOX Deep Red Neutral Lipid Stain solution (Invitrogen, H34477) for 30 min. The cells were then washed with PBS, before performing the assay as previously described63. For the Annexin V/PI cell death assay, cells were plated at low confluency in a 12-well plate and treated as described in the figure legends. On the day of the assay, cells were washed with staining buffer (150mM NaCl, 4mM KCl, 2.5mM CaCl2, 1mM MgSO4, 15mM HEPES pH 7.2, 2% FBS and 10mM NaN3) and stained with Atto633-conjugated Annexin V for 20 min in the dark, on ice. Cells were then washed with staining buffer and resuspended in 200μL Propidium Iodide (PI) at a final concentration of 2μg/mL (MEFs), or 40μg/mL (A549). To inhibit caspase-induced cell death, cells were treated with 20 μM Q-VD-OPH 18h before staining. Flow cytometry was performed following a standard procedure with a FACS Lyric instrument (BD Biosciences). Data were analysed using the FlowJo V10 workspace.
Ca2+ measurements
Endoplasmic Reticulum aequorin (erAEQ), mitochondrial aequorin (mtAEQ) and cytosolic aequorin (CytAEQ) are the Ca2+-sensitive chimeric probes used to target ER, mitochondria and cytosol, respectively64. To reconstitute the erAEQmut with high efficiency, the luminal [Ca2+] of the ER first had to be reduced. This was achieved by incubating the cells for 1h at 4°C in krebs ringer buffer (KRB) supplemented with 5 μM coelenterazine, the Ca2+ ionophore ionomycin, and 600 μM EGTA. After this incubation, cells were extensively washed with KRB supplemented with 2% bovine serum albumin. For the experiments with cytAEQ and mtAEQ, cells were incubated with 5 μM coelenterazine for 1-2h in modified KRB supplemented with supplemented with 1 mM CaCl2. All aequorin measurements were carried out in KRB supplemented with either 1 mM CaCl2 (cytAEQ and mtAEQ) or 100μM EGTA (erAEQmut). Then the coverslip with transfected cells was placed in a perfused, thermostatic chamber located in the close proximity of a low noise photomultiplier, with a built-in amplifier-discriminator. Histamine 100 μM was added to medium as IP3-dependent agonist to induce ER Ca2+-release and consequent intracellular Ca2+ mobilization. The experiments were terminated by lysing the cells with 100 μM digitonin in a hypotonic Ca2+-containing solution (10 mM CaCl2 in H2O), thus discharging the remaining aequorin pool. The output of the discriminator was captured by a Thorn-EMI photon counting board for analyses. The aequorin luminescence data were calibrated off-line into [Ca2+] values, using a computer algorithm based on the Ca2+ response curve of wt and mutant aequorins64. The rate of ER-Ca2+ release was calculated as second derivative of released [Ca2+]er from ER during agonist stimulation.
LD imaging
For imaging LDs and lipid peroxidation, 2 x 10⁴ cells were plated on coverslips in 24-well plates. For LDs staining, cells were washed twice with PBS and fixed with 4% paraformaldehyde for 10 min at room temperature. After removing the fixative solution, cells were rinsed gently 2-3 times with PBS to remove residual paraformaldehyde and stained with 1X HCS LipidTOX Deep Red Neutral Lipid Stain solution (Invitrogen, H34477) for at least 30 min before imaging. For the lipid peroxidation detection, live cells were incubated with 500nM BODIPY™ 581/591 C11 (Invitrogen, D3861) for 30 min at 37°C. The cells were then washed 3 times with PBS, before imaging.
Fatty acid oxidation assay
β-oxidation of fatty acids was measured as previously described65. Briefly, we plated 30 x 104 cells in 6-well plates and 18h later, we incubated the cells with medium supplemented with [9, 10-3H]-palmitate (Hartmann Analytic GmbH, 1 mCi/mL) bound to 10% fatty acid free bovine serum albumin (Sigma). A total of 3.3 μl of [9, 10-3H]-palmitate and 6.7 μl of fatty acid free bovine serum albumin were used per 1 ml of cell culture medium and cultured for 24 h. After 24 h, supernatant was applied to ion-exchange columns (Dowex 1X8–200, Sigma), and tritiated water was recovered by eluting with 0.5 ml of H2O. A 100μl aliquot was then mixed with 100μl of liquid scintillation cocktail and measured the amount of radioactivity released with a Top count NXT liquid scintillation counter (Packard) in 96-well polystyrene plates (Nunc F96 microwell, Thermo). β-oxidation was expressed as counts per minute (CPM) per milligram of protein.
Ultra-performance liquid chromatography - tandem mass spectrometry
Sample processing
2 x 10⁶ cells were washed twice with PBS and incubated with 0.5M trichloroacetic acid (TCA) for 5 min on ice. Cells were then scraped from the dish, vortexed for 30 sec and further incubated on ice for 5 min. The TCA-treated samples were centrifuged at 20000 x g for 3 min at 4°C. After discarding the supernatant, the pellet was resuspended in 1mL of 5% (w/v) TCA + 10mM EDTA and centrifuged at 20000 x g for 3 min at 4°C. After repeating the same step once, the pellet was used for the lipid extraction.
Lipid Extraction
Prior to lipid extraction the following lipid analytical internal standards were added to the TCA precipitates: 17:0-20:4 PI(4,5)P2, 17:0-20:4 PI(3,4,5)P3, 17:0-20:4 PIP. Lipids were extracted using a modification of an acidified chloroform-methanol extraction protocol. It was initiated by adding 670 μL of chloroform:methanol:12N HCl (40:80:1) to the TCA precipitate followed by vigorous vortexing for 5 min and incubation for 10 min at 4°C. Then 650 μL of ice-cold chloroform was added and the samples were vortexed for another 2 min and allowed to sit for 5 min at 4°C after which 300 μL of ice cold 1M HCl was added. The samples were vortexed for 2 min, centrifuged at 10,000 g for 2 min and the lower phase was then collected in a fresh 2 mL microcentrifuge tube. Ice cold theoretical lower phase (900ul) generated by combining chloroform:methanol:1.74M HCl mixture (86:14:1,v/v/v) was added to the upper phase and the mixture was vortexed and centrifuged. The lower phase was then combined with the previously collected lower phase and dried under a stream of N2 and subsequently methylated as described previously66.
Mass Spectroscopy
LC/MS was carried out essentially as described previously66.
Mass Spectroscopy Analysis and Normalization
Peak areas for acyl-chain specific lipid species and standards were quantified by integrating mass spectroscopy curves as previously described66. The peak areas were normalized to the peak area of the corresponding synthetic lipid standard. Experimenters were blinded during data analysis.
OCR and ECAR measurement
Extracellular flux analysis of tumor cells in hypoxia was performed using the Agilent Seahorse XFe96 Analyzer placed inside the hypoxia chamber (Whitley H35 HEPA hypoxystation) stabilized at 3% O2. Agilent recommends performing hypoxic assays in a ≥3 % ambient O2 environment to prevent a potential O2 exhaustion and development of anoxic conditions within the micro-chamber during the assay. In all experiments, cells were incubated in normoxia or hypoxia (3% O2) for 24h, splitted and 4.2 x 10⁴ A549 cells, or 1 x 10⁴ MEF cells were seeded on Seahorse 96-well plates and incubated for additional 24h in normoxia or hypoxia before seahorse experiment. Oxygen consumption rate (OCR) was determined during sequential treatments with oligomycin (2 μM, Sigma Aldrich, O4876), FCCP (1.5 μM, Abcam, ab120081) and rotenone/antimycin (1 μM, Sigma Aldrich, R8875, A8674), while extracellular acidification rate (ECAR) was determined during sequential treatments with glucose (10mM), oligomycin and 2 Deoxy-Glucose (2DG, 100 mM, Sigma Aldrich, D3179) at the indicated time as shown in the related figure legends. To calculate the glycolysis and respiration parameters for each sample, the last OCR and ECAR readings obtained for each well after the injection of glucose, oligomycin, or rotenone + antimycin were used. However, to correctly reflect the phenotype of the mutant cell lines, the average of several determinations of the FCCP-induced OCRs and ECARs of each well was used as a basis for calculating the stressed glycolysis and OXPHOS activity. The final readings were normalized to the cell number.
TCGA data analysis
The Cancer Genome Atlas (TCGA) lung adenocarcinoma (dataset LUAD) dataset was retrieved from the Genomic Data Commons Portal. The data were downloaded with the help of the web graphic user interface Xena browser https://xenabrowser.net. and analyzed with GraphPad Prism version 7.0. Incomplete data, missing expression values and/or survival were eliminated from the analysis and only primary tumors were considered.
Quantifications and statistical analysis
Statistics and Reproducibility
All data sets were organized and analyzed in Microsoft excel 2016 and GraphPad Prism version 7.0.0 (GraphPad Software, San Diego, California USA, www.graphpad.com). All data presented are expressed as mean ± SD (unless indicated in the figure legends) of 3 or more biologically independent replicates/group (the specific number is indicated in the related figure legends). All graphical in vitro data report 1 representative experiment from experiments performed independently at least 3 times (except for the MS-based lipidomics that was performed twice) with similar results. The significance of the results was determined employing two-tailed unpaired Student’s t test (when comparing two groups) or one-way ANOVA Tukey’s correction for multiple comparisons (when more than two groups were compared) and significance is indicated in the related figure legends. For the cell proliferation data only the figure-relevant statistical differences are represented. No outliers were found in any dataset and no animals or data were excluded from statistical analysis.
Colocalization analysis
The analyses were performed using the Imaris Studio Software (www.bitplane.com). In order to exclude false positivity due to the background of the green channel, a first mask was set on it, with a threshold value of “1” for bright intensity. The analyses were run with the Imaris CoLoc tool and the results are the average of at least 15 pictures per condition. For the oxidized lipids analysis, the co-localization of the green channel (oxidized lipids) and the red channel (non-oxidized lipids) was assessed with automatic thresholding (CoLoc - > auto thresholds). For the co-localization of pPLCγ1Tyr783 or PLCγ1 and pimonidazole, sections were scanned in automatic mode with a slide scanner and were used to score for the hypoxic vs non-hypoxic tumor areas without modifying the laser power and gain of the detector.
Extended Data
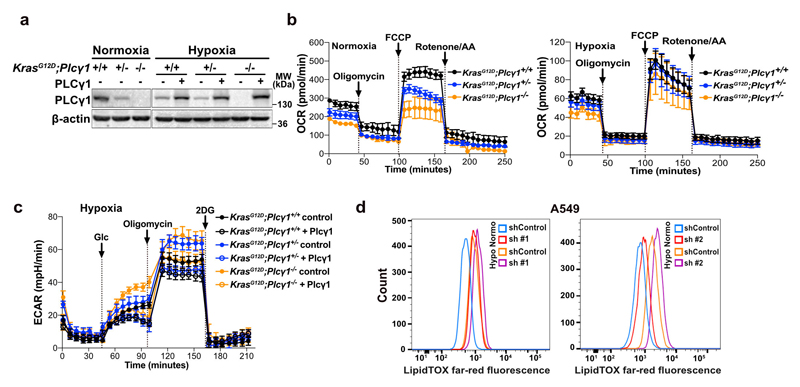
Extended Data Fig. 1. Hypoxia suppresses PLCγ1 and alters the fatty acid composition of phosphoinositides.
(a-d) Total PI (a), PI4P (b), PI(4,5)P2 (c) and PI(3,4,5)P3 (d) peak areas of A549 cells in normoxia and upon shift to hypoxia (1% O2) for 48h measured by ultra-performance liquid chromatography - tandem mass spectrometry; n = 4/group.
(e) Schematic representation of phosphoinositol signalling and the metabolic fate of PI(4,5)P2. PM: plasma membrane. PI: phosphatidylinositol, PI4P: phosphatidylinositol-4-phosphate, PtdIns(4,5)P2: phosphatidylinositol-4,5-biphosphate, PI(3,4,5)P3: phosphatidylinositol-3,4,5-trisphosphate.
(f) HIF1a mRNA expression level in A549 cells (relative to normoxia control at 24h). Cells were transduced with either an empty vector (Tet-pLKO-puro, shControl) or a doxycycline-inducible shRNA against HIF1α and incubated in normoxia or hypoxia for the indicated time; n = 3.
(g) Heatmap display of PI(4,5)P2 lipid alterations (fold change). A549 cells were transduced with either an empty vector control (Tet-pLKO-puro, shControl) or a doxycycline-inducible shRNA against PLCγ1, treated with doxycycline for 48h and treated as in (a); n = 4/group.
(h) Peak areas of the indicated PI(4,5)P2 lipid species in A549 cells from (g); n = 4/group.
(i) Total PI(4,5)P2 peak areas in A549 cells treated as in (g); n = 4/group.
All graphical data are presented as mean ± SD. Statistical analyses were done using two-tailed unpaired Student’s t test or one-way ANOVA; n, number of biologically independent samples. * p < 0.05, ** p < 0.01, *** p < 0.001, **** p < 0.0001. Statistical source data are provided in Source Data Extended Data Fig. 1.
Extended Data Fig. 2. PLCγ1 suppression promotes cancer cell proliferation during hypoxia.
(a) Immunoblot analysis of the indicated targets in H358 and A427 cells transduced with either an empty vector control (Tet-pLKO-puro, shControl) or 2 doxycycline-inducible shRNAs against PLCγ1. Cells were incubated in the presence of doxycycline for 72h in normoxia before performing the immunoblot analysis.
(b, c) Relative cell number of A549, H358 and A427 cells transduced with either an empty vector control (Tet-pLKO-puro, shControl), or a doxycycline-inducible shRNA against PLCγ1 (as indicated). After this, cells were plated and incubated for the indicated time in normoxia or hypoxia; n = 3.
(d) Immunoblot analysis of the indicated targets in A549 cells transduced as in (b). Cells were then incubated in the presence of doxycycline and transfected with either pcDNA3.1 empty vector or pcDNA3.1-rPLCγ1 (shRNA-resistant PLCγ1) and incubated for 72h in normoxia or hypoxia.
(e) Immunoblot analysis of the indicated targets in A549 cells transduced as in (a).
(f, g) Immunoblot analysis of the indicated targets (f) and cell proliferation assay (g) of A549 cells treated as indicated in normoxia or hypoxia; n = 3.
All graphical data are presented as mean ± SD. Statistical analyses were done using one-way ANOVA; n, number of biologically independent samples. **** p < 0.0001. Statistical source data and unprocessed immunoblots are provided in Source Data Extended Data Fig. 2.
Extended Data Fig. 3. PLCγ1 suppression promotes cancer cell survival during hypoxia.
(a) Representative panels of Annexin V-Atto 633/Propidium iodide (PI) flow cytometry analysis (left) and relative quantification of Annexin V (AV) + Annexin V/PI (AV/PI)-positive cells (right) in A549 cells transduced with either an empty vector control (Tet-pLKO-puro, shControl) or a doxycycline-inducible shRNA against PLCγ1, incubated without/with doxycycline for 48h and moved in normoxia or hypoxia for 72h; n = 3.
(b) Caspase-3 activity assay in A549 cells transduced as in (a). Cells were then transfected with either pcDNA3.1 empty vector or pcDNA3.1-rPLCγ1 (shRNA-resistant PLCγ1), and incubated in normoxia or hypoxia for 48h. Staurosporine (STA, 100nM) is positive control of caspase-dependent death; n = 3.
(c) Quantification of Annexin V (AV) + Annexin V/PI (AV/PI)-positive cells by flow cytometry in A549 cells transduced as in (a). Cells were then treated with Q-VD-OPH (QVD), a pan-caspase inhibitor for 24h; n = 3.
(d) Representative panels of Annexin V-Atto 633/Propidium iodide (PI) flow cytometry analysis (left) and relative quantification of Annexin V (AV) + Annexin V/PI (AV/PI)-positive cells (right) in A549 cells transduced with either pcDNA3.1 empty vector or pcDNA3.1-PLCγ1 and incubated in hypoxia for 72h; n = 3.
(e) Immunoblot analysis of the indicated targets in MEF cells with the indicated genotype in normoxia or hypoxia. The samples derive from the same experiment and the gel/blot were processed in parallel.
(f) Representative panels of Annexin V-Atto 633/Propidium iodide (PI) flow cytometry analysis of MEF cells with the indicated genotype.
Graphical data are mean ± SD. Statistical analyses were done using two-tailed unpaired Student’s t test or one-way ANOVA; n, number of biologically independent samples. **** p < 0.0001. Statistical source data and unprocessed immunoblots are provided in Source Data Extended Data Fig. 3.
Extended Data Fig. 4. PLCγ1 suppression decreases mitochondrial respiration and enhances cancer cell glycolytic capacity in human NSCLC cells.
(a) Immunoblot analysis of the indicated targets in A549 cells transduced with either an empty vector control (Tet-pLKO-puro, shControl) or a doxycycline-inducible shRNA against PLCγ1, incubated without/with doxycycline for 48h and further incubated for 48h in normoxia or hypoxia (3% O2).
(b-e) Graphs showing oxygen consumption rate (OCR, b and c) and extracellular acidification rate (ECAR, d and e) of A549 cells transduced and treated as in (a); n replicates/group: (b) = 8, (c) = 7 normoxia/8 hypoxia, (d) = 9 normoxia/ 8 hypoxia, (e) = 8. Panels (c and e) are treated without/with doxycycline and serve as a control for the doxycycline effect on cells.
(f) Bar graph showing ECAR parameters in A549 cells transduced as in (a). Cells were transfected with either pcDNA3.1 empty vector or pcDNA3.1-rPLCγ1 (shRNA-resistant PLCγ1) to rescue the shPLCγ1 #2 and incubated for 48h in normoxia or hypoxia; n = 8.
(g-h) Oxygen consumption rate (g) and extracellular acidification rate (h) parameters of A549 cells transfected with either pcDNA3.1 empty vector or pcDNA3.1-PLCγ1 and incubated for 48h in normoxia or hypoxia; (g) n = 8 for normoxia and 6 for hypoxia groups, (h) n = 7.
OCR was determined during sequential treatments with oligomycin, FCCP and rotenone/antimycin (AA). ECAR was determined during sequential treatments with glucose (Glc), oligomycin and 2 deoxyglucose (2DG).
Graphical data are mean ± SD. Statistical analyses were done using one-way ANOVA; n, number of biologically independent samples. **** p < 0.0001. Statistical source data and unprocessed immunoblots are provided in Source Data Extended Data Fig. 4.
Extended Data Fig. 5. PLCγ1 suppression decreases mitochondrial respiration and enhances cancer cell glycolytic capacity in MEFs.
(a) Immunoblot analysis of the indicated targets in MEF cells with the indicated genotype transfected with either pcDNA3.1-HA-LIC empty vector or pcDNA3.1-HA-LIC-PLCγ1. 24h later, cells were moved in hypoxia (3% O2) and incubated for additional 48h.
(b) Oxygen consumption rate (OCR) graph of MEF cells of the indicated genotypes. Cells were incubated for 48h in normoxia or hypoxia (3% O2) before seahorse experiment. OCR was determined during sequential treatments (indicated with arrows) with oligomycin, FCCP and rotenone/antimycin (AA) at the indicated time; n = 3 for the normoxia groups and n = 6 for the hypoxia groups.
(c) Graph showing extracellular acidification rate (ECAR) of MEF cells with the indicated genotype transduced as in (a). ECAR was determined during sequential treatments (indicated with arrows) with glucose (Glc), oligomycin and 2 deoxyglucose (2DG) at the indicated time; n = 6.
(d) Flow cytometry panels showing mean fluorescent intensity of A549 cells from experiment reported in main Fig. 3i. A549 cells were previously transduced with either an empty vector control (Tet-pLKO-puro, shControl) or 2 different doxycycline-inducible shRNAs against PLCγ1 (shPLCγ1 #1, shPLCγ1 #2), incubated in the presence of doxycycline for 48h, incubated for additional 48h in normoxia or hypoxia (1% O2), stained with LipidTOX and analyzed by flow cytometry. Sh#1: shPLCγ1 #1, Sh#2: shPLCγ1 #2; n = 3.
Graphical data are mean ± SD; n, number of biologically independent samples. Statistical source data and unprocessed immunoblots are provided in Source Data Extended Data Fig. 5.
Extended Data Fig. 6. PLCγ1 suppression depletes mitochondrial ROS through impairment of Ca2+ entry into the mitochondria.
(a) Flow cytometry histograms (left) and quantification of DHR (green, right) of A549 cells transduced with an empty vector (Tet-pLKO-puro, shControl) and incubated without/with doxycycline (DOX) for 48h, incubated for additional 48h in normoxia or hypoxia and stained with DHR for flow-cytometry. H2O2: positive control. DHR: Dihydrorhodamine. Normo: normoxia. Hypo: hypoxia. n = 3.
(b) MCU mRNA levels in A549 cells transduced with an empty vector (Tet-pLKO-puro, shControl) or 2 doxycycline-inducible shRNAs against MCU and incubated with doxycycline for 72h; n = 3.
(c) Immunoblot analysis of the indicated targets in A549 cells transduced with an empty vector (Tet-pLKO-puro, shControl) or 2 doxycycline-inducible shRNA against PLCγ1, transfected with either pcDNA3.1 empty vector or pcDNA3.1-MCU-flag plasmid and incubated in normoxia or hypoxia for 48h.
(d) Representative flow cytometry histograms of DHR (green) mean fluorescent intensity of A549 cells from experiment reported in main Fig. 4f. Sh#2: shPLCγ1 #2.
(e) Representative flow cytometry histograms (left) and quantification of DHR (green) of A549 cells transduced with an empty vector (Tet-pLKO-puro, shControl) or a doxycycline-inducible shRNA against PLCγ1. Cells were then treated with doxycycline for 24h, transfected with either pcDNA3.1 empty vector or pcDNA3.1-MCU-flag plasmid and moved to hypoxia for additional 48h before staining cells with DHR for analysis. DHR: Dihydrorhodamine. Sh#1: shPLCγ1 #1; n = 3.
(f) Cytosolic (left) and mitochondrial (right) Ca2+ response of A549 cells transduced as in (c), transfected with appropriate targeted-aequorin and histamine-induced Ca2+ was measured 48h after incubation in normoxia or hypoxia; n/group = cytosolic normoxia 7, 8, 7, 7, 8, 7/cytosolic hypoxia 8, 6, 7, 8, 7, 8. n/group = mitochondrial normoxia 11, 7, 9, 10, 8, 6/mitochondrial hypoxia 7, 10, 9, 9, 9, 11.
Graphical data are mean ± SD. Statistical analyses were done using one-way ANOVA; n, number of biologically independent samples. **** p < 0.0001. Statistical source data and unprocessed immunoblots are provided in Source Data Extended Data Fig. 6.
Extended Data Fig. 7. PLCγ1 suppression enhances cell proliferation and decreases cell death in hypoxia through impairment of Ca2+ entry into the mitochondria.
(a) Immunoblot analysis of the indicated targets in MEFs generated from a LSL-KrasG12D/WT;p53flox/flox;Plcγ1wt/wt and LSL-KrasG12D/WT;p53flox/flox;Plcγ1flox/flox mouse model, stably transduced with Cre recombinase (pMSCV-hygro-Cre) and transfected with either pcDNA3.1 empty vector or pcDNA3.1- MCU-flag plasmid and moved to hypoxia (1% O2) for additional 48h.
(b, c) Oxygen consumption rate (b) and extracellular acidification rate (c) of A549 cells transduced with either an empty vector (Tet-pLKO-puro, shControl) or a doxycycline-inducible shRNA against PLCγ1, treated with doxycycline for 24h, transfected with either pcDNA3.1 empty vector or pcDNA3.1-MCU-flag plasmid and incubated for 48h in hypoxia (3% O2). OCR was determined during sequential treatments (indicated with arrows) with oligomycin, FCCP and rotenone/antimycin (AA) at the indicated time. ECAR was determined during sequential treatments (indicated with arrows) with glucose (Glc), oligomycin and 2 deoxyglucose (2DG) at the indicated time; n = 5.
(d) Fatty acid β-oxidation of A549 cells transduced and treated as in (b); n = 4.
(e) Relative cell number of A549 cells transduced and treated as in (b); n = 3. Normoxia: * p = 0.03, hypoxia: * p = 0.014, *** p = 0.0005.
(f) Representative Annexin V-Atto 633/Propidium iodide (PI) flow cytometry analysis panels of A549 cells from experiment reported in main Fig. 5e; n = 3.
(g) Representative Annexin V-Atto 633/Propidium iodide (PI) flow cytometry analysis panels of MEF cells from experiment reported in main Fig. 5f; n = 3.
Graphical data are mean ± SD. Statistical analyses were done using one-way ANOVA; n, number of biologically independent samples. **** p < 0.0001. Statistical source data and unprocessed immunoblots are provided in Source Data Extended Data Fig. 7.
Extended Data Fig. 8. PLCγ1 suppression reduces hypoxia-induced lipid peroxidation.
(a) Confocal microscopy of A549 cells transduced with either an empty vector (Tet-pLKO-puro, shControl) or a doxycycline-inducible shRNA against PLCγ1 (shPLCγ1 #1) and incubated in the presence of doxycycline for 48h. Cells were then incubated for 48h in normoxia or hypoxia (1% O2), stained with BODIPY 581/591 C11 (green: oxidized lipids / red: non-oxidized lipids), LipidTOX (grey) to mark lipid droplets and Hoechst (nuclei). White squares represent magnified areas on the right. Scale bars: 20 μm.
(b) Quantification of lipid peroxidation expressed as percent of oxidized lipids from (a); n/group = 13, 13, 12, 14.
(c) Quantification of oxidized lipids, expressed as percent, localized in lipid droplets from (a); n/group = 13, 13, 13, 14.
(d) Relative cell number of A549 (left) and H358 (right) cells transduced with either an empty vector (Tet-pLKO-puro, shControl) or a doxycycline-inducible shRNA against PLCγ1 (shPLCγ1 #1), incubated with doxycycline for 48h and treated as indicated with the DGAT1 inhibitor (T863). The graphs represent day 6 of the cell proliferation assay; n = 3.
(e) Lipid droplet quantification (relative to control) of A549 and H358 cells treated as in (d), stained with LipidTOX (far red) and analyzed by flow cytometry; n = 3. Graphical data are mean ± SD except the panels b and c that are mean ± SEM. Statistical analyses were done using one-way ANOVA; n, number of biologically independent samples. **** p < 0.0001. Statistical source data are provided in Source Data Extended Data Fig. 8.
Extended Data Fig. 9. PLCγ1 deletion accelerates lung tumorigenesis in mice.
(a) Representative hematoxylin & eosin (H&E) staining of LSL-KrasG12D/WT;p53flox/flox;Plcγ1wt/wt, LSL-KrasG12D/WT;p53flox/flox;Plcγ1wt/flox and LSL-KrasG12D/WT;p53flox/flox;Plcγ1flox/flox mouse lung sections, 10 weeks after Cre induction. Scale bar: 5000μm.
(b) Representative immunohistochemistry images showing Ki67-positive cell staining in mouse lung tumors from LSL-KrasG12D/WT;p53flox/flox;Plcγ1wt/wt, KrasG12D/WT;p53flox/flox;Plcγ1wt/flox and LSL-KrasG12D/WT;p53flox/flox;Plcγ1flox/flox mice 10 weeks after Cre induction. This is related to main Fig. 7e.
Extended Data Fig. 10. Low PLCγ1 levels in human lung adenocarcinomas correlate with poor patient survival.
(a) Antibody validation for IHC against PLCγ1 on human tumor tissue microarray. A549 cells previously transduced with either an empty vector (Tet-pLKO-puro, shControl) or a doxycycline-inducible shRNA against PLCγ1 (shPLCγ1 #1) and incubated in the presence of doxycycline for 48h before paraffin embedding. Subsequently IHC was performed as for TMA staining (described in materials and methods).
(b) Representative images of the human lung adenocarcinoma TMA showing the staining intensity with the matched scoring by the pathologist upon immunohistochemistry against PLCγ1. Score 0-I was considered low staining intensity, II was considered moderate and score III was considered high staining intensity.
Supplementary Material
Acknowledgments
The authors wish to thank Prof. John Sondek for providing the rat PLCγ1 plasmid (UNC Center for Structural Biology, Chapel Hill, USA). The NSCLC cell lines were a kindly provided from Prof John D. Minna (UTSW medical center, USA). We thank Dr. Alexis Traynor-Kaplan (University of Washington, USA) for help with MS analysis. We thank Dr. Giorgio Ramadori (University of Geneva, Switzerland) for critically reading the manuscript. This study was supported by the German Research Council (DFG), (HE6233/4-1 to F.H.H. and SCHN15561-1 to T.M.S.), the Thuringian state program ProExzellenz (RegenerAging-FSU-I-03/14) of the Thuringian Ministry for Research (TMWWDG) (to F.H.H.), local funds from the University of Ferrara, FIR-2017, the Italian Ministry of Health (GR-2016-02364602) and the Italian Ministry of Education, University and Research (PRIN Grant 2017XA5J5N) (to A.R.), the Italian Association for Cancer Research (AIRC, IG-18624), Telethon (GGP11139B), the Italian Ministry of Education, University and Research (PRIN Grant 2017E5L5P3), local funds from the University of Ferrara (to P.P.) and the Swiss National Science Foundation (#PP00P3_163929) Professorship (to G.K.).
Footnotes
Author Contributions
Experiments were conceived and designed by G. K. and M. S. M. S., M. R. S., C. P., G. K., performed and analyzed the data. F. H. H. and T. M. S. generated and provided the Plcγ1fl/fl mice. S. S. P., L. B., S. A. B. (pathologists) and R. S. (surgeon) provided the human lung tissue samples and the PLCγ1 staining grading was done by S. A. B. A. R. and P. P. performed Ca2+ measurements. J. B., S. F. performed the seahorse experiments. G. K. supervised the study. G. K. and M. S. wrote the manuscript.
Competing Interests statement
The authors declare no competing interests.
Data availability
All Source Data for Figs. 1–8 and Extended Data Figs. 1–10 are included in this published article (and in its Extended Data Source Data files 1-10, Supplementary Figure 1 and Tables 1 and 2). Requests to use the PLCγ1 floxed mice will be redirected to Florian H. Heidel and Tina M. Schnöder. The Cancer Genome Atlas (TCGA) lung adenocarcinoma (LUAD) dataset was retrieved from the Genomic Data Commons Portal: http://cancergenome.nih.gov. The data were downloaded with the help of the web graphic user interface Xena browser https://xenabrowser.net.
References
- 1.Thomlinson RH, Gray LH. The histological structure of some human lung cancers and the possible implications for radiotherapy. Br J Cancer. 1955;9:539–549. doi: 10.1038/bjc.1955.55. [DOI] [PMC free article] [PubMed] [Google Scholar]
- 2.Brown JM, Wilson WR. Exploiting tumour hypoxia in cancer treatment. Nat Rev Cancer. 2004;4:437–447. doi: 10.1038/nrc1367. [DOI] [PubMed] [Google Scholar]
- 3.Bhandari V, et al. Molecular landmarks of tumor hypoxia across cancer types. Nat Genet. 2019;51:308–318. doi: 10.1038/s41588-018-0318-2. [DOI] [PubMed] [Google Scholar]
- 4.Kamphorst JJ, et al. Hypoxic and Ras-transformed cells support growth by scavenging unsaturated fatty acids from lysophospholipids. Proc Natl Acad Sci U S A. 2013;110:8882–8887. doi: 10.1073/pnas.1307237110. [DOI] [PMC free article] [PubMed] [Google Scholar]
- 5.Bensaad K, et al. Fatty acid uptake and lipid storage induced by HIF-1alpha contribute to cell growth and survival after hypoxia-reoxygenation. Cell Rep. 2014;9:349–365. doi: 10.1016/j.celrep.2014.08.056. [DOI] [PubMed] [Google Scholar]
- 6.Botto L, et al. Hypoxia-induced modifications in plasma membranes and lipid microdomains in A549 cells and primary human alveolar cells. J Cell Biochem. 2008;105:503–513. doi: 10.1002/jcb.21850. [DOI] [PubMed] [Google Scholar]
- 7.Huang, et al. HIF-1-mediated suppression of acyl-CoA dehydrogenases and fatty acid oxidation is critical for cancer progression. Cell Rep. 2014;8:1930–1942. doi: 10.1016/j.celrep.2014.08.028. [DOI] [PubMed] [Google Scholar]
- 8.Semenza GL. HIF-1 mediates metabolic responses to intratumoral hypoxia and oncogenic mutations. J Clin Invest. 2013;123:3664–3671. doi: 10.1172/JCI67230. [DOI] [PMC free article] [PubMed] [Google Scholar]
- 9.Listenberger LL, et al. Triglyceride accumulation protects against fatty acid-induced lipotoxicity. Proc Natl Acad Sci U S A. 2003;100:3077–3082. doi: 10.1073/pnas.0630588100. [DOI] [PMC free article] [PubMed] [Google Scholar]
- 10.Bailey AP, et al. Antioxidant Role for Lipid Droplets in a Stem Cell Niche of Drosophila. Cell. 2015;163:340–353. doi: 10.1016/j.cell.2015.09.020. [DOI] [PMC free article] [PubMed] [Google Scholar]
- 11.D’Souza K, Epand RM. Enrichment of phosphatidylinositols with specific acyl chains. Biochim Biophys Acta. 2014;1838:1501–1508. doi: 10.1016/j.bbamem.2013.10.003. [DOI] [PubMed] [Google Scholar]
- 12.Wymann MP, Schneiter R. Lipid signalling in disease. Nat Rev Mol Cell Biol. 2008;9:162–176. doi: 10.1038/nrm2335. [DOI] [PubMed] [Google Scholar]
- 13.Balla T. Phosphoinositides: tiny lipids with giant impact on cell regulation. Physiol Rev. 2013;93:1019–1137. doi: 10.1152/physrev.00028.2012. [DOI] [PMC free article] [PubMed] [Google Scholar]
- 14.Saliakoura M, et al. The ACSL3-LPIAT1 signaling drives prostaglandin synthesis in non-small cell lung cancer. Oncogene. 2020 doi: 10.1038/s41388-020-1196-5. [DOI] [PMC free article] [PubMed] [Google Scholar]
- 15.Bunney TD, Katan M. Phosphoinositide signalling in cancer: beyond PI3K and PTEN. Nat Rev Cancer. 2010;10:342–352. doi: 10.1038/nrc2842. [DOI] [PubMed] [Google Scholar]
- 16.Schramp M, Hedman A, Li W, Tan X, Anderson R. PIP kinases from the cell membrane to the nucleus. Subcell Biochem. 2012;58:25–59. doi: 10.1007/978-94-007-3012-0_2. [DOI] [PubMed] [Google Scholar]
- 17.Koss H, Bunney TD, Behjati S, Katan M. Dysfunction of phospholipase Cgamma in immune disorders and cancer. Trends Biochem Sci. 2014;39:603–611. doi: 10.1016/j.tibs.2014.09.004. [DOI] [PubMed] [Google Scholar]
- 18.Zhong H, et al. Modulation of hypoxia-inducible factor 1alpha expression by the epidermal growth factor/phosphatidylinositol 3-kinase/PTEN/AKT/FRAP pathway in human prostate cancer cells: implications for tumor angiogenesis and therapeutics. Cancer Res. 2000;60:1541–1545. [PubMed] [Google Scholar]
- 19.Mazure NM, Chen EY, Laderoute KR, Giaccia AJ. Induction of vascular endothelial growth factor by hypoxia is modulated by a phosphatidylinositol 3-kinase/Akt signaling pathway in Ha-ras-transformed cells through a hypoxia inducible factor-1 transcriptional element. Blood. 1997;90:3322–3331. [PubMed] [Google Scholar]
- 20.Ferrer I, et al. KRAS-Mutant non-small cell lung cancer: From biology to therapy. Lung Cancer. 2018;124:53–64. doi: 10.1016/j.lungcan.2018.07.013. [DOI] [PubMed] [Google Scholar]
- 21.Salem A, et al. Targeting Hypoxia to Improve Non-Small Cell Lung Cancer Outcome. J Natl Cancer Inst. 2018;110 doi: 10.1093/jnci/djx160. [DOI] [PubMed] [Google Scholar]
- 22.Gazdar AF, Girard L, Lockwood WW, Lam WL, Minna JD. Lung cancer cell lines as tools for biomedical discovery and research. J Natl Cancer Inst. 2010;102:1310–1321. doi: 10.1093/jnci/djq279. [DOI] [PMC free article] [PubMed] [Google Scholar]
- 23.Uhlen M, et al. Proteomics. Tissue-based map of the human proteome. Science. 2015;347 doi: 10.1126/science.1260419. 1260419. [DOI] [PubMed] [Google Scholar]
- 24.Li L, et al. Integrated omic analysis of lung cancer reveals metabolism proteome signatures with prognostic impact. Nat Commun. 2014;5 doi: 10.1038/ncomms6469. 5469. [DOI] [PubMed] [Google Scholar]
- 25.Marino S, Vooijs M, van Der Gulden H, Jonkers J, Berns A. Induction of medulloblastomas in p53-null mutant mice by somatic inactivation of Rb in the external granular layer cells of the cerebellum. Genes Dev. 2000;14:994–1004. [PMC free article] [PubMed] [Google Scholar]
- 26.Jackson EL, et al. Analysis of lung tumor initiation and progression using conditional expression of oncogenic K-ras. Genes Dev. 2001;15:3243–3248. doi: 10.1101/gad.943001. [DOI] [PMC free article] [PubMed] [Google Scholar]
- 27.Toker A, Cantley LC. Signalling through the lipid products of phosphoinositide-3-OH kinase. Nature. 1997;387:673–676. doi: 10.1038/42648. [DOI] [PubMed] [Google Scholar]
- 28.Hicks SN, et al. General and versatile autoinhibition of PLC isozymes. Mol Cell. 2008;31:383–394. doi: 10.1016/j.molcel.2008.06.018. [DOI] [PMC free article] [PubMed] [Google Scholar]
- 29.Bunney TD, et al. Structural and functional integration of the PLCgamma interaction domains critical for regulatory mechanisms and signaling deregulation. Structure. 2012;20:2062–2075. doi: 10.1016/j.str.2012.09.005. [DOI] [PMC free article] [PubMed] [Google Scholar]
- 30.Rutter GA, et al. Subcellular imaging of intramitochondrial Ca2+ with recombinant targeted aequorin: significance for the regulation of pyruvate dehydrogenase activity. Proc Natl Acad Sci U S A. 1996;93:5489–5494. doi: 10.1073/pnas.93.11.5489. [DOI] [PMC free article] [PubMed] [Google Scholar]
- 31.Jouaville LS, Pinton P, Bastianutto C, Rutter GA, Rizzuto R. Regulation of mitochondrial ATP synthesis by calcium: evidence for a long-term metabolic priming. Proc Natl Acad Sci U S A. 1999;96:13807–13812. doi: 10.1073/pnas.96.24.13807. [DOI] [PMC free article] [PubMed] [Google Scholar]
- 32.Rimessi A, et al. Interorganellar calcium signaling in the regulation of cell metabolism: A cancer perspective. Semin Cell Dev Biol. 2019 doi: 10.1016/j.semcdb.2019.05.015. [DOI] [PubMed] [Google Scholar]
- 33.Rana RS, Hokin LE. Role of phosphoinositides in transmembrane signaling. Physiol Rev. 1990;70:115–164. doi: 10.1152/physrev.1990.70.1.115. [DOI] [PubMed] [Google Scholar]
- 34.Rhee SG, Bae YS. Regulation of phosphoinositide-specific phospholipase C isozymes. J Biol Chem. 1997;272:15045–15048. doi: 10.1074/jbc.272.24.15045. [DOI] [PubMed] [Google Scholar]
- 35.Rimessi A, Giorgi C, Pinton P, Rizzuto R. The versatility of mitochondrial calcium signals: from stimulation of cell metabolism to induction of cell death. Biochim Biophys Acta. 2008;1777:808–816. doi: 10.1016/j.bbabio.2008.05.449. [DOI] [PMC free article] [PubMed] [Google Scholar]
- 36.Guzy RD, et al. Mitochondrial complex III is required for hypoxia-induced ROS production and cellular oxygen sensing. Cell Metab. 2005;1:401–408. doi: 10.1016/j.cmet.2005.05.001. [DOI] [PubMed] [Google Scholar]
- 37.Dada LA, et al. Hypoxia-induced endocytosis of Na,K-ATPase in alveolar epithelial cells is mediated by mitochondrial reactive oxygen species and PKC-zeta. J Clin Invest. 2003;111:1057–1064. doi: 10.1172/JCI16826. [DOI] [PMC free article] [PubMed] [Google Scholar]
- 38.Tarasov AI, Griffiths EJ, Rutter GA. Regulation of ATP production by mitochondrial Ca(2+) Cell Calcium. 2012;52:28–35. doi: 10.1016/j.ceca.2012.03.003. [DOI] [PMC free article] [PubMed] [Google Scholar]
- 39.Baughman JM, et al. Integrative genomics identifies MCU as an essential component of the mitochondrial calcium uniporter. Nature. 2011;476:341–345. doi: 10.1038/nature10234. [DOI] [PMC free article] [PubMed] [Google Scholar]
- 40.Giorgi C, Marchi S, Pinton P. The machineries, regulation and cellular functions of mitochondrial calcium. Nat Rev Mol Cell Biol. 2018;19:713–730. doi: 10.1038/s41580-018-0052-8. [DOI] [PubMed] [Google Scholar]
- 41.Negre-Salvayre A, Coatrieux C, Ingueneau C, Salvayre R. Advanced lipid peroxidation end products in oxidative damage to proteins. Potential role in diseases and therapeutic prospects for the inhibitors. Br J Pharmacol. 2008;153:6–20. doi: 10.1038/sj.bjp.0707395. [DOI] [PMC free article] [PubMed] [Google Scholar]
- 42.The Cancer Genome Atlas Research Network., Disease analysis working group. Collisson E, et al. Author Correction: Comprehensive molecular profiling of lung adenocarcinoma. Nature. 2014;511:543–550. doi: 10.1038/nature13385. [DOI] [PMC free article] [PubMed] [Google Scholar]
- 43.Wilson WR, Hay MP. Targeting hypoxia in cancer therapy. Nat Rev Cancer. 2011;11:393–410. doi: 10.1038/nrc3064. [DOI] [PubMed] [Google Scholar]
- 44.Dewhirst MW, Cao Y, Moeller B. Cycling hypoxia and free radicals regulate angiogenesis and radiotherapy response. Nat Rev Cancer. 2008;8:425–437. doi: 10.1038/nrc2397. [DOI] [PMC free article] [PubMed] [Google Scholar]
- 45.Wang XT, McCullough KD, Wang XJ, Carpenter G, Holbrook NJ. Oxidative stress-induced phospholipase C-gamma 1 activation enhances cell survival. J Biol Chem. 2001;276:28364–28371. doi: 10.1074/jbc.M102693200. [DOI] [PubMed] [Google Scholar]
- 46.Sala G, et al. Phospholipase Cgamma1 is required for metastasis development and progression. Cancer Res. 2008;68:10187–10196. doi: 10.1158/0008-5472.CAN-08-1181. [DOI] [PubMed] [Google Scholar]
- 47.Thomas SM, et al. Epidermal growth factor receptor-stimulated activation of phospholipase Cgamma-1 promotes invasion of head and neck squamous cell carcinoma. Cancer Res. 2003;63:5629–5635. [PubMed] [Google Scholar]
- 48.Turner T, Epps-Fung MV, Kassis J, Wells A. Molecular inhibition of phospholipase cgamma signaling abrogates DU-145 prostate tumor cell invasion. Clin Cancer Res. 1997;3:2275–2282. [PubMed] [Google Scholar]
- 49.Tang W, et al. Oncogenic role of phospholipase C-gamma1 in progression of hepatocellular carcinoma. Hepatol Res. 2019;49:559–569. doi: 10.1111/hepr.13309. [DOI] [PubMed] [Google Scholar]
- 50.Ackerman D, et al. Triglycerides Promote Lipid Homeostasis during Hypoxic Stress by Balancing Fatty Acid Saturation. Cell Rep. 2018;24:2596–2605 e2595. doi: 10.1016/j.celrep.2018.08.015. [DOI] [PMC free article] [PubMed] [Google Scholar]
- 51.Zhang X, et al. Inhibition of intracellular lipolysis promotes human cancer cell adaptation to hypoxia. Elife. 2017;6 doi: 10.7554/eLife.31132. [DOI] [PMC free article] [PubMed] [Google Scholar]
- 52.Liu L, et al. Glial lipid droplets and ROS induced by mitochondrial defects promote neurodegeneration. Cell. 2015;160:177–190. doi: 10.1016/j.cell.2014.12.019. [DOI] [PMC free article] [PubMed] [Google Scholar]
- 53.Teppo HR, Soini Y, Karihtala P. Reactive Oxygen Species-Mediated Mechanisms of Action of Targeted Cancer Therapy. Oxidative medicine and cellular longevity. 2017;2017 doi: 10.1155/2017/1485283. 1485283. [DOI] [PMC free article] [PubMed] [Google Scholar]
- 54.Gresset A, Hicks SN, Harden TK, Sondek J. Mechanism of phosphorylation-induced activation of phospholipase C-gamma isozymes. J Biol Chem. 2010;285:35836–35847. doi: 10.1074/jbc.M110.166512. [DOI] [PMC free article] [PubMed] [Google Scholar]
- 55.De Stefani D, Raffaello A, Teardo E, Szabo I, Rizzuto R. A forty-kilodalton protein of the inner membrane is the mitochondrial calcium uniporter. Nature. 2011;476:336–340. doi: 10.1038/nature10230. [DOI] [PMC free article] [PubMed] [Google Scholar]
- 56.Wiederschain D, et al. Single-vector inducible lentiviral RNAi system for oncology target validation. Cell Cycle. 2009;8:498–504. doi: 10.4161/cc.8.3.7701. [DOI] [PubMed] [Google Scholar]
- 57.Stewart SA, et al. Lentivirus-delivered stable gene silencing by RNAi in primary cells. RNA. 2003;9:493–501. doi: 10.1261/rna.2192803. [DOI] [PMC free article] [PubMed] [Google Scholar]
- 58.Wang L, Jin Q, Lee JE, Su IH, Ge K. Histone H3K27 methyltransferase Ezh2 represses Wnt genes to facilitate adipogenesis. Proceedings of the National Academy of Sciences of the United States of America. 2010;107:7317–7322. doi: 10.1073/pnas.1000031107. [DOI] [PMC free article] [PubMed] [Google Scholar]
- 59.Phelps RM, et al. NCI-Navy Medical Oncology Branch cell line data base. J Cell Biochem Suppl. 1996;24:32–91. doi: 10.1002/jcb.240630505. [DOI] [PubMed] [Google Scholar]
- 60.Coughlan AM, et al. Myeloid Engraftment in Humanized Mice: Impact of Granulocyte-Colony Stimulating Factor Treatment and Transgenic Mouse Strain. Stem Cells Dev. 2016;25:530–541. doi: 10.1089/scd.2015.0289. [DOI] [PubMed] [Google Scholar]
- 61.Shultz LD, et al. Human lymphoid and myeloid cell development in NOD/LtSz-scid IL2R gamma null mice engrafted with mobilized human hemopoietic stem cells. J Immunol. 2005;174:6477–6489. doi: 10.4049/jimmunol.174.10.6477. [DOI] [PubMed] [Google Scholar]
- 62.Ramadori G, et al. Diet-induced unresolved ER stress hinders KRAS-driven lung tumorigenesis. Cell Metab. 2015;21:117–125. doi: 10.1016/j.cmet.2014.11.020. [DOI] [PMC free article] [PubMed] [Google Scholar]
- 63.Majka SM, et al. Analysis and isolation of adipocytes by flow cytometry. Methods in enzymology. 2014;537:281–296. doi: 10.1016/B978-0-12-411619-1.00015-X. [DOI] [PMC free article] [PubMed] [Google Scholar]
- 64.Bonora M, et al. Subcellular calcium measurements in mammalian cells using jellyfish photoprotein aequorin-based probes. Nat Protoc. 2013;8:2105–2118. doi: 10.1038/nprot.2013.127. [DOI] [PubMed] [Google Scholar]
- 65.Padanad MS, et al. Fatty Acid Oxidation Mediated by Acyl-CoA Synthetase Long Chain 3 Is Required for Mutant KRAS Lung Tumorigenesis. Cell Rep. 2016;16:1614–1628. doi: 10.1016/j.celrep.2016.07.009. [DOI] [PMC free article] [PubMed] [Google Scholar]
- 66.Traynor-Kaplan A, et al. Fatty-acyl chain profiles of cellular phosphoinositides. Biochimica et biophysica acta Molecular and cell biology of lipids. 2017;1862:513–522. doi: 10.1016/j.bbalip.2017.02.002. [DOI] [PMC free article] [PubMed] [Google Scholar]
Associated Data
This section collects any data citations, data availability statements, or supplementary materials included in this article.
Supplementary Materials
Data Availability Statement
All Source Data for Figs. 1–8 and Extended Data Figs. 1–10 are included in this published article (and in its Extended Data Source Data files 1-10, Supplementary Figure 1 and Tables 1 and 2). Requests to use the PLCγ1 floxed mice will be redirected to Florian H. Heidel and Tina M. Schnöder. The Cancer Genome Atlas (TCGA) lung adenocarcinoma (LUAD) dataset was retrieved from the Genomic Data Commons Portal: http://cancergenome.nih.gov. The data were downloaded with the help of the web graphic user interface Xena browser https://xenabrowser.net.


