Abstract
The genetic elements required to tune gene expression are partitioned in active and repressive nuclear condensates. Chromatin compartments include transcriptional clusters whose dynamic establishment and functioning depends on multivalent interactions occurring among transcription factors, cofactors and basal transcriptional machinery. However, how chromatin players contribute to the assembly of transcriptional condensates is poorly understood. By interrogating the effect of KMT2D (also known as MLL4) haploinsufficiency in Kabuki Syndrome, we found that MLL4 contributes to the assembly of transcriptional condensates through liquid-liquid phase separation. MLL4 loss-of-function (LoF) impaired Polycomb-dependent chromatin compartmentalization, altering nuclear architecture. By releasing the nuclear mechanical stress through the inhibition of the mechano-sensor ATR, we re-established the mechano-signaling of mesenchymal stem cells (MSCs) and their commitment towards chondrocytes both in vitro and in vivo. This study supports the notion that in Kabuki Syndrome the haploinsufficiency of MLL4 causes an altered functional partitioning of chromatin, which determines the architecture and mechanical properties of the nucleus.
Introduction
The cellular response to both mechanical and biochemical stimuli is influenced by the chromatin context, which modulates the accessibility to cis-regulatory elements such as promoters and enhancers1,2. Defined chromatin patterns, including histone H3 lysine 4 monomethylation (H3K4me1) enrichment and H3K27 acetylation (H3K27ac), mark active enhancers3,4. Besides chromatin modifications, the interplay between transcription factors (TFs), and genome spatial organization dictate the spatial-temporal control of gene expression5,6.
Recent findings suggest that gene regulation occurs in transcriptional condensates, in which TFs, cofactors, and transcriptional machinery dynamically cluster at multiple cis-regulatory elements7,8,9,10,11. It has been proposed that liquid–liquid phase separation (LLPS) guides the formation of these membraneless compartments12,13,14. Multiple weak interactions are promoted by intrinsically disordered regions (IDRs), which favor the assembly of biomolecular condensates15. Among IDRs, prion-like domains (PrLDs) are of particular relevance, as they are characterized by stretches of polar amino acids16,17 and are enriched among TFs and chromatin players18. Nevertheless, the contribution of the epigenetic landscape and chromatin-associated factors to transcriptional condensate assembly has not been fully elucidated.
Among the chromatin players, the multi-protein MLL4/COMPASS complex is involved in depositing H3K4me1 and modulating H3K27ac19,20. MLL4 belongs to the trithorax (TrxG) group of proteins that functionally antagonize Polycomb (PcG) proteins for maintaining active or repressive gene expression states21,22. Recent findings have shown that apart from the SET domain, other MLL4 modules could be relevant for its activity in regulating the chromatin state and gene expression23,24,25. This possibility is supported by genetic evidence showing that haploinsufficiency of KMT2D (which codes for MLL4) represents, in most cases, the underlying cause of Kabuki syndrome (KS), a rare multi-systemic disorder characterized by craniofacial anomalies, postnatal growth retardation, intellectual disability, and various organ malformations26. The retrieved KMT2D mutations in KS patients are heterogeneous and widespread along the gene27,28, suggesting diversity in the functional consequences of altering MLL4 protein and its contribution to chromatin regulation.
Besides biochemical signals, stem cells sense and respond to the mechanical forces required to properly direct their fate29,30. Tissues and cells respond to external mechanical cues by modulating cytoskeletal organization and tension, leading to force transmission to the nucleus and the nuclear translocation of TFs such as MRTF and YAP31,32. Importantly, the physical properties of the chromatin shape the nucleus, which is mechanically coupled with the cytoskeleton through the LINC complex and the nuclear lamina33,34,35,36. The biological outcome of perturbing these inward nuclear forces, by altering chromatin organization and nuclear mechanical properties, requires further study.
Here, we investigated whether MLL4 LoF can affect chromatin compartmentalization and result in nuclear mechanical stress and impaired MSC lineage commitment. We found that MLL4 drives the assembly of transcriptional condensates through LLPS. Via a stem cell-based KS disease model, we determined that MLL4 maintains an equilibrium between transcription-associated and PcG condensates, which is required for preserving nuclear mechanical properties. By blocking the nuclear mechanosensor ATR, we rescued MLL4-dependent mechanical stress, permitting proper commitment of MSCs towards chondrocytes both in vitro and in vivo.
Results
KMT2D truncating mutations reiterate the effect of MLL4 LoF on KS patients
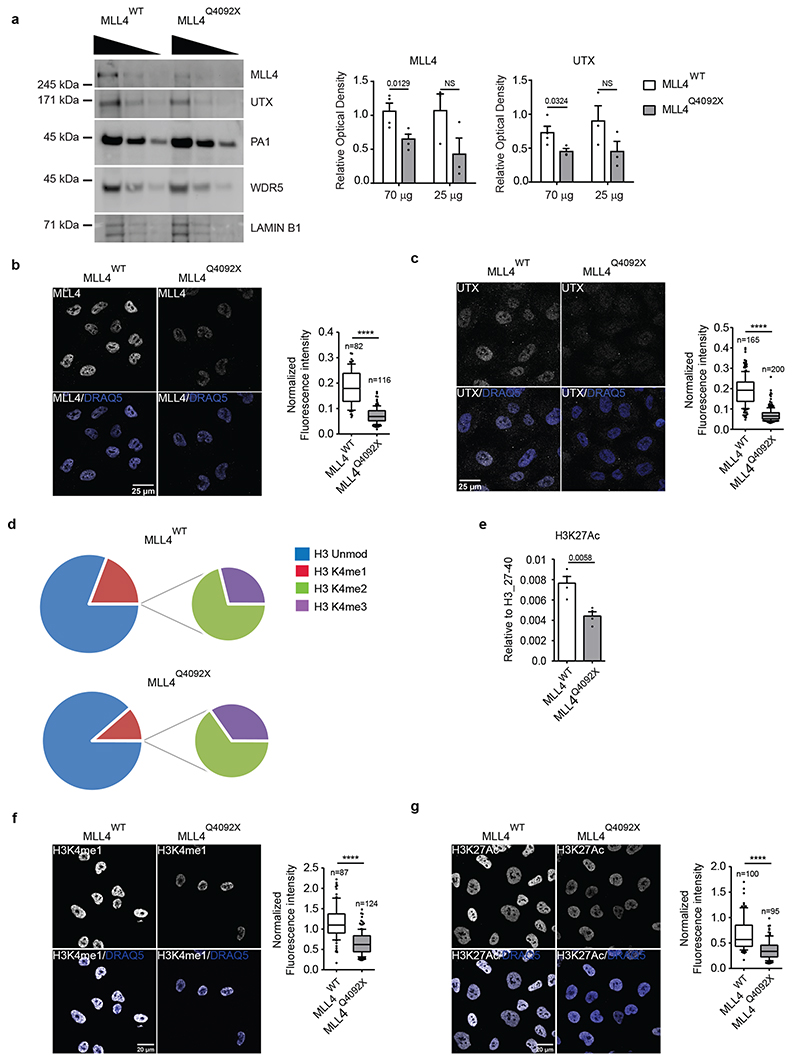
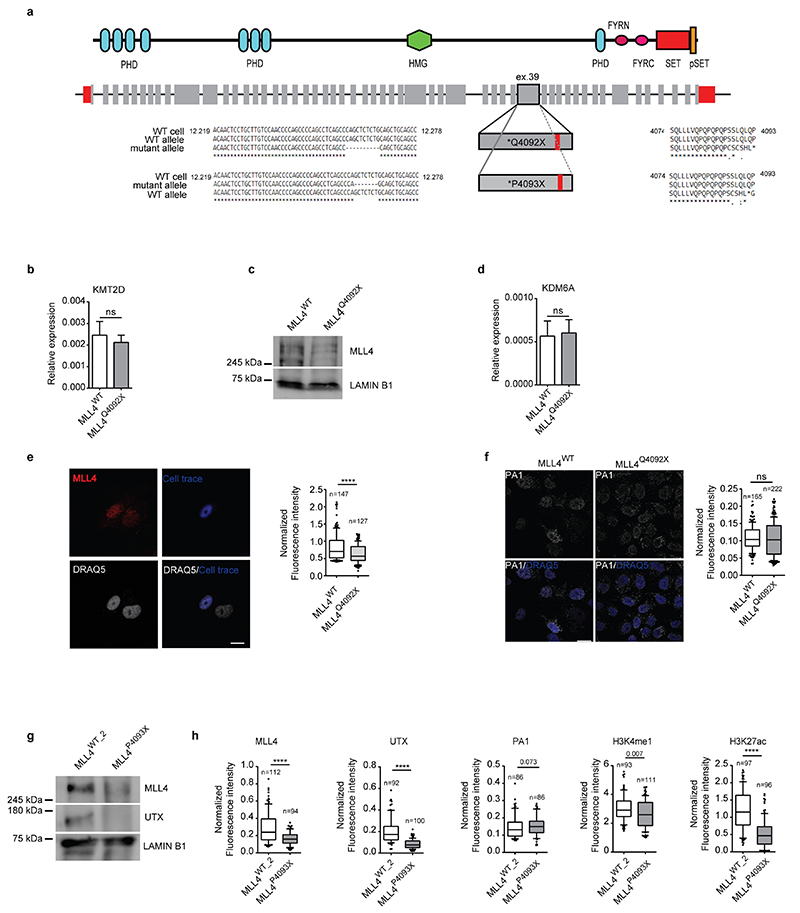
To address the consequences of MLL4 LoF in KS, we inserted a frameshift mutation in the coding region (exon 39) of KMT2D in MSCs via CRISPR/Cas9-medited editing. We generated MSCs carrying a frameshift mutation in heterozygosity that truncates the MLL4 protein (thereafter termed MLL4Q4092X) (Extended Data Fig. 1a). Despite the unaltered transcript abundance, the mutation reduced MLL4 protein levels (Fig. 1a; Extended Data Fig. 1b, c) similar to previous observations in patient-derived samples37,38. The mutation did not affect the relative abundance of components of the MLL4/COMPASS complex such as WDR5 and PA1 (Fig. 1a). UTX protein levels were decreased in MLL4Q4092X MSCs as compared to the wild-type (WT) MSCs (Fig. 1a; Extended Data Fig. 1d). Single-cell analyses by quantitative immunofluorescence showed that both MLL4 and UTX were uniformly reduced in MLL4Q4092X MSCs, while PA1 was unchanged (Fig. 1b, c; Extended Data Fig. 1e, f).
Fig. 1. KMT2D loss-of-function destabilizes MLL4/COMPASS complex activity.
a Western Blot analysis of MLL4/COMPASS complex in WT and MLL4Q4092X MSCs by using the indicated antibodies; Lamin B1 was used as loading control. Serial dilutions of protein extracts were loaded. Signal quantifications for MLL4 and UTX are reported as barplot. Data are means + SEM of 4 independent experiments; one-tailed Student’s t-test was applied for statistical analysis.
b-c Representative images and relative quantifications of immunostaining for MLL4 (b) and UTX (c) in WT and MLL4Q4092X MSCs. Scale bar, 25 μm. Box plots indicate the median (middle line), the first and third quartiles (box), and the 10th and 90th percentile (error bars) of the fluorescence intensity of analyzed nuclei (n), as reported in figure. Unpaired two-tailed Student’s t-test was applied for statistical analysis (**** P < 0.0001).
d Relative abundance of H3K4 modifications in WT and MLL4Q4092X MSCs by MS analyses. The large pies represent the average abundance of H3K4me1 and the unmodified H3K4, with respect to the total histone H3. The small pies represent the average abundance of H3K4me2 and H3K4me3, with respect to the total histone H3. The relative quantifications were determined using four biologically independent samples.
e Relative abundance of H3K27 acetylation in WT and MLL4Q4092X MSCs measured by MS analyses. Data are means + SEM (n = 4 biologically independent samples); unpaired two-tailed Student’s t-test was applied for statistical analysis
f-g Representative images and relative quantifications of immunostaining for H3K4me1 (f) and H3K27ac (g) in WT and MLL4Q4092X MSCs. Scale bar, 20 μm Box plots indicate the median (middle line), the first and third quartiles (box), and the 10th and 90th percentile (error bars) of the fluorescence intensity of analyzed nuclei (n), as reported in figure. Unpaired two-tailed Student’s t-test was applied for statistical analysis (**** P < 0.0001).
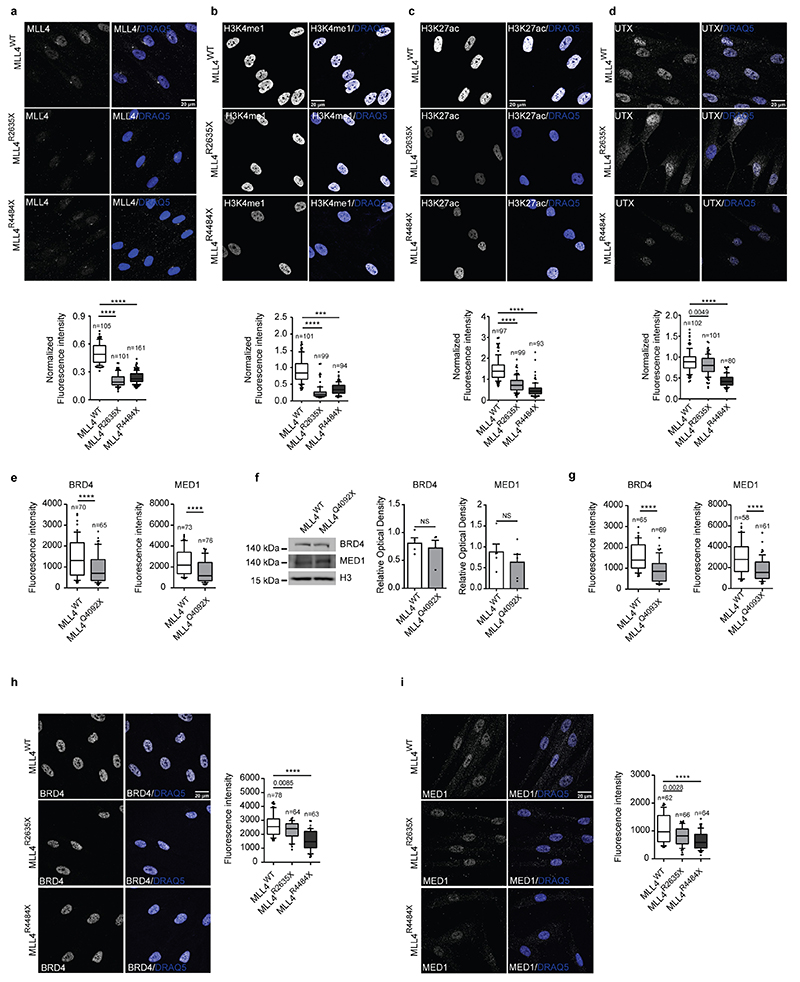
Considering MLL4 has specific monomethyl transferase activity for histone H3, we determined whether its haploinsufficiency could affect H3K4me1 levels. Mass spectrometry profiling of the relative changes in histone modifications showed that MLL4Q4092X MSCs had relatively lower H3K4me1 levels compared to WT cells, while H3K4 dimethylation and trimethylation (H3K4me2/3) levels were unchanged (Fig. 1d). As the MLL4/COMPASS complex associates with the histone acetyltransferase P30020, we also quantified the relative abundance of H3K27ac. Mass spectrometry showed that MLL4Q4092X MSCs had reduced H3K27ac as compared to WT MSCs (Fig. 1e). Immunofluorescence analyses supported these results (Fig. 1f, g). Importantly, an independent MSC clone carrying a different truncating mutation of MLL4 (MLL4P4093X) also exhibited reduced protein abundance of MLL4 and UTX and the associated reduction of H3K4me1 and H3K27ac (Extended Data Fig. 1g, h). To ensure that these alterations were not dependent on the developed in vitro KS model, we also measured the same alterations in primary fibroblasts isolated from KS patients. We found that, independently from the mutations causing KMT2D haploinsufficiency, the diminished abundance of MLL4 resulted in decreased H3K4me1 and H3K27ac levels, which were mirrored by reduced UTX abundance (Extended Data Fig. 2a–d). Together, these data show that KMT2D truncating mutations cause MLL4 LoF, impairing H3K4me1 deposition and decreasing H3K27ac levels.
MLL4 favors the compartmentalization of transcriptional cofactors
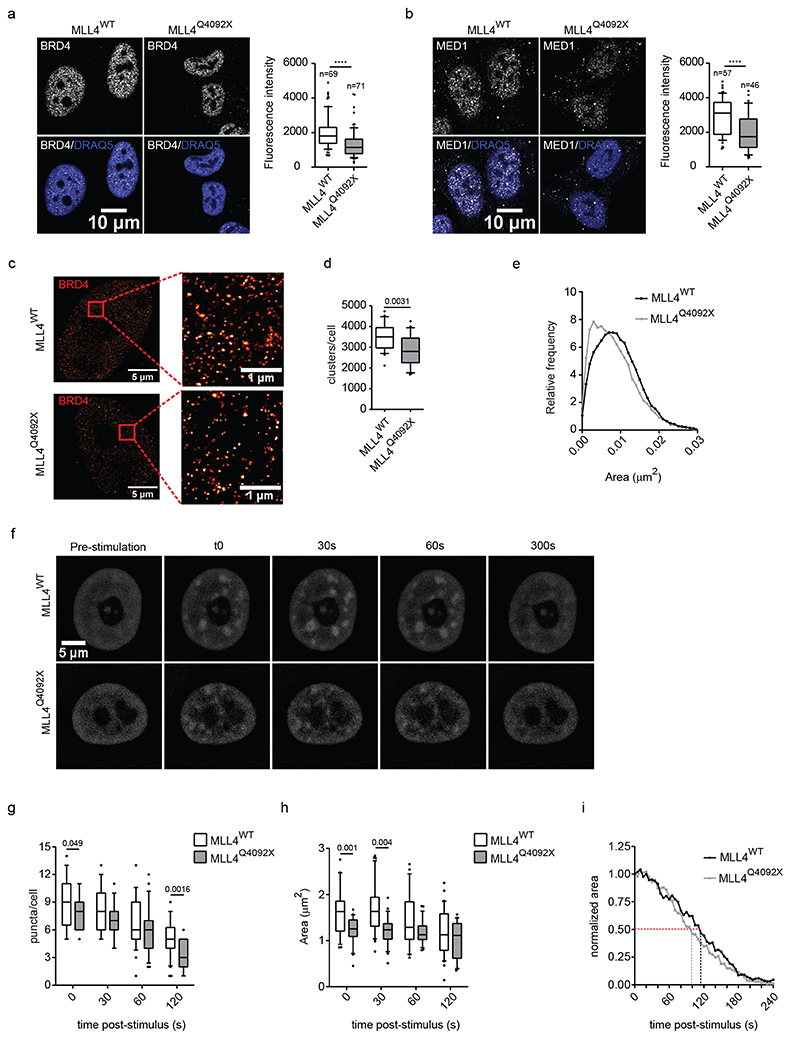
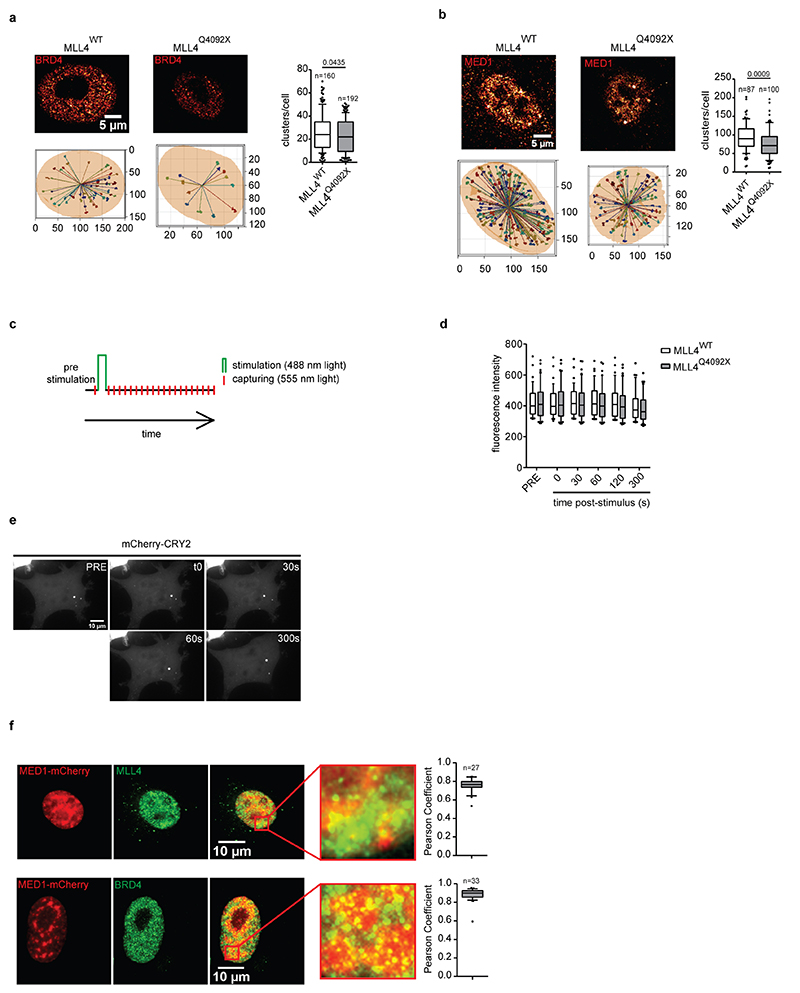
Considering the role of enhancers in transcriptional condensate assembly8,11,32,39, we examined whether MLL4 haploinsufficiency would impair enhancer-associated cofactor clustering. Measurement of MED1 and BRD4 nuclear distribution showed that these cofactors were distributed in clusters (Fig. 2a, b). MLL4Q4092X MSCs had decreased intensity of BRD4 and MED1 condensates compared to the WT MSCs (Fig. 2a, b; Extended Data Fig. 2e, f). An independent MSC clone carrying the MLL4P4093X mutation yielded a similar pattern, as did KS patient-derived fibroblasts (Extended Data Fig. 2g–i). Determining the number and distribution of BRD4 and MED1 clusters within the nuclear volume confirmed their reduced abundance upon MLL4 LoF (Extended Data Fig. 3a, b).
Fig. 2. Effects of MLL4 LoF on clustering of transcriptional biomolecular condensates.
a-b Representative images and relative quantifications of cluster intensities for BRD4 (a) and MED1 (b) immunostaining in WT and MLL4Q4092X MSCs. Scale bar, 10 μm. Box plots indicate the median (middle line), the first and third quartiles (box), and the 10th and 90th percentile (error bars) of the fluorescence intensity of analyzed nuclei (n), as reported in figure. Unpaired two-tailed Student’s t-test was applied for statistical analysis (**** P < 0.0001).
c Representative STORM images of BRD4 in WT and MLL4Q4092X MSCs of three independent experiments; scale bar, 5 μm. Zoom in images highlighting the clustered distribution of the signal; scale bar, 1 μm.
d Quantification of the number of BRD4 clusters, measured in individual nuclei of WT and MLL4Q4092X MSCs. Box plots indicate the median (middle line), the first and third quartiles (box), and the 10th and 90th percentile (error bars) of the fluorescence intensity. n = 25 nuclei analyzed/sample over three independent experiments; unpaired two-tailed Student’s t-test was applied for statistical analysis.
e Distribution of the area of the BRD4 clusters detected in WT and MLL4Q4092X MSCs.
f Representative images of five independent experiments of blue light-induced clustering of MED1-IDR at the indicated time points, in WT and MLL4Q4092X MSCs; scale bar, 5 μm.
g Quantification of the number of MED1-IDR clusters, measured in individual nuclei of WT (n = 32) and MLL4Q4092X (n = 25) MSCs at the indicated time points. Box plots indicate the median (middle line), the first and third quartiles (box), and the 10th and 90th percentile (error bars); unpaired two-tailed Student’s t-test was applied for statistical analysis.
h Quantification of the distribution of the area of MED1-IDR clusters, measured in individual nuclei of WT (n = 32) and MLL4Q4092X (n = 25) MSCs at the indicated time points. Box plots indicate the median (middle line), the first and third quartiles (box), and the 10th and 90th percentile (error bars); unpaired two-tailed Student’s t-test was applied for statistical analysis.
i Distribution of the normalized area of MED1-IDR clusters, measured in individual nuclei of WT and MLL4Q4092X MSCs. The area of each cluster/time point was normalized versus the corresponding area measured at the first time point post stimulation (T = 0). Dashed lines represent the corresponding time life of MED1-IDR.
To better define whether MLL4 haploinsufficiency alters cofactor organization in condensates in MSCs, we performed super-resolution imaging by stochastic optical reconstruction microscopy (STORM). This revealed that BRD4 is distributed throughout the nucleus in clusters ranging from ∼0.0051 μm2 to 0.013 μm2(Fig. 2c, d). Notably, MLL4 LoF reduced BRD4 clustering, resulting in the formation of fewer and smaller condensates (Fig. 2d, e). These results suggest that MLL4 facilitates the assembly of chromatin clusters enriched for transcriptional cofactors.
To strengthen these findings, we measured whether MLL4 LoF affected the clustering dynamics of transcriptional condensates, adopting an optogenetic approach that allows modulation of the clustering of proteins containing self-associating IDRs9,40. We followed the dynamic formation and disassembly of MED1 clusters via live imaging by combining the light-responsive photolyase homology region of Cry2 with the IDR region of MED1 (Extended Data Fig. 3c). A single pulse of blue light was sufficient to drive MED1 assembly in MSCs (Fig. 2f). Time-lapse imaging showed that MED1 IDR clusters formed immediately after light stimulation and dissolved within 5 minutes (Extended Data Fig. 3d, e; Supplementary Videos 1 and 2). The formed clusters corresponded to transcriptional condensates, as they co-localized with BRD4 and MLL4 (Extended Data Fig. 3f). Quantitative analyses showed that although the MED1 IDR clusters formed with the same timing in the WT and MLL4Q4092X MSCs, their number and size was reduced upon MLL4 LoF (Fig. 2g, h). WT cells formed transient condensates with a mean lifetime of 119 seconds, while MLL4Q4092X MSC clusters dissembled more rapidly, with a lifetime of 102 seconds (Fig. 2i). These results show that MLL4 LoF reduces the nucleation efficacy and the assembly and disassembly kinetics of transcriptional condensates.
MLL4 is clustered in biomolecular condensates
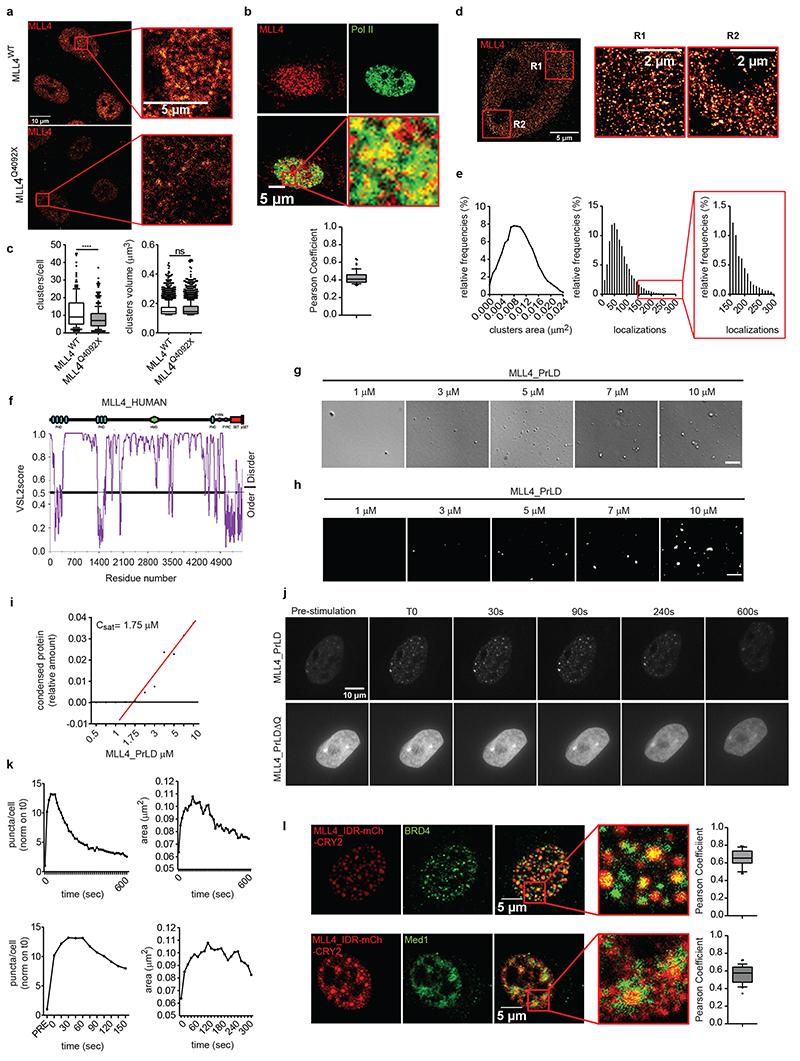
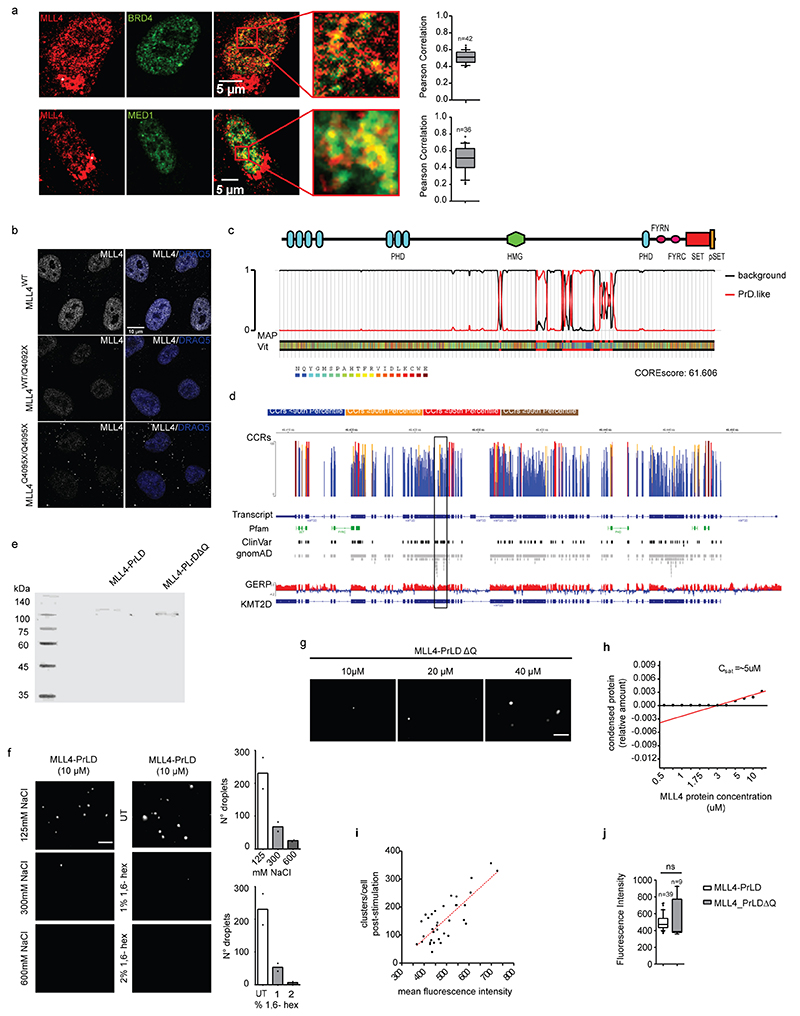
To define the possible mechanism by which the MLL4/COMPASS complex supports transcriptional condensate clustering, we investigated MLL4 distribution by quantitative imaging, and found that it is organized in clusters (Fig. 3a). Dual immunofluorescence showed that both MED1 and BRD4 were enriched within MLL4 clusters that co-localized with RNA Polymerase II (Fig. 3b; Extended Data Fig. 4a). Comparative analyses showed that KMT2D haploinsufficiency reduced the number of MLL4 condensates without altering their dimensions (Fig. 3c; Extended Data Fig. 4b). STORM showed that MLL4 exhibited puncta-like distribution, with cluster sizes between 0.0062 μm2 and 0.013 μm2 (Fig. 3d, e). Notably, a small subset of MLL4 protein was clustered in large condensates, each formed by more than 150 localizations compared to the average distribution of 72.4 localizations per cluster. These results suggest that the MLL4/COMPASS complex is organized in biomolecular condensates that could influence MED1 and BRD4 distribution.
Fig. 3. MLL4 is clustered in transcriptional condensates through its PrLD.
a Representative image of immunostaining for MLL4 in WT and MLL4Q4092X MSCs. Scale bar, 10 μm. Zoom in of the indicated portion of the image, highlighting the clustered distribution of MLL4; scale bar, 5 μm.
b Representative images of dual immunostaining for MLL4 and RNA Pol II, in WT MSCs; scale bar, 10 μm. Pearson Coefficient between MLL4 and RNA Pol II was represented as a box indicating the median (middle line), the first and third quartiles (box), and the 10th and 90th percentile (error bars); number of analyzed nuclei n = 59.
c Quantification of the number and the size of MLL4 clusters in individual nuclei of WT (n = 200) and MLL4Q4092X (n = 332) MSCs, resolved by 3D confocal scanning microscopy. Box plots indicate the median (middle line), the first and third quartiles (box), and the 10th and 90th percentile (error bars). Unpaired two-tailed Student’s t-test was applied for statistical analysis (**** P < 0.0001).
d Representative STORM images of MLL4 in WT MSCs; scale bar, 5 μm. Zoom in of the images highlighting the clustered distribution of the signal; scale bar, 2 μm.
e Representative distribution of the area of the MLL4 clusters detected in WT MSCs. Analysis of the number of localizations in each cluster of MLL4; enlarged picture highlights the occurrence of localizations for the largest MLL4 clusters.
f Graphical representation of the predicted intrinsically disorder regions (IDRs) of MLL4 retrieved by PONDR analysis.
g-h Phase separation of MLL4-PrLD at the physiological salt concentration detected by differential interference contrast (DIC) (g) or fluorescence microscopy (h), using increasing concentration of the mCherry-tagged recombinant protein; scale bar, 5 μm.
i Measurements of the relative amount of condensed MLL4 PrLD versus protein concentration. X-axis showing the different MLL4 protein concentrations. Values on Y-axis represent the ratio of liquid-liquid phase-separated protein. Regression line is shown in red.
j Representative images of blue light-induced clustering of MLL4-PrLD and MLL4-PrLDΔQ at different time points in NIH 3T3 cells. Cells were stimulated for 2 seconds with 488-nm light followed by image acquisition every 15 seconds. Number of analyzed cells n = 17 over two independent experiments; scale bar, 10 μm.
k Quantification of the number and the area of the light-induced droplets of MLL4-PrLD at different time points; lower panels show the pre-stimulation and the initial time frames post-light stimulation.
l Representative images of immunostaining for BRD4 and MED1 after light-induced clustering of MLL4-PrLD; scale bar: 5 μm. Zoom-in images show the distribution pattern of MLL4 droplets with respect to the signal of BRD4 and MED1; scale bar: 5 μm. Pearson Coefficient between MLL4_IDR and BRD4 (n = 31) or Med1 (n = 28) was represented as box plot indicating the median (middle line), the first and third quartiles (box), and the 10th and 90th percentile (error bars).
Bioinformatic analyses predicted that MLL4 contains large IDRs that could potentially participate in driving LLPS (Fig. 3f). Among these, we identified an MLL4-specific PrLD, which is conserved in multiple species and is specifically deleted in KS patients (Extended Data Fig. 4c, d)41,42. Given that PrLDs are low-complexity regions that promote multivalent interactions12, we determined whether MLL4 IDR harboring the PrLD (MLL4_PrLD [3560]-[4270]) was sufficient for driving LLPS in vitro. We found that recombinant mCherry-MLL4_PrLD (Extended Data Fig. 4e) phase-separated in physiological ionic strength conditions in the presence of a crowding agent (Fig. 3g, h). To determine the saturation concentration (Csat) at which the MLL4 PrLD phase-separated, we quantified the relative intensity of the mCherry signal inside the droplets. We found that the Csat of MLL4 PrLD was ∼1.7 μM, behaving similarly to the prototype PrLD-containing protein FUS (Fig. 3i)43. Importantly, the MLL4 PrLD phase separation was reversible, as the formed droplets were dissolved by increasing the ionic strength or by competing out the hydrophobic interactions by adding 1,6-hexanediol (Extended Data Fig. 4f, g). As the identified MLL4 PrLD contained a polyQ tract (78 amino acids), we deleted this region from the mCherry-MLL4_PrLD protein and assessed its contribution to phase separation (Extended Data Fig. 4e). Removing the polyQ stretch was sufficient for reducing the droplet-forming proficiency of MLL4 PrLD, suggesting that this region is required for driving phase separation (Extended Data Fig. 4h).
To determine whether MLL4 PrLD participates in the formation of transcriptional condensates in living cells, we modulated the local protein concentration using the light-activated optoIDR approach40,44. A single pulse of blue light induced clustering in most of the expressing cells, forming spherical droplets (Fig. 3j). The resultant number of formed droplets was proportional to the optoMLL4 expression level (Extended Data Fig. 4i). Time-lapse imaging showed that following light stimulation, the optoMLL4 nucleated in droplets whose number and dimensions persisted for 300 seconds before diffusing into the nucleoplasm, reaching the initial distribution (Fig. 3k; Supplementary Video 3). Deleting the polyQ tract affected their assembly, as the light-induced optoMLL4_PrLDΔQ did not form detectable droplets, despite its expression level being similar to that of optoMLL4 (Fig. 3j; Extended Data Fig. 4j). Co-localization analyses showed that OptoMLL4 clustered with BRD4 and MED1 to the same extent as the endogenous proteins (Fig. 3l; Extended Data Fig. 4a). Based on these results, we conclude that MLL4 participates in the formation of transcriptional biomolecular condensates.
MLL4 LoF unbalances PcG compartments
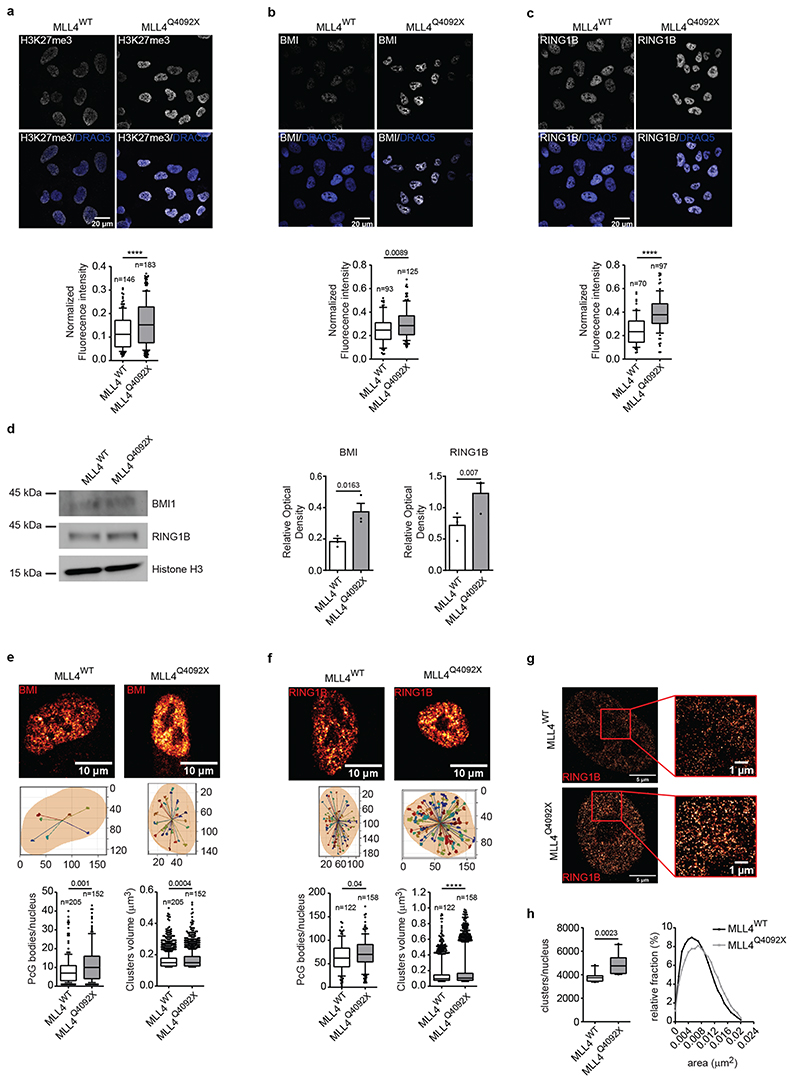
Given the genetic and functional antagonism between the TrxG and PcG complexes22, we investigated whether the transcriptional condensate perturbation caused by MLL4 LoF could affect the repressive compartments associated with PcG complexes. Quantitative immunofluorescence analyses showed that, although PRC2 component (EED, EZH2, SUZ12) protein levels were unaltered (Extended Data Fig. 5a), H3K27me3 deposition was increased (Fig. 4a). Analysis of the PRC1 complex components revealed increased RING1B and BMI1 signals, which were distributed in the condensates (Fig. 4b, c). We detected higher levels of both BMI1 and RING1B proteins, while their transcripts were unaltered (Fig. 4d; Extended Data Fig. 5b). Notably, MLL4P4093X MSCs and patient-derived fibroblasts also had similar enrichment of H3K27me3 and PRC1 components (Extended Data Fig. 5c–f). To determine the spatial organization of PcG foci, we measured the number and distribution of BMI and RING1B clusters within the nuclear volume of WT and MLL4Q4092X MSCs, and found that MLL4Q4092X MSCs contained a higher number of PcG foci with a similar distribution (Fig. 4e–f). STORM nanoscopy imaging of the PRC1 components supported these results. Quantitative analyses determined that RING1B formed heterogeneous clusters, whose abundance and dimensions were increased in MLL4Q4092X MSCs compared with that of WT MSCs (Fig. 4g, h).
Fig. 4. Polycomb clustering is affected by MLL4 LoF.
a-c Representative images and relative quantifications of immunostaining for H3K27me3 (a), BMI (b) and RING1B (c) in WT and MLL4Q4092X MSCs. Scale bar, 10 μm. Box plots indicate the median (middle line), the first and third quartiles (box), and the 10th and 90th percentile (error bars) of the fluorescence intensity of analyzed nuclei (n), as reported in figure. Unpaired two-tailed Student’s t-test was applied for statistical analysis (**** P < 0.0001).
d Western Blot analysis of BMI1 and RING1B in WT and MLL4Q4092X MSCs; histone H3 was used as loading control. Signal quantification for BMI and RING1B is reported. Data are means + SEM of 3 independent experiments; unpaired one-tailed Student’s t-test was applied for statistical analysis.
e-f Representative images of the distribution of BMI (e) and RING1B (f) clusters within the nuclear volume of WT and MLL4Q4092X MSCs (upper panel); scale bar, 10 μm. 3D reconstruction of the positioning of BMI and RING1B clusters with respect to the nuclear centroid (middle panel). Quantification of the number and volumes of BMI and RING1B clusters in individual nuclei of WT and MLL4Q4092X MSCs. Box plots indicate the median (middle line), the first and third quartiles (box), and the 10th and 90th percentile (error bars) of the fluorescence intensity of analyzed nuclei (n) as reported in figure. Unpaired two-tailed Student’s t-test was applied for statistical analysis (**** P < 0.0001).
g Representative STORM images of RING1B in WT and MLL4Q4092X MSCs; scale bar, 5 μm. Zoom-in on the indicated portion of the images inside the red square, highlighting the clustered distribution of Polycomb protein; scale bar, 1 μm.
h Analysis of the number of RING1B clusters measured in WT and MLL4Q4092X MSCs (left panel). Box plots indicate the median (middle line), the first and third quartiles (box), and the 10th and 90th percentile (error bars) of the clusters/nucleus; analyzed independent nuclei/sample n = 10. Representative distribution of the area of the RING1B clusters detected in WT and MLL4Q4092X MSCs (right panel); unpaired two-tailed Student’s t-test was applied for statistical analysis.
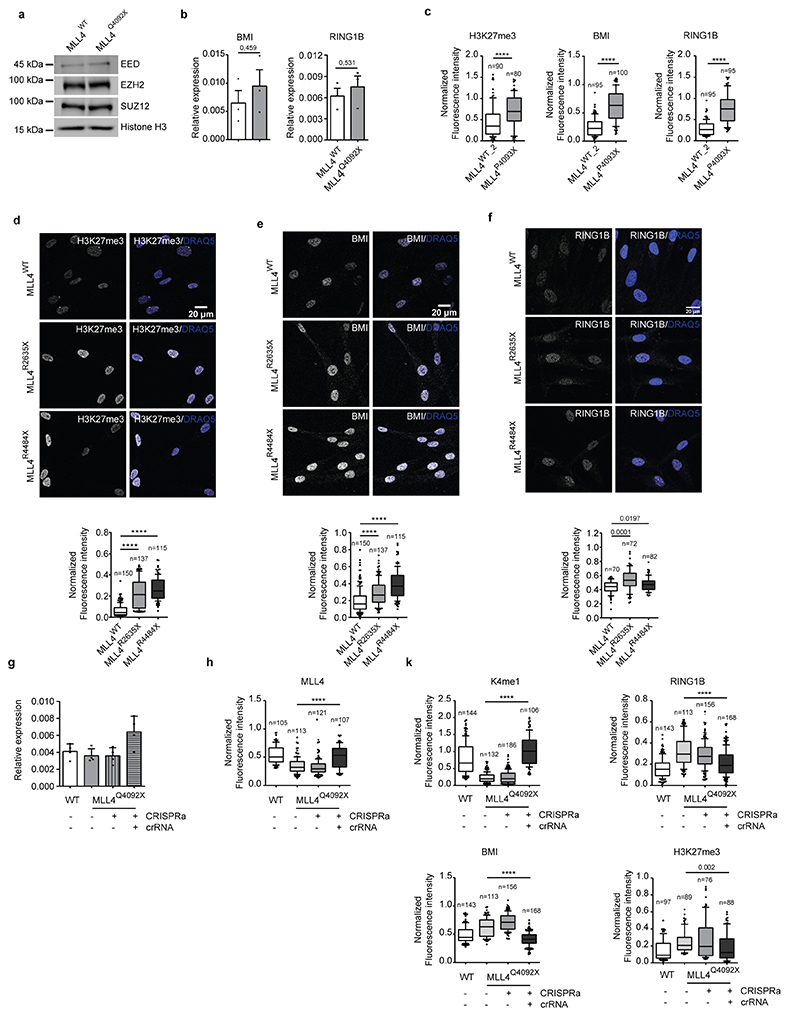
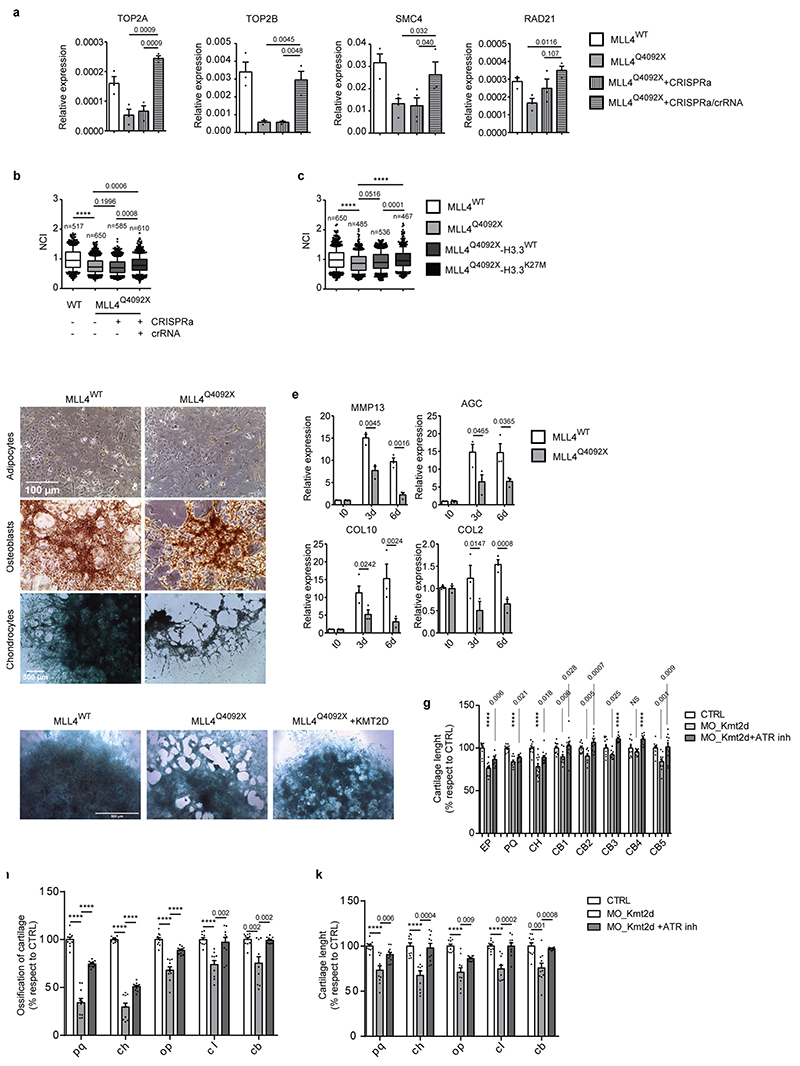
To ascertain whether the increased PcG clustering was dependent on MLL4 abundance, we rescued its expression in MLL4Q4092X MSCs via CRISPR-mediated gene activation (CRISPRa) (Extended Data Fig. 5g–k). Quantitative imaging analyses showed that the transient re-establishment of MLL4 protein levels counteracted the augmented PcG clustering and H3K27me3 deposition (Extended Data Fig. 5k). These data indicate that MLL4 LoF affects repressive compartments, with increased PcG protein clustering.
MLL4 regulates nuclear mechanics and chromatin compaction
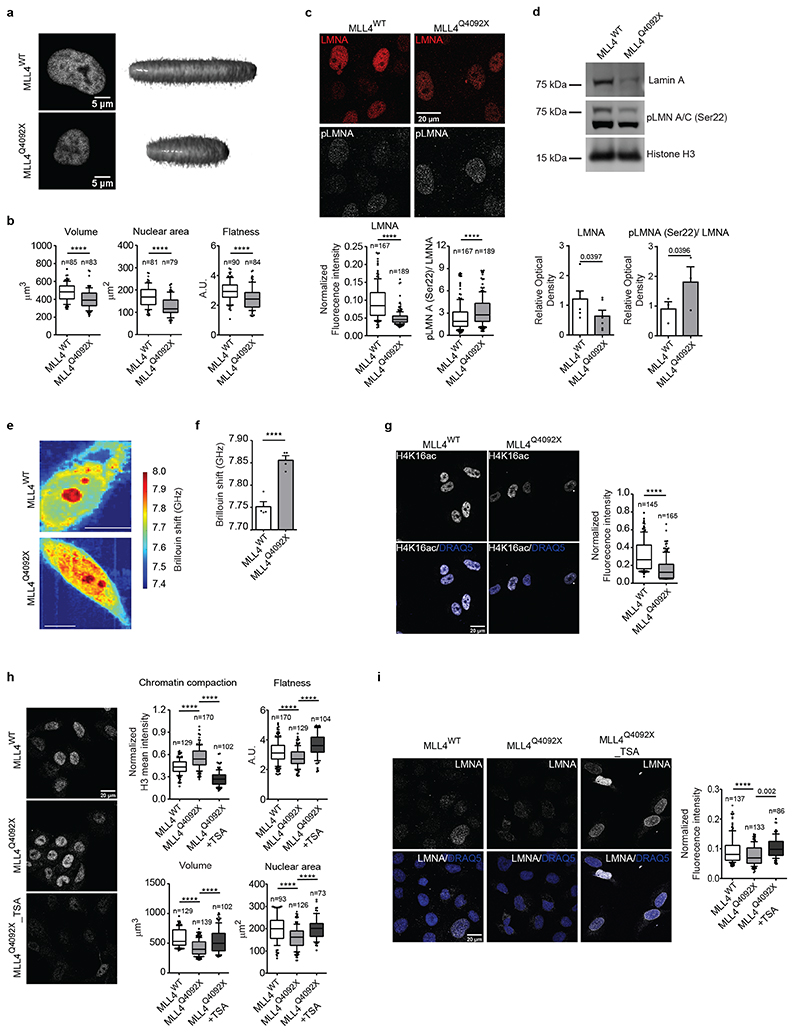
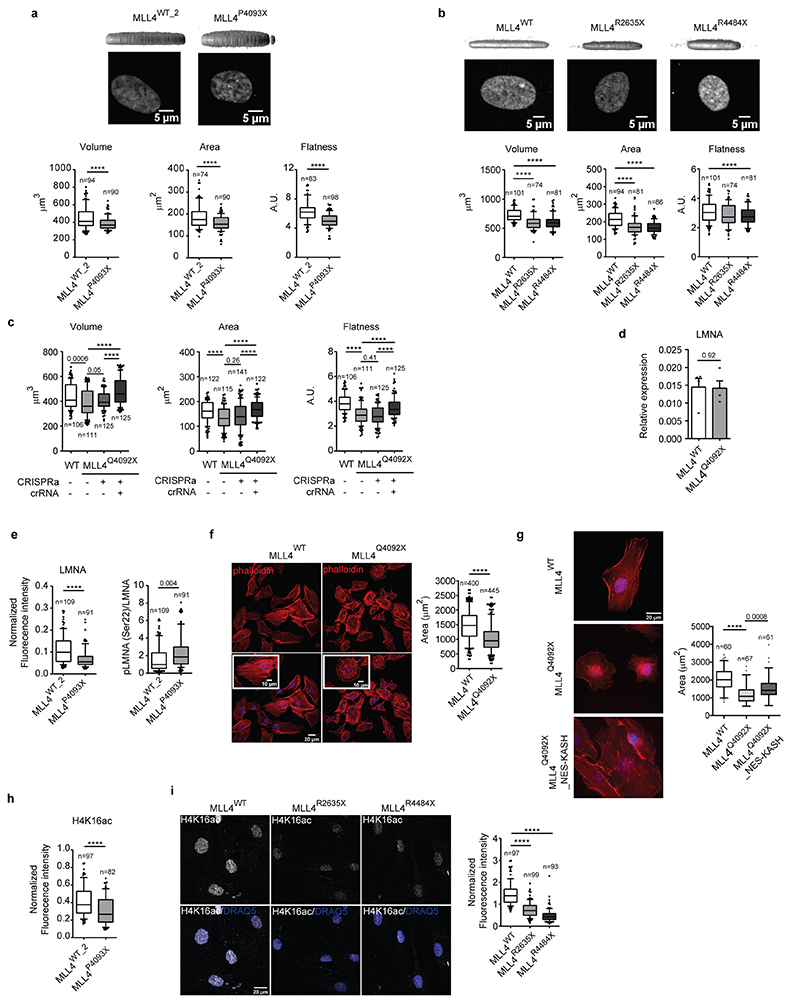
The results indicate that MLL4 LoF altered the balance between transcriptional and PcG condensates. Considering that chromatin dynamics exert forces that shape 3D genome folding and nuclear structure45,46, we analyzed the effects of MLL4 LoF on nuclear architecture and mechanics. The MLL4Q4092X MSCs had altered nuclear morphology as compared with the WT cells (Fig. 5a). There was a consistent reduction in nuclear area and volume, which resulted in decreased nuclear flattening (Fig. 5b; Extended Data Fig. 6a, b). Moreover, rescuing MLL4 via CRISPRa re-established the nuclear shape in the MLL4Q4092X MSCs (Extended Data Fig. 6c). These findings suggest that, although MSCs were grown in conditions favoring force transmission to the nuclei47, MLL4 LoF impacted nuclear architecture. To test this hypothesis, we assessed the relative protein level of lamin A/C, whose abundance is modulated in response to changes in tensile forces48. We found that although the lamin A/C transcript levels were unchanged (Extended Data Fig. 6d), MLL4Q4092X MSCs had reduced protein abundance compared to WT cells (Fig. 5c, d). Considering lamin A/C assembly and protein turnover balance changes in mechanical stresses, we determined their phosphorylation state, which is coupled with nuclear lamina organization49. We found that MLL4 LoF caused increased lamin A/C phosphorylation and protein turnover, resembling the pattern observed in low nuclear stress conditions49 (Fig. 5c, d; Extended Data Fig. 6e). To directly determine nuclear mechanical properties, we performed all-optical, label-free, non-invasive measurements by Brillouin microscopy50, where the high-frequency longitudinal elastic modulus can be determined in intact cells by measuring the Brillouin frequency shift. Here, the increased Brillouin shift indicated that MLL4Q4092X MSCs had increased nuclear stiffness compared to the WT cells (Fig. 5e, f). We then determined whether the alterations in nuclear architecture were coupled with perturbed cytoskeletal organization. We measured a decrease in the occupied cell area linked to reduced cytoskeletal fibers in the MLL4Q4092X MSCs (Extended Data Fig. 6f). As the LINC complex mediates cell/nucleus mechanical coupling, we investigated whether the altered intranuclear forces could determine the perturbed cytoskeletal organization in MLL4Q4092X MSCs. By overexpressing the dominant-negative GFP–Nesprin-1/2–KASH protein that interferes with the formation of a functional LINC complex, we observed partial rescue of cell size and proper actin polymerization (Extended Data Fig. 6g).
Fig. 5. MLL4 contributes to establish nuclear mechanical properties.
a High magnification images of nuclei of WT and MLL4Q4092X MSCs and reconstructed 3D images of nuclear shape. Scale bar, 5 μm.
b Quantification of nuclear volume, nuclear area and flatness of WT and MLL4Q4092X MSCs. Box plots indicate the median (middle line), the first and third quartiles (box), and the 10th and 90th percentile (error bars). The number of analyzed nuclei is reported in figure (n). Unpaired two-tailed Student’s t-test was applied for statistical analysis (**** P < 0.0001).
c Representative images and relative quantifications of immunostaining for LMNA/C and LMNA/C phosphorylated on Ser22 (pLMNA) in WT and MLL4Q4092X MSCs. Scale bar, 20 μm. Box plots indicate the median (middle line), the first and third quartiles (box), and the 10th and 90th percentile (error bars). The number of analyzed nuclei is reported in figure (n); unpaired two-tailed Student’s t-test was applied for statistical analysis (**** P < 0.0001).
d Western Blot analysis of LMNA and pLMNA/C in WT and MLL4Q4092X MSCs; histone H3 was used as loading control. Data are means + SEM of 6 independent experiments for LMNA and 3 independent experiments for pLMNA; unpaired one-tailed Student’s t-test was applied for statistical analysis.
e Representative maps of stiffness distribution in WT and MLL4Q4092X MSCs acquired with the Brillouin microscope: a higher Brillouin shift corresponds to stiffer portions of the cells. Scale bars, 10 μm.
f Bar plot representing nuclear Brillouin shift in WT and MLL4Q4092X MSCs. Data are means + SEM (n = 5 independent experiments); Student’s t-test was applied for statistical analysis (**** P < 0.0001).
g Representative images and relative quantifications of immunostaining for H4K16ac in WT and MLL4Q4092X MSCs. Scale bar, 20 μm. Box plots indicate the median (middle line), the first and third quartiles (box), and the 10th and 90th percentile (error bars) of the fluorescence intensity. The number of analyzed nuclei is reported in figure (n). Unpaired two-tailed Student’s t-test was applied for statistical analysis (**** P < 0.0001).
h-i Representative images and relative quantifications of nuclear physical properties (h) and Lamin A/C (i) in WT and MLL4Q4092X MSCs, untreated or treated with TSA (1.5 μM for 24 h). The relative level of chromatin compaction was determined as the ratio of the sum intensity of H3 signal, with respect to the nuclear volume. Scale bar, 20 μm. Box plots indicate the median (middle line), the first and third quartiles (box), and the 10th and 90th percentile (error bars). The number of analyzed nuclei is reported in figure (n). Unpaired two-tailed Student’s t-test was applied for statistical analysis (**** P < 0.0001).
We then examined whether the mechanical stresses detected in MLL4Q4092X MSCs were associated with changes in chromatin compaction. We measured the relative level of H4K16ac, which controls chromatin structure by weakening internucleosomal interactions51. Immunofluorescence analyses showed decreased H4K16ac in MLL4Q4092X MSCs and in patient-derived fibroblasts (Fig. 5g; Extended Data Fig. 6h, i). Treatment of MLL4Q4092X MSCs with a histone deacetylase inhibitor (TSA) rescued the altered chromatin organization and nuclear architecture (Fig. 5h, i). Specifically, TSA treatment re-established proper nuclear morphology and structure in MLL4Q4092X MSCs, as shown by the relative abundance of lamin A/C (Fig. 5h, i). In sum, these findings show that MLL4 LoF causes nuclear mechanical stress by affecting chromatin organization and nuclear architecture.
Polycomb clustering impinges on nuclear architecture
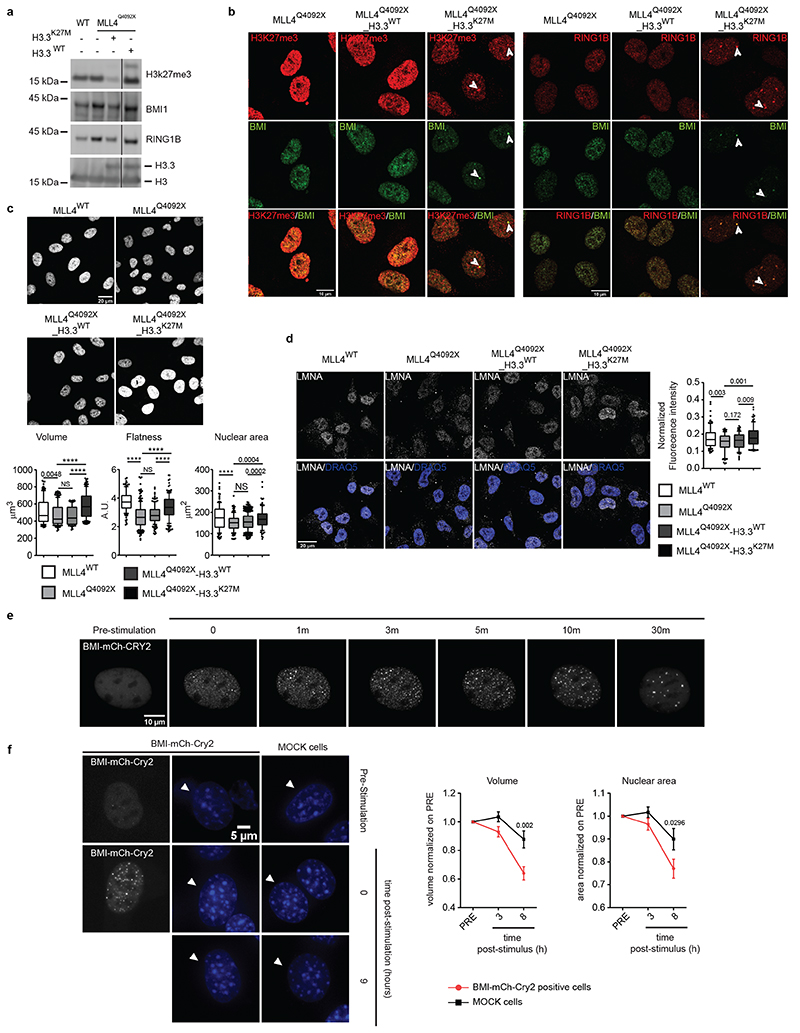
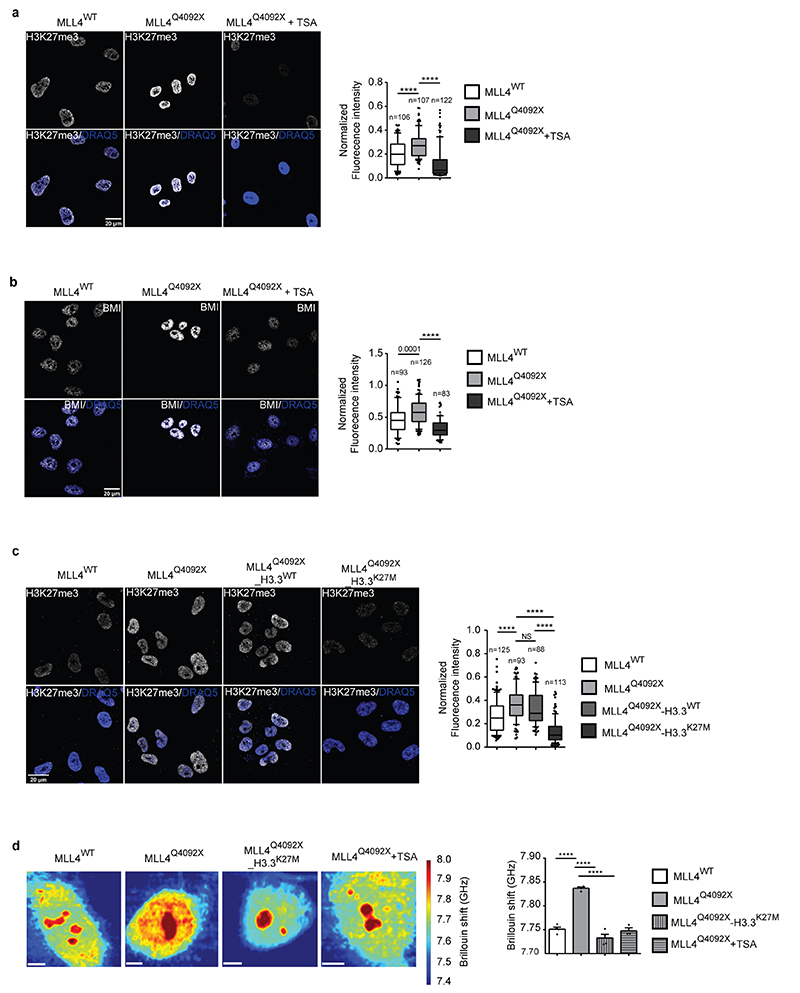
Besides altering nuclear morphology, we noted that TSA treatment reduced H3K27me3 and PcG condensate levels in MLL4Q4092X MSCs (Extended Data Fig. 7a, b), suggesting that their relative abundance could be coupled with chromatin compartmentalization and nuclear mechanics. To test this, we rescued PcG clustering in MLL4Q4092X MSCs by overexpressing histone H3.3 carrying a K27M mutation (H3.3K27M), which has a dominant negative effect on PcG activity52. H3.3K27M overexpression reduced H3K27me3 levels in the MLL4Q4092X MSCs and re-established BMI1 and RING1B protein abundance (Fig. 6a; Extended Data Fig. 7c). Visualization of PcG protein distribution in the presence of H3.3K27M showed that both BMI1 and RING1B clusters were strongly reduced, with few remaining larger foci marked by H3K27me3 (Fig. 6b). MLL4Q4092X MSCs expressing H3.3K27M showed increased nuclear volume and area, with nuclear flattening similar to that in WT MSCs (Fig. 6c). These changes were coupled with increased lamin A/C protein, re-establishing the nuclear architecture (Fig. 6d). Brillouin frequency shift measurement determined that H3.3K27M expression and TSA treatment rescued the increased nuclear stiffness in MLL4Q4092X MSCs (Extended Data Fig. 7d).
Fig. 6. Role of PcG in determining nuclear architecture.
a Western Blot analysis of BMI, RING1B and H3K27me3 in WT, MLL4Q4092X, H3.3WT or H3.3K27M-transduced MLL4Q4092X MSCs; histone H3 was used as loading control.
b Representative images of immunostaining for BMI, RING1B and H3K27me3 in WT, MLL4Q4092X, H3.3WT- and H3K27M-transduced MLL4Q4092X MSCs. Merged images are shown; white arrows indicate sites of co-localization. Scale bar, 10 μm.
c Representative images and relative quantifications of nuclear shape stained with DNA dye DRAQ5 in WT (n = 127), MLL4Q4092X (n = 114) or MLL4Q4092X MSCs expressing either H3.3WT (n = 101) or H3.3K27M (n = 117). Scale bar, 20 μm. The nuclear area, volume and flattening were determined and are represented as boxplots, indicating the median (middle line), the first and third quartiles (box), and the 10th and 90th percentile (error bars). n = number of analyzed nuclei; unpaired two-tailed Student’s t-test was applied for statistical analysis (** P < 0.005; *** P < 0.001; **** P < 0.0001).
d Representative images and relative quantifications of immunostaining for LMNA/C in WT (n = 125), MLL4Q4092X (n = 93) or MLL4Q4092X MSCs expressing either H3.3WT (n = 88) or H3.3K27M (n = 113). Scale bar, 20 μm. Box plots indicate the median (middle line), the first and third quartiles (box), and the 10th and 90th percentile (error bars) of the fluorescence intensity. n = number of analyzed nuclei; unpaired two-tailed Student’s t-test was applied for statistical analysis.
e Representative images of blue light-induced clustering of BMI-mCherry-Cry2 at different time points in NIH 3T3 cells. Cells were stimulated for 1 second with 488-nm light followed by image acquisition; scale bar, 10 μm.
f Representative images of stained nuclei of NIH 3T3 cells expressing BMI-mCherry-Cry2 before and after blue light stimulation. For comparison, stained nuclei of non-transfected cells are shown. Clustering of BMI-Cry2 in response to stimulation is shown; scale bar, 5 μm.
g Distribution of the normalized (respect to the first time point post stimulation T = 0) area and volume of mock NIH 3T3 cells (n = 49) or NIH 3T3 cells expressing BMI-mCherry-Cry2 (n = 48), before and after blue light stimulation. Data are represented as mean ± SEM. n = analyzed nuclei; unpaired two-tailed Student’s t-test was applied for statistical analysis.
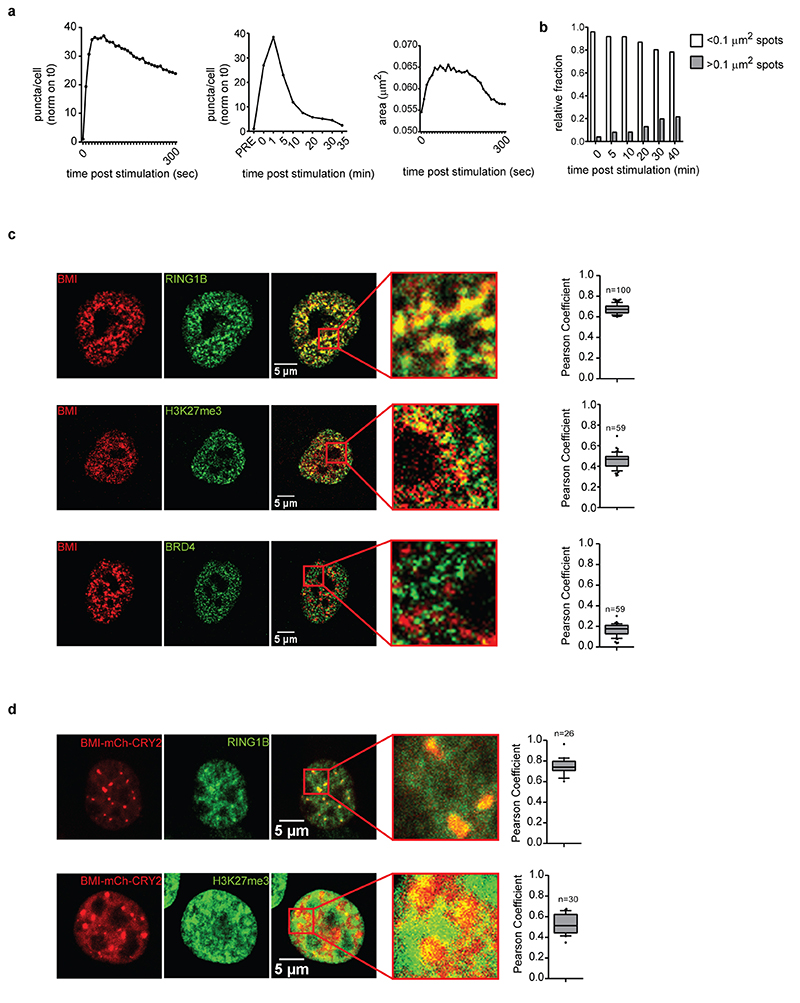
To examine whether PcG-mediated compartmentalization represents a driving force establishing nuclear mechanics, we adopted an optogenetic approach to induce BMI1 clustering in living cells. Measurement of the light-induced clustering of BMI1-Cry2 showed that a single pulse of blue light drove the formation of relatively stable BMI1 clusters, with a lifetime of 12 minutes (Fig. 6e; Extended Data Fig. 8a, b; Supplementary Video 4). The light-induced condensates were enriched at PcG binding sites as BMI1-Cry2 co-localized with RING1B and H3K27me3, similar to that detected for the endogenous proteins (Extended Data Fig. 8c, d). Importantly, prolonged light stimulation drove consistent PcG clustering, which determined altered nuclear shape, as measured by the decreased nuclear volume and area (Fig. 6f, g). Taken together, these findings show that PcG-mediated chromatin compartmentalization affects the nuclear architecture.
MLL4 restricts the mechanoresponsiveness of MSCs
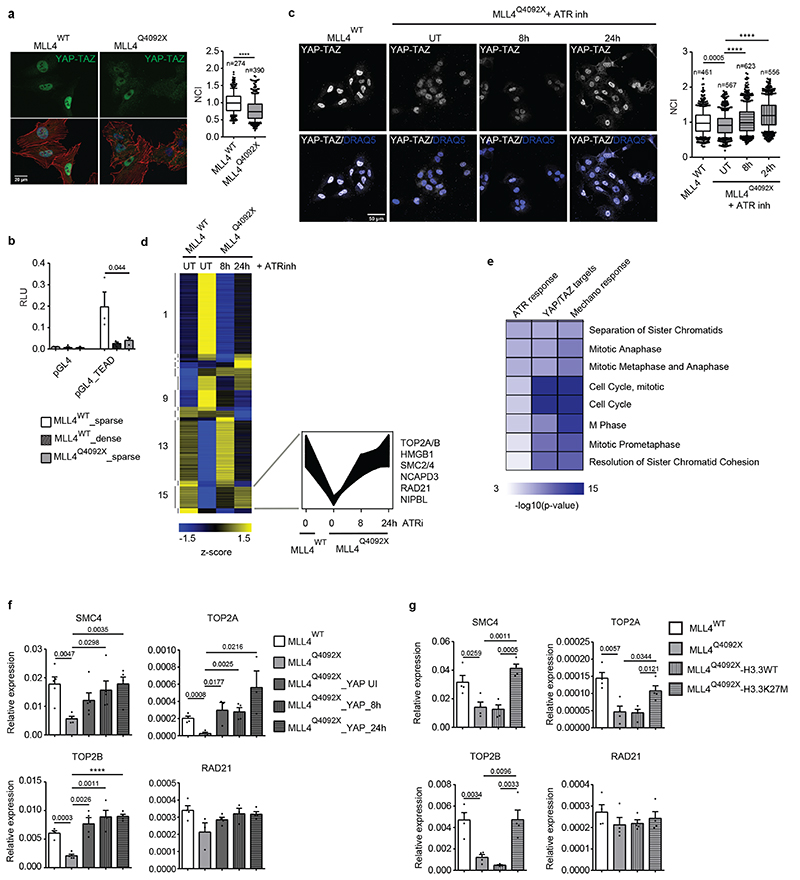
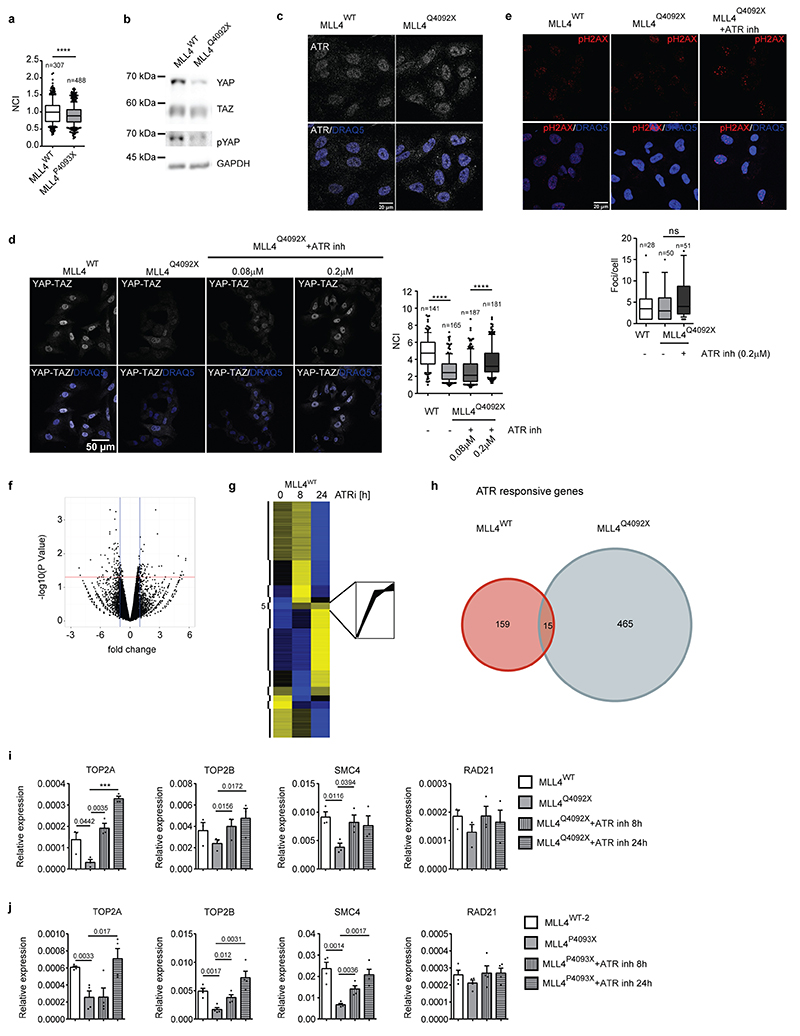
We investigated whether the alterations in nuclear architecture driven by the unbalanced transcription-associated and PcG condensates would affect MSC mechanoresponsiveness. We measured the cellular distribution of the mechanoeffectors YAP1/TAZ, whose nuclear accumulation depends on mechanical forces32,47,53. Comparison of the cellular distribution of YAP/TAZ in WT versus MLL4Q4092X MSCs showed that MLL4 LoF was associated with reduced nuclear YAP/TAZ independently of the Hippo pathway (Fig. 7a; Extended data Fig. 9a, b). Notably, the mechanically induced YAP/TAZ nuclear localization was mirrored by augmented YAP/TAZ transcriptional activity, which was reduced in MLL4Q4092X MSCs (Fig. 7b). To ascertain whether the reduced YAP/TAZ nuclear shuttling was caused by the altered nuclear mechanics of MLL4Q4092X MSCs, we blocked the nuclear mechanosensor ATR with a specific inhibitor, VE-822 (Extended Data Fig. 9c)54,55. VE-822 treatment restored YAP/TAZ nuclear localization in MLL4Q4092X MSCs without increasing DNA damage (Fig. 7c; Extended Data Fig. 9d, e). To identify the genes responsive to ATR inhibition (ATRi) in the context of augmented nuclear mechanical stress, we performed gene expression profiling of MSCs after VE-822 treatment. Differential expression analyses showed that a relatively small subset of genes were deregulated in MLL4Q4092X MSCs compared to WT MSCs (Extended Data Fig. 9f, Supplementary Table 1). Nevertheless, gene clustering analyses identified a subset of ATR-responsive genes whose expression was specifically rescued in the MLL4Q4092X MSCs by ATRi (Fig. 7d; Extended Data Fig. 9g, h). Gene ontology analyses showed that this cluster was enriched for chromatin architectural genes, which are involved in mitosis (Fig. 7e; Extended Data Fig. 9i–k;). Analysis of both the YAP/TAZ target genes and the mechanoresponsive genes identified similar enrichment (Fig. 7e; Supplementary Table 2)56,57. Importantly, their transcriptional modulation was dependent on the abundance of MLL4, as shown by CRISPRa re-establishment of KMT2D expression levels (Extended Data Fig. 10a). In the same setting, we also found that YAP/TAZ nuclear accumulation was re-established upon MLL4 rescue (Extended Data Fig. 10b). Together, these findings suggest that the ATR-responsive genes could represent downstream targets of the mechanosensor YAP.
Fig. 7. MLL4 contributes to establish nuclear mechanical properties.
a Representative images and relative quantifications of immunostaining for YAP/TAZ in WT and MLL4Q4092X MSCs, maintained on sparse condition on stiff substrate. F-actin is stained with Phalloidin. Scale bar, 20 μm. Box plots indicate the median (middle line), the first and third quartiles (box), and the 10th and 90th percentile (error bars). The number of analyzed nuclei is reported in figure (n). Unpaired two-tailed Student’s t-test was applied for statistical analysis (**** P < 0.0001).
b Luciferase assay to measure the transcriptional activity of YAP/TAZ in WT and MLL4Q4092X MSCs, after transfecting the empty or YAP/TAZ reporter 8XGTIIC‐luc vector. Normalized data are means + SEM (n = 4 independent experiments); unpaired two-tailed Student’s t-test was applied for statistical analysis.
c Representative images and relative quantifications of immunostaining for YAP/TAZ in WT and MLL4Q4092X MSCs untreated or treated with ATR inhibitor VE-822 (0.2μM), at the indicated time points. Scale bar, 20 μm. Box plots indicate the median (middle line), the first and third quartiles (box), and the 10th and 90th percentile (error bars). The number of analyzed nuclei is reported in figure (n). Unpaired two-tailed Student’s t-test was applied for statistical analysis **** P < 0.0001).
d Heat map of k-means clustering analysis of expressed genes in WT and MLL4Q4092X MSCs untreated or treated with ATR inhibitor VE-822 (0.2 μM), at the indicated time points. In the lower panel, the expression pattern of ATR-responsive genes is shown.
e Heat map showing GO analysis terms of ATR-responsive genes, YAP/TAZ targets and mechano-responsive genes.
f qRT-PCR of the indicated genes in WT and MLL4Q4092X MSCs untreated or treated with doxycycline to induce the exogenous expression of YAP1. The expression level was normalized on GAPDH transcript level. Data are means + SEM (n = 4 independent experiments); unpaired two-tailed Student’s t-test was applied for statistical analysis (**** P < 0.0001).
g qRT-PCR of the indicated genes in WT and MLL4Q4092X MSCs expressing either H3.3WT or H3.3K27M. The expression level was normalized on GAPDH transcript level. Data are means + SEM (n = 4 independent experiments); unpaired two-tailed Student’s t-test was applied for statistical analysis.
To test this hypothesis, we induced transient YAP overexpression in MLL4Q4092X MSCs. Here, we measured increased expression levels of the chromatin architectural genes such as TOP2A, TOP2B, the condensin factors SMC2/4, and the cohesin component RAD21 (Fig. 7f). To verify whether the YAP/TAZ transcriptional regulation of the ATR-responsive genes relies on the nuclear mechanical stress caused by PcG hyperactivity, we rescued its functionality by overexpressing H3.3K27M in MLL4Q4092X MSCs. Besides re-establishing the nuclear abundance of YAP/TAZ (Extended Data Fig. 10c), chromatin architectural gene expression levels were rescued as well (Fig. 7g). These findings indicate that ATR modulates YAP/TAZ nuclear accumulation and the expression of key factors involved in chromatin organization and compaction.
ATRi re-established MSC lineage commitment towards chondrocytes and osteocytes
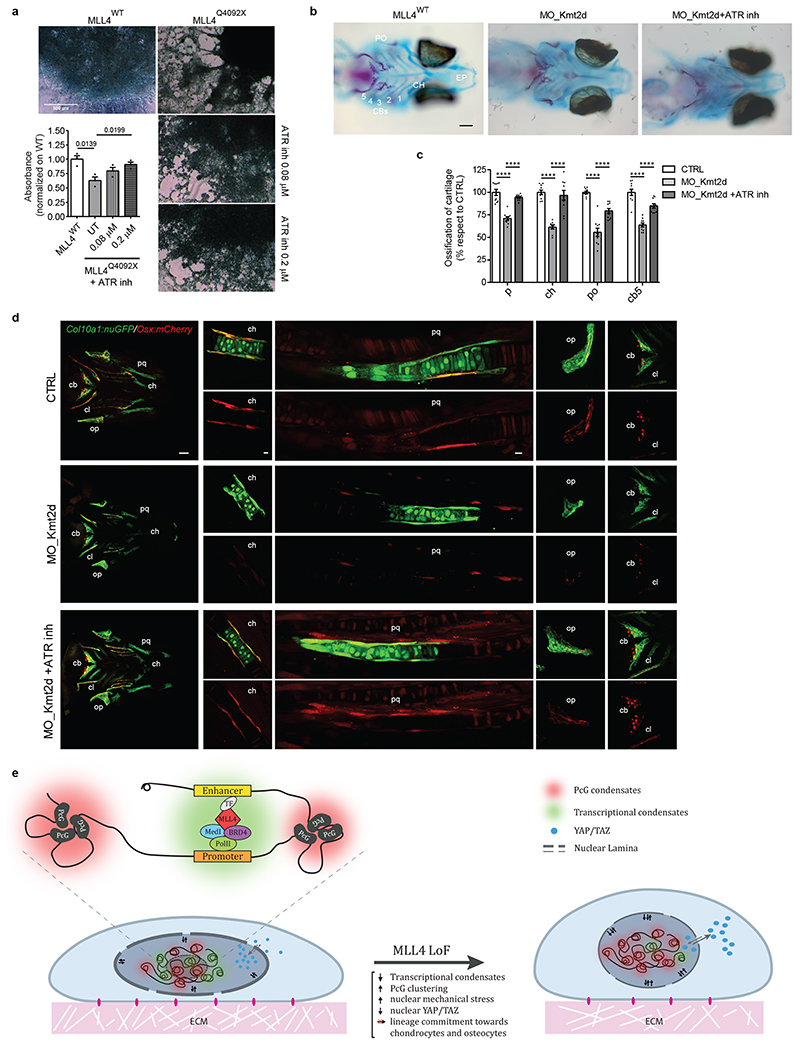
To establish the biological relevance of these results, we determined whether MLL4 LoF affected MSC mechanoresponsiveness during differentiation. We found that, although the differentiation potential of MLL4Q4092X MSCs towards adipocytes was unaltered, their commitment towards chondrocytes was strongly affected, while osteogenesis was partially impaired (Extended Data Fig. 10d, e). Notably, exogenously expressing MLL4 rescued the altered chondrogenesis (Extended Data Fig. 10f); ATRi partially rescued the chondrogenic differentiation potential of the MLL4Q4092X MSCs (Fig. 8a).
Fig. 8. MLL4-dependent mechanical properties in cell lineage commitment.
a Representative image of WT and MLL4Q4092X MSCs untreated or treated with different concentrations of ATR inhibitor (VE-922), after differentiation towards chondrocytes. Scale bar, 500 μm. Deposition of extracellular matrix and organization into a 3D network was detected by Alcian blue staining and quantified. Data are means + SEM (n = 3 independent experiments); unpaired two-tailed Student’s t-test was applied for statistical analysis.
b Alcian blue (cartilage) and alizarin Red (bone) staining of Ctrl, KMT2D 5’UTR-morpholino and VE822-treated KMT2D 5’UTR-morpholino medaka fish. Scale bar, 100μm.
c Bar plot of the relative quantification of Parasphenoid (P), Ceratohyal (CH), Paired Prootics (PO), Ceretobranchial 5 (CB5) mineralization in Ctrl, KMT2D 5’UTR-morpholino and KMT2D 5’UTR-morpholino-treated with ATR inhibitor. Values were expressed as percentage relative to the control. Data are means ± SEM (n = 10 biologically independent animals); Student’s t-test was applied for statistical analysis (**** P < 0.0001).
d Distribution of Col10a1:nuGFP- and Osx:mCherry-expressing premature osteoblasts in Ctrl (upper panels), KMT2D 5’UTR-morpholino (central panels) and VE822-treated KMT2D 5’UTR-morpholino medaka fish (lower panels). Scale bar: 100 μm.
e Schematic representation of MSCs alterations in response to MLL4 LoF. The upper panel represents the postulated interplay between transcription-associated and PcG condensates. The 3D chromatin compartmentalization, the intra-nuclear forces and the YAP/TAZ shuttling are shown in the representative cartoon.
To support the notion that targeting ATR can re-establish the mechanical responsiveness of MSCs in KS, we tested the capacity of ATRi for rescuing chondrogenesis and skeletogenesis in vivo. We developed an in vivo KS model by knocking down olKmt2d in medaka fish, with a specific morpholino (MO) directed against the ATG initiation codon within the 5′ untranslated region (MO-Kmt2d). At the late developmental stages, most of the MO-Kmt2d embryos had a clearly visible spectrum of morphological craniofacial anomalies (73 ± 5% of 1,600 injected embryos). Cartilage and bone growth were significantly impaired, culminating in obviously shorter length at St40 (Fig. 8b). Similar to that described in zebrafish58,59, the MO-Kmt2d morphants exhibited smaller heads with dysmorphism, resembling the clinical features of KS patients (Fig. 8b, c; Extended Data Fig. 10g). Importantly, ATRi of St34 Kmt2d morphants was sufficient for restoring the chondrogenic and skeletal defects, rescuing proper head morphogenesis without evidence of adverse effects or toxicity (Fig. 8b, c; Extended Data Fig. 10g).
To better characterize the chondrogenesis and skeletogenesis defects in MLL4 morphant larvae, we used a transgenic medaka line (Col10a1:GFP/Osx:mCherry), in which chondrocytes and osteoblasts are detected by GFP and mCherry expression, respectively60. Double-positive cells mark sites of ongoing intramembranous osteogenesis (operculum, cleithrum, fifth ceratobranchial cartilage), while perichondral ossification (palatoquadrate and ceratohyal) are mark by GFP-positive chondrocytes surrounded by mCherry-positive osteoblasts. In the MO-Kmt2d morphants, both perichondral and intramembranous ossification were affected, with decreased Osx:mCherry osteoblastic cells (Fig. 8d; Extended Data Fig. 10h–k). Notably, ATRi rescued the altered chondrogenesis and skeletogenesis, re-establishing the pattern of cell lineage commitment (Fig. 8d; Extended Data Fig. 10h–k). Together, these results indicate that targeting ATR in KS model systems is sufficient for restoring proper chondrogenesis and skeletogenesis both in vitro and in vivo.
Discussion
The forces driving genome spatial organization and how chromatin compartmentalization modulates both the genetic and non-genetic functions of the genome represent key questions that have been poorly addressed.
By developing a stem cell-based KS disease model, we show that MLL4 maintains equilibrium between transcription-associated and PcG condensates, which is required for preserving nuclear mechanical properties (Fig. 8e). MLL4 LoF caused a PcG-mediated increase in nuclear mechanical stress, affecting YAP/TAZ nuclear accumulation and consequently the transcriptional regulation of its targets, including the cohesin and condensin genes (Fig. 8e). ATRi rescued the MLL4-dependent mechanical stress, permitting proper MSC commitment towards chondrocytes both in vitro and in vivo. These findings support the notion that nuclear inward forces driven by chromatin compartmentalization contribute to MSC responsiveness to mechanical stimuli, guiding their differentiation program.
Here, we provide evidence that MLL4 plays a central role in establishing transcriptional condensates, which balance the PcG-mediated repressive chromatin context. We showed that MLL4 phase-separates in droplets, whose assembly depends on its PrLD. As this domain is codified by a genomic region whose clinical variants associate with a pathogenic setting in KS, our findings highlight the potential relevance of the PrLD-driven clustering of MLL4 in tuning its biological activity. These results highlight a distinct function of MLL4, which contributes to control of the dynamic composition of transcriptional condensates and their interplay with other chromatin compartments (Fig. 8e). We show that MLL4 abundance is critical for proper transcriptional condensate assembly, as its haploinsufficiency impinged on MED1 and BRD4 clustering. These results suggest that MLL4 may work as a scaffold protein for transcriptional condensate nucleation, favoring the dynamic recruitment of cofactors and activators.
We also show that MLL4 LoF was mirrored by the redistribution of PcG proteins, affecting their clustering in PcG bodies. The increased PcG activity could depend on different mechanisms, including the BMI1-mediated increase of RING1B protein stability and enzymatic activity22. Besides maintaining a repressive chromatin state22, PcG plays a central role in establishing long-range interactions, contributing to the determination of genome architecture and chromatin compaction61,62,63,64,65. Importantly, these PcG-mediated interactions occur within an active chromatin environment, suggesting possible interplay between TrxG and PcG components in shaping chromatin folding. Our findings indicate that part of the antagonistic action of MLL4 and PcG complexes could rely on their function on genome architecture and chromatin compartmentalization. We propose that the frequency of PcG-mediated long-range interactions is modulated by the clustering of transcriptional condensates, which are interspersed within the active chromatin compartments (Fig. 8e).
Besides permitting the establishment of a certain chromatin state, we found that MLL4 is required for modulating the non-genetic function of the genome, namely exerting mechanical forces that shape nuclear architecture. MLL4 LoF caused increased chromatin compaction and nuclear stiffness, which was counterbalanced by decreased lamin A/C levels. Furthermore, our data indicate that PcG-mediated chromatin clustering represents a driving force for tuning nuclear mechanics. These data shed light on the impact of chromatin compartmentalization on nuclear architecture and its responsiveness to mechanical cues. Although environmental mechanical forces lead to chromatin rearrangement depending on PcG activity66, recent evidence supports the notion that inward forces generated by chromatin organization modulate nuclear mechanics and architecture67,68,69,70 (Fig. 8e). In this context, it would be relevant to establish whether the proposed therapeutic regime for KS, which is based on enhancing chromatin opening71,72, may re-establish proper chromatin compartmentalization, thereby decreasing nuclear mechanical stress. Here, we propose that inhibiting ATR could represent a novel therapeutic option for re-establishing nuclear mechanical properties and responsiveness to mechanical stimuli by re-establishing YAP/TAZ activity. Further investigations are required to define the clinical relevance of our findings, with the intent of attenuating some of the pathological conditions affecting KS patients.
Methods
Cell culture conditions
Cell lines used in this study include NIH 3T3 (ATCC), HEK293T (ATCC), human primary fibroblasts derived from either healthy or Kabuki patients (Genomic and Genetic Disorders Biobank-Medical Genetic Unit, IRCCS Casa Sollievo della Sofferenza, San Giovanni Rotondo, Italy) and hTERT-immortalized human adipose-derived MSCs, a king gift from Dr. Peter Tatrai73. Primary fibroblasts, NIH 3T3 and HEK293T cells were maintained at 37°C and 5% CO2 in DMEM medium supplemented with 10% Fetal Bovine Serum (Euroclone #ECS0180L), while MSCs were cultured in 1:1 DMEM/F-12 medium (Gibco #11320-074) supplemented with 10% Fetal Bovine Serum (Euroclone #ECS0180L).
For adipocyte differentiation, cells were seeded at a density of 1 × 10⁴ cells/cm2 in MSCs medium. The day after, medium was changed with adipogenesis medium (Gibco #A10410-01) supplemented with Stem-Pro Adipogenesis supplement (Gibco #10065-01). For complete differentiation, cells were maintained in culture for three weeks changing media regularly.
For osteoblasts differentiation, cells were seeded at a density of 5 × 10³ cells/cm2 in MSCs medium. The day after, medium was changed with osteogenesis medium (Gibco #A10069-01) supplemented with Stem-Pro Osteogenesis supplement (Gibco #10066-01). For complete differentiation, cells were maintained in culture for three weeks changing media regularly.
For chondrocyte micromass culture, a cell solution of 1.6 × 10⁷ viable cells/ml was produced. Micromass cultures were generated by seeding 5-μl droplets of cell solution. After cultivating micromass cultures for 2 hours under high humidity conditions, MSCs medium was added. The day after, the medium was changed with chondrogenesis medium (Gibco #A10069-01) supplemented with Stem-Pro Chondrogenesis supplement (Gibco #10064-01). For complete differentiation, cells were maintained in culture for three weeks changing media regularly.
CRISPR/Cas9-mediated genome editing
sgRNAs were designed using the online tool e-Crisp (http://www.e-crisp.org/E-CRISP/). Once designed, they were cloned in the pLX sgRNA vector (from Addgene, #50662). Briefly, new target sequences were cloned into pLX sgRNA between the XhoI and NheI sites using overlap-extension PCR followed by restriction/ligation into pLX sgRNA vector. MSCs were genome-edited by expression of the doxycycline inducible Cas9 (pCW Cas9, Addgene #50661) combined with sgRNA construct, followed by puromycin and blasticidin selection. Clonal selection was performed to identify targeted cells. Genomic DNA was collected from different clones and subjected to surveyor assay (using the T7 endonucleases, NEB #M0302). Positive clones were selected and sequenced to determine the insertion of the truncating mutation. The oligonucleotides used in this work for the generation of sgRNAs containing plasmids are listed in Supplementary Table 3.
Epigenetic rescue of MLL4 expression
Putative promoter region was identified though UCSC genome browser on data coming from Human Bone Marrow-derived Mesenchymal Stem Cells. The region identified was chr12; 49,453,096-49,455,679. To identify the sequences recognized by the crRNAs, we used CRISPR RGEN Tools-Cas9 designer with this PAM sequence 5’-TTTN-3’. These sequences were cloned into the plasmid BPK3082 (Addgene #78742): for each crRNAs, a pair of complementary oligonucleotides, containing the desired sequence, were synthesized adding 4-bp adapters (as described in Supplementary Table 3). Single LbCpf1 crRNA expression plasmids were constructed by ligating annealed oligo duplexes into Esp3I-digested BPK3082 plasmid. For the transcription activation we used the dLbCpf1-VPR plasmid (Addgene #104567).
For each experiments, cells were subjected to nucleofection (Lonza Kit LOV4XP1032) with the dLbCpf1-VPR and the LbCpf1 crRNA expression plasmids with the 3:1 ratio. 48 h after the nucleofection, cells were replated for RNA extraction or immunofluorescence analysis. After another 24 hours, cells were collected for RNA extraction and analysis. After additional 48 h hours, cells were fixed for immunofluorescence analysis.
DNA constructs
The mCherry-Cry2 sequence was PCR amplified from the pHR-mCherry-MED1_IDR-CRY2, a gift from the Young laboratory (Sabari et al., 2018), and cloned between the XhoI and NotI sites in the pCAG vector with or without the insertion of a SV40 NLS al the 3’ of CRY2.The MLL4 PrLD region (from amino acid 3,560 to 4,270) was PCR amplified and cloned between the XhoI and NheI sites in the expression vector pCAG mCh-CRY2-NLS. The MLL4 PrLD ΔQ region was obtained by overlap-extension PCR and cloned between the XhoI and NheI sites in the pCAG mCh-CRY2-NLS vector. The mouse BMI coding sequence was PCR amplified and cloned between the EcoRV and SpeI sites in the expression vector pCAG mCh-CRY2. The oligonucleotides used in this work for cloning are listed in Supplementary Table 3.
Stable cell lines
MSCs expressing mCh-MED1-CRY2 were obtained transducing WT and mutant MSCs with the lentiviral vector pHR mCh-MED1-Cry2.
MSCs expressing histone H3.3K27M were obtained transducing mutant MSCs with the lentiviral vector pCDH-EF1-MCS-IRES-PURO-H3.3K27M (gift from the Allis laboratory). MSCs overexpressing YAP were obtained transducing mutant MSCs with the lentiviral vector FUW tetO YAP (Addgene #84009).
Immunofluorescence
For immunofluorescence assays, cells were seeded on coverslips coated with 0,1% gelatin (Sigma Aldrich # G1393). When needed, cells where fixed with 4% paraformaldehyde for 10 minutes at 4°C. Coverslips were processed as described: permeabilization and blocking with PBS/1% BSA/5% goat serum/0.5% Triton X-100 (blocking solution) for 1 hour at room temperature, followed by incubation with primary antibody (diluted in the blocking solution) for 2 hours at RT (or overnight at 4°C, depending on the used primary antibody), 3-5 washes in PBS and incubation with secondary antibodies (diluted in the blocking solution), DRAQ5 for nuclear staining and phalloidin-TRITC for 1 h at room temperature. Images were acquired using a Leica TCS SP5 confocal microscope with HCX PL APO 63×/1.40 objective. Confocal z stacks were acquired with sections of 0.5 μm. In cases where image analysis was performed, random sampling was performed while image acquisition settings were kept constant. The antibodies used in this work are listed in Supplementary Table 4.
Confocal imaging data analyses
Confocal imaging data analyses were performed using Image J software. For 2D/3D analysis DRAQ5 DNA dye was used to identify the nucleus and define the ROI. The fluorescence intensity and physical parameters were determined. The values of the fluorescence intensity were background subtracted and normalized with respect to DRAQ5 fluorescence intensity. For the measure of volume and flatness we performed a 3D analysis using the “3D plugin suite”, an Image J plugin. For the co-localization analysis, the Image J plugin JACoP was used. For each staining, the DRAQ5 signal was used to identify the nucleus as an area of interest on which the Pearson Coefficient was determined.
Quantification of nuclear to cytosolic localization of YAP/TAZ
To quantify the nuclear to cytosolic localization of YAP/TAZ, we adapted a MATLAB routine that is deposited in GitHub (https://github.com/SZambranoS/RoutinesNucCytoYAP). In short, images of the Hoechst and YAP/TAZ channels were saved as 16-bit tiffs files. To segment the nuclei, we used the signal from the Hoechst channel. The nuclear masking was performed using as a threshold the mean intensity of the image plus twice the standard deviation. After thresholding, segmentation was carried out after a watershed transformation, so most of the few overlapping nuclei could be separated. The segmented nuclei were filtered by size posteriori to exclude artefacts or improperly segmented clusters of nuclei. To estimate the average cytosolic intensity per cell, a ring of 30-pixel width (approximately 7 microns) around each segmented nuclei was found. Pixels of the ring with too low intensity of the YAP-TAZ signal (below twice the value of the background signal) are discarded. The average cytosolic signal for each cell is the average intensity of the remaining pixels. We then calculate for each cell the Nuclear to Cytosolic Intensity (NCI) as the ratio of the background-corrected nuclear and cytosolic average YAP-TAZ intensity.
2D cluster analyses
2D cluster analyses were performed using Image J software. For the 2D cluster analysis of MED1 and BRD4 background subtraction was applied. To calculate the background level, the mean of the minimum level of intensity of the specific staining was calculated among all the nuclei analyzed. Then, Unsharp Mask and Median filter were applied. The clusters were identified with the Yen Automatic Threshold and the intensity of each cluster was calculated redirecting the measurement on the unmodified images. 3D reconstructions of PBs are obtained through the connected components algorithm (bwconncomp MATLAB function, using a connectivity of 6).
The algorithm computes the number of PBs, the volume of any PB and the distances of the centroid of each PB from the nuclear periphery and the nuclear centroid.
Super-resolution microscopy
Super-resolution localization imaging of fixed and immunostained cells was obtained by direct stochastic optical reconstruction microscopy (dSTORM), using a GSD microscope (Leica SR GSD, Leica Microsystems, Mannheim, Germany) equipped with two solid state lasers of 532 nm and 642 nm, an oil immersion objective lens (HCX PL APO 150× 1.45NA), and an EMCCD camera (Andor iXon Ultra-897). All dSTORM experiments were performed with the Smart-kit buffer (Abbelight, France). To induce the majority of the fluorophores into the dark state, we excited the samples using the laser in a straight configuration. Once the density of fluorescent dye was sufficient, we activated the real-time localization using the laser in an oblique configuration (Hilo). For all recorded images, the integration time and the EMCCD gain were set to 8 ms and 300, respectively. For each samples we acquired 35,000 frames. The identification and localization of single events from raw images was run on the Leica software.
STORM images data analysis
The cluster analysis was performed with a custom written Matlab script following the routine described in Ricci et al. 74. Briefly, for each cell the localizations list was used to reconstruct a STORM image with pixel size of 20 nm. This image was used to exclude areas of very low localization density (density threshold = 0.0025 nm-2) and to identify the local maxima in the areas of higher density. Only localizations within high density regions are analyzed. The number and position of the maxima are used to initialize the centroids of the clusters. The subdivision of the localizations in clusters is performed by a machine learning k-mean algorithm which optimizes the grouping of localizations based on their proximity to the centroid of the cluster. The algorithm runs on the raw localizations coordinates. The area attributed to the cluster is the convex hull area associated to that set of localizations.
Live imaging and Optogenetics
Time-lapse video microscopy and single-cell tracking of MSCs and NIH 3T3 cells were carried out continuously for indicated time at 37°C and 5% CO2, using the Eclipse Ti2 fully automated system (Nikon). Images of fluorescent cells were acquired as indicated in figure legend with 100× or 60× Plan Apo λ objective (Nikon) using a LED illumination system combined with a CMOS camera (Andor) for the detection. Single-cell tracking was performed using the NIS software and videos were assembled using Image J software.
Live imaging data analysis
For the analysis of the optogenetics experiments, the NIS software was used.
Regarding the analyses of MED1 clusters, for each nucleus background correction and Gauss-Laplace sharpen filter was applied. A threshold was set such that clusters are identified after the stimulation. A single-cluster tracking was performed and the area of each cluster was determined.
Regarding the analyses of MLL4_PrLD and BMI clusters, for each nucleus background correction and Gauss-Laplace sharpen filter was applied. The “bright spot detection” function was used to identify the single clusters. The threshold parameter was determined in order to identify as individual objects clusters in close proximity to one another.
Medaka fish
The Cab-strain of wt medaka fish (Oryzias latipes) was maintained following standard conditions (i.e., 12 h/12 h dark/light conditions at 27 °C). Embryos were staged according to the method proposed by Iwamatsu. All studies on fish were conducted in strict accordance with the institutional guidelines for animal research and approved by the Italian Ministry of Health; Department of Public Health, Animal Health, Nutrition, and Food Safety.
Kmt2d morpholino injections and drug treatments in medaka fish
The available medaka olKmt2d (ENSORLT00000009505.1) genomic sequences were retrieved from public databases (http://genome.ucsc.edu/) from human KMT2D (NM_003482.3) transcript. A morpholino (Mo; Gene Tools LLC, Oregon, USA) was designed against the ATG initiation codon within the 5’ untranslated region of the medaka ortholog of the (MO-Kmt2d: 5′-CCCTGCTGCTGCTTTGATCTTTTTG-3′) of the medaka orthologous of the KMT2D gene. The specificity and inhibitory efficiencies of morpholino was determined as previously described75. MO-Kmt2d was injected at 0.015 mM concentration into one blastomere at the one/two-cell stage. Off-target effects of the morpholino injections were excluded by repeated experiments with control morpholino or by co-injection with a p53 morpholino (MO-p53 5′-CGGGAATCGCACCGACAACAATACG-3′). For the drug treatment, chorions from injected and control embryos were removed with the hatching enzyme at St32. From St34 onward both morphant or control embryos were grown in 0,15 μM VE822 diluted in 1% DMSO, 1× Yamamoto, for 5-days, until St40. Solution was refreshed every 24 h. For the control experiments, the St34 morphant or control embryos were grown in 1× Yamamoto/1% DMSO.
Cartilage and bones staining in medaka fish
Staining for cartilage (Alcian Blue) and bone (Alizarin Red) in fixed embryos was performed according to standard medaka skeleton phenotyping protocols (https://shigen.nig.ac.jp/medaka/medakabook/index.php). Pictures were taken using the DM5000 microscopy (Leica Microsystems, Wetzlar, Germany). Transgenic medaka larvae were subjected to anesthesia before fixation at St40 by two hours of incubation in 4% paraformaldehyde, 2× phosphate-buffered saline (PBS) and 0.1% Tween-20 at room temperature (RT). After embedding in PBS/glycerol 50%, confocal pictures were taken with a Zeiss LSM700 using 400-nm and 543-nm laser lines for GFP and mCherry analysis, respectively. Imaging data were processed using ImageJ.
Inelastic Brillouin scattering
Brillouin scattering is an inelastic scattering process taking place when photons exchange energy with thermally excited acoustic waves or phonons50. This causes a small red or blue frequency shift (ω_b) of the scattered light corresponding to the emission or absorption of a phonon, respectively. This frequency shift is given by ω_b = 2n/λ √(M/ρ) sin f() 〖θ/2〗, where λ is the incident wavelength, ρ and n are the density and the material refractive index of the material, M is the longitudinal elastic modulus and θ is the scattering angle.
Confocal Brillouin microscopy, data acquisition and analysis
Brillouin scattering is exploited within the Brillouin microscopy for reconstructing sample’s 3D images of mechanical properties in a non-invasive manner. In this work, Brillouin microscopy is combined with a confocal imaging set-up and a Virtually Imaged Phased Array (VIPA)-based spectrometer (see methods). The source light is emitted from a CW single-longitudinal mode laser at 532 nm wavelength (OXXIUS) and focused onto the sample by an oil immersion objective lens (Olympus UP-lanSApo 100, NA = 1.4). The same lens was used to collect the backscattered light, providing a theoretical spatial resolution of 0.3 × 0.3 × 1.1 μm3. A 3D rapid sample scanning was realized thanks to a nanometric motorized stage (Prior HLD117IX). Finally, the collected light was focused by a single-mode optical fiber, filtered from the undesired elastic scattered light76 and delivered to the spectrometer.
The spectrometer consists of a modified solid Fabry Perot etalon with a free spectral range of 30 GHz (VIPA, LightMachinery, OP-6721-3371-2) that provides high (> 50%) transmission efficiency thanks to an antireflection coated entrance window that minimizes entrance losses. Generally, in Brillouin microscopy two or more crossed tandem-mounted VIPAs are used reaching a contrast of 60 dB77. However, multistaged VIPAs mitigate the output efficiency increasing the acquisition times. Our single-stage VIPA spectrometer allows registering signals with a contrast higher than 40 dB. This in combination with our filtering strategy paves the way for fast acquisition Brillouin microscopy imaging systems. For Brillouin imaging, cells were seeded at low density (sparse condition) on a μ-slide 4-well ibiTreat (ibidi) and culture for 24 h. After the removal of the medium, cells were washed twice with PBS (Sigma-Aldrich), fixed with 4% PFA (Sigma-Aldrich) for 15 min. at room temperature, washed three times with PBS and then left in PBS for the acquisitions on Brillouin microscope.
During data acquisitions, the stage longitudinal step size on the sample was 400 nm, the acquisition time 100 ms and the optical power delivered to the specimen was lower than 10 mW. For pixels-to-GHz conversion of Brillouin spectra, we acquired before each experiment as a reference the Brillouin spectrum of distilled water, that in our configuration has a Brillouin shift at 7.40 GHz. We acquired Stokes and Anti-Stokes lines and fitted them with a sum of Lorentzian functions: the maps of Brillouin shifts reported are the center of Stokes and Anti-Stokes fitted Lorentzian functions. Brillouin maps were produced by 2× resizing and 3 × 3 mean filter. For the analysis of the mean Brillouin shift across the nucleus, we used custom-made programs that automatically segmented different regions of the maps. We considered a “nucleus” all the pixels above 7.70 GHz; the program then connected different parts of the images having the same shift. The data reported as bar graphs show the mean of nuclear stiffness in different cells. All data analysis has been performed using custom-made programs in Matlab.
Statistical analysis and reproducibility
No statistical method was used to predetermine sample size. All experiments were performed at least on three independent biological samples and the relative measurements were taken from distinct samples. For quantification of imaging data, all the images were acquired by random sampling through the acquisition of at least 15 non-overlapping fields of view/condition. The acquisition and the relative quantifications were reproduced using biologically independent samples, retrieving similar results. Statistical P values calculated by two-tailed unpaired Student’s t-test are indicated in figures and relative figure legends (where not differentially specified, *** P < 0.001, **** P < 0.00001). Data collection and analyses of all studies involving animals were conducted randomly and not blinding.
Extended Data
Extended Data Fig. 1.
a Schematic representation of KMT2D gene and the corresponding MLL4 protein. The position of the inserted mutations in exon 39 and the relative changes in the coding sequences are highlighted.
b qRT-PCR of KMT2D in WT and MLL4Q4092X MSCs, normalized on GAPDH level. Data are means + SEM (n=3 independent experiments); unpaired two-tailed Student’s t-test was applied for statistical analysis.
c Western Blot analysis of MLL4 protein in WT and MLL4Q4092X MSCs by using a specific antibody recognizing a central portion of the protein; Lamin B1 was used as loading control.
d qRT-PCR of KDM6A in WT and MLL4Q4092X MSCs, normalized on GAPDH level. Data are means + SEM (n=3 independent experiments); unpaired two-tailed Student’s t-test was applied for statistical analysis.
e Representative images and quantifications of immunostaining for MLL4 in WT and MLL4Q4092X MSCs grown on the same coverslips. WT MSCs were pre-labelled with CellTrace Violet.Scale bar, 20 μm. Box plots indicate the median (middle line), the first and third quartiles (box), and the 10th and 90th percentile (error bars) of the fluorescence intensity. The number of analyzed nuclei is reported in figure as n; Student’s two-tailed unpaired t-test was applied for statistical analysis.
f Representative images and quantifications of immunostaining for PA1 in WT and MLL4Q4092X MSCs. Scale bar, 20 μm. Box plots indicate the median (middle line), the first and third quartiles (box), and the 10th and 90th percentile (error bars) of the fluorescence intensity. The number of analyzed nuclei is reported in figure as n; unpaired two-tailed Student’s t-test was applied for statistical analysis.
g Western Blot analysis of MLL4 and UTX in WT and MLL4P4093X MSCs; Lamin B1 was used as loading control (n=1).
h Quantifications of immunostaining for MLL4, PA1, UTX, H3K4me1 and H3K27ac in WT and MLL4P4093X MSCs. Box plots indicate the median (middle line), the first and third quartiles (box), and the 10th and 90th percentile (error bars) of the fluorescence intensity. The number of analyzed nuclei is reported in figure as n; Student’s two-tailed unpaired t-test was applied. for statistical analysis (****P<0.0001).
Extended Data Fig. 2.
a-d Representative images and quantifications of immunostaining for MLL4 (a), H3K4me1 (b), H3K27ac (c) and UTX (d) in primary fibroblasts from healthy donor or Kabuki patients. Scale bar, 20 μm. Box plots indicate the median (middle line), the first and third quartiles (box), and the 10th and 90th percentile (error bars) of the fluorescence intensity. The number of analyzed nuclei is reported in figure as n; unpaired two-tailed Student’s t-test was applied for statistical analysis (****P<0.0001).
e Quantifications of immunostaining for BRD4 and MED1 in WT and MLL4Q4092X MSCs grown on the same coverslips. WT MSCs were pre-labelled with CellTrace Violet Scale bar, 20 μm. Box plots indicate the median (middle line), the first and third quartiles (box), and the 10th and 90th percentile (error bars) of the fluorescence intensity. The number of analyzed nuclei is reported in figure as n; unpaired two-tailed Student’s t-test was applied for statistical analysis.
f Western Blot analysis of BRD4 and MED1 in WT and MLL4Q4092X MSCs; histone H3 was used as loading control. Signal quantifications are reported as bar plots. Data are means + SEM of 4 independent experiments for BRD4 and 5 independent experiments for MED1; one-tailed Student’s t-test was applied for statistical analysis.
g-i Representative images and quantifications of cluster intensity for BRD4 and MED1 immunostaining in WT and MLL4P4093X MSCs (g) on in primary fibroblasts from healthy donor or Kabuki patients (h-i). Box plots indicate the median (middle line), the first and third quartiles (box), and the 10th and 90th percentile (error bars) of the fluorescence intensity. The number of analyzed nuclei is reported in figure as n; unpaired two-tailed Student’s t-test was applied for statistical analysis (****P<0.0001).
Extended Data Fig. 3.
a-b Representative images and 3D reconstruction of the distribution of BRD4 (a) and MED1 (b) clusters in WT and MLL4Q4092X MSCs; Scale bar, 20 μm. Quantification of the number of BRD4 and MED1 clusters in WT and MLL4Q4092X MSCs. Box plots indicate the median (middle line), the first and third quartiles (box), and the 10th and 90th percentile (error bars). The number of analyzed nuclei is reported in figure as n; unpaired two-tailed Student’s t-test was applied for statistical analysis.
c Graphical representation of the experimental design adopted to measure the clustering of the MED1-IDR tagged with mCherry and fused to the Cry2 module. A single blue light stimulation (488nm, 50% light intensity, 2 seconds) was applied (green bars) followed by acquisition of mCherry signal (red bars).
d Quantification of the fluorescence intensity of MED1-IDR, measured in WT (n=39) and MLL4Q4092X (n=47) MSCs at the indicated time points. Box plots indicate the median (middle line), the first and third quartiles (box), and the 10th and 90th percentile (error bars) of the fluorescence intensity. The number of analyzed nuclei is reported in figure as n; unpaired two-tailed Student’s t-test was applied for statistical analysis.
e Representative images of light-stimulated MSCs expressing the mCherry-Cry2 construct, at different time points; scale bar, 10 μm.
f Representative images of light-induced clustering of MED1-IDR in MSCs, after a single pulse of stimulation (2 seconds, 488mn wavelength), stained for MLL4 and BRD4; scale bar, 10 μm. Pearson coefficient between MED-IDR and MLL4 or BRD4 was determined. Box plots indicate the median (middle line), the first and third quartiles (box), and the 10th and 90th percentile (error bars) of the fluorescence intensity. The number of analyzed nuclei is reported in figure as n.
Extended Data Fig. 4.
a Representative images of dual immunostaining for MLL4 and BRD4 or MED1 in WT MSCs; scale bar, 10 μm. Asterisks indicate Golgi aspecific signal. Pearson coefficient between MLL4 and BRD4 or MED1 was determined. Box plots indicate the median (middle line), the first and third quartiles (box), and the 10th and 90th percentile (error bars). The number of analyzed nuclei is reported in figure as n.
b Representative images of immunostaining for MLL4 in WT MSCs, and in cells carrying KMT2D truncating mutation on one (MLL4Q4092X/WT) or both alleles (MLL4Q4092X/Q4092X).
c Graphical representation of the Prion-like amino acid composition of MLL4 retrieved by PLAAC analysis.
d Analyses on the KMT2D gene showing the constrained coding regions (CCR), the known clinical variants (clinVar), the protein changing variants, and the conservation pattern (GERP). The square indicates the genomic regions codifying for the MLL4-PrLD.
e SDS-PAGE and Coomassie staining of purified MLL4-PrLD and MLL4-PrLDΔQ recombinant proteins.
f Phase separation of MLL4-PrLD recombinant protein visualized and quantified by fluorescence microscopy, in presence of increasing concentration of NaCl or 1,6-hexanediol; scale bar 5 μm.
g Phase separation of MLL4-PrLDΔQ at different protein concentrations; scale bar 5 μM.
h Measurements of the relative amount of condensed MLL4-PrLDΔQ versus protein concentration. Red line represents the regression line.
i Measurements of the number of formed MLL4-PrLD clusters versus the expression level in NIH3T3 cells. The quantification is the result of three independent experiments. Red line represents the regression line.
j Measurement of the mean fluorescent intensity in NIH3T3 cells expressing the OptoMLL4-PrLD or the OptoMLL4-PrLDΔQ, respectively. Box plots indicate the median (middle line), the first and third quartiles (box), and the 10th and 90th percentile (error bars) of the fluorescence intensity. The number of analyzed nuclei is reported in figure as n. Unpaired two-tailed Student’s t-test was applied for statistical analysis.
Extended Data Fig. 5.
a Western Blot analysis of EED, EZH2 and SUZ12 in WT and MLL4Q4092X MSCs; histone H3 was used as loading control.
b qRT-PCR of BMI and RING1B in WT and MLL4Q4092X MSCs, normalized on GAPDH level. Data are means + SEM (n=3 independent experiments); unpaired two-tailed Student’s t-test was applied for statistical analysis.
c Quantifications of immunostaining for H3K27me3, BMI, and RING1B in WT and MLL4P4093X MSCs. Box plots indicate the median (middle line), the first and third quartiles (box), and the 10th and 90th percentile (error bars) of the fluorescence intensity. The number of analyzed nuclei is reported in figure as n; unpaired two-tailed Student’s t-test was applied for statistical analysis (****P<0.0001).
d-f Representative images and quantifications of immunostaining for H3K27me3 (d), BMI (e), and RING1B (f) in primary fibroblasts from healthy donor or Kabuki patients; scale bar, 20 μm. Box plots indicate the median (middle line), the first and third quartiles (box), and the 10th and 90th percentile (error bars) of the fluorescence intensity. The number of analyzed nuclei is reported in figure as n; unpaired two-tailed Student’s t-test was applied for statistical analysis (****P<0.0001).
g qRT-PCR of KMT2D in WT and MLL4Q4092X MSCs, expressing CRISPRa with or without crRNA targeting KMT2D promoter. Retrieved data were normalized on GAPDH level. Data are means + SEM (n=4 independent experiments); unpaired two-tailed Student’s t-test was applied for statistical analysis.
h-i Quantifications of immunostaining for MLL4, H3K4me1, BMI, RING1B and H3K27me3 in WT and MLL4Q4092X MSCs expressing CRISPRa with or without crRNA targeting KMT2D promoter. Box plots indicate the median (middle line), the first and third quartiles (box), and the 10th and 90th percentile (error bars) of the normalized fluorescence intensity. The number of analyzed nuclei is reported in figure as n; Student’s two-tailed unpaired t-test was applied for statistical analysis (****P<0.0001).
Extended Data Fig. 6.
a-b Reconstructed 3D images of nuclei retrieved from images of WT and MLL4P4093X MSCs (a) or primary fibroblasts from healthy donor and Kabuki patients (b). Scale bar, 5 μm. The nuclear area, volume and flattening were determined and represented as box plots indicating the median (middle line), the first and third quartiles (box), and the 10th and 90th percentile (error bars). The number of analyzed nuclei is reported in figure as n; unpaired two-tailed Student’s t-test was applied for statistical analysis (****P<0.0001).
c Measurements of nuclear shape in WT and MLL4Q4092X MSCs expressing CRISPRa with or without crRNA targeting KMT2D promoter. The nuclear area, volume and flattening were represented as box plots indicating the median (middle line), the first and third quartiles (box), and the 10th and 90th percentile (error bars). The number of analyzed nuclei is reported in figure as n; unpaired two-tailed Student’s t-test was applied for statistical analysis (****P<0.0001).
d qRT-PCR of LMNA in WT and MLL4Q4092X MSCs, normalized on GAPDH level. Data are means + SEM (n=3 independent experiments); unpaired two-tailed Student’s t-test was applied for statistical analysis.
e Quantifications of immunostaining for LMNA and phosphorylated LMNA/C (pLMNA) in WT and MLL4P4093X MSCs. Box plots indicate the median (middle line), the first and third quartiles (box), and the 10th and 90th percentile (error bars) of the fluorescence intensity. The number of analyzed nuclei is reported in figure as n; unpaired two-tailed Student’s t-test was applied for statistical analysis (****P<0.0001).
f-g Representative images and quantifications of cellular area detected by Phalloidin staining in WT and MLL4Q4092X MSCs (f) or in the same cells expressing either EGFP or EGFP-Nesprin-KASH (g). Scale bar, 20 μm. Box plots indicate the median (middle line), the first and third quartiles (box), and the 10th and 90th percentile (error bars) of the cellular area. The number of analyzed cells is reported in figure as n; unpaired two-tailed Student’s t-test was applied for statistical analysis (****P<0.0001).
h-i Representative images and quantifications of immunostaining for H4K16ac in WT and MLL4P4093X MSCs (h) or in WT primary fibroblasts from healthy donor or Kabuki patients (i). Box plots indicate the median (middle line), the first and third quartiles (box), and the 10th and 90th percentile (error bars) of the normalized fluorescence intensity. The number of analyzed nuclei is reported in figure as n; unpaired two-tailed Student’s t-test was applied for statistical analysis (****P<0.0001).
Extended Data Fig. 7.
a-b Representative images and quantifications of immunostaining for H3K27me3 (a) and BMI (b) in WT and MLL4Q4092X MSCs untreated or treated with TSA (1.5 μM for 8h). Scale bar, 20 μm. Box plots indicate the median (middle line), the first and third quartiles (box), and the 10th and 90th percentile (error bars) of the normalized fluorescence intensity. The number of analyzed nuclei is reported in figure as n; unpaired two-tailed Student’s t-test was applied for statistical analysis (****P<0.0001).
c Representative images and quantification of immunostaining for H3K27me3 in WT, MLL4Q4092X or MLL4Q4092X MSCs expressing either H3.3WT or H3.3K27M. Scale bar, 20 μm. Box plots indicate the median (middle line), the first and third quartiles (box), and the 10th and 90th percentile (error bars) of the normalized fluorescence intensity. The number of analyzed nuclei is reported in figure as n; unpaired two-tailed Student’s t-test was applied for statistical analysis (****P<0.0001).
d Representative maps of stiffness distribution in WT, MLL4Q4092XMSCs, MLL4Q4092X MSCs expressing H3.3K27M or MLL4Q4092X MSCs treated with TSA for 24h; Scale bars, 10 μm. Bar plot representing nuclear Brillouin shift in the different conditions. Data are means + SEM (n=4 independent experiments); unpaired two-tailed Student’s t-test was applied for statistical analysis (****P<0.0001).
Extended Data Fig. 8.
a Quantification of the number and the area of the light-induced droplets of BMI-Cry2 at different time points. First panel shows the distribution changes in the time window of 300 seconds post-stimulation. Second panel shows the formation and disassembly of BMI-Cry2 clusters within a time window of 35 minutes.
b Quantification of the relative frequency of small (<0.1μm2) and large (>0.1μm2) droplets of BMI-Cry2 at different time points.
c Representative images of dual immunostaining for BMI1 and RING1B (upper panels) or H3K27me3 (middle panels) or BRD4 (lower panels) in WT MSCs; scale bar, 10 μm. Pearson coefficient was represented as box plots, indicating the median (middle line), the first and third quartiles (box), and the 10th and 90th percentile (error bars). The number of analyzed nuclei is reported in figure as n.
d Representative images of immunostaining for H3K27me3 and RING1B in NIH3T3 expressing BMI-Cry2, after light-induced clustering, Scale bar, 10 μm. Pearson Coefficient between BMI-Cry2 and H3K27me3 or RING1B was represented as box plots indicating the median (middle line), the first and third quartiles (box), and the 10th and 90th percentile (error bars). The number of analyzed nuclei is reported in figure as n.
Extended Data Fig. 9.
a Quantifications of immunostaining for YAP/TAZ in WT and MLL4P4093X MSCs. Box plots indicate the median (middle line), the first and third quartiles (box), and the 10th and 90th percentile (error bars). The number of analyzed nuclei is reported in figure as n; unpaired two-tailed Student’s t-test was applied for statistical analysis (****P<0.0001).
b Western Blot analysis of YAP, TAZ and phosphorylated YAP (Ser127) in WT and MLL4Q4092X MSCs; GAPDH was used as loading control.
c Representative images of the distribution of ATR in WT and MLL4Q4092X MSCs. Scale bar, 20 μm.
d Representative images and quantifications of immunostaining for YAP/TAZ in WT and MLL4Q4092X MSCs untreated or treated with different concentrations of the ATR inhibitor VE-822. Scale bar, 20 μm. Data are represented as box plots, indicating the median (middle line), the first and third quartiles (box), and the 10th and 90th percentile (error bars). The number of analyzed nuclei is reported in figure as n; unpaired two-tailed Student’s t-test was applied for statistical analysis (****P<0.0001).
e Representative images and quantification of phH2A.X in WT and MLL4Q4092X MSCs. Scale bar, 20 μm. Box plots indicate the median (middle line), the first and third quartiles (box), and the 10th and 90th percentile (error bars) of the phH2A.X distribution per cell. The number of analyzed nuclei is reported in figure as n; unpaired two-tailed Student’s t-test was applied for statistical analysis.
f Volcano plot of differentially expressed genes between WT and MLL4Q4092X MSCs. Vertical blue lines indicate the chosen cutoff (−2>fold change>2), horizontal red line indicates Wald test-derived p-value cutoff of 0.05.
g Heat map of k-means clustering analysis of expressed genes in WT MSCs untreated or treated with ATR inhibitor at the indicated time points.
h Venn diagram showing the overlap between the ATR responsive genes identified in WT and MLL4Q4092X MSCs.
i qRT-PCR of the indicated genes in WT, MLL4Q4092X (i) and MLL4P4093X MSCs (k) untreated or treated with ATR inhibitor at the different time points. The expression level was normalized on GAPDH level. Data are means + SEM (n=3 independent experiments); unpaired two-tailed Student’s t-test was applied for statistical analysis (***P<0.001).
Extended Data Fig. 10.
a qRT-PCR of chromatin architecture genes in WT and MLL4Q4092X MSCs expressing CRISPRa with or without crRNA targeting KMT2D promoter. Retrieved data were normalized on GAPDH level. Data are means + SEM (n=3 independent experiments); unpaired two-tailed Student’s t-test was applied for statistical analysis.
b-c Quantifications of immunostaining for YAP/TAZ in WT and MLL4Q4092X MSCs expressing CRISPRa with or without crRNA targeting KMT2D promoter (b) or in WT and MLL4Q4092X MSCs expressing either H3.3WT or H3.3K27M.(c). Box plots indicate the median (middle line), the first and third quartiles (box), and the 10th and 90th percentile (error bars). The number of analyzed nuclei is reported in figure as n; unpaired two-tailed Student’s t-test was applied for statistical analysis (****P<0.0001).
d Differentiation of WT and MLL4Q4092X MSCs into adipocytes, osteocytes or chondrocytes were detected was detected by Oil red, Alizarin red or by Alcian blue staining, respectively. Scale bar, 100 μm.
e qRT-PCR of the indicated genes during differentiation of WT and MLL4Q4092X MSCs towards chondrocytes. The expression level was normalized on GAPDH level. Data are means + SEM (n=3 independent experiments); unpaired two-tailed Student’s t-test was applied for statistical analysis.
f Chondrogenic differentiation of WT and MLL4Q4092X MSCs or MLL4Q4092X MSCs expressing exogenous MLL4 was detected by Alcian blue staining. Scale bar, 500 μm.
g Bar plot of the relative quantification of Ethmoid plate (EP), Palatoquadrate (PQ), Ceratohyal (CH) and Ceretobranchials 1 to 5 (CBs) cartilage length in Ctrl, KMT2D 5’UTR-morpholino and KMT2D 5’UTR-morpholino-treated with ATR inhibitor. Data are means + SEM (n=10 animals; n=12 animals for CH quantification in the KMT2D morphants); two-tailed Student’s t-test was applied for statistical analysis (****P<0.0001).
h Bar plot of the relative quantification of Palatoquadrate (PQ), Ceratohyal (CH), Operculum (OP), Cleithrum (CL) and fifth ceratobranchial (CB) cartilage length in KMT2D 5’UTR-morpholino and ATRi-treated KMT2D 5’UTR-morpholino medaka fish. ata are means + SEM (n=10 animals); two-tailed Student’s t-test was applied for statistical analysis (****P<0.0001).
k Bar plot of the relative quantification of Palatoquadrate (PQ), Ceratohyal (CH), Operculum (OP), Cleithrum (CL) and fifth ceratobranchial (CB) mineralization in KMT2D 5’UTR-morpholino and ATRi-treated KMT2D 5’UTR-morpholino medaka fish. Data are means + SEM (n=10 animals); two-tailed Student’s t-test was applied for statistical analysis (****P<0.0001).
Supplementary Material
Acknowledgments
We thank the NGS facility from CIBIO for their help with RNA-seq; the Protein technology facility from CIBIO for recombinant protein purification; ALEMBIC from San Raffaele Scientific Institute (Milan, Italy) for STORM imaging acquisition and data analyses; TIGEM Medaka Core Facility and F.G. Salierno for technical assistance; CrestOptics-IIT JointLab for Advanced Microscopy for financial and technical support. We thank Dr. G. Merla (IRCCS Casa Sollievo della Sofferenza, San Giovanni Rotondo, Italy), the Genomic and Genetic Disorders Biobank, member of the Telethon Network of Genetic Biobanks (project no. GTB12001), funded by Telethon Italy, and of the EuroBioBank network, provided us with the human primary fibroblasts derived from either healthy or KS donors. We would like to thank Emiliano Biasini and the members of the Zippo laboratory for helpful discussions and critical reading of the manuscript. We thank Prof. David Allis for sharing H3.3K27M construct, Prof. Richard Young for sharing the OptoIDR vectors; Dr. Zhang Qiuping for EGFP-Nesprin1/2-KASH vectors. Mass Spectrometry and Proteomics Core facility of CIBIO is supported by European Regional Development Fund (ERDF) 2014-2020. Work in the Zippo group was supported by grants from the Italian Health ministry (GR-2011-02351172), Telethon foundation (GEP13057) and AFM Telethon (AFM 21514). V. Poli is recipient of an AIRC fellowship (21158).
Footnotes
Author Contributions
A.F. and A.Z. conceived the study, designed the experiments and interpreted the data. S.D. performed the phase separation and IF experiments and participated in data analyses. V.P. performed the cellular and molecular biology studies, participating in data analyses. L.F. and S.B. performed RNA-seq experiments and computational analyses. F.C. and D.M. performed the molecular biology studies. L.A., F.R., G.O., E.D. and S.Z. performed computational analyses on imaging and genomic data. R.B. and D.P. performed mass spectrometry experiments. D.I., C.S. and I.C. performed in vivo assays in medaka fish. C.T., P.V. and R.G. performed Brillouin microscopy and computational data analysis. A.Z. supervised the work and wrote the manuscript.
Competing Interests Statement
The authors declare no competing interests.
Data availability
The RNA-seq raw data are deposited in Gene Expression Omnibus (GEO) database under the accession GSE135550. The mass spectrometry proteomics data have been deposited to the ProteomeXchange Consortium via the PRIDE partner repository with the dataset identifier PXD021616. Additional data supporting the findings of this study are available from the corresponding author upon reasonable request. The custom made code for quantifying the cytoplasmic/nuclear ratio of YA/TAZ is deposited in the public repository GitHub (https://github.com/SZambranoS/RoutinesNucCytoYAP). The custom made code for quantifying the Brillouin shift is deposited in the public repository GitHub (https://github.com/ClaudiaBrill/CodeBrillouinFasciani). Source data for Figures 1, 4, 5 and 6 and Extended Data Figures 1, 2 5, 6 and 9 (full scans of the immunoblots) are provided with the paper as Source Data Figure 1.
References
- 1.Fukaya T, Lim B, Levine M. Enhancer Control of Transcriptional Bursting. Cell. 2016;166:358–368. doi: 10.1016/j.cell.2016.05.025. [DOI] [PMC free article] [PubMed] [Google Scholar]
- 2.Spitz F. Gene regulation at a distance: From remote enhancers to 3D regulatory ensembles. Semin Cell Dev Biol. 2016;57:57–67. doi: 10.1016/j.semcdb.2016.06.017. [DOI] [PubMed] [Google Scholar]
- 3.Rada-Iglesias A, et al. A unique chromatin signature uncovers early developmental enhancers in humans. Nature. 2011;470:279–83. doi: 10.1038/nature09692. [DOI] [PMC free article] [PubMed] [Google Scholar]
- 4.Calo E, Wysocka J. Modification of enhancer chromatin: what, how, and why? Mol Cell. 2013;49:825–37. doi: 10.1016/j.molcel.2013.01.038. [DOI] [PMC free article] [PubMed] [Google Scholar]
- 5.Stadhouders R, Filion GJ, Graf T. Transcription factors and 3D genome conformation in cell-fate decisions. Nature. 2019;569:345–354. doi: 10.1038/s41586-019-1182-7. [DOI] [PubMed] [Google Scholar]
- 6.van Steensel B, Furlong EEM. The role of transcription in shaping the spatial organization of the genome. Nat Rev Mol Cell Biol. 2019;20:327–337. doi: 10.1038/s41580-019-0114-6. [DOI] [PMC free article] [PubMed] [Google Scholar]
- 7.Chong S, et al. Imaging dynamic and selective low-complexity domain interactions that control gene transcription. Science. 2018;361 doi: 10.1126/science.aar2555. [DOI] [PMC free article] [PubMed] [Google Scholar]
- 8.Cho WK, et al. Mediator and RNA polymerase II clusters associate in transcription-dependent condensates. Science. 2018;361:412–415. doi: 10.1126/science.aar4199. [DOI] [PMC free article] [PubMed] [Google Scholar]
- 9.Sabari BR, et al. Coactivator condensation at super-enhancers links phase separation and gene control. Science. 2018;361 doi: 10.1126/science.aar3958. [DOI] [PMC free article] [PubMed] [Google Scholar]
- 10.Boija A, et al. Transcription Factors Activate Genes through the Phase-Separation Capacity of Their Activation Domains. Cell. 2018;175:1842–1855 e16. doi: 10.1016/j.cell.2018.10.042. [DOI] [PMC free article] [PubMed] [Google Scholar]
- 11.Lu H, et al. Phase-separation mechanism for C-terminal hyperphosphorylation of RNA polymerase II. Nature. 2018;558:318–323. doi: 10.1038/s41586-018-0174-3. [DOI] [PMC free article] [PubMed] [Google Scholar]
- 12.Alberti S. Phase separation in biology. Curr Biol. 2017;27:R1097–R1102. doi: 10.1016/j.cub.2017.08.069. [DOI] [PubMed] [Google Scholar]
- 13.Banani SF, Lee HO, Hyman AA, Rosen MK. Biomolecular condensates: organizers of cellular biochemistry. Nature Reviews Molecular Cell Biology. 2017;18:285–298. doi: 10.1038/nrm.2017.7. [DOI] [PMC free article] [PubMed] [Google Scholar]
- 14.Shin Y, Brangwynne CP. Liquid phase condensation in cell physiology and disease. Science. 2017;357 doi: 10.1126/science.aaf4382. [DOI] [PubMed] [Google Scholar]
- 15.Alberti S, Halfmann R, King O, Kapila A, Lindquist S. A systematic survey identifies prions and illuminates sequence features of prionogenic proteins. Cell. 2009;137:146–58. doi: 10.1016/j.cell.2009.02.044. [DOI] [PMC free article] [PubMed] [Google Scholar]
- 16.Molliex A, et al. Phase separation by low complexity domains promotes stress granule assembly and drives pathological fibrillization. Cell. 2015;163:123–33. doi: 10.1016/j.cell.2015.09.015. [DOI] [PMC free article] [PubMed] [Google Scholar]
- 17.Franzmann TM, Alberti S. Prion-like low-complexity sequences: Key regulators of protein solubility and phase behavior. J Biol Chem. 2019;294:7128–7136. doi: 10.1074/jbc.TM118.001190. [DOI] [PMC free article] [PubMed] [Google Scholar]
- 18.March ZM, King O, Shorter DJ. Prion-like domains as epigenetic regulators, scaffolds for subcellular organization, and drivers of neurodegenerative disease. Brain Res. 2016;1647:9–18. doi: 10.1016/j.brainres.2016.02.037. [DOI] [PMC free article] [PubMed] [Google Scholar]
- 19.Herz HM, et al. Enhancer-associated H3K4 monomethylation by Trithorax-related, the Drosophila homolog of mammalian Mll3/Mll4. Genes Dev. 2012;26:2604–20. doi: 10.1101/gad.201327.112. [DOI] [PMC free article] [PubMed] [Google Scholar]
- 20.Wang SP, et al. A UTX-MLL4-p300 Transcriptional Regulatory Network Coordinately Shapes Active Enhancer Landscapes for Eliciting Transcription. Mol Cell. 2017;67:308–321 e6. doi: 10.1016/j.molcel.2017.06.028. [DOI] [PMC free article] [PubMed] [Google Scholar]
- 21.Ringrose L, Paro R. Epigenetic regulation of cellular memory by the Polycomb and Trithorax group proteins. Annu Rev Genet. 2004;38:413–43. doi: 10.1146/annurev.genet.38.072902.091907. [DOI] [PubMed] [Google Scholar]
- 22.Schuettengruber B, Bourbon HM, Di Croce L, Cavalli G. Genome Regulation by Polycomb and Trithorax: 70 Years and Counting. Cell. 2017;171:34–57. doi: 10.1016/j.cell.2017.08.002. [DOI] [PubMed] [Google Scholar]
- 23.Local A, et al. Identification of H3K4me1-associated proteins at mammalian enhancers. Nat Genet. 2018;50:73–82. doi: 10.1038/s41588-017-0015-6. [DOI] [PMC free article] [PubMed] [Google Scholar]
- 24.Dorighi KM, et al. Mll3 and Mll4 Facilitate Enhancer RNA Synthesis and Transcription from Promoters Independently of H3K4 Monomethylation. Mol Cell. 2017;66:568–576 e4. doi: 10.1016/j.molcel.2017.04.018. [DOI] [PMC free article] [PubMed] [Google Scholar]
- 25.Rickels R, et al. Histone H3K4 monomethylation catalyzed by Trr and mammalian COMPASS-like proteins at enhancers is dispensable for development and viability. Nat Genet. 2017;49:1647–1653. doi: 10.1038/ng.3965. [DOI] [PMC free article] [PubMed] [Google Scholar]
- 26.Ng SB, et al. Exome sequencing identifies MLL2 mutations as a cause of Kabuki syndrome. Nat Genet. 2010;42:790–3. doi: 10.1038/ng.646. [DOI] [PMC free article] [PubMed] [Google Scholar]
- 27.Banka S, et al. How genetically heterogeneous is Kabuki syndrome?: MLL2 testing in 116 patients, review and analyses of mutation and phenotypic spectrum. Eur J Hum Genet. 2012;20:381–8. doi: 10.1038/ejhg.2011.220. [DOI] [PMC free article] [PubMed] [Google Scholar]
- 28.Cocciadiferro D, et al. Dissecting KMT2D missense mutations in Kabuki syndrome patients. Hum Mol Genet. 2018;27:3651–3668. doi: 10.1093/hmg/ddy241. [DOI] [PMC free article] [PubMed] [Google Scholar]
- 29.Engler AJ, Sen S, Sweeney HL, Discher DE. Matrix elasticity directs stem cell lineage specification. Cell. 2006;126:677–89. doi: 10.1016/j.cell.2006.06.044. [DOI] [PubMed] [Google Scholar]
- 30.Huebsch N, et al. Harnessing traction-mediated manipulation of the cell/matrix interface to control stem-cell fate. Nat Mater. 2010;9:518–26. doi: 10.1038/nmat2732. [DOI] [PMC free article] [PubMed] [Google Scholar]
- 31.Vartiainen MK, Guettler S, Larijani B, Treisman R. Nuclear actin regulates dynamic subcellular localization and activity of the SRF cofactor MAL. Science. 2007;316:1749–52. doi: 10.1126/science.1141084. [DOI] [PubMed] [Google Scholar]
- 32.Dupont S, et al. Role of YAP/TAZ in mechanotransduction. Nature. 2011;474:179–83. doi: 10.1038/nature10137. [DOI] [PubMed] [Google Scholar]
- 33.Uhler C, Shivashankar GV. Regulation of genome organization and gene expression by nuclear mechanotransduction. Nat Rev Mol Cell Biol. 2017;18:717–727. doi: 10.1038/nrm.2017.101. [DOI] [PubMed] [Google Scholar]
- 34.Stephens AD, Banigan EJ, Adam SA, Goldman RD, Marko JF. Chromatin and lamin A determine two different mechanical response regimes of the cell nucleus. Mol Biol Cell. 2017;28:1984–1996. doi: 10.1091/mbc.E16-09-0653. [DOI] [PMC free article] [PubMed] [Google Scholar]
- 35.Ghosh S, et al. Deformation Microscopy for Dynamic Intracellular and Intranuclear Mapping of Mechanics with High Spatiotemporal Resolution. Cell Rep. 2019;27:1607–1620 e4. doi: 10.1016/j.celrep.2019.04.009. [DOI] [PMC free article] [PubMed] [Google Scholar]
- 36.Heo SJ, et al. Differentiation alters stem cell nuclear architecture, mechanics, and mechano-sensitivity. Elife. 2016;5 doi: 10.7554/eLife.18207. [DOI] [PMC free article] [PubMed] [Google Scholar]
- 37.Micale L, et al. Molecular analysis, pathogenic mechanisms, and readthrough therapy on a large cohort of Kabuki syndrome patients. Hum Mutat. 2014;35:841–50. doi: 10.1002/humu.22547. [DOI] [PMC free article] [PubMed] [Google Scholar]
- 38.Zhang J, et al. Disruption of KMT2D perturbs germinal center B cell development and promotes lymphomagenesis. Nat Med. 2015;21:1190–8. doi: 10.1038/nm.3940. [DOI] [PMC free article] [PubMed] [Google Scholar]
- 39.Nair SJ, et al. Phase separation of ligand-activated enhancers licenses cooperative chromosomal enhancer assembly. Nat Struct Mol Biol. 2019;26:193–203. doi: 10.1038/s41594-019-0190-5. [DOI] [PMC free article] [PubMed] [Google Scholar]
- 40.Shin Y, et al. Spatiotemporal Control of Intracellular Phase Transitions Using Light-Activated optoDroplets. Cell. 2017;168:159–171 e14. doi: 10.1016/j.cell.2016.11.054. [DOI] [PMC free article] [PubMed] [Google Scholar]
- 41.Lehman N, et al. Molecular, clinical and neuropsychological study in 31 patients with Kabuki syndrome and KMT2D mutations. Clin Genet. 2017;92:298–305. doi: 10.1111/cge.13010. [DOI] [PubMed] [Google Scholar]
- 42.Cocciadiferro D, et al. Dissecting KMT2D missense mutations in Kabuki syndrome patients. Human Molecular Genetics. 2018;27:3651–3668. doi: 10.1093/hmg/ddy241. [DOI] [PMC free article] [PubMed] [Google Scholar]
- 43.Wang J, et al. A Molecular Grammar Governing the Driving Forces for Phase Separation of Prion-like RNA Binding Proteins. Cell. 2018;174:688–699 e16. doi: 10.1016/j.cell.2018.06.006. [DOI] [PMC free article] [PubMed] [Google Scholar]
- 44.Bugaj LJ, Choksi AT, Mesuda CK, Kane RS, Schaffer DV. Optogenetic protein clustering and signaling activation in mammalian cells. Nat Methods. 2013;10:249–52. doi: 10.1038/nmeth.2360. [DOI] [PubMed] [Google Scholar]
- 45.Bustin M, Misteli T. Nongenetic functions of the genome. Science. 2016;352 doi: 10.1126/science.aad6933. aad6933. [DOI] [PMC free article] [PubMed] [Google Scholar]
- 46.Rada-Iglesias A, Grosveld FG, Papantonis A. Forces driving the three-dimensional folding of eukaryotic genomes. Mol Syst Biol. 2018;14:e8214. doi: 10.15252/msb.20188214. [DOI] [PMC free article] [PubMed] [Google Scholar]
- 47.Elosegui-Artola A, et al. Force Triggers YAP Nuclear Entry by Regulating Transport across Nuclear Pores. Cell. 2017;171:1397–1410 e14. doi: 10.1016/j.cell.2017.10.008. [DOI] [PubMed] [Google Scholar]
- 48.Swift J, et al. Nuclear lamin-A scales with tissue stiffness and enhances matrix-directed differentiation. Science. 2013;341 doi: 10.1126/science.1240104. 1240104. [DOI] [PMC free article] [PubMed] [Google Scholar]
- 49.Buxboim A, et al. Matrix elasticity regulates lamin-A,C phosphorylation and turnover with feedback to actomyosin. Curr Biol. 2014;24:1909–17. doi: 10.1016/j.cub.2014.07.001. [DOI] [PMC free article] [PubMed] [Google Scholar]
- 50.Antonacci G, de Turris V, Rosa A, Ruocco G. Background-deflection Brillouin microscopy reveals altered biomechanics of intracellular stress granules by ALS protein FUS. Commun Biol. 2018;1:139. doi: 10.1038/s42003-018-0148-x. [DOI] [PMC free article] [PubMed] [Google Scholar]
- 51.Shogren-Knaak M, et al. Histone H4-K16 acetylation controls chromatin structure and protein interactions. Science. 2006;311:844–7. doi: 10.1126/science.1124000. [DOI] [PubMed] [Google Scholar]
- 52.Lewis PW, et al. Inhibition of PRC2 activity by a gain-of-function H3 mutation found in pediatric glioblastoma. Science. 2013;340:857–61. doi: 10.1126/science.1232245. [DOI] [PMC free article] [PubMed] [Google Scholar]
- 53.Driscoll TP, Cosgrove BD, Heo SJ, Shurden ZE, Mauck RL. Cytoskeletal to Nuclear Strain Transfer Regulates YAP Signaling in Mesenchymal Stem Cells. Biophysical Journal. 2015;108:2783–2793. doi: 10.1016/j.bpj.2015.05.010. [DOI] [PMC free article] [PubMed] [Google Scholar]
- 54.Kumar A, et al. ATR mediates a checkpoint at the nuclear envelope in response to mechanical stress. Cell. 2014;158:633–46. doi: 10.1016/j.cell.2014.05.046. [DOI] [PMC free article] [PubMed] [Google Scholar]
- 55.Burgess RC, Burman B, Kruhlak MJ, Misteli T. Activation of DNA damage response signaling by condensed chromatin. Cell Rep. 2014;9:1703–1717. doi: 10.1016/j.celrep.2014.10.060. [DOI] [PMC free article] [PubMed] [Google Scholar]
- 56.Zanconato F, et al. Genome-wide association between YAP/TAZ/TEAD and AP-1 at enhancers drives oncogenic growth. Nat Cell Biol. 2015;17:1218–27. doi: 10.1038/ncb3216. [DOI] [PMC free article] [PubMed] [Google Scholar]
- 57.Provenzano PP, Inman DR, Eliceiri KW, Keely PJ. Matrix density-induced mechanoregulation of breast cell phenotype, signaling and gene expression through a FAK-ERK linkage. Oncogene. 2009;28:4326–43. doi: 10.1038/onc.2009.299. [DOI] [PMC free article] [PubMed] [Google Scholar]
- 58.VanLaarhoven PM, et al. Kabuki syndrome genes KMT2D and KDM6A: functional analyses demonstrate critical roles in craniofacial, heart and brain development. Hum Mol Genet. 2015;24:4443–53. doi: 10.1093/hmg/ddv180. [DOI] [PMC free article] [PubMed] [Google Scholar]
- 59.Bogershausen N, et al. RAP1-mediated MEK/ERK pathway defects in Kabuki syndrome. J Clin Invest. 2015;125:3585–99. doi: 10.1172/JCI80102. [DOI] [PMC free article] [PubMed] [Google Scholar]
- 60.Yu T, et al. A vertebrate-specific and essential role for osterix in osteogenesis revealed by gene knockout in the teleost medaka. Development. 2017;144:265–271. doi: 10.1242/dev.139550. [DOI] [PubMed] [Google Scholar]
- 61.Entrevan M, Schuettengruber B, Cavalli G. Regulation of Genome Architecture and Function by Polycomb Proteins. Trends Cell Biol. 2016;26:511–525. doi: 10.1016/j.tcb.2016.04.009. [DOI] [PubMed] [Google Scholar]
- 62.Schoenfelder S, et al. Polycomb repressive complex PRC1 spatially constrains the mouse embryonic stem cell genome. Nat Genet. 2015;47:1179–1186. doi: 10.1038/ng.3393. [DOI] [PMC free article] [PubMed] [Google Scholar]
- 63.Boettiger AN, et al. Super-resolution imaging reveals distinct chromatin folding for different epigenetic states. Nature. 2016;529:418–22. doi: 10.1038/nature16496. [DOI] [PMC free article] [PubMed] [Google Scholar]
- 64.Wani AH, et al. Chromatin topology is coupled to Polycomb group protein subnuclear organization. Nat Commun. 2016;7:10291. doi: 10.1038/ncomms10291. [DOI] [PMC free article] [PubMed] [Google Scholar]
- 65.Plys AJ, et al. Phase separation of Polycomb-repressive complex 1 is governed by a charged disordered region of CBX2. Genes Dev. 2019;33:799–813. doi: 10.1101/gad.326488.119. [DOI] [PMC free article] [PubMed] [Google Scholar]
- 66.Le HQ, et al. Mechanical regulation of transcription controls Polycomb-mediated gene silencing during lineage commitment. Nat Cell Biol. 2016;18:864–75. doi: 10.1038/ncb3387. [DOI] [PubMed] [Google Scholar]
- 67.Furusawa T, et al. Chromatin decompaction by the nucleosomal binding protein HMGN5 impairs nuclear sturdiness. Nat Commun. 2015;6:6138. doi: 10.1038/ncomms7138. [DOI] [PMC free article] [PubMed] [Google Scholar]
- 68.Wang P, et al. WDR5 modulates cell motility and morphology and controls nuclear changes induced by a 3D environment. Proc Natl Acad Sci U S A. 2018;115:8581–8586. doi: 10.1073/pnas.1719405115. [DOI] [PMC free article] [PubMed] [Google Scholar]
- 69.Stephens AD, et al. Chromatin histone modifications and rigidity affect nuclear morphology independent of lamins. Mol Biol Cell. 2018;29:220–233. doi: 10.1091/mbc.E17-06-0410. [DOI] [PMC free article] [PubMed] [Google Scholar]
- 70.Shin Y, et al. Liquid Nuclear Condensates Mechanically Sense and Restructure the Genome. Cell. 2018;175:1481–1491 e13. doi: 10.1016/j.cell.2018.10.057. [DOI] [PMC free article] [PubMed] [Google Scholar]
- 71.Benjamin JS, et al. A ketogenic diet rescues hippocampal memory defects in a mouse model of Kabuki syndrome. Proc Natl Acad Sci U S A. 2017;114:125–130. doi: 10.1073/pnas.1611431114. [DOI] [PMC free article] [PubMed] [Google Scholar]
- 72.Bjornsson HT, et al. Histone deacetylase inhibition rescues structural and functional brain deficits in a mouse model of Kabuki syndrome. Sci Transl Med. 2014;6 doi: 10.1126/scitranslmed.3009278. 256ra135. [DOI] [PMC free article] [PubMed] [Google Scholar]
- 73.Tatrai P, et al. Combined introduction of Bmi-1 and hTERT immortalizes human adipose tissue-derived stromal cells with low risk of transformation. Biochem Biophys Res Commun. 2012;422:28–35. doi: 10.1016/j.bbrc.2012.04.088. [DOI] [PubMed] [Google Scholar]
- 74.Ricci MA, Manzo C, Garcia-Parajo MF, Lakadamyali M, Cosma MP. Chromatin fibers are formed by heterogeneous groups of nucleosomes in vivo. Cell. 2015;160:1145–58. doi: 10.1016/j.cell.2015.01.054. [DOI] [PubMed] [Google Scholar]
- 75.Conte I, et al. MiR-204 is responsible for inherited retinal dystrophy associated with ocular coloboma. Proc Natl Acad Sci U S A. 2015;112:E3236–45. doi: 10.1073/pnas.1401464112. [DOI] [PMC free article] [PubMed] [Google Scholar]
- 76.Lepert G, Gouveia RM, Connon CJ, Paterson C. Assessing corneal biomechanics with Brillouin spectro-microscopy. Faraday Discuss. 2016;187:415–28. doi: 10.1039/c5fd00152h. [DOI] [PubMed] [Google Scholar]
- 77.Antonacci G, Lepert G, Paterson C, Torok P. Elastic suppression in Brillouin imaging by destructive interference. Applied Physics Letters. 2015;107 [Google Scholar]
Associated Data
This section collects any data citations, data availability statements, or supplementary materials included in this article.
Supplementary Materials
Data Availability Statement
The RNA-seq raw data are deposited in Gene Expression Omnibus (GEO) database under the accession GSE135550. The mass spectrometry proteomics data have been deposited to the ProteomeXchange Consortium via the PRIDE partner repository with the dataset identifier PXD021616. Additional data supporting the findings of this study are available from the corresponding author upon reasonable request. The custom made code for quantifying the cytoplasmic/nuclear ratio of YA/TAZ is deposited in the public repository GitHub (https://github.com/SZambranoS/RoutinesNucCytoYAP). The custom made code for quantifying the Brillouin shift is deposited in the public repository GitHub (https://github.com/ClaudiaBrill/CodeBrillouinFasciani). Source data for Figures 1, 4, 5 and 6 and Extended Data Figures 1, 2 5, 6 and 9 (full scans of the immunoblots) are provided with the paper as Source Data Figure 1.


