Abstract
Contractile actomyosin networks are responsible for the production of intracellular forces. There is increasing evidence that bundles of actin filaments form interconnected and interconvertible structures with the rest of the network. In this study, we explored the mechanical impact of these interconnections on the production and distribution of traction forces throughout the cell. By using a combination of hydrogel micropatterning, traction-force microscopy and laser photoablation, we measured the relaxation of traction forces in response to local photoablations. Our experimental results and modeling of the mechanical response of the network revealed that bundles were fully embedded along their entire length in a continuous and contractile network of cortical filaments. Moreover, the propagation of the contraction of these bundles throughout the entire cell was dependent on this embedding. In addition, these bundles appeared to originate from the alignement and coalescence of thin and unattached cortical actin filaments from the surrounding mesh.
Contractile forces are produced mainly by actomyosin bundles or stress fibers in adherent cells 1–3, and by a cortical meshwork of randomly oriented filaments in poorly-adherent cells 4,5. The mechanism regulating the production and transmission of local forces throughout the cell is still poorly understood 6–8. The progress in understanding this integration process has notably been limited by the technical challenges to manipulate the network locally while simultaneously measuring the impact on force production at the level of the entire cell.
Stress fibers are formed by the interaction and merging of pre-existing radial fibers and transverse arcs 9–12. Transverse arcs are formed by the alignement and compaction of filaments at the cell front, as they are pulled by the actin network retrograde flow against cell anchorages 13,14. As a result, actomyosin networks are composed of interconnected contractile elements that span the entire cytoplasm and serve as a template to transmit mechanical forces over long cellular distances 15–17. Laser photoablation experiments have indeed demonstrated that the photoablation of a single stress fiber could compromise the entire traction force field 18,19 and lead to variations in tension in all focal adhesions including those that are not at the ends of the ablated fibers 20. Similarly, stretching cells unidirectionally can lead to tension increase in all focal adhesions whatever their orientation 21. Hence, directional forces along specific actomyosin bundles can propagate to other bundles with which they are inter-connected. As a consequence, the tension in a stress fiber does not only depend on forces produced in that fiber but also on the connection and orientation of adjacent fibers 22. This high degree of connection between actomyosin bundles can provide the mechanical coherence at the level of the cell 23–25. However, it is yet unclear how forces are transmitted from one stress fiber to the other.
Theoretical models of contractile networks have proposed two main paradigms to capture the mechanisms of force production and transmission in cells. In one paradigm, discrete models, that include high level details on the structure of the network, offer an accurate description of the stress fiber as a load-bearing structure and of the traction forces exerted on its anchorages to the extra-cellular matrix 26–30. These models are successful at providing a description in fine details of local force production, but fail to provide a global description of the traction-force field. In the other paradigm, continuous models provide a more global view of the contractile networks by incorporating only a few coarse-grained biophysical parameters. These models work well for describing force variations with changes in cell size and shape 31–33, but require focal adhesions to be taken into account to be more accurate 34. These considerations suggest that the limitations of the discrete and the continuous models could be overcome by developing an intermediate model which takes into account both features of the network.
Results
Cells with stress fibers produce high contractile forces
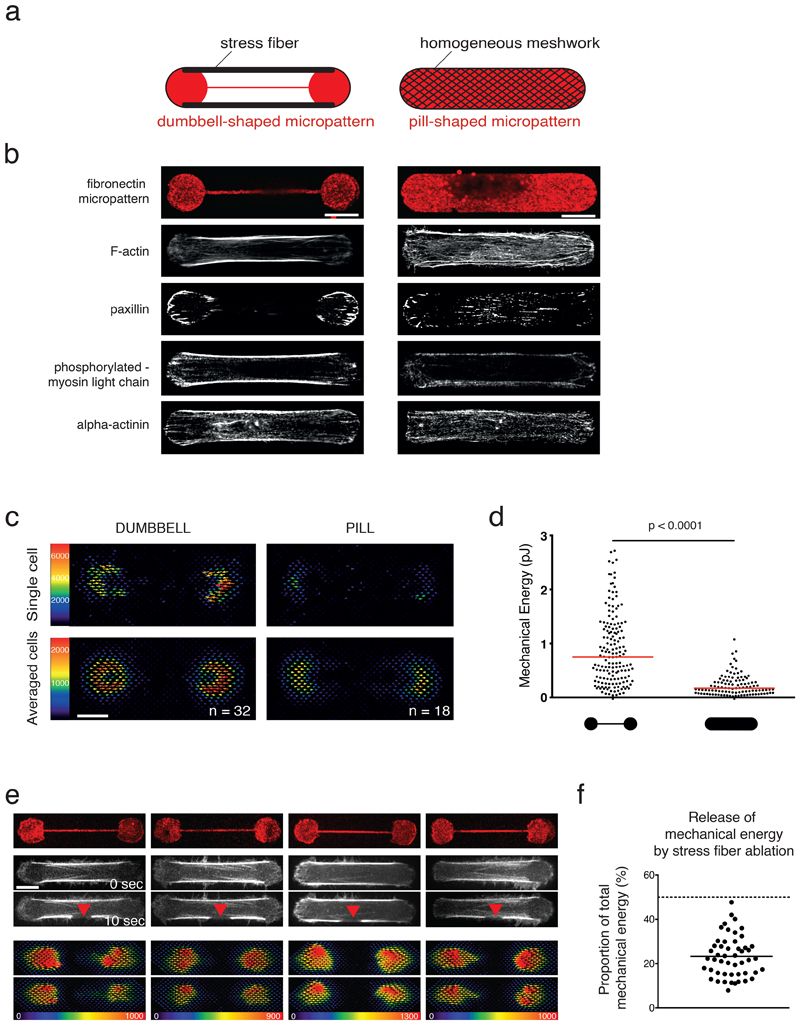
We first tested experimentally if the presence of actin bundles could impact the magnitude and distribution of traction forces as compared to a more homogeneous network of the same size and shape 32,33. To that end, cells were plated on either dumbbell-shaped or pill-shaped micropatterns fabricated on poly-acrylamide hydrogel. The size of the micropatterns, 60µm-long, corresponded to the average length of cells on poly-acrylamide gel homogeneously coated with fibronectin (Extended Data 1a-c). The dumbbell-shaped micropattern was designed to promote in the cell the assembly of two stress fibers, which are known to form preferentially above non-adhesive zone 35,36, whereas the pill-shaped micropattern was designed to promote a more homogeneous network of actin filaments (Figure 1a). Both micropatterns were devised to promote the cells adopting the same shape.
Figure 1. The stress fiber sets the magnitude of the traction force exerted by the cell but remains under tension after photoablation.
a. Micropattern designs (60 µm length) and their respective outcomes in actin-network architecture. Dumbbell shape (left): Actin stress fibers (thick black lines) form between the two adhesive disks (red). Pill shape (right): Formation of a continuous actin mesh.
b. Immunostainings of RPE1 cells spread on dumbbell-shaped (left panel) and pill-shaped polyacrylamide micropatterns (right panel), respectively. For each shape, single examples of representative cells are displayed. From top to bottom: micropatterns labeling (fibrinogen-Cy5); actin (phalloidin ATO-488); paxillin (Alexa-488); phosphorylated-Myosin light chain (CY3); alpha-actinin (CY3). Image scale bar = 10 µm. N=3 independent experiments.
c. Traction-force maps of cells spread on dumbbell (left column) and pill micropatterns (right column) of 37 µm, respectively. Upper images display traction-force maps of single representative cells (scale bar in Pa). Lower images show averaged traction-force maps of cells.
d. Scatter plot of the mechanical energies of single cells and associated p-value (two-tailed Mann-Whitney t-test, p<0.0001, median is depicted) (Dumbbell shape n=160 cells, N=7 experiments; pill shape n =107, N=2 experiments).
e. Force relaxation study upon peripheral stress-fiber photoablation. Left panel from top to bottom: Micropattern labeling (Fibrinogen-CY5); actin (LifeAct-GFP) before photoablation (0 sec) and after photoablation (10 sec, red arrow); corresponding traction-force maps of the initial forces; and traction-force maps after photoablation. Image scale bar = 10 µm. Force scale bar in Pa. N=4 experiments.
f. Scatter plot of individual released mechanical energies after stress-fiber photoablation (% of the initial mechanical energy) for n = 50 cells, N =4 experiments. Mean is depicted.
As expected, two main peripheral stress fibers and only a few smaller and thinner internal bundles were formed in cells plated on dumbbell-shaped micropatterns. These structures were localised in the ventral side of the cells and concentrated crosslinkers of actin filaments and myosins37. By contrast, numerous, more evenly distributed but thinner bundles of actin filaments were formed in cells on pill-shaped micropatterns (Figure 1b and Extended Data 1). The contractility generated by these cells forming two distinct cytoskeletal networks enclosed in a similar envelope was measured using traction force microscopy. As illustrated by the averaged traction-force maps and quantified by the mechanical energy that was transferred to the hydrogel, significantly higher mechanical energy was generated by cells containing the stress fibers (dumbbell micropattern) than the cells without (pill micropattern; Figure 1c, d). Similar changes were observed with other micropattern geometries in which the modulation of the size and position of non-adhesive zones affected the production of stress fibers (Extended Data 1d). This result indicated that the organization of actomyosin components into stress fibers, in response to local variations of substrate adhesiveness, plays a major role in setting the magnitude of force a cell could generate and transmit to the substrate. However, these global force measurements could not reveal the quantitative contribution of individual stress fibers to the total force produced by the cells.
Stress fibers are connected to surrounding actin network
By combining photoablation of the peripheral stress fibers with traction-force measurements, we assessed the specific contribution of these fibers to the global mechanical energy produced by cells plated on dumbbell micropatterns. A stress fiber was severed mid-length by localized pulsed-laser photoablation at 355 nm (see Video 1), and the release in fiber tension was captured by the relaxation in the hydrogel substrate (Figure 1e and Video 2). Surprisingly, the released energy from the cut of one of the two peripheral stress fibers was about 25 % of the total mechanical energy generated by the cell (Figure 1e, f), and was substantially lower than the expected 50% assuming the two peripheral stress fibers generate most of the mechanical energy.
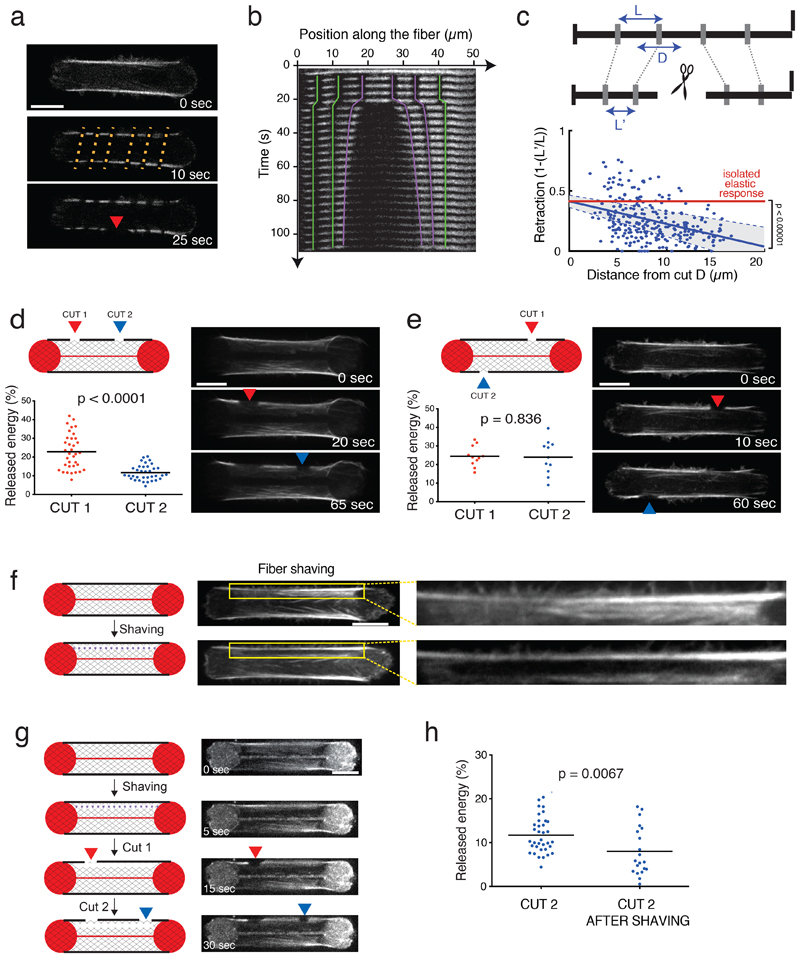
This prompted us to investigate in more detail the relaxation of the severed stress fiber. Marks were photobleached along the fiberto monitor the entire relaxation pattern after the severing, 38 (Figure 2a). As previously described, the retraction of a severed end was characteristic of a visco-elastic relaxation 19,39,40 (Figure 2b). To characterize the retraction, normalized retraction distance was calculated by dividing the length of each retracted segment (between two marks) by its initial length. Corresponding retraction values were plotted as a function of the initial distance of the photobleached segment from the photoablation site (Figure 2c). 22 negative values were excluded from the analysis as corresponding to cells in which the photoablation was not efficient. The parts of the fiber distal to the photoablation displayed minimal if any relaxation (Figure 2b, 2c), and contrasted with what would have been be expected with a stress fiber in isolation, in that the relaxation should be independent of the distance from the photoablation (Figure 2c). Hence, this result suggested that the fiber was not isolated but connected along its length to force-bearing elements which resisted the deformation when the fiber was severed. Similar observations have been made elsewhere in cells spread on uniform extra-cellular matrix coating 38. In this work, stress fibers appeared to be connected to the extra-cellular matrix via focal adhesion-like complexes which acted as elastic linkers, and were shown to accumulate zyxin at their severed ends following photoablation at locations where new adhesions were formed. However, with the dumbbell micropattern, stress fibers were above a non-adhesive substrate, precluding the possibility of transmembrane adhesions forming at the severed ends. This led us to hypothesize that peripheral stress fibers were not connected to the extra-cellular environment but to cortical actin filaments.
Figure 2. Stress fibers are connected to the surrounding actin cytoskeletal network.
a. From top to bottom: RPE1-actin-GFP time-lapse images. Stripes added by photobleaching (10 sec, orange dashed lines); photoablation (25 sec, red arrow). Image scale bar = 10 µm. N=2 experiments.
b. Corresponding kymograph (colored lines highlight the retraction of the photobleached marks).
c. Normalized retraction distance as a function of the initial distance of the photobleached segment from the photoablation site (n = 264 segments; 44 cells analyzed from 2 experiments). Blue line corresponds to the linear regression minimizing squared error. 95% confidence intervals (-0.0243,-0.0132 indicated by the grey area) based on standard errors indicates a negative slope which is distinct from zero (isolated elastic fiber, p<0;00001, two-tailed t-test).
d. Two sequential cuts on the same stress fiber (Cut 1=red arrow; Cut 2=blue arrow). Time-lapse images of RPE1-LifeAct-GFP cells after the two sequential photoablations. Scatter plots of the released mechanical energy (mean is depicted) for the two photoablations (n=35 cells, N=3 experiments). p-value from a two-tailed paired t-test is indicated on the plot (p<0.0001). Image scale bar = 10 µm.
e. Two sequential cuts on the two stress fibers in the cell (Cut 1=red arrow; Cut 2=blue arrow). Time-lapse images of RPE1-LifeAct-GFP cells after 2 photoablations. Scatter plots of the released mechanical energy for the two types of photoablation protocols (n=11 cells, N=1 experiment, mean is depicted). p-value from a two-tailed paired t-test is indicated on the plot (p=0.836). Image scale bar = 10 µm.
f. Stress-fiber shaving. The shaved region (dark area) was highlighted in the yellow inset and corresponding zoomed images. Image scale bar = 10 µm.
g. Shaving (purple dashed line) followed by two sequential cuts on the adjacent peripheral stress fiber (Cut 1=red arrow; Cut 2=blue arrow). RPE1 cells labeled with SiR-actin and corresponding micropatterns (fibrinogen-CY5) in a time-sequence corresponding to the shaving (T=5 sec), the first photoablation (T=15 sec, red arrow) and the second photoablation (T=30 sec, blue arrow). Image scale bar = 10 µm. N=3 experiments.
h. Scatter plot of the mechanical energy released by the second photoablation of the stress fiber, alone (Cut 2; n=35 cells, N=3) or preceded by a shaving (Cut 2 after shav; n=20 cells, N=4). Means are depicted. p-value from Mann-Whitney two-tailed t-test is indicated on the plot (p=0.0067). 8 negative values were excluded from the analysis as corresponding to cells in which the photoablation was not efficient.
Cut stress fibers are still under tension
Importantly, and in contrast to the classical view of stress fibers pulling on focal adhesions only, the stress-fiber connection to adjacent actin cytoskeletal elements implied that photoablation should redistribute the tension of the fiber to the surrounding meshwork. As a result, the remaining parts of the severed fiber should still be under tension. To test this prediction, two photoablations were performed sequentially less than a minute apart on the same fiber. In confirmation of the prediction, a noticeable release of energy, calculated as the percentage of the mechanical energy before photoablation, was associated with the second photoablation (Figure 2d). However, the amount of energy that was released by the second photoablation was much lower than the first one because the severed fiber had already relaxed and lost some of its elastic energy. To investigate whether this lower amount of energy release resulted from a non-specific injury to the cell due to the photoablations, the second photoablation was performed on the other intact fiber. In that case, approximately the same amount of energy was released as that after the first photoablation showing that the first photoablation did not impact cell integrity (Figure 2e).
Previous work has suggested that discrete connections of a peripheral stress fiber to other internal fibers can affect its relaxation pattern after severing 22,41. However, the incomplete relaxation pattern of the severed peripheral stress fibers we observed here was not systematically associated with interconnections with internal fibers, as illustrated by the absence of visible fibers connected to the peripheral stress fibers in Figure 2a. This led us to hypothesize that a stress fiber was connected to a low-density and widespread actin meshwork. This hypothesis was addressed by disconnecting the stress fiber from the meshwork through photoablation of a narrow region medial and parallel to the length of the fiber above the non-adhesive substrate on the hydrogel (a process we termed fiber shaving; Figure 2f and Video 3). With two successive photoablations of the stress fiber, the release of energy after the second photoablation was significantly lower when the fiber had been shaved first (Figure 2g, h), supporting the hypothesis that low-density fibers connections to the peripheral stress fiber prevented its complete relaxation after it was severed.
Modeling the stress fibers embedding in an elastic meshwork
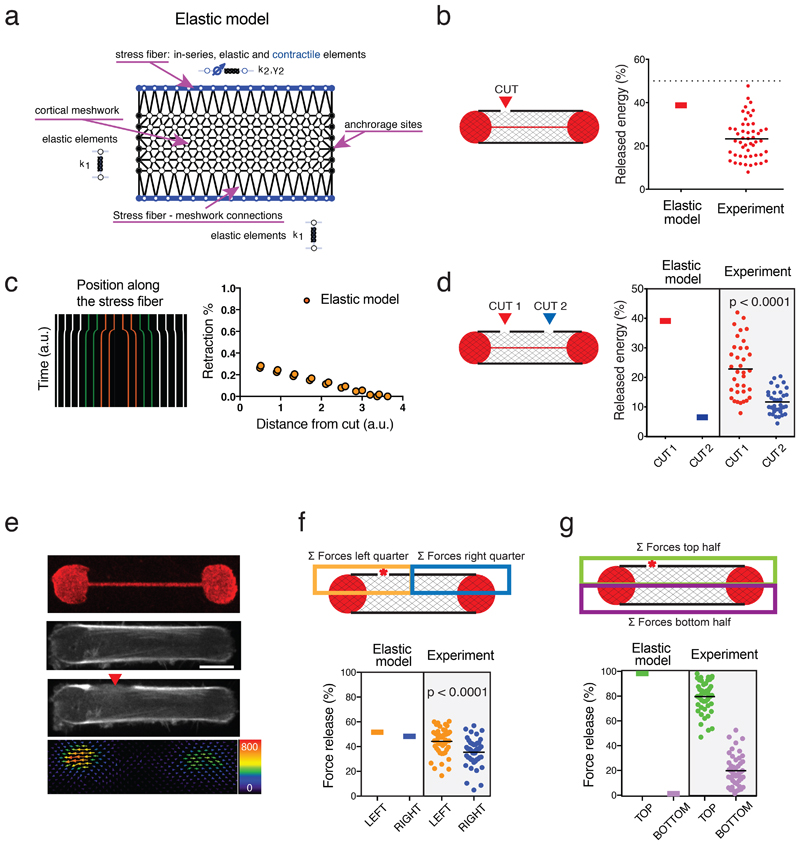
To investigate the properties of such a network of actin fibers embedded in a cortical meshwork, we built on the ideas developed in 28,38 to create a new biophysical model. In this model, and in contrast with previous ones, the stress fibers were not connected to the extra-cellular matrix but to the adjacent cortical meshwork. The cortical meshwork was described as a two-dimensional (2D) ensemble of elastic links connected by nodes. The stress fibers were modeled as elastic cables under tension and connected in series. The stress fibers were connected uniformly along their length to the cortical meshwork by elastic links (Figure 3a; described in detail in Supplementary Methods).
Figure 3. Model with active contractile stress fibers embedded in an elastic central mesh.
a. Diagram illustrating all components in the model, including the isotropic elastic cortical mesh, contractile elastic fibers along the long edges of the mesh, and adhesive sites located along the short edges of the mesh.
b. Plot displaying simulated traction-force loss as a result of the stress fiber ablation and corresponding experimental data. n=50 cells, mean is depicted.
c. Simulated kymograph of a stress fiber indicating the movement of the regularly-spaced markers after simulated photoablation. Plot of the associated retraction percentage of these markers as a function of the distance from the ablation site.
d. Predicted and experimental mechanical energy release after two sequential photoablations on the same stress fiber. n=35 cells; N=3 experiments, mean is depicted. p-value from a two-tailed paired t-test is indicated on the plot (p<0.0001).
e. Representative image of the dumbbell-shaped micropattern (fibrinogen-CY5) and RPE1-LifeAct-GFP cells displaying photoablation at a lateral side of the stress fiber (red arrow) and the associated relaxation traction force field after the photoablation. Image scale bar = 10 µm. Force scale bar in Pa. N=3 experiments.
f. Spatial distribution of force relaxation along the stress fiber after stress-fiber photoablation (red star). Left panel: The release of traction forces was considered in partitioned zones of the cell, where the orange zone included half the stress fiber and the off-centered photoablation site, and the blue zone included the other half of the stress fiber. Right panel: Plot displaying the prediction of the model and the experimental measurements (n=47 cells, N=4 experiments, mean is depicted) for the magnitude of released forces with respect to these zones. p-value from the two-tailed paired t-test is indicated on the plot (p=0.0016).
g. Spatial distribution of force relaxation across the cell after stress-fiber photoablation (red star). Left panel: The release of traction forces was considered in partitioned zones of the cell, where the green zone included the stress fiber with photoablation site, and the purple zone included the stress fiber without photoablation. Right panel: Plot displaying the prediction of the model and the experimental measurements (n=47 cells, N=4 experiments, mean is depicted) for the magnitude of released forces with respect to these zones.
We first tested the response of our model to fiber severing by locally reducing the stiffness by 90% in one of the stress-fiber elements (Figure 3b). As in the experimental set up, mechanical energy was released but was significantly less than 50%, even though in the model, it was exclusively produced by the two peripheral fibers (Figure 3b). The model also accurately accounted for the limited retraction of the fiber at distal points from the site of the simulated photoablation (Figure 3c). Furthermore, the model captured the additional release of energy after a second photoablation of the same fiber (Figure 3d).
Other experimental observations prompted further investigations of the model. In the experimental set up, the release in tension was not equivalent on the two severed parts of the stress fiber, and was not restricted to its distal ends: rather, the release in tension appeared higher at the end that was closer to the photoablation and extended to the other side of the cell (Figure 3e and other examples in Extended Data 2). By contrast, an isolated stress fiber would be expected to release the same amount of tension at both ends. This suggested that the cortical meshwork had an impact not only on the magnitude but also on the spatial distribution of traction-force production. To quantify this spatial effect in the model, the cell area was partitioned into four quadrants and the relative traction-force loss was measured in each quadrant as a percent amount of total traction-force loss in the cell (Figure 3f, g). Intriguingly, the model could barely account for the asymmetric traction-force loss at the end of the severed stress fiber (Figure 3f) and no traction-force loss occurred on the other side of the cell where the stress fiber was intact (Figure 3g). In addition, although we could define a given set of parameters for network elasticity that could account qualitatively for the various trends of traction-force relaxation, the traction-force changes were only in limited quantitative agreement with the equivalent experimental measurements (Figure 3b, d, f, g). Puzzled by the discrepancy between the predictions of the model and the measured loss of traction force on the other half of the cell after fiber photoablation, we decided to further interrogate the mechanical nature of the cortical meshwork.
The cortical meshwork is contractile
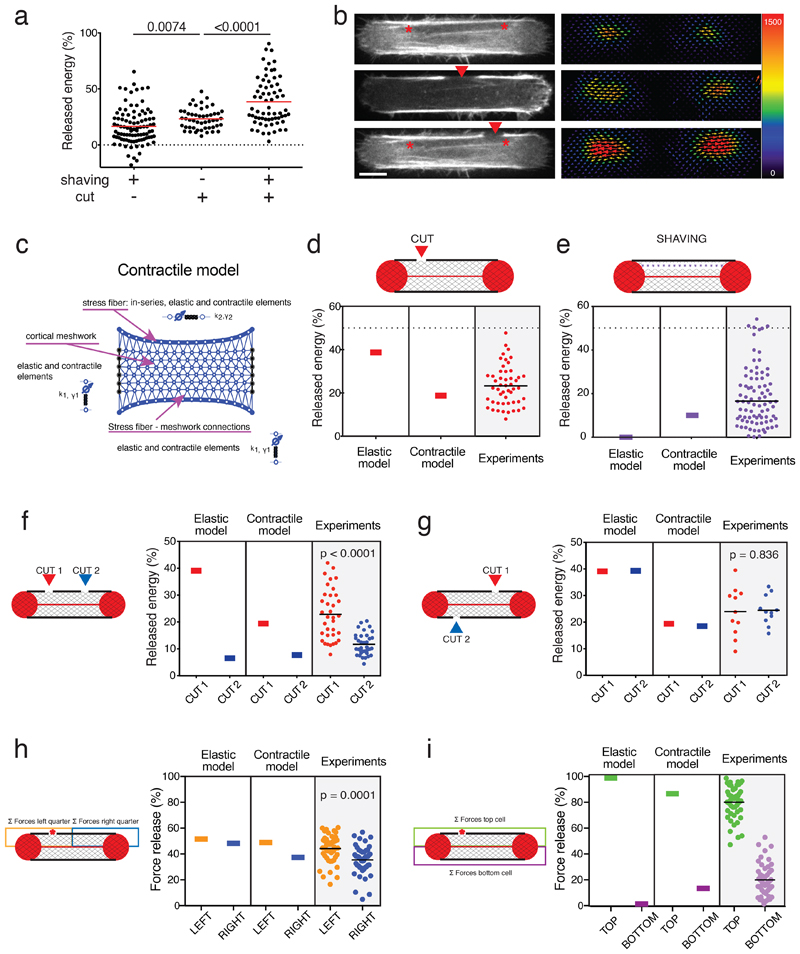
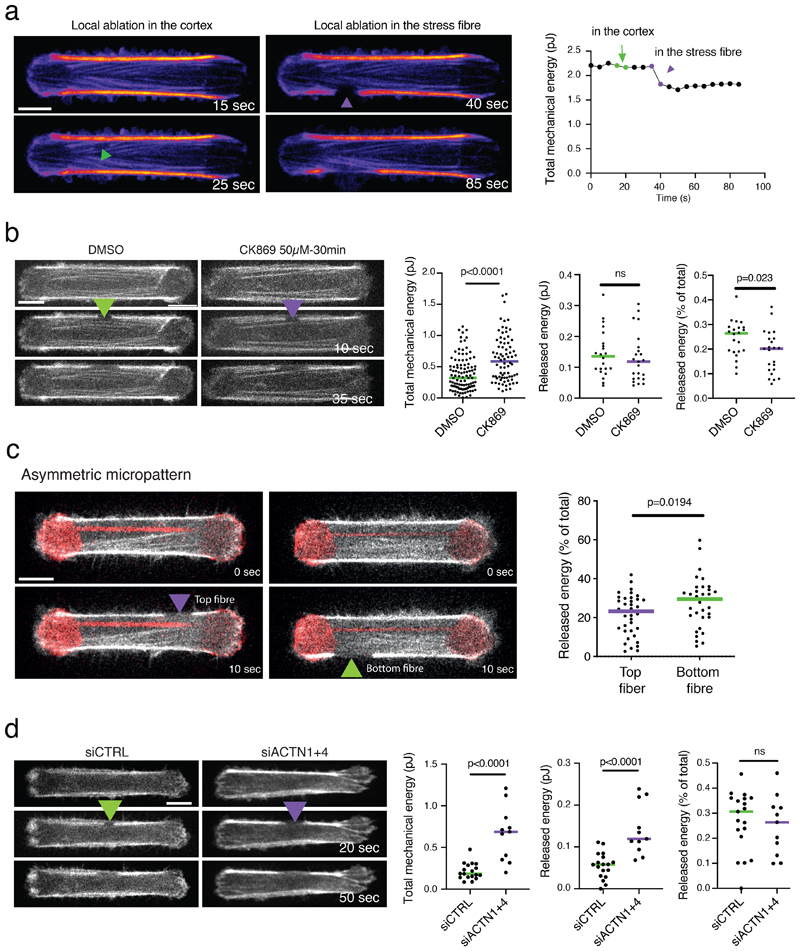
A local ablation in the cortical meshwork did not release a significant amount of energy as compared to the same ablation in a peripheral stress fiber (Extended Data 3a). However, the shaving of a stress fiber, i.e. the longitudinal photoablation of the cortical meshwork, led to a significant release of contractile energy, calculated as the percentage of the total mechanical energy before photoablation (Figure 4a and b). This release was comparable to that of fiber ablation. This result showed that the cortical meshwork was contractile and not passively elastic as initially hypothesized. It also meant that the cortical meshwork actively participated in the production of traction forces. Indeed, the release of mechanical energy after a single ablation and shaving of the stress fiber were additive (Figure 4a, b and Video 4), and consistent with the theoretical expectation these photoablations disrupted half of the contractile network (Figure 4a). The contractility of the cortex could also be revealed by impairing its branched architecture. The chemical inhibition of Arp2/3 complex increased the global cell contractile energy although it did not affect the amount of energy released by peripheral fiber ablation, suggesting that the global increase was specifically due to the reorganisation of the cortex (Extended Data 3b). Furthermore, moving the position of the bar of the dumbbell shape did not affect the peripheral fibers, but changed the area of the cortex they were connected to. As a result, the fiber associated with a larger part of the cortex released more energy when ablated, further showing that the cortex contributed to the production of force along the fiber (Extended Data 3c).
Figure 4. The cortical meshwork is contractile.
a. Scatter plot of the released mechanical energy after shaving (n=94 cells, N=14 independent experiments), single cut (cut; n=50 cells, N=4 independent experiments), or cut after shaving (shaving+cut; n=65 cells; N=14 independent experiments). p-values from two-tailed unpaired t-tests (p=0.0074 for cut vs shaving; p<0.0001 for cut vs shaving+cut). 19 outliers were removed from the analysis (remove outliers function of Prism).
b. Left panel: RPE1-LifeAct-GFP cells images depicting a stress fiber subject to shaving, single cut, and shaving plus cut; Right panel: corresponding traction-force maps. The same cell was represented to illustrate the shaving and shaving plus cut (top and bottom panels, respectively). Image scale bar = 10 µm. Force scale bar in Pa. N=3 experiments. Image scale bar = 10 µm.
c. Diagram illustrating all components in the fully contractile model, including an isotropic contractile cortical mesh.
d. Mechanical energy released after stress fiber photoablation (red arrow). Plot displaying the predictions of the elastic and contractile models and the experimental measurements (n=50 cells).
e. Mechanical energy release after shaving (purple line). Plot displaying the predictions of the elastic model and contractile models and the experimental measurements (n=94 cells; N=14). 9 outliers were removed from the plot (remove outliers function in Prism).
f. Sequential cuts on the same stress fiber (Cut 1=red arrow; Cut 2=blue arrow). Predictions of the elastic and contractile models and experimental data (n=35 cells, N=3 experiments). P-value calculated from a two-tailed paired t-test.
g. Sequential cuts on the two stress fibers in the cell (Cut 1=red arrow; Cut 2=blue arrow). Predictions of the elastic model and contractile models and experimental data (n=11 cells, N=1 experiment). P-value calculated from a two-tailed paired t-test.
h. Spatial distribution of force loss along the stress fiber after off-center stress-fiber cut (red star). The loss of traction forces was considered in partitioned zones of the cell: orange zone included half the stress fiber and the off-centered photoablation site, blue zone included the other half of the stress fiber. Plot displaying the prediction of the elastic and contractile models and the experimental data (n=47 cells). P-value calculated from a Wilcoxon paired t-test.
i. Spatial distribution of force loss after off-center stress-fiber photoablation (red star) in partitioned zones of the cell as described in h. Plot displaying the prediction of the elastic and contractile models, and the experimental data (n=47 cells).
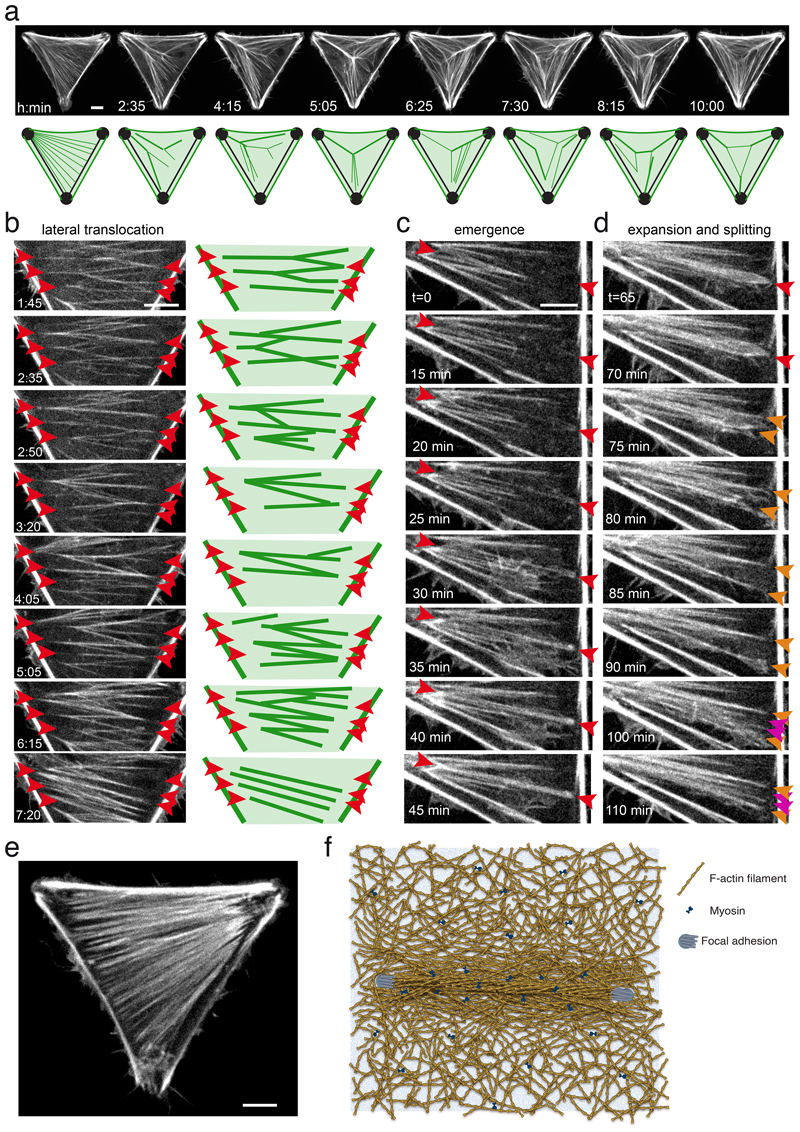
Figure 6. Emergence and translocation of cytoplasmic bundles in the cortical meshwork.
a. Live imaging of RPE1-LifeAct-GFP cells on tripod-shaped micropattern showing the global and permanent remodelling of network architecture, suggestive of a complex interplay of longitudinal and lateral forces on cytoplasmic bundles. See corresponding Video 5. N=1 experiment. Scale bar = 10 µm.
b. Live imaging of RPE1-LifeAct-GFP cells on tripod-shaped micropattern highlighting network reconfiguration by lateral translocation of cytoplasmic bundles in the absence of anchorage displacement (red arrows). See corresponding Video 6. N=1 experiment. Scale bar = 10 µm.
c. Live imaging of RPE1-LifeAct-GFP cells on tripod-shaped micropattern revealing the emergence of cytoplasmic bundles from the cortical meshwork (in between red arrows). See corresponding Video 7. N=1 experiment. Scale bar = 10 µm.
d. Live imaging of RPE1-LifeAct-GFP cells on tripod-shaped micropattern showing the lateral expansion of a bundle (red arrow), its splaying into a wider structure (orange arrows) and its re-coalescence into several adjacent bundles (magenta arrows). See corresponding Video 7. N=1 experiment. Scale bar = 10 µm.
e. RPE1-LifeAct-GFP cells on tripod-shaped micropattern displaying a dense and quasi-continuous network of cytoplasmic bundles. N=1 experiment.
In all panels, time is indicated in hours and minutes. Scale bar = 10 µm.
f. Schematic representation of the stress fiber anchored at its two edges on the substrate via focal adhesions (blue disks) as a fully embedded structure within the surrounding contractile actin cortex (myosins are represented by blue bow-ties).
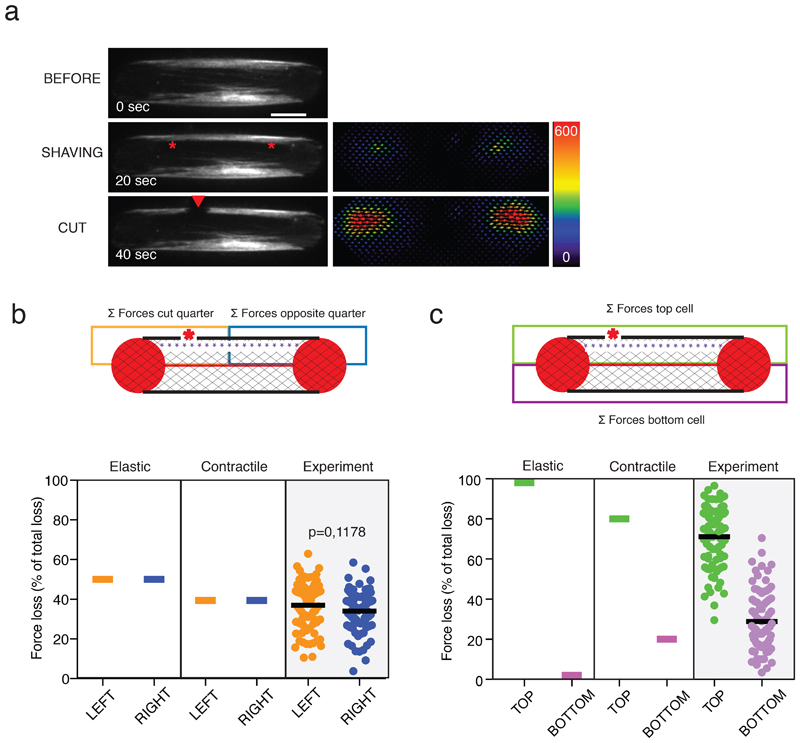
Hence, we revised our initial elastic model by including contractility as a function of the cortical mesh (Figure 4c). The links in the cortical mesh were thus considered as contractile cables; i.e. tensed elastic springs in series with contractile elements (Figure 4c). In this second contractile model, the spring constants and contractilities of the cortical mesh and fiber-mesh links were the same, and different from those characterizing the stress fibers. The estimations of the magnitude and localization of mechanical-energy release based on this contractile model were in better agreement with the experimental data; including that the contractile energy released after stress fiber ablation was lower than in the elastic model, (Figure 4d), and the contractile energy released after stress fiber shaving was higher than in the elastic model (Figure 4e). As with the elastic model, the contractile model accounted correctly for the difference in contractile-energy release after the second photoablation whether it was applied to the same or opposite stress fiber. However, the amount of contractile-energy released in these scenarios was in better agreement with experimental data with the contractile model than with the elastic model (Figure 4f and g). More importantly, the contractile model captured key features of the spatial distribution of traction-force loss in response to a single photoablation in contrast to the elastic model. The contractile model recapitulated the asymmetry of traction-force loss at both ends of the severed fibers (Figure 4h) and the significant traction-force loss registered on the opposite side of the cell (Figure 4i). In addition, with the scenario of shaving the stress fiber prior to an off-center photoablation of that fiber (Extended Data 4a), the contractile model, in comparison with the elastic model, better accounted for the left-right symmetrical loss of traction force (Extended Data 4b; see also Figure 3f), and captured the loss of traction force at the opposite side of the cell (Extended Data 4c).
The theoretical modelling combined with the experimental observations supported the hypothesis that the stress fibers and the cortical meshwork were mechanically similar in that they were both elastic and contractile. Therefore the stress fibers and the cortical meshwork may not be distinct networks with discrete interconnections, but part of a single integrated network, in which architecture and mechanics of actomyosin arrays vary in space.
The cortical meshwork forms a continuum with stress fibers
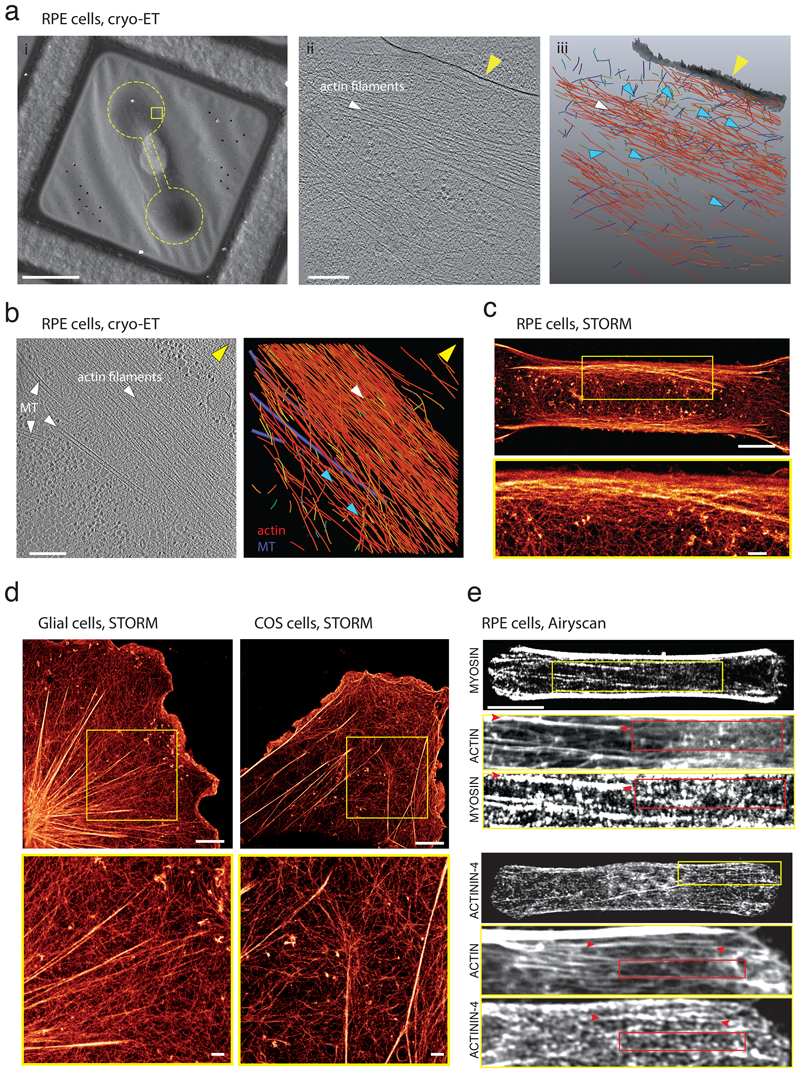
To investigate further the physical interplay between stress fibers and the cortical meshwork, fixed cells were imaged at the resolution of single actin filaments by cryo-electron tomography of micropatterned cells 42. It revealed that stress fibers were connected via multiple filaments to the meshwork that covers the plasma membrane (blue arrows in Figure 5a). Stress fibers did not appear as isolated structure but instead formed a continuous structure with the cytoplasmic meshwork (Figure 5b, Extended Data 5 and Video 5). The density of filaments decreased progressively from the inner part of the fiber to the cytoplasmic meshwork (blue arrows in Figure 5b). Fine intracellular architecture were also analyzed by stochastic optical reconstruction microscopy (STORM). Instead of two distinct networks on top of each others, the imaging revealed that stress fibers were fully entangled in the cortical meshwork. In the cortex, filaments formed bundles which were progressively more longitudinally-aligned with closer proximity to the peripheral stress fiber (Figure 5c). Similar continuous architectures, with progressive alignement of cortical filaments in the cortex up to their interlacing with the bundles forming the stress fibers were also observed with STORM in other cell types and in the absence of adhesive micro-pattern (Figure 5d). In particular, the zoom on the astrocyte shows several bundle sizes in the cortex ranging from few aligned filaments to larger bundles of few hundreds of nanometers. The zoom on the COS cell as for it shows the alignement and incorporation of individual filaments, or bundles of few filaments, at the end of a large bundle.
Figure 5. The stress fiber is fully embedded in the adjacent actin cortex.
a. (i) Cryo-Scanning Electron Microscopy of a vitrified RPE cell adhered on a dumbbell-shape micropattern. Yellow rectangle: putative location of the acquired tomograms. Yellow dashed line: dumbbell shape pattern size and position. Scale bar: 20 µm. (ii) Tomographic slice (6.8 nm thickness) in a second cell. Scale bar: 200 nm. Yellow arrow: plasma membrane; white arrows: actin filaments forming a bundle. (iii) Perspective view of the 3D rendering of the actin filament network from (ii). Blue-to-red color map of actin filaments: angular distribution (ranging from 0° to 90°) relative to the z-plane of the tomogram. Gray: plasma membrane. Blue arrows: filaments connecting the bundle to adjacent networks and notably transverse filaments (color-coded in blue by their orientation). N=2 experiments.
b. Cellular cryo-ET of the stress fiber. Left: A tomographic slice, 6.8 nm thickness, (see Extended Data 5) showing the organization of actin filaments into a stress fiber and associated microtubules (MTs). Right: 3D rendering of the actin filament network and microtubules (purple). Yellow arrow: plasma membrane. Blue arrows: lateral part of the bundle that is oriented toward the cytoplasm and where filament density is lower than in the inner part of the bundle. Scale bar: 200 nm. N=2 experiments.
c. STORM reconstructed image of the actin network (phalloidin-Alexa Fluor 647) in a RPE1 cell plated on a dumbbell-shaped micropattern on a glass substrate (scale bar=5 µm). The interlacing of the peripheral stress fiber with the surrounding actin cortex was highlighted in the yellow inset and associated zoom-in below (scale bar=1 µm). N=1 experiment.
d. STORM reconstructed image of the actin network of a rat astrocyte and a COS-7 cell and associated zoom-in of the yellow insets below. Scale bar = 5 µm. Zoom: Scale bar = 1 µm. N=1 experiment.
e. Top: Immunostainings of phospho-Myosin Light Chain in a RPE1 cell spread on polyacrylamide dumbbell-shaped micropattern. Scale bar = 10 µm. Zoom-in images of the yellow inset are displayed below for actin (phalloidin-ATO-488) and p-MLC. For the p-MLC, signal was displayed at saturation to highlight small myosin patches inside the actin mesh. Red arrows: area where actin structures are organized into bundles and red rectangles: areas devoid of actin-identifiable structures. Bottom: same with alpha-actinin. N=3 experiments.
We then studied the similarities and differences in the structure and composition of the cortical meshwork and the stress fibers. RPE1 cells on dumbell-shaped micropattern were immunostained for phospho-myosin light chain and alpha-actinin. With high-resolution confocal microscopy, although the density of actin filaments was lower in the region between the two stress fibers and appeared darker compared to the high intensity of the two fibers, a meshwork of bundles and filaments could be visualized at higher signal saturation, together with numerous patches of alpha-actinins and myosin (Figure 5e, top). Consistent with this observation, the down-regulation of the expression of alpha-actinins increased the contraction of both the cortex and the stress fibers (Extended Data 3d). These observations confirmed that although their architectures were different, the stress fibers and the central mesh shared several key molecular players involved in the regulation of their contraction.
Live imaging further supported our conclusion of the stress fibers being embedded in the cortical meshwork. Cells were plated on tripod-shaped micropattern in order to observe cytoplasmic network dynamics above a large non-adhesive area. Although cells were not moving, the actin network displayed a dramatic and permanent reorganisation (Figure 6a, Video 6). This corroborated previous observations that cytoplasmic bundles can fuse with or split from the peripheral fibers 9,43–46 (Extended Data 6a). The mechanism supporting the remodeling of network architecture, and in particular the lateral translocation of bundles, is still unclear. Longitudinal contractile forces, along the bundle, can promote the lateral translocation of curved bundles 9,46. Interestingly, rather straight bundles were also capable to move laterally and fuse and split with adjacent bundles (Figure 6b). These movements happen in response to the production of lateral forces, normal to the bundle, without any translocation of their anchorages (see arrows in Figure 6b and Video 7), suggesting that lateral forces were produced by the contractile meshwork between bundles, as recently suggested by others 47.
Interestingly, in regions of lower density of bundles, new bundles were found capable of emerging from the cortical meshwork (Figure 6c and corresponding Video 8, Extended Data 6a). Without any visible splitting event from adjacent bundles, the new bundle appeared as a thin line of higher density forming first near a former attachment to the substrate and elongating toward a pre-existing bundle (t=0 to t=30 min). Bundle thickening was homogeneous all along its length, suggesting further reinforcement by lateral recruitment of cortical filaments (t=30 to t=45 min). Interestingly, the newly formed bundle then expanded into a wider structure and eventually split into several bundles (indicated by orange arrows in Figure 6d and Video 8). This lateral expansion and splaying further supported the existence of lateral forces associated to the contractility of the adjacent cortical meshwork. The expansion and merging of bundles sometimes led to the assembly of quasi-continuous structure in which individual bundles were almost impossible to distinguish (Figure 6e) 47. This showed that stress fibers were not only connected to the cortical meshwork but could also stem from the coalescence of filaments in the cortex; an assembly process that further accounts for their complete embedding in this meshwork (Figure 6f).
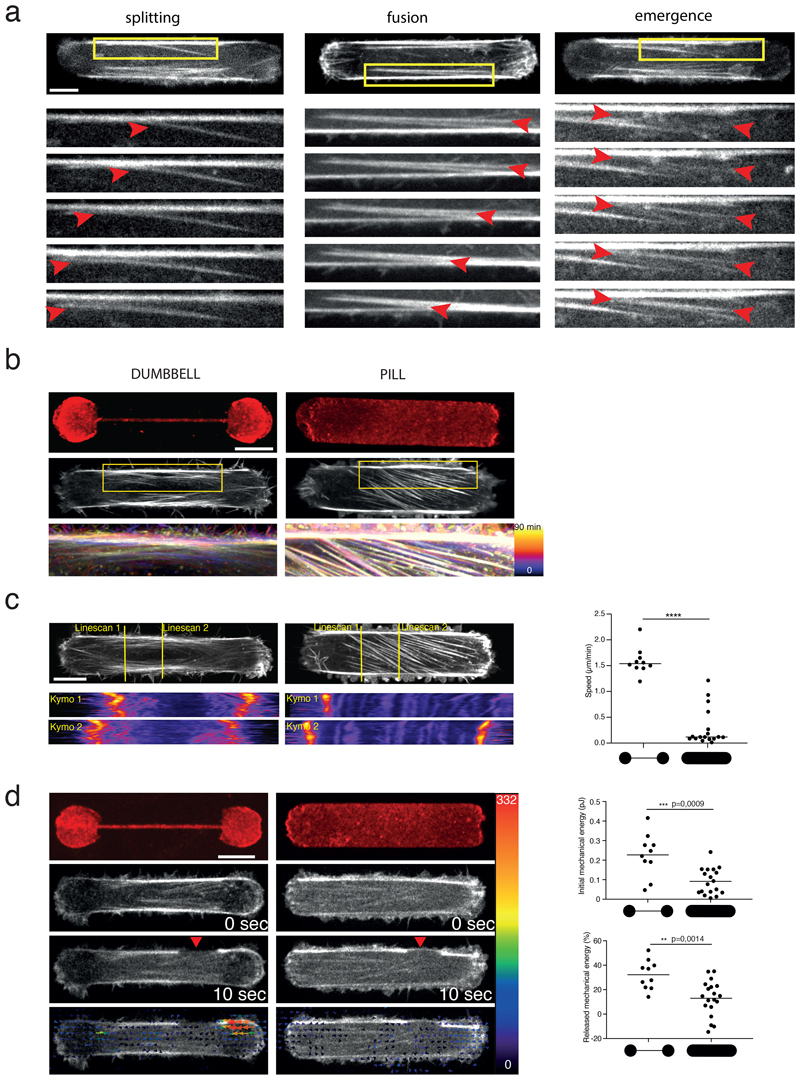
Bundles appeared more static above an adhesive area than above a non-adhesive area (Extended Data 6b,c). This further suggested that the capacity to glide in the cortex helped the coalescence of thin bundles into larger stress fibers, whereas the presence of anchorage to the underlying extra-cellular matrix kept thin bundles static and separated. This absence of coalescence of small bundles into larger fibers above adhesive regions could account for lower energy release induced by bundle ablation in pill-shaped as compared to dumbell-shaped micropatterns (Extended Data 6d) and for the difference in total cellular force production in geometries with various level of no-adhesive area (Figure 1c,d and Extended Data 1d).
Discussion
Our investigation of the force production by different actin networks revealed unexpected properties of the intracellular actomyosin machinery that appeared essential to integrate and transmit forces at the level of the cell. We demonstrated that the stress fibers are fully embedded in a contractile cortical actin network, and are not independent structures or structures with only discrete connections to other stress fibers. This meshwork of stress fibers and cortical filaments form a mechanical continuum (Figure 6f). Our conclusion is in agreement with the previous ultrastructural observations of the cortical-actin–network connections to stress fibers and the more recent electron-microscopy demonstration that these connections depend on filamin A 21,48,49. It also fits well with high-resolution imaging showing self-alignement of myosinII contractile ministacks in random meshworks 50 and lateral interactions of myofibrils, which support a long range self-organization of contractile structures 47,51. Hence we found that contractile forces generated by the stress fiber are not only manifested at stress fiber anchorage points but are also propagated across the entire cell via the cortical meshwork. Also, we demonstrated that the contraction of the cortical meshwork actively contributes to traction force transmission to focal adhesions, thereby impacting the overall magnitude of contractile energy of the cell.
The mechanical interdependence of stress fibers and the cortical meshwork was supported by visualization of the network architecture in that filaments in the cortical meshwork tended to align with closer proximity to the stress fiber (Figure 6f). This suggested that the randomly orientated filaments in the cortical network were converted into bundles of aligned filaments the nearer they were to the stress fiber, perhaps in a self-amplifying mechanism in which the bundle reinforces the tension in the stress fiber. We suspect this interconversion mechanism between the thin and non-attached filaments of the cortical network and bundled filaments to be essential for the rapid modulation of the production of traction forces, in response to changes of geometrical and mechanical cues.
Methods
Preparation of micropatterned polyacrylamide gels
The preparation of patterned polyacrylamide hydrogels was performed according to the Mask method previously described in 52. A quartz photomask was first cleaned through oxygenplasma (AST product, 300 W) for 3.5 min at 200 W. Areas containing the patterns were then incubated with 0.1 mg/ml PLL-g-PEG (JenKem Technology ZL187P072) in 10mM HEPES pH 7.4, for 30 min. After de-wetting, the mask was exposed under deep-UV for 5 min. Next, patterns on the mask were incubated with a mix of 10 µg/ml fibronectin (#F1141, Sigma) and 20 µg/ml fibrinogen-Alexa-Fluor-647 conjugate (#F35200, Invitrogen) in 100mM sodium bicarbonate buffer pH=8.4 for 30 min. A mix of acrylamide (8%) and bis-acrylamide solution (0.264%) (Sigma) corresponding to the experimental Young modulus of 34.8 kPa was degassed for approximately 30 min, mixed with 0.2 µm PLL-PEG coated fluorescent beads (Fluorosphere #F8810, Life Technologies) and sonicated before addition of APS and TEMED. 25 µl of that solution was added on the micropatterned photomask, covered with a silanized coverslip (Silane, #M6514, Sigma) and allowed to polymerize for 25 min before being gently detached in the presence of sodium bicarbonate buffer. Micropatterns were stored overnight in sodium bicarbonate buffer at 4°C before plating cells.
AFM measurements of the Young’s modulus of acrylamide gels
Gel stiffness was measured through nano-indentation using an atomic force microscope (Bruker Nanoscope) mounted with silica-bead-tipped cantilevers (r(bead) = 2.5 μm, nominal spring constant 0.06 N m−1 , Novascan Technologies). The sensitivity of the photodiode to cantilever deflection was determined by measuring the slope of a force-distance curve when pressing the cantilever onto a glass coverslip. The force constant of the cantilever was determined using the thermal-noise method included in the Bruker Nanoscope software. For each acrylamide/bis-acrylamide ratio used in the traction-force microscopy measurements, 27 force curves in 3 by 3 grids were acquired (2 μm spacing between points) at three different locations on the gels. Before and during indentation experiments, gels were kept in PBS. Stiffness values from force curves were obtained using the NanoScope Analysis software, correcting for baseline tilt using the linear fitting option with the Hertz model and a Poisson ratio of 0.48 on the indentation curve.
Preparation of micropatterned glass slides
To increase the resolution of actin images, RPE-1 cells were grown on glass micropatterns prepared as previously described in 53. Glass coverslips were spin-coated for 30 sec at 3000 rpm with adhesion promoter Ti-Prime (MicroChemicals), then heated for 5 min at 120°C and spin-coated again for 30 sec at 1000 rpm with 1% polystyrene in toluene (Sigma). Coverslips were then oxidized by plasma (FEMTO, Diener Electronics) (19 sec, 30 W) and incubated for 30 min with 0.1 mg/ml PLL-g-PEG (PLL20K-G35-PEG2K, JenKem) in 10 mM HEPES pH 7.4. Dried coverslips where next exposed to deep-UV (UVO cleaner, Jelight) through a photomask (Toppan) for 5 min. Coverslips were incubated for 30 min with 10 µg/ml fibronectin (Sigma) and 20 µg/ml fibrinogen-Alexa-Fluor-647 conjugate (Invitrogen) in PBS (phosphate buffered saline) after UV exposure.
Cell culture
Human telomerase-immortalized retinal-pigmented epithelial cells (RPE1; Clontech) either expressing LifeAct-GFP or parental (Vignaud et al., 2012) were grown in a humidified incubator at 37°C and 5% CO2 in DMEM/F12 medium supplemented with 10% fetal bovine serum and 1% penicillin/streptomycin (GIBCO/Life technologies). Cells were plated at approximately 15000 cells/ml on patterned polyacrylamide gels and left to spread for 3 to 4 hours before imaging. The Arp2/3 complex was inhibited with CK869 (Sigma Aldrich C9124, 50µM). To down-regulate the expression of alpha-actinin, RPE1 cells were transfected with two set of siRNAs (Qiagen) using lipofectamine RNAi Max transfection reagent (Life Technologies) at a final concentration of 10 nM following the manufacturer’s protocol. Strand sequences were: siACTN4 :5’-GCAGCAUCGUGGACUACAATT-3’ ; siACTN1 :5’-GCACCAUCAUGGACCAUUATT-3’. COS7 cells (ATCC CRL-1651) were cultured in DMEM (Gibco) supplemented with 2 mM GlutaMAX (Gibco), 50 U/ml penicillin, 50 μg/ml streptomycin (Penstrep, Gibco) and 10% foetal bovine serum (FBS; Gibco)55. Rat hippocampal neurons were cultured on 18 mm coverslips at a density of 6,000/cm from embryonic day 18 pups 56 following established guidelines of the French Animal Care and Use Committee (French Law 2013-118 of 1st February 2013) and approval of the local ethics committee (agreement 2019041114431531-V2 #20242). In these neuronal cultures, a small number of astrocytes (glial cells) such as the one shown in Figure 5 are present and were labelled and imaged.
Immunostaining and labeling
Cells were pre-permeabilized in 0.5% Triton X-100 in cytoskeleton buffer for 17 sec for p-MLC and alpha-actinin staining and then rapidly fixed in 4% paraformaldehyde in cytoskeleton buffer 10% sucrose pH 6.1 for 15 min at room temperature. Cells were then washed twice with cytoskeleton buffer and incubated in quenching agent 0.1 M ammonium chloride for 10 min. For all conditions, after fixation, the cells were washed then blocked with 1.5% bovine serum albumin (BSA) for 45 minutes. The cells were incubated with appropriate dilutions of primary antibodies in PBS containing 1.5% BSA and 0.1% Tween overnight at 4°C in a humid chamber. For the primary antibodies, anti-phospho-myosin light chain 2 (#3671, Cell Signaling Technology), anti α-actinin (#05-384, Merck Millipore, clone AT6/172), and anti-paxillin (#610051, BD Biosciences, clone 349) were used. After several washing steps, the coverslips were then incubated with secondary antibodies (Alexa-Fluor antibodies, Invitrogen) diluted in PBS with 1.5% BSA and 0.1% Tween for 1 h at room temperature in a humid chamber. After washing, Phalloidin-FITC (#P5282, Sigma) was incubated for 20 min. After washing, coverslips were then mounted onto slides using Prolong Gold antifade reagent with DAPI (#P36935, Invitrogen). Fluorescent Tetraspeck microspheres of 0.5 µm diameter (#T7281, Life Technologies) were in some cases incubated with the coverslip to provide an internal fluorescence intensity reference. Whenever needed, SirActin (SC001, Spirochrome) was used at a concentration of 500 nM for 3 h to stain actin in living cells.
STORM imaging
After fixation and immunolabeling 55, cells were incubated with phalloidin-Alexa-Fluor-647 (0.5 µM, Thermo Fisher) overnight at 4°C. After two quick rinses in phosphate buffer, RPE1 cells were mounted in a closed chamber in STORM buffer (Smart kit, Abbelight) and imaged by STORM as described previously 57 using an N-STORM microscope (Nikon Instruments) equipped with an Ixon DU-897 camera (Andor) and controled with Nikon Elements. Phalloidin (0.25µM) was added in the STORM medium to mitigate progressive unbinding from actin filaments during imaging 55. After locating a cell using low-intensity illumination, epifluorescence images were acquired in both the green and far-red channels. For STORM imaging of actin, the sample was continuously illuminated at 647nm (full power) and a series of 60000 to 100000 images (256x256 pixels, 15 ms exposure time). The N-STORM software (Nikon Instruments) was used for the localization of single fluorophore activations. After filtering, localizations with more than 800 photons, the list of localizations was exported as a text file and the ThunderSTORM plugin 58 of Fiji was used to generate reconstructions.
Image acquisition and photoablation
Images of the different immunostainings and high-resolution time-lapse of actin dynamics on PILL and DUMBBELL micropatterns were acquired on a confocal microscope Zeiss LSM800 using a 63X magnification objective (Zen Blue version 2). Staining of p-MLC, α-actinin and paxilin were imaged using an AiryScan detector. GaAsP detectors were used for DAPI and micropattern stainings. Traction-force mapping, together with regular RPE1-LA-GFP, actin-GFP (CellLight™ Actin-GFP, BacMam 2.0 from ThermoFischer Scientific) or SirActin (SC001, Spirochrome) imaging, were performed on a confocal spinning-disk system (EclipseTi-E Nikon inverted microscope equipped with a CSUX1-A1 Yokogawa confocal head, an Evolve EMCCD camera from Roper Scientific, Princeton Instruments). Photoablation was performed on a spinning-disk system from Nikon using the iLas2 device (Gataca Systems) equipped with a passively Q-switched laser (STV-E, ReamPhotonics, France) at 355 nm producing 500 picoseconds pulses. Laser displacement, exposure time and repetition rate were controlled via ILas software interfaced with MetaMorph (Universal Imaging Corporation). Laser photoablation and subsequent imaging was performed with a 100X CFI S Fluor oil objective (MRH02900, Nikon) or a 60X CFI S PLAN FLUOR ELWD objective. The laser power delivered before the objective, measured in the same conditions as the one used to perform photoablation experiment, was around 0.5mW at 100% laser. According to the specifications of the objectives used, this corresponds approximately to 250 µW delivered at the output of the objective. The stress-fiber punctual photoablation was performed on fly during live acquisition. For the stress-fiber shaving, photoablation was performed on a narrow region medial and parallel to the length of the fiber above the non-adhesive substrate on the hydrogel. In this case, 13 repetitions of 25 ms pulses were used with 100% of the 355nm laser power, corresponding to a pulse of approximately 450 ms. Cells showing leakage or local blebbing following ablation were excluded from the analysis.
Measurement of cell traction forces with ImageJ
Data were analysed with a set of macros in Fiji using the method previously described in 59. Displacement fields were obtained from fluorescent bead images before and after removal of cells by trypsin treatment. Bead images were first paired and aligned to correct for experimental drift. Displacement field was calculated by particle imaging velocimetry (PIV) on the basis of normalized cross-correlation following an iterative scheme. Final vector-grid size ranged from 1.55 µm X 1.55 µm to 1.60 µm X 1.60 µm depending on magnification. Erroneous vectors were discarded owing to their low correlation value and replaced by the median value of the neighbouring vectors. Traction-force field was subsequently reconstructed by Fourier-transform traction cytometry, with a regularization parameter set to 8x10-11. Force vectors located outside of the micropattern area were discarded. Force quadrant analysis: Cell-traction force was computed above. The traction-force field was divided into 4 zones using the two planes of symmetry of the dumbbell shape of the micropattern. In each zone, forces were summed-up vectorially. The resulting vector was then located at the center of the zone for display.
Cryo-electron Tomography of micropatterned cells
Gold mesh (Au) grids overlaid with a perforated (R1/4) SiO2 film (Quantifoil Micro Tools, Jena, Germany) were micropatterned using a one-step passivation, and a DMD-based illumination combined with a photo-activator, as previously described 42,60 (Leonardo v4.12, Alveole Lab, France). RPE1 cells were seeded on fibronectin micropatterned grids at a density of 8 × 10³ cells/cm2 for 20-35 min. Next, grids were transferred to a cell-free dish and incubated at 37°C with 5 % CO2 to allow cell adhesion. Cells were vitrified 4-7 h post-transfer. Grids were blotted from the back side of the grid support film and immediately plunged into liquid ethane at liquid nitrogen temperature using a Leica EM GP plunger (Leica Microsystems, Vienna, Austria). Cell thinning and imaging is described in Supplementary Methods.
Statistical analysis
Statistical analysis and chart design was performed using Graphpad Prism 6 and R version 3.4.0 together with RStudio version 1.0.143.
Extended Data
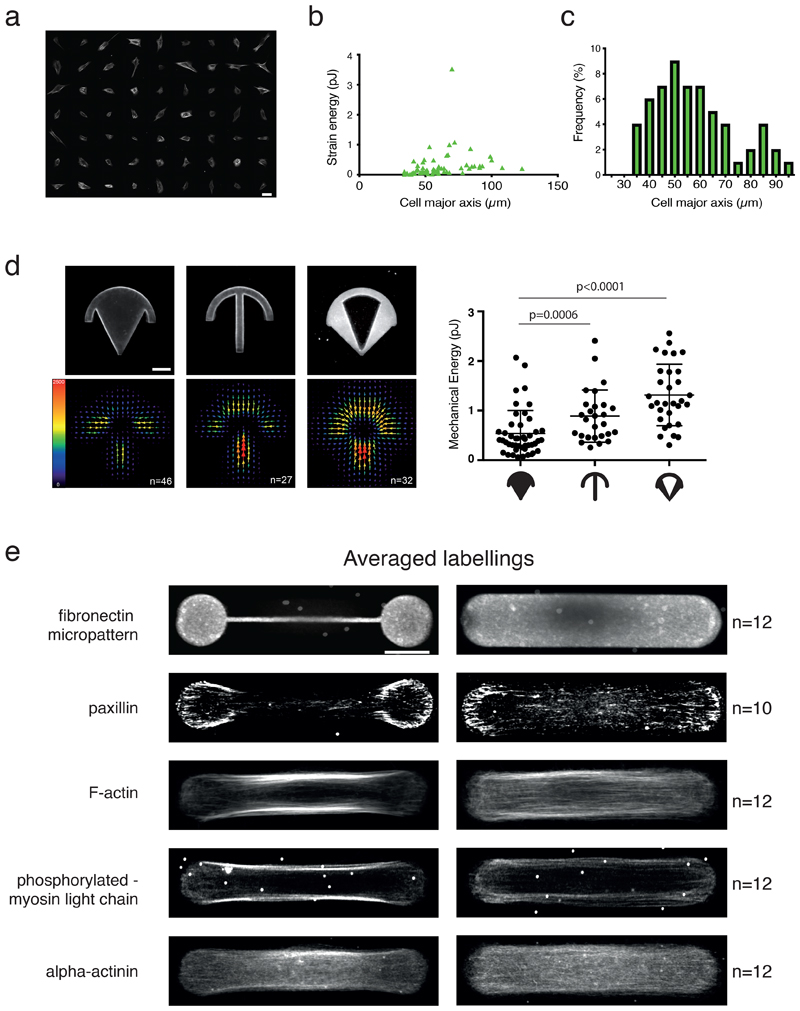
Extended Data Fig. 1. Variations of contractility with cell shape and architecture.
a. Actin filaments staining (SirActin 1 µM) of RPE1 live cells on homogeneous (non-micropatterned) fibronectin-coated poly-acrylamide gels. N=1 experiment. Scale bar=50 µm.
b. Variation of the strain energy associated to cell traction forces with respect to the length of non-micropaterned cells. n=63 cells, N=1 experiment
c. Distribution of the length of RPE1 cells on homogeneous (non-micropatterned) poly-acrylamide gels.
d. Traction-force maps of cells spread on various micropattern shapes. Upper images display the fibronectin coating on the micropatterns, and lower images show averaged traction-force maps of cells (scale bar in Pa). n-plain crossbow=46 cells, n-regular crossbow=27 cells, n-empty crossbow=32 cells, N=1 experiment. The graph shows the scatter plot of the mechanical energies on each micropattern and associated p-value (mean and standard deviation are depicted, two-tailed Mann-Whitney t-tests, p=0.0006 between plain and regular crossbow, p<0.0001 between regular and empty crossbow). 2 outliers were automatically removed from the analysis (remove outliers function of Prism).
e. Averaged localization of molecular components involved in cell contractility for cells displaying either two main peripheral stress fibers (when plated on dumbbell-shaped micropattern, left) or a continuous actin mesh (when plated on pill-shaped micropattern, right). For each shape, averaged Z projections of cells are displayed. From top to bottom: micropatterns labeling (fibrinogen-Cy5); actin (phalloidin-ATO-488); paxillin (alexa-488); phospho-MLC (CY3); alpha-actinin (CY3). Image scale bar = 10 µm. N=3 experiments.
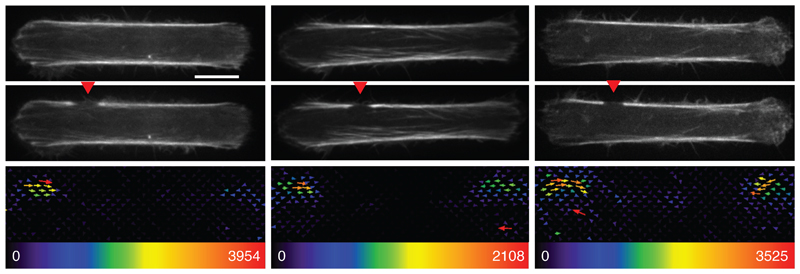
Extended Data Fig. 2. Asymmetric force relaxation after an off-centered stress fiber cut.
Images of RPE1-LA-GFP cells after off-centered photoablation of the stress fiber (red arrow) and the associated traction maps. Image scale bar = 10 µm. Force scale bar in Pa. N=3 experiments.
Extended Data Fig. 3. Regulation of the contributions of the cortex and the peripheral stress fibers to the total force.
a. Comparison of the relative releases of strain energy following a single local ablation in the cortical meshwork (green arrowhead) or in the peripheral stress fiber (red arrowhead). n=1 cell, N=1 experiment
b. Measurement of the total strain energy and the released energy following stress fiber ablation in control cells and cells treated with the Arp2/3 inhibitor CK869 (50µM, 30 minutes). The total energy was increased in response to CK869, but the ablation of the fiber did not release more energy than in the control case, suggesting that the global increase was due to the hyper-contraction of the cortical network. In this experiment, cells from 2 different sizes (59 and 64 µm) were analyzed. For total mechanical energy: nDMSO=105 cells, nCK869=76 cells; N=3 experiments; p-value from unpaired t-test is indicated on the plot (p<0.0001). For ablation: nDMSO=22 cells, nCK869=23 cells; N=1 experiment. Statistical significance and p-value from a two-tailed paired t-test is indicated on the plot (p=0.4074 for released energy; p=0.023 for relative released energy). Medians are depicted. 7 outliers were automatically excluded from the analysis for the initial energy plot and 1 for the ablation plots (remove outliers function of Prism).
c. Releases of strain energy following a single ablation of peripheral stress fibers on asymmetric dumbbells (central bar off-centered by 2 µm). The top fiber was connected to a small area of cortex, spaning the space between the fiber and the anchorage on the bar. The bottom fiber was connected to a larger cortical network. The ablation of the bottom fiber released more contractile energy. nTop fiber=38, nBottom fiber=35; N=3 experiments, median is depicted. 2 cells for which stress fiber ablation was not efficient were eliminated from the analysis. p-value from two-tailed unpaired t-test is indicated on the plot (p=0.0194). 2 outliers were automatically excluded from the analysis (remove outliers function of Prism).
d. Measurement of the total strain energy and the released energy following stress fiber ablation in cells treated with a control siRNA or with siRNA against apha-actin1 and actinin4. Down-regulation of alpha-actinins increased the total contractile energy, as well as the energy released by fiber ablation. The ratio between the two was not affected, suggesting that the contraction of the cortex increased as well. In this experiment, cells from 2 different sizes (59 and 64 µm) were analyzed. For total and released mechanical energy: n-siCTRL=18 cells, n-siACTN1+4=11 cells, for released mechanical energy % of total: n-siCTRL=19 cells, n-siACTN1+4=11 cells; N=1 experiment. p-values from two-tailed unpaired t-tests are indicated on the plots (p<0.0001 for initial and released energy, p=0.6678 for relative released energy). 1 oulier was automatically excluded from the analysis (remove outlier function of Prism).
Extended Data Fig. 4. Elastic and contractile model predictions of the force loss distribution after stress fiber shaving and photoablation.
a. From top to bottom: Images of a representative RPE1-LA-GFP cell depicting the precut cell; a shaving; a consecutive cut together with the associated forces relaxed upon photoablation on the right panel. Image scale bar = 10 µm. Force scale bar in Pascal. N=3 experiments.
b. Spatial distribution of force loss along the stress fiber after stress-fiber shaving (purple dashed line) and off-center photoablation (red star). The loss of traction forces was considered in partitioned zones of the cell, where the orange zone included half the stress fiber and the off-centered photoablation site, and the blue zone included the other half of the stress fiber. Plot displaying the predictions of the elastic model, the contractile model and the experimental measurements (n=80 cells, N=14, mean is depicted). The p-value from a two-tailed paired t-test is indicated on the plot (p=0.1178).
c. Spatial distribution of force loss along the stress fiber after stress-fiber shaving (purple dashed line) and off-center photoablation (red star). The loss of traction forces was considered in partitioned zones of the cell, where the green zone included the stress fiber with photoablation site, and the purple zone included the stress fiber without photoablation. Plot displaying the predictions of the elastic model, the contractile model and the experimental measurements (n=80 cells, N=14, mean is depicted).
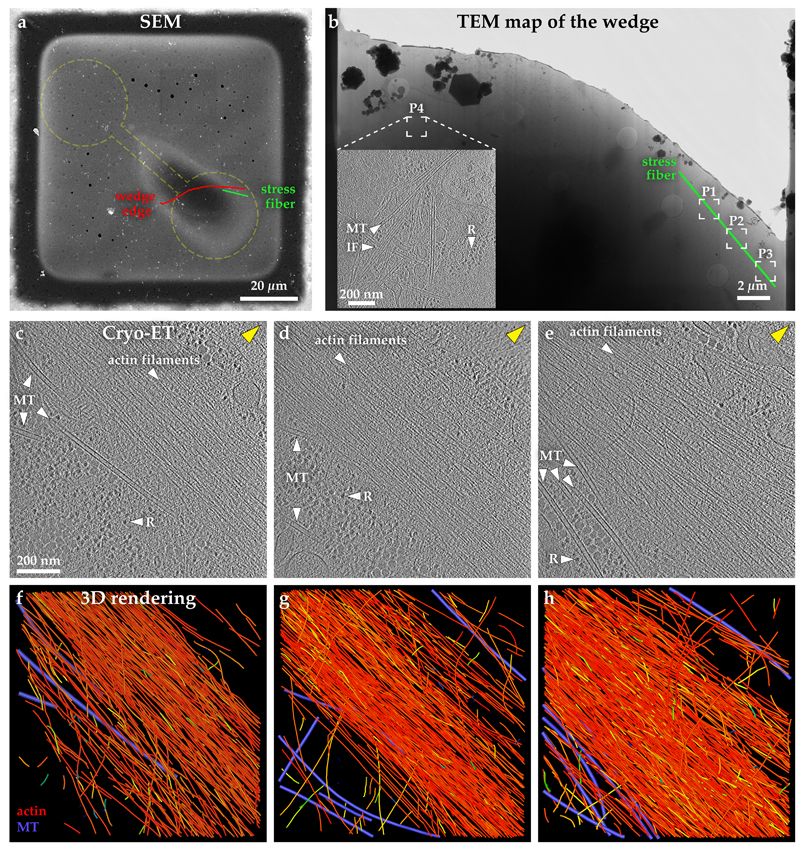
Extended Data Fig. 5. Actin filament organisation in 3D within and near the stress fiber.
a. Cryo-Scanning Electron Microscopy of a vitrified RPE cell adhered and spreading on a dumbbell-shape micropattern. Red line indicates the putative position of the edge of the wedge produced by cryo-FIB milling. The green line indicates the position of the stress fiber imaged by cryo-ET. The yellow dashed line represents the dumbbell shape pattern size and position.
b. Cryo-TEM of the wedge of the RPE cell shown in (a), displaying the positions (P1-P4) for cryo-ET. Inset: 6.8 nm thick tomographic slice of the P4 region. Microtubules (MTs); ribosomes (R); intermediate filaments (IF).
c-e. Cellular cryo-ET. Tomographic slices (6.8 nm thickness) of three positions - P1, P2 and P3 - in (b), respectively, along the same stress fiber. The three tomograms start at the basal membrane and extend the thickness of the tomograms towards the apical membrane. The distance between consecutive tomographed positions is ~ 2.5 µm (center-to-center of the tomograms), covering a total distance of ~7 µm. N=2 experiments.
f-h. 3D rendering of the actin filament network and microtubules (purple) from (c), (d), and (e), respectively. Blue-to-red color map of actin filaments represent the angular distribution (ranging from 0° to 90°) relative to the z-plane of the tomogram. Most actin filaments are positioned parallel to the basal membrane. See related Video 5.
Extended Data Fig. 6. Dynamics and mechanics of cortical bundle fusion with lateral stress fibers depending on anchorage with the underlying extra-cellular matrix.
a. Live imaging of RPE1-LifeAct-GFP cells on dumbbell-shaped micropattern revealing the splitting and fusion of cytoplasmic bundles with peripheral stress fibers (left and middle columns) as well as the emergence of cytoplasmic bundles from the cortical meshwork (at the red arrow head) and its connection with peripheral stress fibers (right column). Images from top to bottom show sequential acquisitions with a time frame of 10 minutes. N=1 experiment.
b. Color-coded overlay of sequential images acquired every 10 minutes on dumbbell-shaped (left) and pill-shaped micropatterns (right). Color overlay showed static structures in white and moving structures in colors ranging from blue to yellow depending on the time frame in which they were acquired. Scale bar=10µm.
c. Transversal linescans allowing the ploting of kymographs showing the transversal motion of internal actin bundles on dumbbell-shaped (left) and pill-shaped micropatterns (right). The graphs show the quantification of bundle velocity measured on the kymographs. n-dumbbell=18 actin paths, n-pill=10 actin paths; N=1 experiment; median is depicted. Statistical significance of two-tailed unpaired t-test is indicated on the plot (p<0.0001).
d. Measurement of the total strain energy and the released energy following stress fiber ablation in cells plated on dumbbell-shaped (left) and pill-shaped micropatterns (right). Images show, from top to bottom: Micropattern labeling (fibrinogen-CY5); Actin before stress-fiber photoablation (0 sec) and after stress-fiber photoablation (10 sec); Overlay of the traction-force map and actin-staining image after photoablation. Image scale bar = 10 µm. Graphs show the initial mechanical energy of the cells before the photoablation (top) and the released mechanical energy following photoablation of the peripheral stress fiber (% of the initial mechanical energy) (bottom). n= 10 cells for dumbbell and n=18 cells for pill, N=1 experiment, means are depicted. The p-values from a two-tailed Mann-Whitney t-test are indicated on the plots (p=0009 for initial energy, p=0014 for released energy).
Supplementary Material
Acknowledgements
We thank the live microscopy facility MuLife of IRIG/DBSCI, funded by CEA Nanobio and labex Gral for equipment access and use. This work was supported by grants from European Research Council (741773, AAA) awarded to LB, (771599, ICEBERG) awarded to MT, from Agence Nationale de la recherche ANR (ANR-14-CE11-0003-01, MaxForce) awarded to LB and MT, and from US Army Research Office (grant W911NF-17-1-0417) to A.M.. J.M. acknowledges the EMBL for funding. M.T.-N. was supported by a fellowship from the EMBL Interdisciplinary (EI3POD) programme under Marie Skłodowska-Curie Actions COFUND (664726).
Footnotes
Author contributions
TV and LK performed most of the experiments. QT performed preliminary work related to fiber ablation and traction force microscopy. CC and AM conceived and run the model. CL performed STORM imaging. MTN and JM performed the cryo-ET. LB, AM, MT and LK designed the experiments, supervised the project and analyzed data.
Competing interest
The authors declare no competing or financial interests.
Data Availability Statement
Raw data are available from the corresponding authors upon request.
Code Availability Statement
Code is available from the corresponding authors upon request.
References
- 1.Katoh K, Kano Y, Masuda M, Onishi H. Isolation and Contraction of the Stress Fiber. Mol Biol Cell. 1998;9:1919–1938. doi: 10.1091/mbc.9.7.1919. [DOI] [PMC free article] [PubMed] [Google Scholar]
- 2.Chrzanowska-Wodnicka M, Burridge K. Rho-stimulated contractility drives the formation of stress fibers and focal adhesions. J Cell Biol. 1996;133:1403–15. doi: 10.1083/jcb.133.6.1403. [DOI] [PMC free article] [PubMed] [Google Scholar]
- 3.Naumanen P, Lappalainen P, Hotulainen P. Mechanisms of actin stress fibre assembly. Journal of Microscopy. 2008;231:446–454. doi: 10.1111/j.1365-2818.2008.02057.x. [DOI] [PubMed] [Google Scholar]
- 4.Chugh P, et al. Actin cortex architecture regulates cell surface tension. Nat Cell Biol. 2017;19:689–697. doi: 10.1038/ncb3525. [DOI] [PMC free article] [PubMed] [Google Scholar]
- 5.Chugh P, Paluch EK. The actin cortex at a glance. J Cell Sci. 2018;131 doi: 10.1242/jcs.186254. jcs186254. [DOI] [PMC free article] [PubMed] [Google Scholar]
- 6.Livne A, Geiger B. The inner workings of stress fibers - from contractile machinery to focal adhesions and back. J Cell Sci. 2016;129:1293–1304. doi: 10.1242/jcs.180927. [DOI] [PubMed] [Google Scholar]
- 7.Kurzawa L, et al. Dissipation of contractile forces: the missing piece in cell mechanics. Mol Biol Cell. 2017;28:1825–1832. doi: 10.1091/mbc.E16-09-0672. [DOI] [PMC free article] [PubMed] [Google Scholar]
- 8.Burridge K, Guilluy C. Focal adhesions, stress fibers and mechanical tension. Exp Cell Res. 2016;343:14–20. doi: 10.1016/j.yexcr.2015.10.029. [DOI] [PMC free article] [PubMed] [Google Scholar]
- 9.Hotulainen P, Lappalainen P. Stress fibers are generated by two distinct actin assembly mechanisms in motile cells. J Cell Biol. 2006;173:383–94. doi: 10.1083/jcb.200511093. [DOI] [PMC free article] [PubMed] [Google Scholar]
- 10.Schulze N, et al. FHOD1 regulates stress fiber organization by controlling the dynamics of transverse arcs and dorsal fibers. J Cell Sci. 2014;127:1379–1393. doi: 10.1242/jcs.134627. [DOI] [PubMed] [Google Scholar]
- 11.Tojkander S, Gateva G, Lappalainen P. Actin stress fibers--assembly, dynamics and biological roles. J Cell Sci. 2012;125:1855–64. doi: 10.1242/jcs.098087. [DOI] [PubMed] [Google Scholar]
- 12.Tojkander S, Gateva G, Husain A, Krishnan R, Lappalainen P. Generation of contractile actomyosin bundles depends on mechanosensitive actin filament assembly and disassembly. Elife. 2015;4:e06126. doi: 10.7554/eLife.06126. [DOI] [PMC free article] [PubMed] [Google Scholar]
- 13.Burnette DT, et al. A role for actin arcs in the leading-edge advance of migrating cells. Nat Cell Biol. 2011;13:371–382. doi: 10.1038/ncb2205. [DOI] [PMC free article] [PubMed] [Google Scholar]
- 14.Shemesh T, Verkhovsky AB, Svitkina TM, Bershadsky AD, Kozlov MM. Role of focal adhesions and mechanical stresses in the formation and progression of the lamellipodium-lamellum interface [corrected] Biophys J. 2009;97:1254–64. doi: 10.1016/j.bpj.2009.05.065. [DOI] [PMC free article] [PubMed] [Google Scholar]
- 15.Wang N, Butler JP, Ingber DE. Mechanotransduction across the cell surface and through the cytoskeleton. Science (80) 1993;260:1124–1127. doi: 10.1126/science.7684161. [DOI] [PubMed] [Google Scholar]
- 16.Hu S, et al. Intracellular stress tomography reveals stress focusing and structural anisotropy in cytoskeleton of living cells. Am J Physiol Cell Physiol. 2003;285:C1082–C1090. doi: 10.1152/ajpcell.00159.2003. [DOI] [PubMed] [Google Scholar]
- 17.Cai Y, et al. Cytoskeletal coherence requires myosin-IIA contractility. J Cell Sci. 2010;123:413–23. doi: 10.1242/jcs.058297. [DOI] [PMC free article] [PubMed] [Google Scholar]
- 18.Tanner K, Boudreau A, Bissell MJ, Kumar S. Dissecting regional variations in stress fiber mechanics in living cells with laser nanosurgery. Biophys J. 2010;99:2775–2783. doi: 10.1016/j.bpj.2010.08.071. [DOI] [PMC free article] [PubMed] [Google Scholar]
- 19.Kumar S, et al. Viscoelastic retraction of single living stress fibers and its impact on cell shape, cytoskeletal organization, and extracellular matrix mechanics. Biophys J. 2006;90:3762–73. doi: 10.1529/biophysj.105.071506. [DOI] [PMC free article] [PubMed] [Google Scholar]
- 20.Chang C-W, Kumar S. Vinculin tension distributions of individual stress fibers within cell-matrix adhesions. J Cell Sci. 2013;126:3021–3030. doi: 10.1242/jcs.119032. [DOI] [PMC free article] [PubMed] [Google Scholar]
- 21.Kumar A, et al. Filamin A mediates isotropic distribution of applied force across the actin network. J Cell Biol. 2019;218:2481–2491. doi: 10.1083/jcb.201901086. [DOI] [PMC free article] [PubMed] [Google Scholar]
- 22.Kassianidou E, Brand CA, Schwarz US, Kumar S. Geometry and network connectivity govern the mechanics of stress fibers. Proc Natl Acad Sci. 2017;114:2622–2627. doi: 10.1073/pnas.1606649114. [DOI] [PMC free article] [PubMed] [Google Scholar]
- 23.Smith MA, et al. A Zyxin-Mediated Mechanism for Actin Stress Fiber Maintenance and Repair. Dev Cell. 2010;19:365–376. doi: 10.1016/j.devcel.2010.08.008. [DOI] [PMC free article] [PubMed] [Google Scholar]
- 24.Chapin LM, Blankman E, Smith MA, Shiu Y, Beckerle MC. Lateral Communication between Stress Fiber Sarcomeres Facilitates a Local Remodeling Response. Biophysj. 2012;103:2082–2092. doi: 10.1016/j.bpj.2012.09.038. [DOI] [PMC free article] [PubMed] [Google Scholar]
- 25.Rossier OM, et al. Force generated by actomyosin contraction builds bridges between adhesive contacts. EMBO J. 2010;29:1055–68. doi: 10.1038/emboj.2010.2. [DOI] [PMC free article] [PubMed] [Google Scholar]
- 26.Stachowiak MR, O’Shaughnessy B. Recoil after Severing Reveals Stress Fiber Contraction Mechanisms. Biophys J. 2009;97:462–471. doi: 10.1016/j.bpj.2009.04.051. [DOI] [PMC free article] [PubMed] [Google Scholar]
- 27.Luo Y, Xu X, Lele TP, Kumar S, Ingber D. E. A multi-modular tensegrity model of an actin stress fiber. J Biomech. 2008;41:2379–2387. doi: 10.1016/j.jbiomech.2008.05.026. [DOI] [PMC free article] [PubMed] [Google Scholar]
- 28.Besser A, Colombelli J, Stelzer EHK, Schwarz US. Viscoelastic response of contractile filament bundles. Phys Rev E - Stat Nonlinear, Soft Matter Phys. 2011;83:1–12. doi: 10.1103/PhysRevE.83.051902. [DOI] [PubMed] [Google Scholar]
- 29.Kassianidou E, Kumar S. A biomechanical perspective on stress fiber structure and function. Biochim Biophys Acta - Mol Cell Res. 2015;1853:3065–3074. doi: 10.1016/j.bbamcr.2015.04.006. [DOI] [PMC free article] [PubMed] [Google Scholar]
- 30.Guthardt Torres P, Bischofs I, Schwarz US. Contractile network models for adherent cells. Phys Rev E. 2012;85:1–13. doi: 10.1103/PhysRevE.85.011913. [DOI] [PubMed] [Google Scholar]
- 31.Bischofs IB, Klein F, Lehnert D, Bastmeyer M, Schwarz US. Filamentous network mechanics and active contractility determine cell and tissue shape. Biophys J. 2008;95:3488–96. doi: 10.1529/biophysj.108.134296. [DOI] [PMC free article] [PubMed] [Google Scholar]
- 32.Oakes PW, Banerjee S, Marchetti MC, Gardel ML. Geometry Regulates Traction Stresses in Adherent Cells. Biophys J. 2014;107:825–833. doi: 10.1016/j.bpj.2014.06.045. [DOI] [PMC free article] [PubMed] [Google Scholar]
- 33.Linsmeier I, et al. Disordered actomyosin networks are sufficient to produce cooperative and telescopic contractility. Nat Commun. 2016;7 doi: 10.1038/ncomms12615. 12615. [DOI] [PMC free article] [PubMed] [Google Scholar]
- 34.Von Erlach TC, et al. Cell-geometry-dependent changes in plasma membrane order direct stem cell signalling and fate. Nat Mater. 2018;17:237–242. doi: 10.1038/s41563-017-0014-0. [DOI] [PMC free article] [PubMed] [Google Scholar]
- 35.Théry M, Pépin A, Dressaire E, Chen Y, Bornens M. Cell distribution of stress fibres in response to the geometry of the adhesive environment. Cell Motil Cytoskeleton. 2006;63:341–55. doi: 10.1002/cm.20126. [DOI] [PubMed] [Google Scholar]
- 36.Mandal K, Wang I, Vitiello E, Orellana LAC, Balland M. Cell dipole behaviour revealed by ECM sub-cellular geometry. Nat Commun. 2014;5 doi: 10.1038/ncomms6749. 5749. [DOI] [PubMed] [Google Scholar]
- 37.Peterson LJ, et al. Simultaneous stretching and contraction of stress fibers in vivo. Mol Biol Cell. 2004;15:3497–508. doi: 10.1091/mbc.E03-09-0696. [DOI] [PMC free article] [PubMed] [Google Scholar]
- 38.Colombelli J, et al. Mechanosensing in actin stress fibers revealed by a close correlation between force and protein localization. J Cell Sci. 2009;122:1665–1679. doi: 10.1242/jcs.042986. [DOI] [PubMed] [Google Scholar]
- 39.Strahs KR, Berns MW. Laser microirradiation of stress fibers and intermediate filaments in non-muscle cells from cultured rat heart. Exp Cell Res. 1979;119:31–45. doi: 10.1016/0014-4827(79)90332-x. [DOI] [PubMed] [Google Scholar]
- 40.Koonce MP, Strahs KR, Berns MW. Repair of laser-severed stress fibers in myocardial non-muscle cells. Exp Cell Res. 1982;141:375–384. doi: 10.1016/0014-4827(82)90226-9. [DOI] [PubMed] [Google Scholar]
- 41.Kassianidou E, et al. Extracellular Matrix Geometry and Initial Adhesive Position Determine Stress Fiber Network Organization during Cell Spreading. Cell Rep. 2019;27:1897–1909. doi: 10.1016/j.celrep.2019.04.035. e4. [DOI] [PMC free article] [PubMed] [Google Scholar]
- 42.Toro-Nahuelpan M, et al. Tailoring cryo-electron microscopy grids by photo-micropatterning for in-cell structural studies. Nat Methods. 2020;17:50–54. doi: 10.1038/s41592-019-0630-5. [DOI] [PMC free article] [PubMed] [Google Scholar]
- 43.Hirata H, Tatsumi H, Sokabe M. Dynamics of actin filaments during tension-dependent formation of actin bundles. 2007;1770:1115–1127. doi: 10.1016/j.bbagen.2007.03.010. [DOI] [PubMed] [Google Scholar]
- 44.Luo W, et al. Analysis of the local organization and dynamics of cellular actin networks. J Cell Biol. 2013;202:1057–73. doi: 10.1083/jcb.201210123. [DOI] [PMC free article] [PubMed] [Google Scholar]
- 45.Muller A, Muller S, Nasufovic V, Arndt H-D, Pompe T. Actin stress fiber dynamics in laterally confined cells. Integr Biol (Camb) 2019;11:175–185. doi: 10.1093/intbio/zyz016. [DOI] [PubMed] [Google Scholar]
- 46.Chen T, et al. Large-scale curvature sensing by directional actin flow drives cellular migration mode switching. Nat Phys. 2019;15:393–402. doi: 10.1038/s41567-018-0383-6. [DOI] [PMC free article] [PubMed] [Google Scholar]
- 47.Hu S, et al. Long-range self-organization of cytoskeletal myosin II filament stacks. Nat Cell Biol. 2017;19:133–141. doi: 10.1038/ncb3466. [DOI] [PubMed] [Google Scholar]
- 48.Marek LF, Kelley RO, Perdue BD. Organization of the cytoskeleton in square fibroblasts. Cell Motil. 1982;2:115–130. doi: 10.1002/cm.970020204. [DOI] [PubMed] [Google Scholar]
- 49.Svitkina TM. Ultrastructure of the actin cytoskeleton. Curr Opin Cell Biol. 2018;54:1–8. doi: 10.1016/j.ceb.2018.02.007. [DOI] [PMC free article] [PubMed] [Google Scholar]
- 50.Fenix AM, et al. Expansion and concatenation of nonmuscle myosin IIA filaments drive cellular contractile system formation during interphase and mitosis. Mol Biol Cell. 2016;27:1465–1478. doi: 10.1091/mbc.E15-10-0725. [DOI] [PMC free article] [PubMed] [Google Scholar]
- 51.Dasbiswas K, Hu S, Schnorrer F, Safran SA, Bershadsky AD. Ordering of myosin II filaments driven by mechanical forces: experiments and theory. Philos Trans R Soc B Biol Sci. 2018;373 doi: 10.1098/rstb.2017.0114. 20170114. [DOI] [PMC free article] [PubMed] [Google Scholar]
- 52.Vignaud T, Ennomani H, Théry M. Polyacrylamide hydrogel micropatterning. Methods Cell Biol. 2014;120:93–116. doi: 10.1016/B978-0-12-417136-7.00006-9. [DOI] [PubMed] [Google Scholar]
- 53.Azioune A, Carpi N, Tseng Q, Théry M, Piel M. Protein micropatterns: A direct printing protocol using deep UVs. Methods Cell Biol. 2010;97:133–46. doi: 10.1016/S0091-679X(10)97008-8. [DOI] [PubMed] [Google Scholar]
- 54.Vignaud T, et al. Reprogramming cell shape with laser nano-patterning. J Cell Sci. 2012;125:2134–40. doi: 10.1242/jcs.104901. [DOI] [PubMed] [Google Scholar]
- 55.Jimenez A, Friedl K, Leterrier C. About samples, giving examples: Optimized Single Molecule Localization Microscopy. Methods. 2020;174:100–114. doi: 10.1016/j.ymeth.2019.05.008. [DOI] [PubMed] [Google Scholar]
- 56.Vassilopoulos S, Gibaud S, Jimenez A, Caillol G, Leterrier C. Ultrastructure of the axonal periodic scaffold reveals a braid-like organization of actin rings. Nat Commun. 2019;10:1–13. doi: 10.1038/s41467-019-13835-6. [DOI] [PMC free article] [PubMed] [Google Scholar]
- 57.Ganguly a, et al. A dynamic formin-dependent deep F-actin network in axons. J Cell Biol. 2015;210:401–417. doi: 10.1083/jcb.201506110. [DOI] [PMC free article] [PubMed] [Google Scholar]
- 58.Ovesný M, Křížek P, Borkovec J, Švindrych Z, Hagen GM. ThunderSTORM: A comprehensive ImageJ plug-in for PALM and STORM data analysis and super-resolution imaging. Bioinformatics. 2014;30:2389–2390. doi: 10.1093/bioinformatics/btu202. [DOI] [PMC free article] [PubMed] [Google Scholar]
- 59.Martiel J-L, et al. Measurement of cell traction forces with ImageJ. Methods in cell biology. 2015;125:269–287. doi: 10.1016/bs.mcb.2014.10.008. [DOI] [PubMed] [Google Scholar]
- 60.Toro-Nahuelpan M, et al. Tailoring cryo-electron microscopy grids by photo-micropatterning for in-cell structural studies. Protoc Exch. 2020 doi: 10.21203/rs.2.12377/v1. [DOI] [PMC free article] [PubMed] [Google Scholar]
Associated Data
This section collects any data citations, data availability statements, or supplementary materials included in this article.
Supplementary Materials
Data Availability Statement
Raw data are available from the corresponding authors upon request.
Code is available from the corresponding authors upon request.


