Summary
Mammalian gene expression is inherently stochastic1,2resulting in discrete bursts of RNA molecules synthesised from each allele3–7. Although known to be regulated by promoters and enhancers, it is unclear how cis-regulatory sequences encode transcriptional burst kinetics. Characterization of transcriptional bursting, including the burst size and frequency, have mainly relied on live-cell4,6,8 or single-molecule RNA-FISH3,5,8,9 recordings of selected loci. Here, we inferred transcriptome-wide burst frequencies and sizes for endogenous genes using allele-sensitive single-cell RNA-sequencing (scRNA-seq). We show that core promoter elements affect burst size and uncover synergistic effects between TATA and Initiator elements, which were masked at mean expression levels. Importantly, we provide transcriptome-wide support for enhancers controlling burst frequencies and we additionally demonstrate that cell-type-specific gene expression is primarily shaped by changes in burst frequencies. Altogether, our data show that burst frequency is primarily encoded in enhancers and burst size in core promoters, and that allelic scRNA-seq is a powerful paradigm for investigating transcriptional kinetics.
It was postulated over 20 years ago that enhancers might increase the probability of transcription10, yet supporting data is scarce (e.g. beta-globin in mouse9 and sna in flies8) and it remains unclear whether these observations generalize across different types of promoters and enhancers11. An important goal is therefore to determine how promoters and enhancers modulate gene expression through altering burst frequencies and sizes.
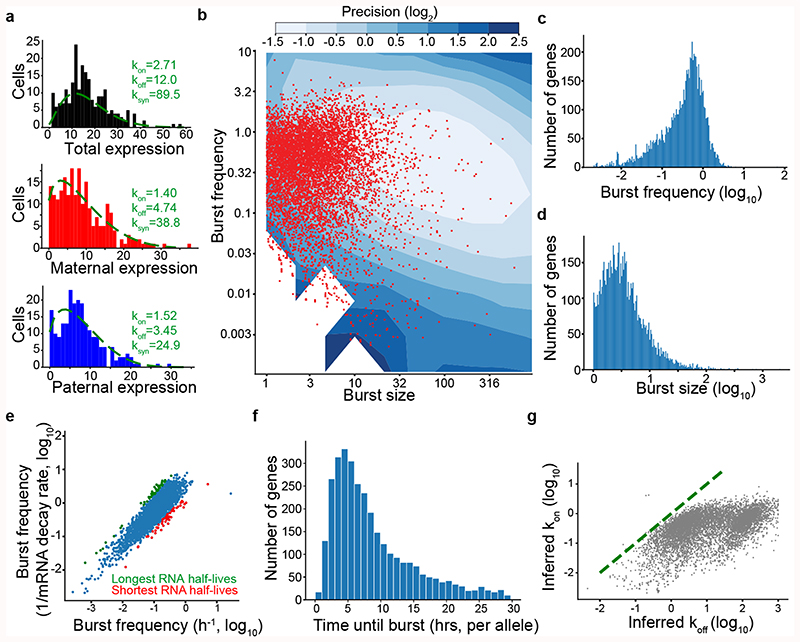
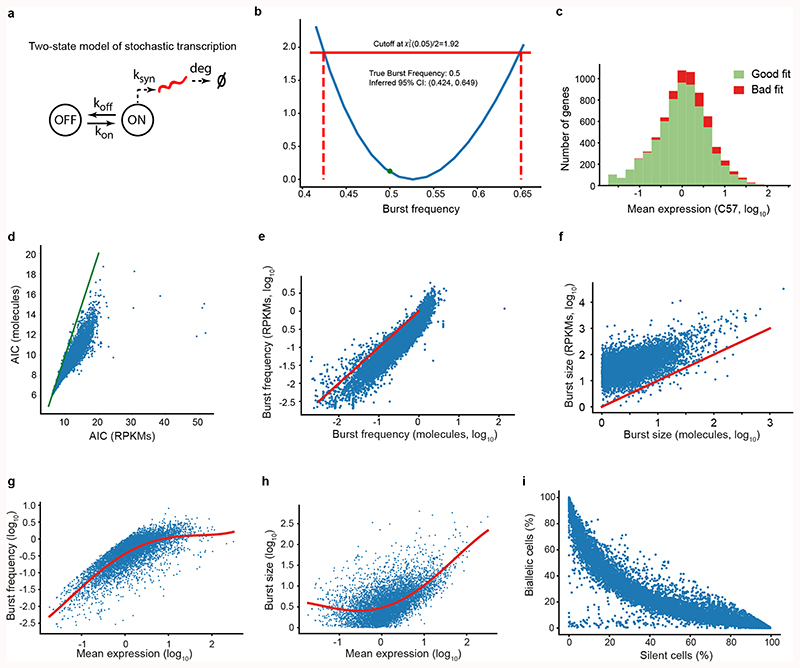
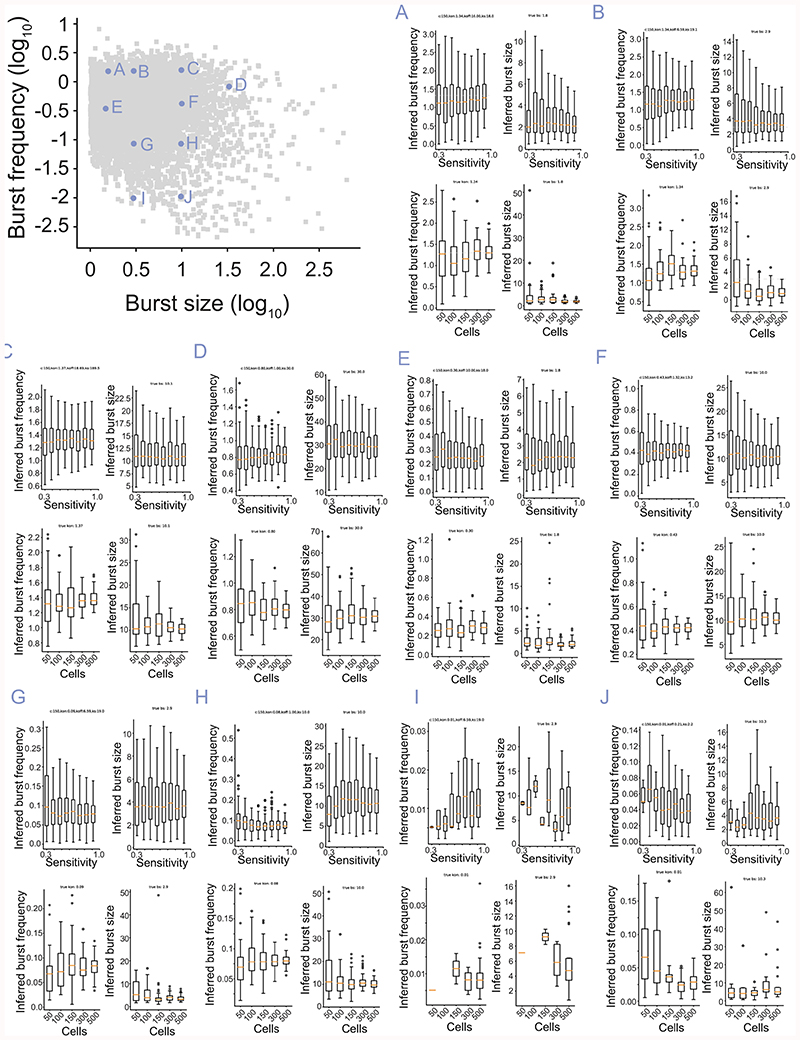
Single-cell analyses of allelic transcription have revealed frequent monoallelic expression consistent with episodic transcription12–14. Inspired by recent developments in transcriptome-wide inference of burst kinetics6,15,16, we modelled the expression distribution at each allele independently16 using the two-state model of transcription17. Profile-likelihood was used to infer point estimates (using maximum likelihood) and confidence intervals directly on burst frequency (kon; in units of mean mRNA degradation rate) and size (ksyn/koff; the individual parameters are unidentifiable in larger parts of parameter space) (Extended Data Fig. 1a-b, exemplified for Mbnl2 in Fig. 1a; Methods). By simulations, we determined the boundaries of parameter space wherein kinetic parameters could be robustly inferred (Fig. 1b), and how cell numbers and incomplete sampling (i.e. sensitivity) in scRNA-seq affected inference (Extended Data Fig. 2).
Figure 1. Transcriptome-wide inference of transcriptional burst kinetics.
(a) Allele-resolution kinetics inferred from scRNA-seq data. The total expression for the Mbln2 gene (top) was separated into allelic expression (paternal: middle, maternal: bottom). Inference was performed independently on total expression and allele-level expression to illustrate that allele-level inference has the required resolution, with expression measured as observed RNA molecules. (b) Inferred burst kinetics for each gene (CAST allele) in primary fibroblasts (red dots, 6,298 genes). Blue contours indicate the inference precision defined as the width of the confidence interval divided by the point estimate from simulated observations (Methods). Burst size in units of observed RNA molecules. (c) Histogram of inferred burst frequencies for CAST allele in primary fibroblasts, in time-scale of mean mRNA degradation rate. (d) Histogram of inferred burst sizes (observed RNA molecules) for CAST allele in primary fibroblasts. (e) Scatter plot comparing inferred burst frequencies with gene-specific mRNA degradation rates (x-axis) against inferred burst frequencies that did not utilize mRNA degradation rates (using the average degradation rate for all genes). Genes with the 50 longest (green) and shortest (red) mRNA degradation rates are marked. Data from ES cells and CAST allele. (f) Histogram of allele-level waiting times between bursts (data from ES cells and CAST allele). (g) Scatter plot showing the inferred gene inactivation (koff) and activation (kon) rates, highlighting that genes have higher koff than kon. Data from fibroblast and CAST allele.
To investigate transcriptome-wide patterns of transcriptional bursting, kinetic parameters were inferred for 7,186 genes using transcriptomes from 224 individual primary mouse fibroblasts for each allele (CAST/EiJ × C57BL/6J) (Supplementary Table 1). Inference was performed on Smart-seq2 scRNA-seq libraries both at RPKM and molecule levels (Methods), with improved goodness-of-fit towards the two-state model for molecule-level data (Extended Data Fig. 1c-f). The inferred kinetic parameters inhabited regions in parameter space for which the estimated precision was high (i.e. small confidence intervals) for most genes (Fig. 1b). Observed burst frequencies (Fig. 1c) and burst sizes (Fig. 1d) were in the range of those observed in imaging-based single-gene analyses6, and had a general relationship with expression levels (Extended Data Fig. 1g-h) similar to a previous study18. Kinetics inferred for the two alleles correlated (Spearman r= 0.79 and 0.63 for burst frequency and size, respectively) and were consistent with two independent transcriptional processes (Extended Data Fig. 1i), as previously reported12. Incorporating gene-specific mRNA half-lives had minor effect on burst frequency estimation (Fig. 1e), since burst frequencies had larger magnitudes of variation than mRNA degradation rates. Interestingly, the average waiting time between bursts were approximately 4 hours (per allele) (Fig. 1f) and inferred kon values were consistently much smaller than the corresponding koff values (Fig. 1g), demonstrating that genes are mainly in an idle state with occasional bursts of transcription.
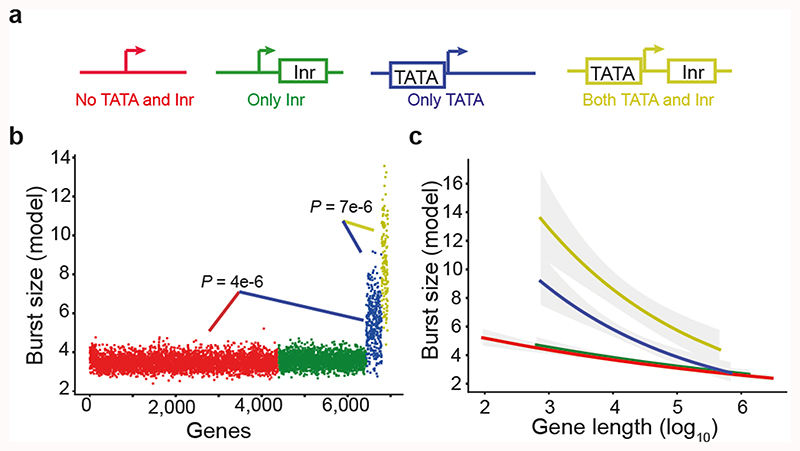
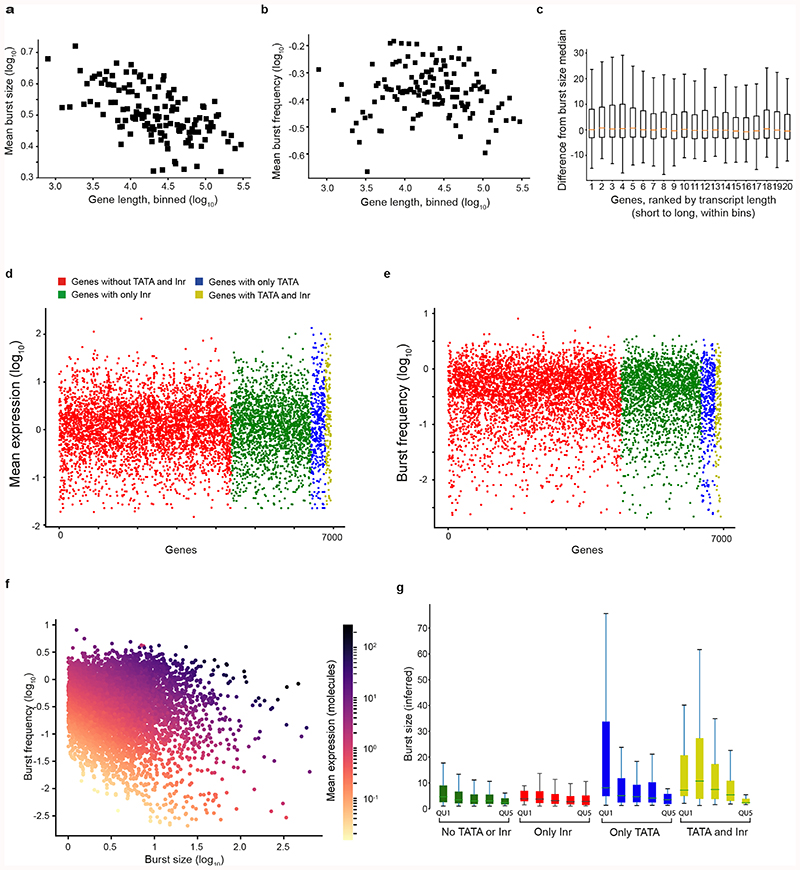
We dissected molecular determinants of burst size variation. House-keeping genes tend to be highly expressed and have compact gene structure19. Indeed, we observed negative correlation between the gene loci length and burst size (Extended Data Fig. 3A, Spearman r=-0.86, P = 2.3e-228) but not burst frequency (Extended Data Fig. 3B, r=0.03, P = 0.6), and this effect was not associated with spliced mRNA transcript length (Extended Data Fig. 3c). To assess the roles of core promoter elements on burst kinetics (Fig. 2a), we formulated linear regression models that included gene length, TATA and Initiator (Inr) elements (Methods) which identified several significant factors and interactions (Supplementary Table 2). Genes with TATA elements in their core promoters had significantly larger burst sizes (P=4.0e-6, F test, adjusted for gene length) (Fig. 2b) than genes without TATA elements, in agreement with previous reports in yeast20 and mammals21. In TATA-containing core promoters, we observed that the Inr element significantly boosted burst sizes (P=7.2e-4, F test, adjusted for gene length) whereas Inr elements alone (in promoters lacking TATA element) had no effect on burst size (Fig. 2b). Notably, the effects of the TATA and Inr elements were masked in mean gene expression levels (Extended Data Fig. 3d) and absent on burst frequencies (Extended Data Fig. 3e). Thus, a separation of expression into burst kinetics was required to identify the effects of core promoter elements on transcriptional dynamics, since variations in burst frequencies distort the burst size effect at mean expression levels (Extended Data Fig. 3f). The observed synergy between TATA and Inr elements significantly extends an earlier report of Inr elements positive effect on gene expression for promoters with TATA elements22. Interestingly, we observed distinct gene-length dependencies for the different core promoter elements (Fig. 2c and Extended Data Fig. 3g) and the effects declined around 80 kbp. We conclude that core promoter sequence elements affect burst size and that a transcriptome-wide inference of burst kinetics can deduce individual and synergistic effects of cis-regulatory elements on transcription.
Figure 2. Core promoter elements dictate transcriptional burst size.
(a) Illustration of gene categorization (and coloring) according to TATA and Inr elements in core promoters. (b) Burst size (from linear model) for genes, ordered and colored based on core promoter elements (n = 6,935 genes, F-test). (c) The dependency between burst size and gene length for the gene categories. Burst size prediction from linear model with the shaded areas showing the 95% confidence intervals for the prediction, genes ordered (ascending) according to gene length.
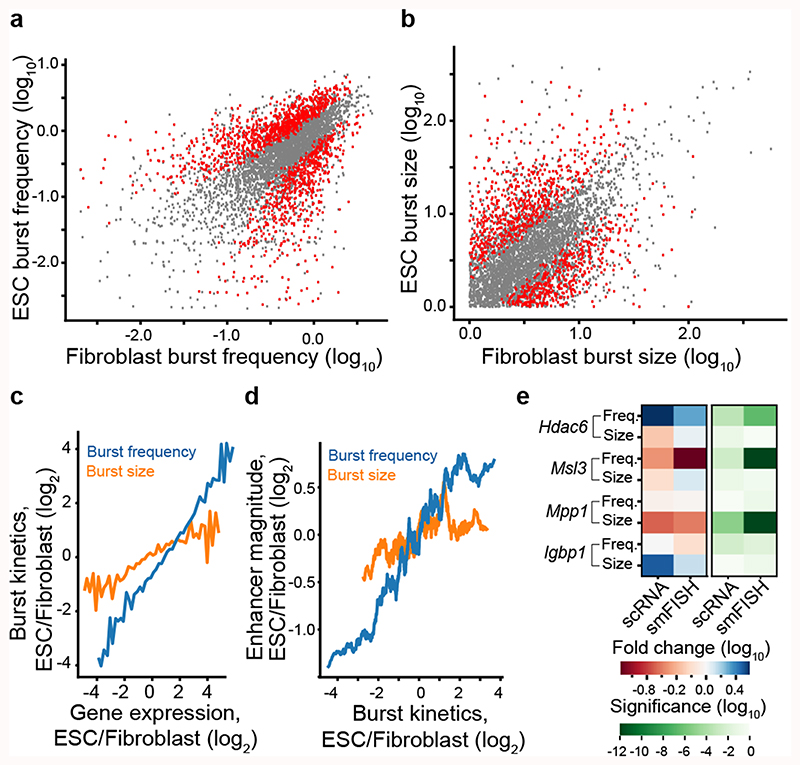
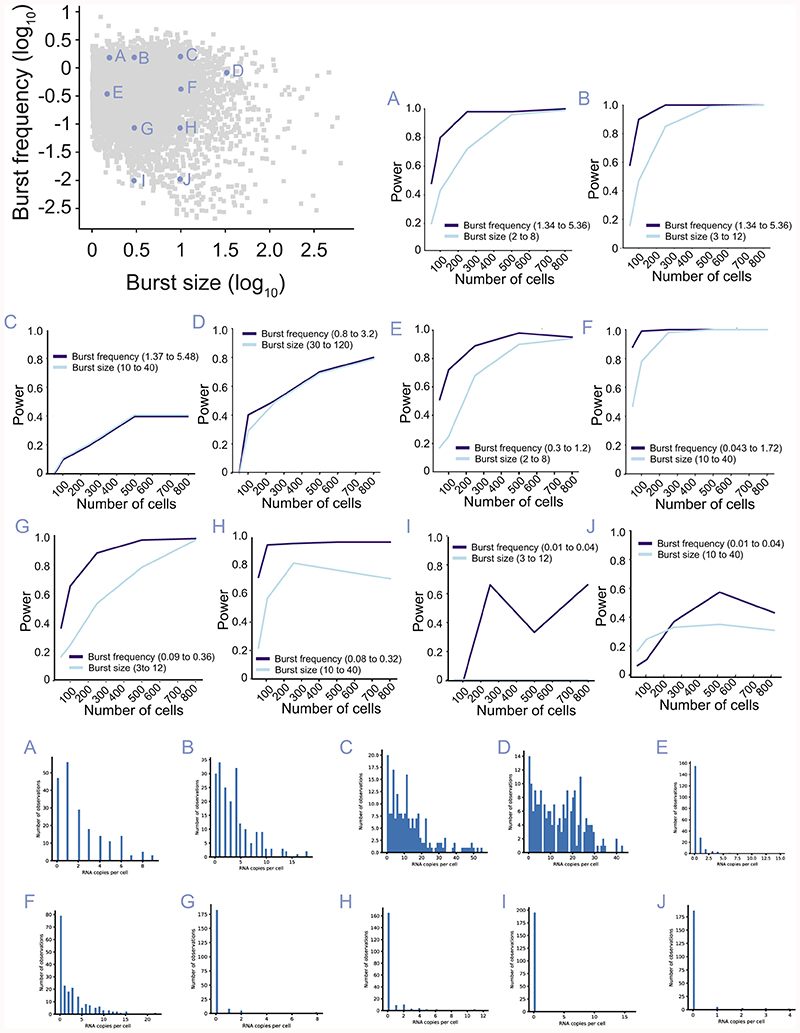
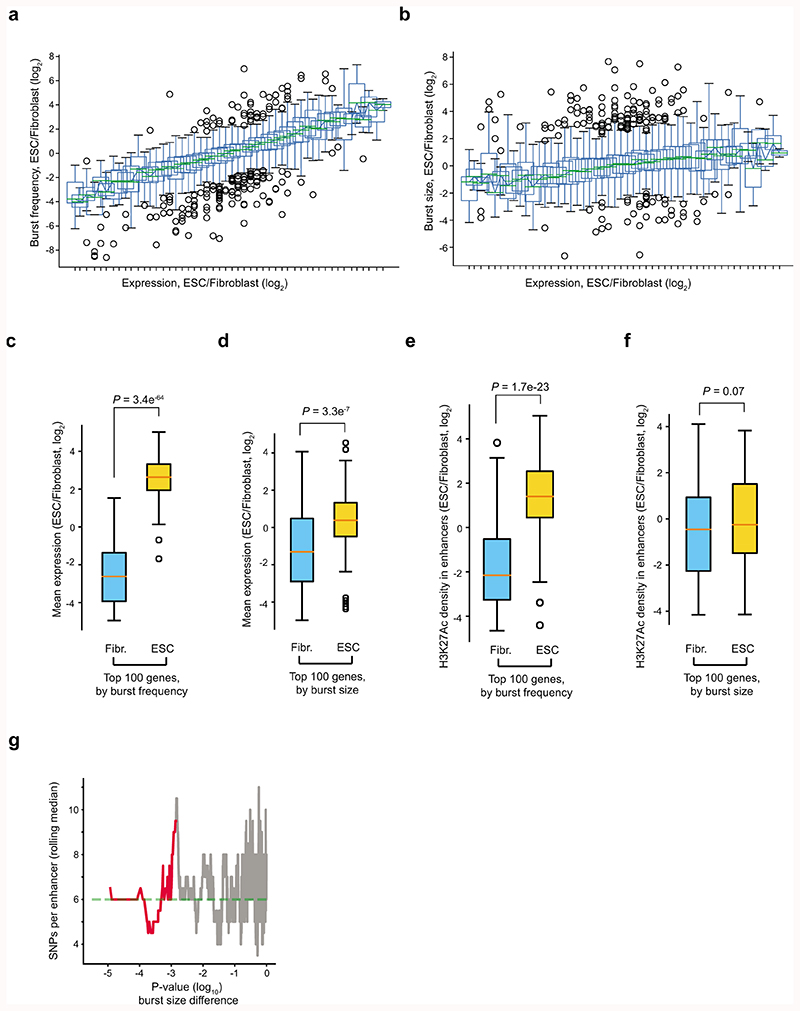
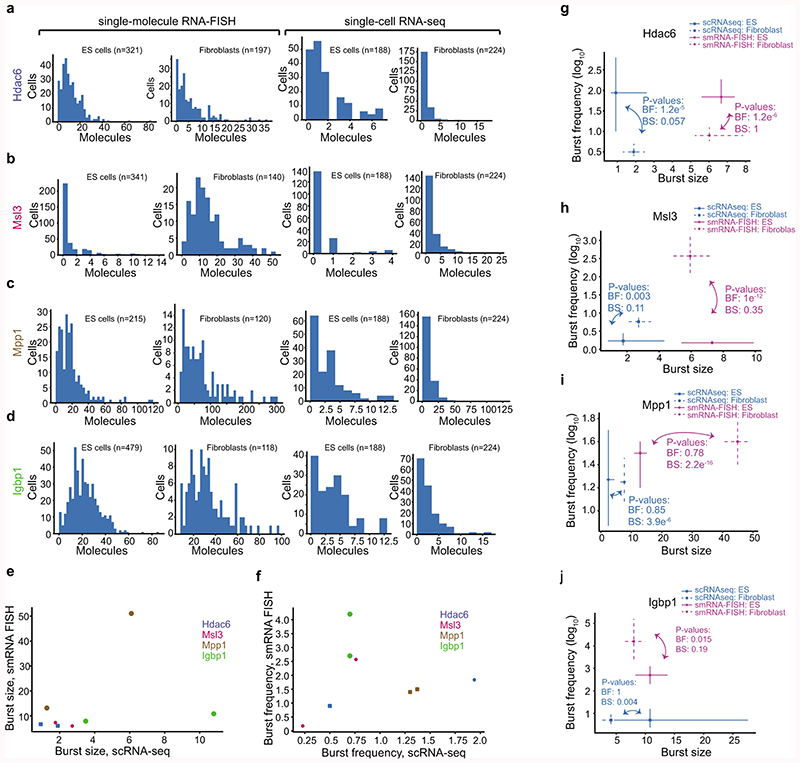
We applied the same procedure to 188 mouse embryonic stem cells (mESC, C57BL/6 x CAST/EiJ) (Supplementary Table 3) and determined kinetic differences between the 4,854 genes that were expressed (and had inferable kinetics) in both mESC and fibroblasts. We detected 1,552 genes with significant (FDR<5%) differences in burst frequency (Fig. 3a) and 1,075 genes for burst size (Fig. 3b), with our current power to detect changes (Extended Data Fig. 4 and Supplementary Table 4). We next investigated whether alterations in burst sizes or frequencies account for cell-type specific differential expression. When binning genes by expression difference between the cell types it became apparent that cell-type-specific expression levels are mainly shaped by changes in burst frequencies (Fig. 3c and Extended Data Fig. 5a-d). We hypothesised that burst frequencies were generally regulated by enhancers8–10. A strong linear dependence was observed between differential enhancer activity (normalized H3K27Ac ChIP-seq read density in enhancer regions) and differential burst frequencies (Fig. 3d and Extended Data Fig. 5e-f), with only a modest effect of burst size, providing genome-wide support for enhancer-mediated regulation of burst frequencies. To validate the allele-level kinetics using a complementary method, we performed single-molecule RNA FISH (smFISH) on male fibroblasts and mESCs for a selection of X-linked genes (expressed from a single allele) with significant cell-type differences in burst frequencies or size (Hdac6, Msl3, Mpp1) and without significant differences (Ibgp1) (Extended Data Fig. 6). We observed a general agreement between methods in burst frequencies with some discrepancies and larger burst size estimates in the smFISH data (Extended Data Figs. 7a-f). Importantly, significant cell-type differences were corroborated in the kinetics inferred from the smFISH data as we observed significant increase in burst frequencies (Hdac6, in ES cells; Msl3, in fibroblasts) and burst size (Mpp1, in fibroblasts) using both methods (Fig. 3e and Extended Data Fig. 7g-j).
Figure 3. Enhancers regulate burst frequencies to shape cell-type specific expression.
Scatter plots of transcriptome-wide inferred transcriptional burst frequencies (a) and sizes (b) in mouse embryonic stem cells (mESC) and adult tail fibroblasts (n = 4,854 genes). Genes with significant differences (profile likelihood test, FDR<0.05) between cell types are marked in red. (c) Graph depicting cell-type differences in burst frequency and size, as a function of fold changes in mean expression between cell types. Lines represent median fold change in burst size and frequency between cell types for genes binned by expression difference (n genes per bin = 100). (d) Graph depicting cell-type differences in enhancer magnitude (H3K27Ac read densities in enhancers) for genes ordered by cell-type differences in either burst frequency or size. Computed as a rolling median in groups of 200 genes. (e) Validation of scRNA-seq inferred cell-type differences in transcriptional burst kinetics by single-molecule RNA FISH on four genes (Hdac6, Msl3, Mpp1 and Igbp1). The left heatmap denote effect size and direction of change, whereas the right heatmap shows the significance level of cell-type difference in burst kinetics, separated by method, gene and burst kinetic parameter (profile likelihood test). For more information see Extended Data Fig. 7.
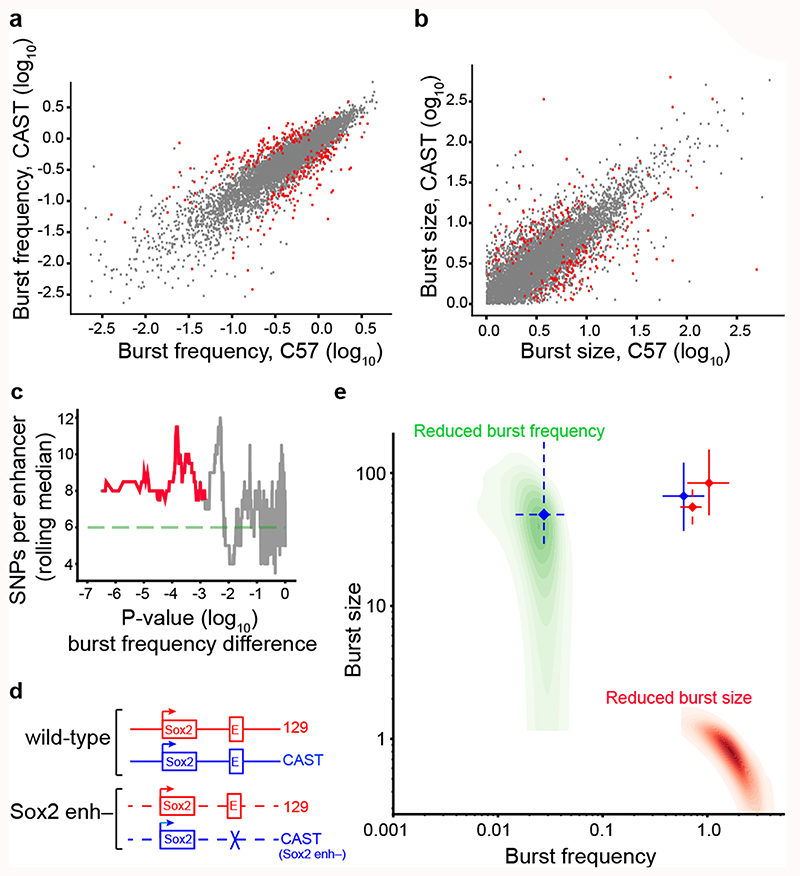
To further investigate the effects of enhancers on burst frequencies, we identified genes with significant kinetics differences between the C57 and CAST allele in fibroblasts (Burst frequency: 307 genes; Burst size: 276 genes) (Fig. 4a-b, Extended Data Fig. 8a-d and Supplementary Table 5). Interestingly, genes with burst frequency differences had significantly higher densities of single-nucleotide polymorphisms (SNPs) in their enhancer regions (Fig. 4c) but not in their promoters (Extended Data Fig. 5g). No effect was found when performing similar analyses on genes with significant differences in burst sizes (data not shown). That genes with strain-specific burst frequency have more genetic changes in their enhancers supports the notion of enhancers regulating burst frequencies.
Figure 4. Altered burst frequencies by enhancer polymorphisms and deletion.
Scatter plots of the burst frequency (a) and burst size (b) inferred for the CAST/EiJ and C57BL/6J alleles in fibroblasts (n = 5,491 genes). Genes with significant differences (FDR<0.05, profile likelihood test) between genotypes are marked red. (c) SNP density in the enhancers of genes with differential burst frequencies were significantly higher (two-sample t-test). We display the rolling median (n=50) of SNPs per enhancer ordered by the p-value of a burst frequency difference between CAST and C57 (profile likelihood test, no adjustment for multiple comparisons). (d) An illustration of the genetic deletion of the distal Sox2 enhancer. (e) Inferred point estimates of burst frequency and size with 95% confidence intervals for both the 129SvEv (red) and CAST/EiJ (blue) allele in wild type mESCs (solid, n = 57 cells) and after Sox2 enhancer deletion (dashed, n = 174 cells) on the CAST allele. Simulated cases of expression reduced by a drop in burst frequency and size are shown in green and red respectively.
To functionally assess whether enhancers regulate burst frequencies, we sequenced and inferred transcriptional kinetics from 57 normal mESCs (CAST/EiJ x 129SvEv) and 174 mESCs harbouring a Sox2 enhancer deletion on the CAST allele23 (Fig. 4d). Markedly, cells with Sox2 enhancer deletion had significantly (P < 4.2e-40) reduced Sox2 burst frequency specifically on the affected CAST allele (Fig. 4e), whereas no significant change in burst size was observed (P=0.48). By simulations, we demonstrated that the observed kinetics for the affected CAST allele was in the region of parameter space expected for an exclusive reduction in burst frequency (Fig. 4e, green region; Methods). This provides direct evidence for the role of enhancers in modulating transcriptional frequencies and validates that allele-sensitive scRNA-seq is sufficiently accurate to infer transcriptional kinetics after a perturbation.
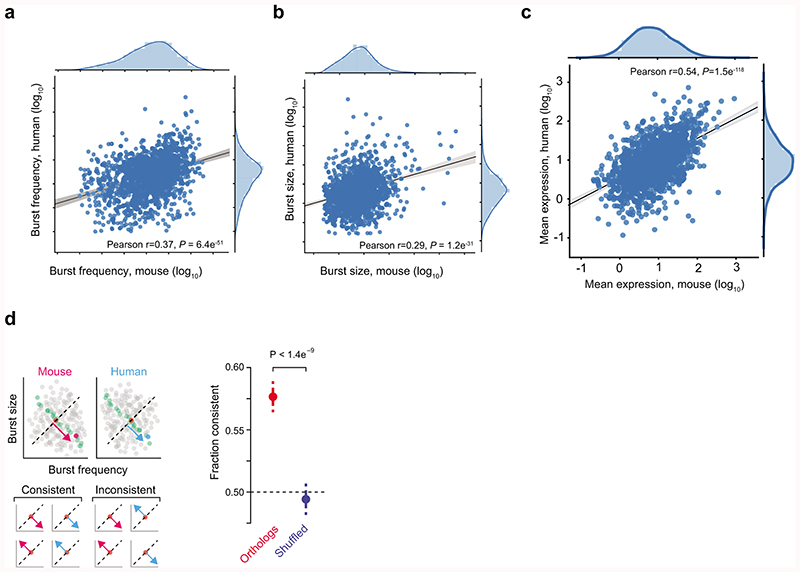
The conservation of gene expression patterns and levels among mammals have been extensively studied24, still little is known about the conservation of transcriptional kinetics. We inferred transcriptional kinetics for 2,484 genes in 163 human fibroblast cells after phasing their transcribed SNPs. One-to-one orthologs (1,609 genes) showed significant positive correlations in burst frequency, size and mean expression (Extended Data Fig. 9a,b,c and Supplementary Table 6). Interestingly, kinetic parameters were more similar across species than expected merely by preserved expression levels (Extended Data Fig. 9d), although larger data sets would enable in-depth analysis.
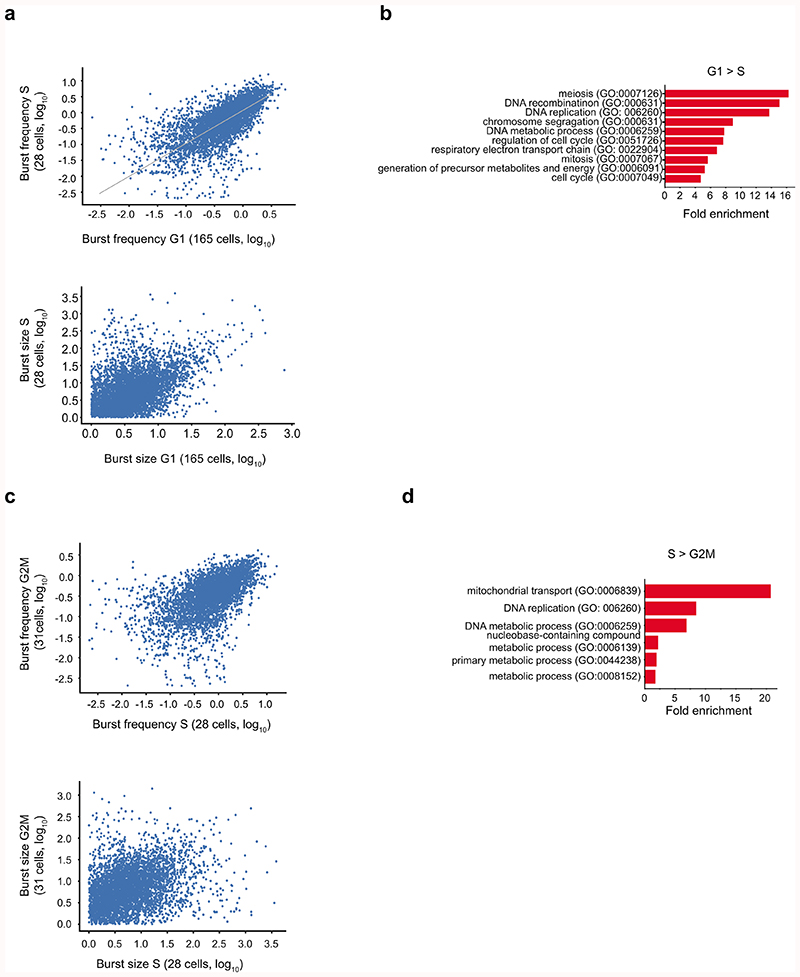
A caveat to inference of burst kinetics by scRNA-seq is that the estimates may be partly affected by cell-cycle features. A decreased burst frequency per allele25 combined with an additional copy of each allele after genome duplication would balance the numbers of RNA molecules recorded per allele in scRNA-seq. However, most cells analysed in our study were in the G1 phase, and genes with different kinetics between phases were mostly related to the cell-cycle functions (Extended Data Fig. 10).
Transcription is regulated at multiple levels, including enhancer-promoter interactions11, the formation of the transcription preinitiation complex (PIC), recruitment of RNA polymerase (Pol) II26, Pol II initiation27 and elongation28 control. Active transcription typically results in multiple Pol II complexes simultaneously transcribing the locus generating spurts of RNA molecules21. Such dynamics become averaged out in bulk RNA-seq data and obscured even in scRNA-seq when lacking allelic resolution. We have demonstrated the opportunities in analysing burst size and frequency to obtain a more accurate characterization of transcription. Mechanistically, specialized TATA binding protein-associated factors and TATA binding protein-related factors bind different types of core promoters1 and our data suggests that such complexes ultimately affect burst size, potentially through modulation of subsequent steps such as RNA pol II elongation control28. Hundreds of genes had significant differences in burst size between both cell types and genotypes, suggesting that modulations of both the levels of trans-acting factors and variations in the DNA elements they bind can regulate burst size. Our data provides transcriptome-wide evidence for the role of enhancers in controlling burst frequencies. Thus, the primary role of enhancers might lie in forming a PIC without effecting the size of the transcriptional burst. The strategy introduced here paves the way for unprecedented mechanistic insights into how burst size and frequency control are governed by cis-regulatory sequences and the systematic dissection of transcription.
Extended Data
Extended Data Figure 1. Using profile likelihood to infer transcriptional burst kinetics.
(a) Illustration of the two state-model of transcription. The promoter can be in an ON or OFF state and converts from OFF to ON with a rate kon, and from ON to OFF with rate koff. In the ON state, RNAs are transcribed with rate ksyn and degraded with rate deg. Please see more details in the Methods section. (b) Derivation of a confidence interval for a simulated set of observations with a given burst frequency = 0.5 (n = 200 simulated observations). The quadratic function shown in blue is a transformed version of the log-likelihood as a function of burst frequency, where the most likely parameter value has a likelihood of 0. Standard theory for likelihood methods gives a cutoff value of 1.92 for a 95% confidence interval (solid red line), which can then be traced down to their corresponding value on the x-axis (dashed red lines) to derive a confidence interval. The true value, shown as a green dot, is within the confidence interval. (c) Goodness of fit test for 7,382 genes on the CAST allele of the fibroblast cells (from molecular level input data). The histogram shows the mean expression levels of genes with a good (green) or bad (red) fit (Methods). (d) A scatter plot of the Akaike information criterion (AIC) for the inference obtain from molecule (UMIs) and RPKM values. The green line shown where y=x. (e-f) Scatter plot of the burst frequency and size obtained from inference procedure based on either molecules (UMIs) or RPKM values. (g) Scatter plot of mean expression against inferred burst frequency for all genes in fibroblasts. Red line denotes spline fitted to data. (h) Scatter plot of mean expression against inferred burst size for all genes in fibroblasts. Red line denotes spline fitted to data. (g-h) used the CAST allele. (i) Scatterplot of the percentage of biallelic to silent cells for 10,727 genes, in fibroblasts. The genes are located on the expected curve under the independence model (see Methods and Deng et al. Science 201417 for details).
Extended Data Figure 2. Robustness of inference to cell numbers and technical noise in single-cell RNA-seq.
The distribution of inferred burst frequency and sizes as a function of sensitivity (loss of RNA molecules) and cell numbers, based on the location of the parameters in the kinetics parameter space (A-J). Center: Median, Hinges: 1st and 3rd quartiles, Whiskers: 1.5 interquartile range (IQR). Based on 50 simulations for each unique combination of parameters and 100 cells for the sensitivity calculations. Inferred burst sizes were divided by the sensitivity used in simulation (as the inferred burst size scales linearly with sensitivity).
Extended Data Figure 3. Gene length effect on burst size and frequency and the effect of core promoter elements on mean expression and burst frequency.
(a-b)Scatter plots of median burst size (a) and frequency (b) compared to median gene length. Genes were binned genes (30 genes per bin). (c) Boxplot of genes binned according to gene loci length (20 genes per group). For each bin, we ranked genes in bin according to their transcript lengths and calculated the gene-level difference to the median burst size of that bin. We see no effect from differing transcript lengths in estimated burst size. Center: Median, Hinges: 1st and 3rd quartiles, Whiskers: 1.5 interquartile range (IQR). (d-e) Mean expression (d) and burst frequency (e), ordered and colored for genes based on their core promoter elements. (Complementing the analysis presented in Fig. 2b but with mean expression and burst frequency as dependent variables). The result of the linear regressions are presented in Supplementary Table 1 (n = 7,186 genes). (f) Scatter plot of burst frequency and size of genes with each dot color by their mean expression level. (g) Boxplots showing the inferred burst size for genes separated according to the presence of core promoter elements, and further grouped into 5 equally sized bins (quintiles, QU1-QU5) according to gene loci lengths. No TATA or Inr: n = 4397 genes (2585, 1124, 635, 36, 17 in each quintile respectively), Only Inr: n = 2035 genes (942, 531, 442, 74, 46 in each quintile respectively), Only TATA: n = 359 genes (129, 126, 58, 31, 15 in each quintile respectively), TATA and Inr: n = 144 genes (53, 45, 24, 19, 3 in each quintile respectively). Center: Median, Hinges: 1st and 3rd quartiles, Whiskers: 1.5 interquartile range (IQR).
Extended Data Figure 4. Power analysis in different locations of kinetic parameter space.
The power of detecting 4-fold changes in burst frequency and size as a function of the number of cells depending on the location of transcriptional burst kinetic parameters in parameter space (A-J). Upper panels: Analysis of power for burst frequency and size in indicated location in parameter space. Lower panels: Histogram with expression distributions over cells at the different locations in parameter space.
Extended Data Figure 5. Comparison of transcriptional burst kinetics across cell types.
(a-b) Boxplot visualization of cell-type differences in burst frequency and size, as a function of fold changes in mean expression between cell types, as in Fig. 3c. Center: Median, Hinges: 1st and 3rd quartiles, Whiskers: 1.5 interquartile range (IQR). (c-d) Boxplots of the fold change in mean expression for the top 100 genes in each direction for burst frequency and size, respectively (n = 100 genes in each group, two-sided t-test). Center: Median, Hinges: 1st and 3rd quartiles, Whiskers: 1.5 interquartile range (IQR). (e-f) Boxplots of the fold change in normalized read density of H3K27Ac in enhancers (Enhancer magnitude) between cell types. Enhancer linked to genes that had top 100 changes in either burst frequency and size (n = 100 genes in each group, two-sided t-test). Center: Median, Hinges: 1st and 3rd quartiles, Whiskers: 1.5 interquartile range (IQR). (g) Rolling median (n=50) of SNPs per enhancer ordered by the p-value of burst size difference between the CAST and C57 allele in fibroblast cells (profile likelihood test, no adjustment for multiple comparisons).
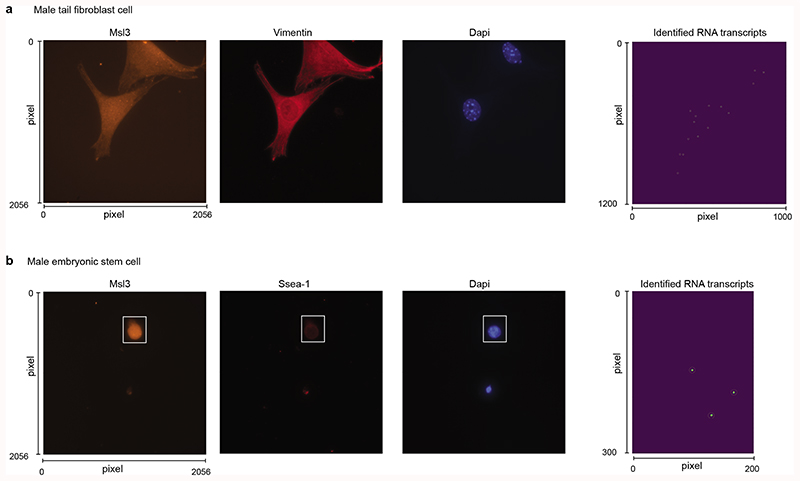
Extended Data Figure 6. Representative images for cell identification and RNA transcript quantification using single-molecule RNA-FISH.
(a-b) Two representative cells for the detection of Msl3 in (a) male fibroblast and (b) male embryonic stem cell (from 140 fibroblasts and 341 ES cells). From left to right: probe detection (Q570), antibody detection (Cy5), Dapi, and identified RNA transcripts.
Extended Data Figure 7. Expression distributions and inferred kinetics from single-molecular RNA-FISH and scRNA-seq.
(a-d) Histograms of the expression distributions of genes measured by smFISH and scRNA-seq for genes: Hdac6 (a), Msl3 (b), Mpp1 (c) and Igbp1 (d). Left panel is sm RNA FISH and right panel is scRNA-seq. The number of cells quantified for each gene, cell type and method is presented above each figure item. (e-f) Scatter plots of burst size (e) and frequency (f) inferred based on data from scRNA-seq and smFISH. Data from both fibroblasts and ES cells are shown. Although the number of data points are few and the data do not allow for a systematic comparison between methods, we observed a few trends. There was a good agreement for both burst size and frequency except for the gene Igbp1 that is an outlier in both scatterplots. Igbp1 has increased burst size and lower burst frequency in scRNA-seq compared to smRNA FISH. Excluding Igbp1, we do see a fairly linear correspondence between methods over the remaining 6 data points (3 genes and two cell types). (g-j) Point estimates and confidence intervals shown for each gene, cell type and method based on the profile likelihood method. Number of cells used for the inference is shown in the corresponding histogram in (a-d). P-values for cell-type comparison in burst kinetics is shown per method based on the profile likelihood test.
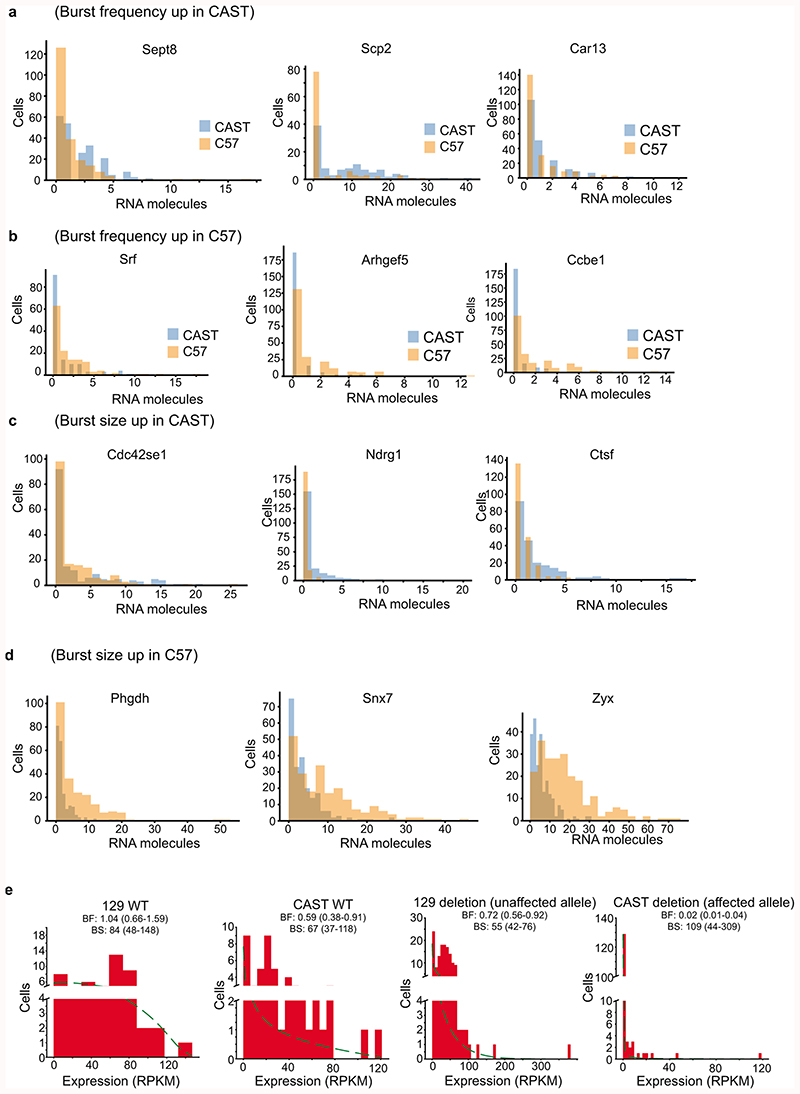
Extended Data Figure 8. Expression distributions for genes with significant strain-differences in burst kinetics.
(a-d) Histograms of the expression distributions for the CAST and C57 alleles in fibroblasts for genes with burst frequency significantly up in CAST (a) and C57 (b), burst size significantly up in CAST (c) and C57 (d). (e) Expression distributions for the 129 and CAST alleles in the wild-type mESCs and mESCs harbouring a CAST-lined deletion of a Sox2 enhancer.
Extended Data Figure 9. Conservation of transcriptional kinetics in mouse and human.
(a) Scatter plot of burst frequency between one-to-one orthologs of mouse and human (n = 1,609 genes). (b) Scatter plot of burst size between one-to-one orthologs of mouse and human (n = 1,609 genes). (c) Scatter plot of mean expression between one-to-one orthologs of mouse and human (n = 1,609 genes). (d) Left: Illustrating the test for conservation beyond mean expression level. In both mouse and human, the ortholog is compared to 50 genes of similar mean expression (7 genes in cartoon) and we determine whether the location on the diagonal is consistent relative to the median gene in both species. Right: The fraction of one-to-one orthologs genes (red) and shuffled orthologs (blue) with consistent positioning in transcriptional kinetics space (binomial test, based on 1,609 genes). The error bars denote standard deviations. The limited numbers of cells and the use of RPKM-based transcriptional burst kinetics inference could underestimate the degree of conservation in transcriptional burst kinetics.
Extended Data Figure 10. Inference of kinetics in different phases of the cell cycle.
Comparisons of inferred burst frequency and size for the C57 allele in fibroblasts with cells classified according to cell cycle phase. Scatter plots of burst frequency and size are shown for comparisons between S and G1 (a) and S and G2M (c). The GO-terms which are enriched in the group of genes with significant differential burst frequency are shown in (b) and (d) respectively (n = 116 genes with differential burst frequency in b and 75 genes in d).
Supplementary Material
Acknowledgement
We thank Qiaolin Deng for ES cell culturing, Sarantis Giatrellis for assistance with FACS sorting, Gert-Jan Hendriks for fruitful discussions, and the remainder of the Sandberg lab. This work was supported by grants to R.S. from the European Research Council (648842), the Swedish Research Council (2017-01062), the Knut and Alice Wallenberg’s foundation (2017.0110) and the Bert L. and N. Kuggie Vallee Foundation.
Footnotes
Competing financial interests. The authors declare no competing financial interests.
Author contribution. Conceived the study: RS. Developed computational methodology: AL. Explored and interpreted data: AL and RS. Prepared single-cell transcriptome data: PJ, LH, BjR and ÅS. Designed modified smart-seq2: MHJ and ORF. Provided Sox2 enhancer deletion cells: CMR and BR. Performed single-molecule RNA FISH: PJ. Generated figures: AL, RS. Wrote the manuscript: RS and AL.
Data Availability Statement
Sequencing data has been deposited at ENA (EBI) (E-MTAB-6362, E-MTAB-6385 and E-MTAB-7098) and code for transcriptional kinetic inference and analyses is provided through Github https://github.com/sandberg-lab/txburst
References
- 1.Levine M, Tjian R. Transcription regulation and animal diversity. Nature. 2003;424:147–151. doi: 10.1038/nature01763. [DOI] [PubMed] [Google Scholar]
- 2.Raj A, van Oudenaarden A. Nature, nurture, or chance: stochastic gene expression and its consequences. Cell. 2008;135:216–226. doi: 10.1016/j.cell.2008.09.050. [DOI] [PMC free article] [PubMed] [Google Scholar]
- 3.Raj A, Peskin CS, Tranchina D, Vargas DY, Tyagi S. Stochastic mRNA synthesis in mammalian cells. PLoS Biol. 2006;4:e309. doi: 10.1371/journal.pbio.0040309. [DOI] [PMC free article] [PubMed] [Google Scholar]
- 4.Chubb JR, Trcek T, Shenoy SM, Singer RH. Transcriptional pulsing of a developmental gene. Curr Biol. 2006;16:1018–1025. doi: 10.1016/j.cub.2006.03.092. [DOI] [PMC free article] [PubMed] [Google Scholar]
- 5.Levsky JM, Shenoy SM, Pezo RC, Singer RH. Single-cell gene expression profiling. Science. 2002;297:836–840. doi: 10.1126/science.1072241. [DOI] [PubMed] [Google Scholar]
- 6.Suter DM, et al. Mammalian genes are transcribed with widely different bursting kinetics. Science. 2011;332:472–474. doi: 10.1126/science.1198817. [DOI] [PubMed] [Google Scholar]
- 7.Nicolas D, Phillips NE, Naef F. What shapes eukaryotic transcriptional bursting? Mol Biosyst. 2017 doi: 10.1039/c7mb00154a. [DOI] [PubMed] [Google Scholar]
- 8.Fukaya T, Lim B, Levine M. Enhancer Control of Transcriptional Bursting. Cell. 2016;166:358–368. doi: 10.1016/j.cell.2016.05.025. [DOI] [PMC free article] [PubMed] [Google Scholar]
- 9.Bartman CR, Hsu SC, Hsiung CC-S, Raj A, Blobel GA. Enhancer Regulation of Transcriptional Bursting Parameters Revealed by Forced Chromatin Looping. Mol Cell. 2016;62:237–247. doi: 10.1016/j.molcel.2016.03.007. [DOI] [PMC free article] [PubMed] [Google Scholar]
- 10.Walters MC, et al. Enhancers increase the probability but not the level of gene expression. Proc Natl Acad Sci USA. 1995;92:7125–7129. doi: 10.1073/pnas.92.15.7125. [DOI] [PMC free article] [PubMed] [Google Scholar]
- 11.Zabidi MA, et al. Enhancer-core-promoter specificity separates developmental and housekeeping gene regulation. Nature. 2015;518:556–559. doi: 10.1038/nature13994. [DOI] [PMC free article] [PubMed] [Google Scholar]
- 12.Deng Q, Ramsköld D, Reinius B, Sandberg R. Single-cell RNA-seq reveals dynamic, random monoallelic gene expression in mammalian cells. Science. 2014;343:193–196. doi: 10.1126/science.1245316. [DOI] [PubMed] [Google Scholar]
- 13.Reinius B, et al. Analysis of allelic expression patterns in clonal somatic cells by single-cell RNA-seq. Nat Genet. 2016;48:1430–1435. doi: 10.1038/ng.3678. [DOI] [PMC free article] [PubMed] [Google Scholar]
- 14.Reinius B, Sandberg R. Random monoallelic expression of autosomal genes: stochastic transcription and allele-level regulation. Nat Rev Genet. 2015;16:653–664. doi: 10.1038/nrg3888. [DOI] [PubMed] [Google Scholar]
- 15.Kim JK, Marioni JC. Inferring the kinetics of stochastic gene expression from single-cell RNA-sequencing data. Genome Biol. 2013;14:R7. doi: 10.1186/gb-2013-14-1-r7. [DOI] [PMC free article] [PubMed] [Google Scholar]
- 16.Jiang Y, Zhang NR, Li M. SCALE: modeling allele-specific gene expression by single-cell RNA sequencing. Genome Biol. 2017;18:74. doi: 10.1186/s13059-017-1200-8. [DOI] [PMC free article] [PubMed] [Google Scholar]
- 17.Peccoud J, Ycart B. Markovian Modeling of Gene-Product Synthesis. Theoretical Population Biology. 1995;48:222–234. [Google Scholar]
- 18.Dar RD, et al. Transcriptional burst frequency and burst size are equally modulated across the human genome. Proc Natl Acad Sci USA. 2012;109:17454–17459. doi: 10.1073/pnas.1213530109. [DOI] [PMC free article] [PubMed] [Google Scholar]
- 19.Eisenberg E, Levanon EY. Human housekeeping genes are compact. Trends Genet. 2003;19:362–365. doi: 10.1016/S0168-9525(03)00140-9. [DOI] [PubMed] [Google Scholar]
- 20.Hornung G, et al. Noise-mean relationship in mutated promoters. Genome Res. 2012;22:2409–2417. doi: 10.1101/gr.139378.112. [DOI] [PMC free article] [PubMed] [Google Scholar]
- 21.Tantale K, et al. A single-molecule view of transcription reveals convoys of RNA polymerases and multi-scale bursting. Nat Commun. 2016;7 doi: 10.1038/ncomms12248. 12248. [DOI] [PMC free article] [PubMed] [Google Scholar]
- 22.Malecová B, Gross P, Boyer-Guittaut M, Yavuz S, Oelgeschläger T. The initiator core promoter element antagonizes repression of TATA-directed transcription by negative cofactor NC2. J Biol Chem. 2007;282:24767–24776. doi: 10.1074/jbc.M702776200. [DOI] [PubMed] [Google Scholar]
- 23.Li Y, et al. CRISPR reveals a distal super-enhancer required for Sox2 expression in mouse embryonic stem cells. PLoS ONE. 2014;9:e114485. doi: 10.1371/journal.pone.0114485. [DOI] [PMC free article] [PubMed] [Google Scholar]
- 24.Merkin J, Russell C, Chen P, Burge CB. Evolutionary dynamics of gene and isoform regulation in Mammalian tissues. Science. 2012;338:1593–1599. doi: 10.1126/science.1228186. [DOI] [PMC free article] [PubMed] [Google Scholar]
- 25.Padovan-Merhar O, et al. Single mammalian cells compensate for differences in cellular volume and DNA copy number through independent global transcriptional mechanisms. Mol Cell. 2015;58:339–352. doi: 10.1016/j.molcel.2015.03.005. [DOI] [PMC free article] [PubMed] [Google Scholar]
- 26.Hantsche M, Cramer P. Conserved RNA polymerase II initiation complex structure. Curr Opin Struct Biol. 2017;47:17–22. doi: 10.1016/j.sbi.2017.03.013. [DOI] [PubMed] [Google Scholar]
- 27.Roeder RG. The role of general initiation factors in transcription by RNA polymerase II. Trends Biochem Sci. 1996;21:327–335. [PubMed] [Google Scholar]
- 28.Jonkers I, Lis JT. Getting up to speed with transcription elongation by RNA polymerase II. Nat Rev Mol Cell Biol. 2015;16:167–177. doi: 10.1038/nrm3953. [DOI] [PMC free article] [PubMed] [Google Scholar]
Associated Data
This section collects any data citations, data availability statements, or supplementary materials included in this article.
Supplementary Materials
Data Availability Statement
Sequencing data has been deposited at ENA (EBI) (E-MTAB-6362, E-MTAB-6385 and E-MTAB-7098) and code for transcriptional kinetic inference and analyses is provided through Github https://github.com/sandberg-lab/txburst


