Abstract
Plants, like other multicellular lifeforms, are colonized by microorganisms. How plants respond to their microbiota is currently not well understood. We used a phylogenetically diverse set of 39 endogenous bacterial strains from Arabidopsis thaliana leaves to assess host transcriptional and metabolic adaptations to bacterial encounters. We identified a molecular response, which we termed the general non-self response (GNSR) that involves the expression of a core set of 24 genes. The GNSR genes are not only consistently induced by the presence of a majority of strains, they also comprise the most differentially regulated genes across treatments and are predictive of a hierarchical transcriptional reprogramming beyond the GNSR. Using a complementary untargeted metabolomics approach we link the GNSR to the tryptophan derived secondary metabolism, highlighting the importance of small molecules in plant microbe interactions. We demonstrate that several of the GNSR genes are required for resistance against the bacterial pathogen Pseudomonas syringae. Our results suggest that the GNSR constitutes a defense adaptation strategy that is consistently elicited by diverse strains from various phyla, contributes to host protection and involves secondary metabolism.
In nature, plants are not axenic and colonization by microorganisms is the default. The plant microbiota plays a key role in how plants interact with the environment, mediate tolerance to biotic and abiotic stresses and resist pathogens1–4. Historically and for economic reasons, the focus of study in plant-bacteria relations has been placed on mutually beneficial or pathogenic bacteria. Especially in regard to the latter, detailed knowledge on short-term host responses to infections with virulent, avirulent or incompatible pathogens has been gathered5, 6. However most plant-bacteria interactions are long-term and result in rather stable microbiome compositions throughout the vegetative phase1.
Previous studies on root and leaf-colonizing bacteria have revealed distinct host responses. For example it was shown that two plant-protective root-colonizing bacteria increase the host’s pathogen resistance by triggering different signaling pathways and local vs systemic transcriptional reprogramming7, 8. Drastically different host responses have also been reported for bacteria in the phyllosphere, the aerial part of the plant. The plant-protective Alphaproteobacterium Sphingomonas melonis Fr1 for example causes a significant host response that, in part, resembles the response elicited by the pathogenic bacterium Pseudomonas syringae pv. tomato DC3000 (hereafter Pst)9. This overlap in host responses to a commensal and a pathogen provokes the question of how widespread recognition of microbiota members is and to what extent reprogramming of plant transcriptional states upon colonization by its microbiome members is convergent. It is currently unclear if and how plants distinguish pathogenic from non-pathogenic bacteria initially.
One way plants adapt to and shape their microbiome is by tuning their secondary metabolism. Plants possess a large array of specialized metabolites that are not only involved in attracting pollinators and symbionts but also in defense against herbivores, bacteria or fungi10, 11, and in shaping the microbiome12–14.
In Arabidopsis thaliana (hereafter Arabidopsis), an important and highly diverse class of secondary metabolites are indolic derivatives of tryptophan. While primarily associated with defense against pathogens15–18, they have also been implicated in maintenance of symbiotic relationships19.
Here, we used representative strains of the Arabidopsis phyllosphere and investigated the transcriptional and metabolic long-term adaptation strategies of the host plant in response to colonization by the phylogenetically diverse single strains in a gnotobiotic system. We uncovered common patterns in the plant’s response to different bacteria that we link to the host secondary metabolism and resistance to pathogens.
Results
Plant adaptation to bacterial colonization
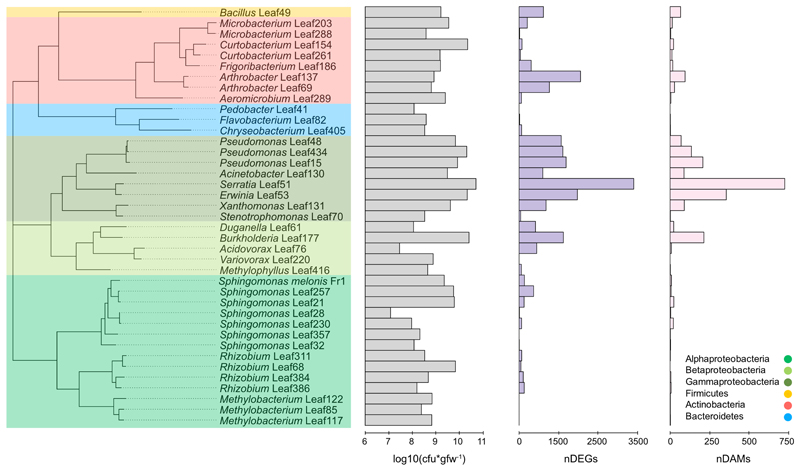
We selected 38 phylogenetically diverse strains previously isolated from Arabidopsis leaves20 to survey plant responses to bacterial colonization. These strains represent 16 bacterial families of the four major leaf-colonizing bacterial phyla from the Arabidopsis phyllosphere1, 20. All chosen strains were able to colonize the host plant, reaching cell numbers above 107 colony forming units per gram fresh-weight (cfu*gfw-1) (Fig. 1) In addition we included Sphingomonas melonis Fr1 as a control due to its known ability to trigger a strong plant response9.
Figure 1. Magnitude of the Arabidopsis response to bacterial colonization at the transcriptional and metabolic levels.
Phylogenetic tree of bacterial strains colored according to phyla and class (see legend). First bar-chart (grey) displays the average cell number reached in the phyllosphere in cfu*gfw-1 nine days after inoculation. The second (purple) and third (rose) bar-charts display the response strength in nDEGs and nDAM in the respective condition. Data from five independent biological replicates, each representing 18-24 plants.
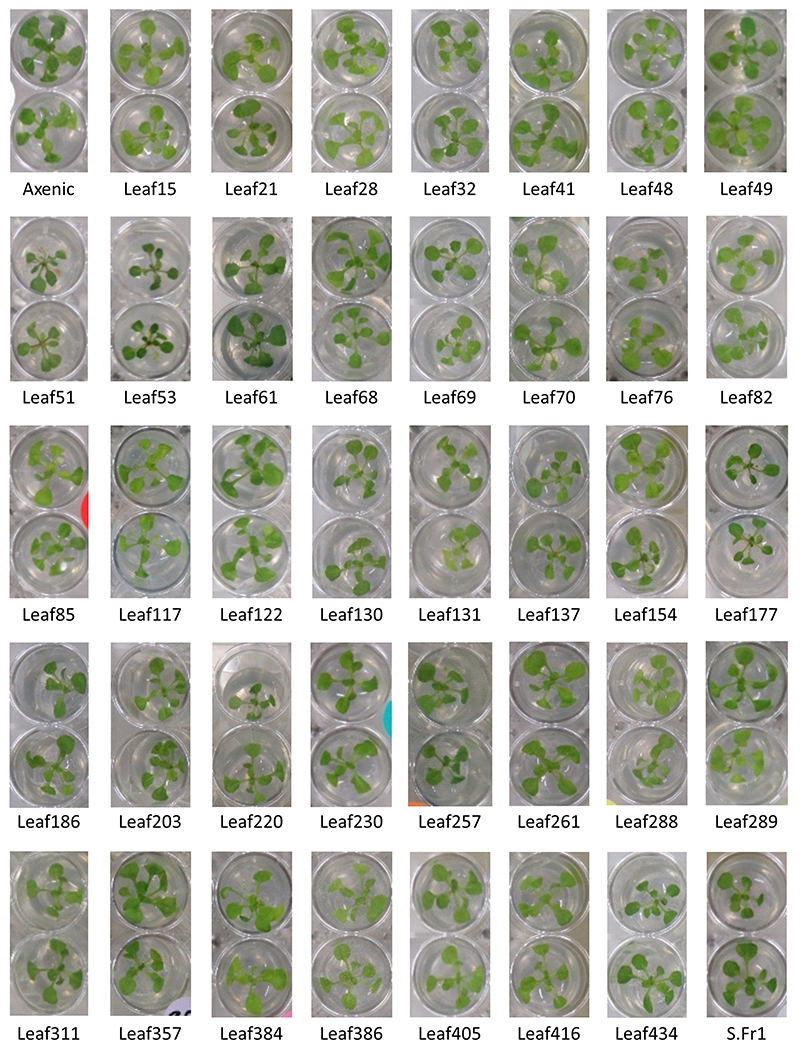
We inoculated the strains onto Arabidopsis seedlings in mono association, using a previously established gnotobiotic system21 and harvested the plants 9 days later. For differential analyses, our reference consisted of mock-inoculated, axenic control plants. With the exception of Serratia Leaf51, Erwina Leaf53, Xanthomonas Leaf131 and Burkholderia Leaf177 (Extended Data Fig. 1), none of the strains caused visible alterations in plant phenotype. To investigate the plants’ potential long-term adaptation to colonization by the bacteria we analyzed each condition in five independent replicate experiments (see Methods), resulting in more than 200 samples (39 strains conditions plus two axenic controls, five biological replicates each) from a total of > 3900 plants. We determined the differentially expressed genes (DEGs) (|log2FC| > 1, FDR < 0.01) in the phyllosphere by RNA sequencing and developed high-sensitivity mass-spectrometry methods to measure differentially abundant metabolite features (DAMs) in the same samples (|log2FC| >1, FDR < 0.05) (see Methods).
We found that Arabidopsis responded to most bacteria and that the intensity of the reaction differed strongly depending on the colonizing strain (Fig. 1, Extended Data Fig. 2ab, Supplementary Data Tab. 1-2). On average, changes in transcript and metabolite feature abundance were most pronounced in response to Gammaproteobacteria (mean 1329 DEGs, 205 DAMs); among them Leaf51 (Serratia) with the highest number of DEGs (3403) and DAMs (710) and least pronounced in Bacteroidetes (mean 31 DEGs, 1 DAM) and Alphaproteobacteria (mean 88 DEGs, 6 DAMs) (Fig. 1). Among the latter were three Methylobacteria spp. that hardly elicited any response supporting previous findings from M. extorquens PA19 provoking questions such as how they are able to avoid or suppress the host’s immune system.
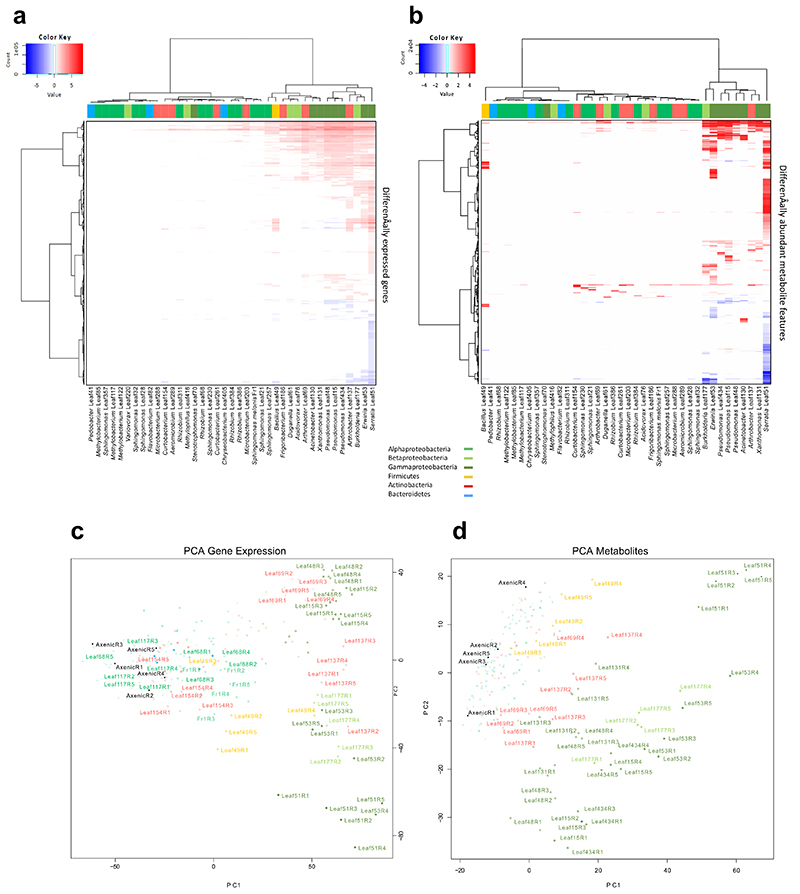
Notably, while some closely related strains elicited highly similar responses (e.g. Pseudomonas spp. Leaf15, Leaf48 and Leaf435 shared 1035 DEGs out of 1397, 1250 and 1298, respectively) the magnitude of reprogramming was distinct for some strains within the same phylum and occasionally within the same family (eg. Sphingomonadaceae, Microbacteriaceae; Fig. 1, Extended Data Fig. 2a). Clustering of DEGs revealed that similar responses were elicited by distantly related strains (e.g. Arthrobacter Leaf137, Erwina Leaf53 and Burkholderia Leaf177; 884 shared DEG out of 1730, 1825 and 1315 respectively; see Extended Data Fig. 2ac)
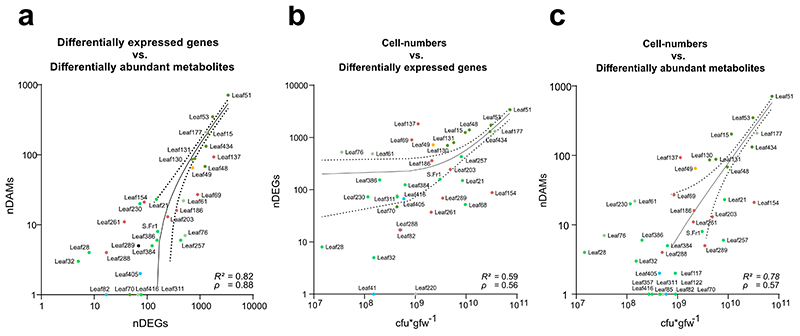
We observed a strong correlation between the transcriptional and metabolic response (based on the DEGs and DAMs per treatment) (Linear Regression: R2 = 0.82, Spearman correlation: ρ = 0.88; p-value < 0.0001) and found a significant correlation between the average cfu*gfw-1 on the phyllosphere and the amount of differentially regulated genes (R2 = 0.59, p = 0.56; p-value = 0.0002) and metabolites (R2 = 0.78, ρ = 0.57; p-value = 0.0002) (Extended Data Fig. 3a-c).
The General Non-Self Response
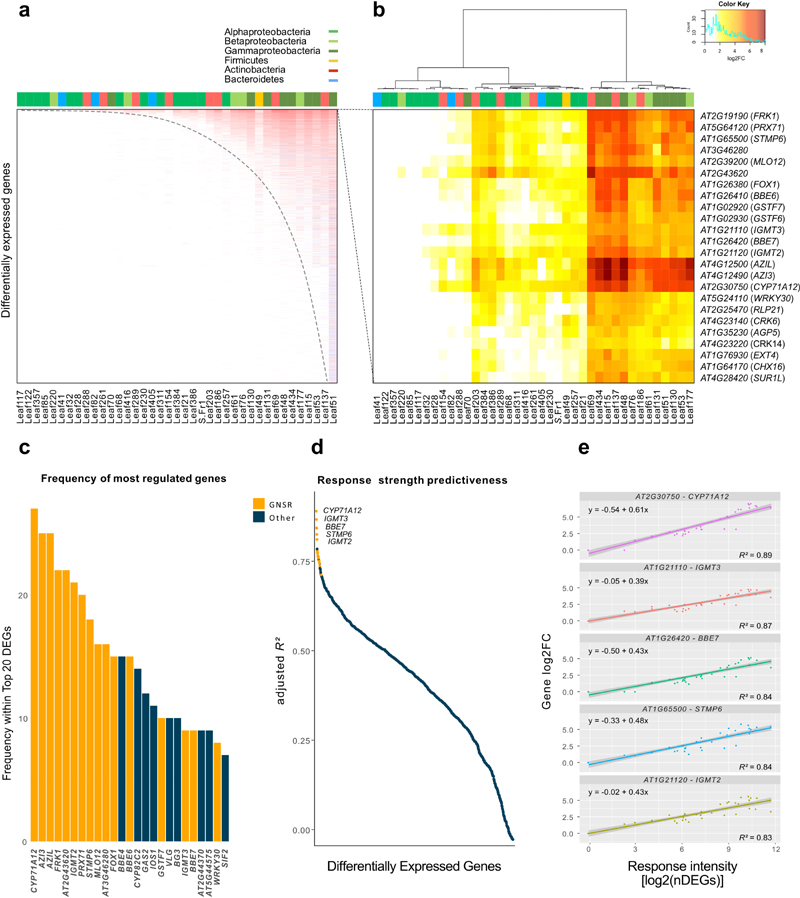
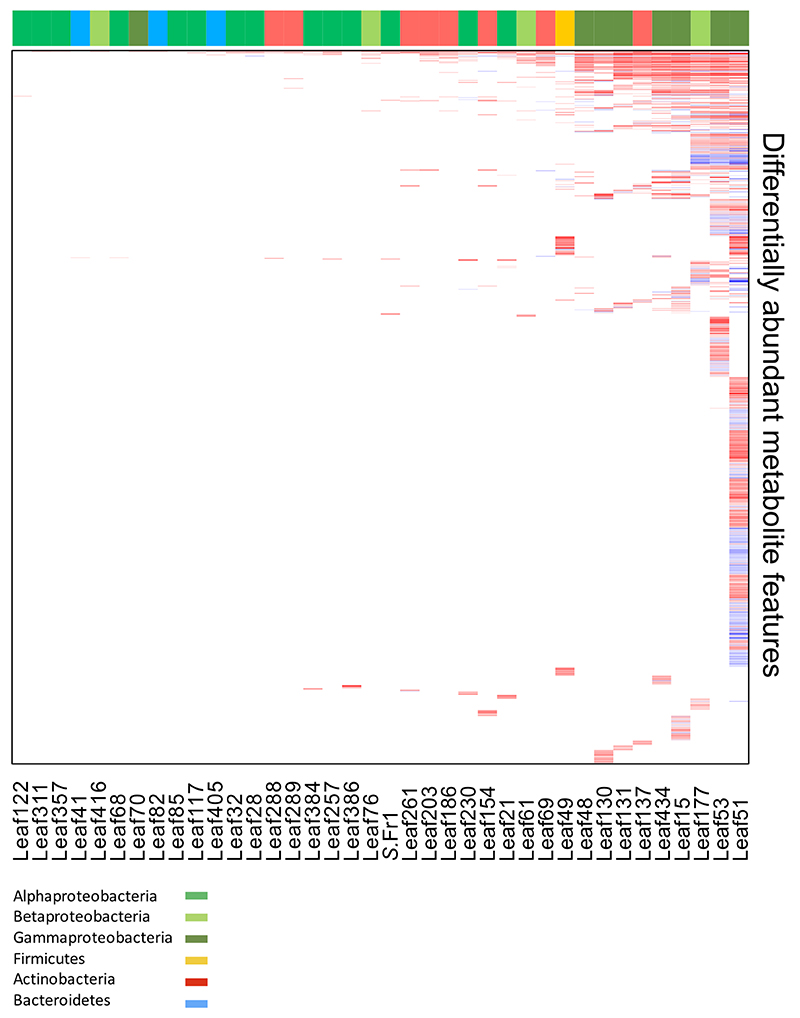
When analyzing the DEGs across all treatments, we observed a striking priority pattern after sorting treatments by the number of DEGs and the DEGs by frequency of differential expression: with each increase in the total number of DEGs, new DEGs are added to those already regulated, resulting in a hierarchy graph that was independent of phylogeny of the bacterium tested (Fig. 2a). This pattern was also present but less pronounced in the metabolome data (Extended Data Fig. 4).
Figure 2. General non-self response genes.
a, Heatmap of log2-transformed fold-changes sorted by frequency of differential expression (y-axis) and treatments with most differentially expressed genes (x-axis). Top color bar indicates bacterial phyla/class. Dotted line illustrates the hierarchical nature of the responses. Data represents results from five independent biological replicates (n=5) b, Heat-map of the log2-transformed fold-changes of the most consistently differentially regulated genes across all treatments (differentially expressed in > 70 % of treatments). GNSR genes with strains (x-axis) and individual genes (y-axis). Strains clustered by Ward’s method. The top color bar indicates the bacterial phyla/classes. Data represents results from five independent biological replicates (n=5). c, Frequency of the 25 genes most consistently detected among the 20 most differentially regulated genes across all conditions (based on log2FC). Color code indicates GNSR affiliation. d, Results of linear regressions (adjusted R2 value) of individual log2-transformed gene fold changes against log2-transformed nDEGs. Color code indicates GNSR affiliation e, Exemplary results of linear regressions with regression line, formula and 95% confidence intervals (grey bands) for the five most highly predictive GNSR genes for overall number of DEGs across all treatments.
Next, we investigated which genes were leading the top of this hierarchy and identified a set of 24 DEGs that were consistently upregulated in ≥ 70% of all treatments (Fig. 2b). These 24 most frequently regulated genes across treatments were also the DEGs that most consistently showed the highest fold changes (log2FCs) within each of the conditions (Fig. 2c). As with the overall response, we observed that phylogenetically distinct bacteria can elicit a similar response pattern in the plant and found a significant correlation between the intensity of the 24 core DEGs and the amount of bacterial plant colonization (cfu*gfw-1) (median fold-change in a treatment, Spearman correlation, ρ = 0.49; p-value = 0.0017).
Based on their prevalence in the majority of plant-microbe interactions tested and the assigned functions further discussed below, we designated this upregulation pattern of 24 core genes as the General Non-Self-Response (GNSR). Additionally and remarkably, these GNSR genes appeared to correspond to the overall intensity of the plant’s response (in total number of DEGs per condition, nDEGs). We therefore wondered whether these genes could act as markers for the intensity of the plant response to any bacterial strain. We performed a linear regression on the log2-transformed nDEGs against the log2FCs of each gene that appeared differentially regulated in response to at least 5 bacterial treatments. We found that among the 20 genes with an adjusted R2-value > 0.75 (Wherry’s formula R-squared adjustment), 17 were indeed part of the GNSR (Fig. 2de, Supplementary Information Tab. 4). The top-ranking predictor for response intensity in our system was CYP71A12 with an adjusted R2 of 0.89, followed by IGMT3 (adj.R2 = 0.87), BBE7 (adj.R2 = 0.84), STMP6 (adj.R2 = 0.84) and IGMT2 (adj.R2 = 0.83).
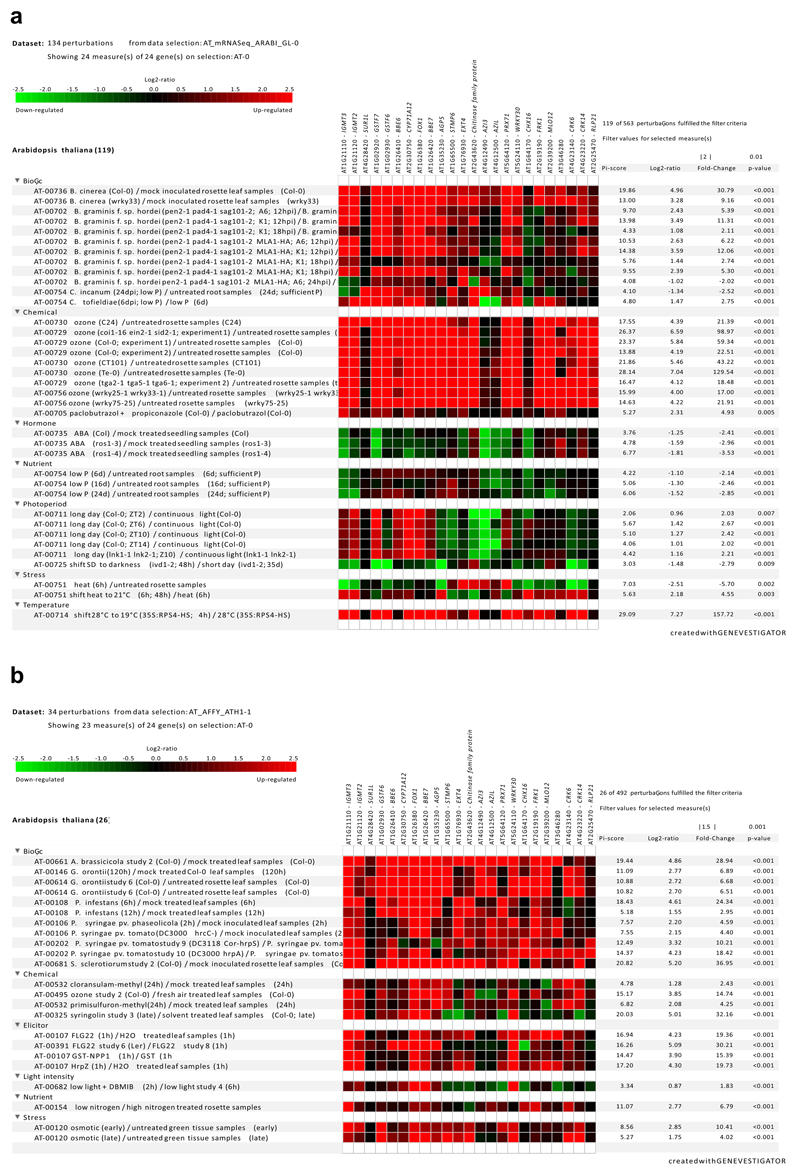
To determine whether other biotic treatments also caused this core GNSR response, we used the Genevestigator tool22 to search publicly available data sets for perturbations that resulted in the differential expression of the 24 GNSR genes. Interestingly, we found that they were most significantly associated with defense responses against pathogens, including fungal pathogens of the genera Alternaria 23, Blumeria 24, Botrytis 25, Colletotrichum 26, 27 and Sclerotinia 28, the oomycete Phytophthora infestans, and against the bacterial pathogen Pst29 but also by bacterial elicitors of the plant immune response such as HrpZ and flg2230. The genes were also upregulated to a lesser extent in response to some abiotic stressors such as oxidative (ozone treatment) and osmotic stress (300 mM mannitol), and downregulated in response to the development and stress associated plant hormone abscisic acid (ABA)31, suggesting an additional function beyond biotic interactions (Extended Data Fig. 5). Overall, the pattern of upregulated genes in plant-microbe interactions beyond the bacterial microbiota representatives tested here supports the notion of a General Non-Self-Response (GNSR).
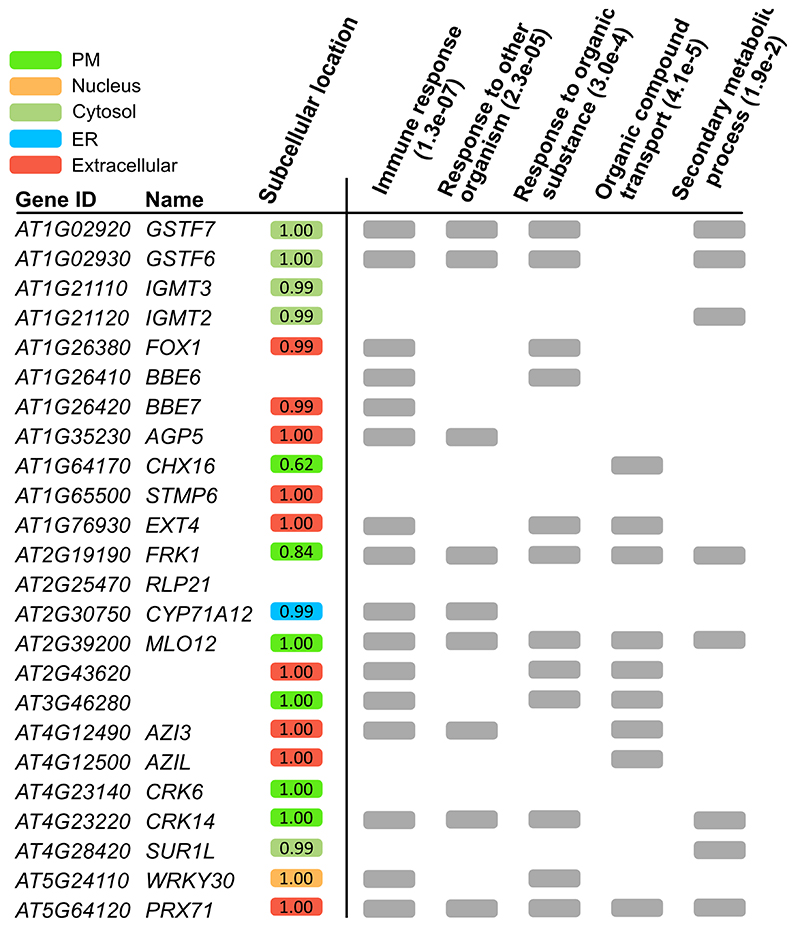
To further strengthen the link of the GNSR to plant immunity, we performed a gene ontology (GO)-based functional enrichment analysis. This revealed significant associations with defense and general stimuli responses, organic compound transport, and secondary metabolism (Extended Data Fig. 6, Supplementary Information Tab. 3). To place the GNSR gene products within the cellular context we predicted sub-cellular location using the SUBA4 web tool32, 33 (http://suba.live/). The largest subset was predicted to localize to the extracellular space (9/24, SUBAcon > 0.9), followed by plasma membrane (6/24, SUBAcon > 0.6) and the cytosol (5/24, SUBAcon > 0.9) while the remaining four could either not be assigned (2/24) or were placed at the endoplasmatic reticulum and nucleus (1/24 each) (Extended Data Fig. 6). The extracellular space and the plasma membrane are the contact points of plant cells and microbes, again indicating the involvement of the GNSR in plant-microbe interactions.
We therefore demonstrated that the GNSR is induced by a majority of bacterial treatments as well as a wide range of plant pathogens and is predictive of the strength of the overall response. Combined with the functional enrichment analysis and prediction of subcellular location, this suggests that the GNSR is part of the plant immune response to a variety of biotic and potentially abiotic stressors.
Linking GNSR and the metabolome
The functional enrichment analysis of the GNSR had revealed an association with the secondary metabolism (Extended Data Fig. 6, Supplementary Information Tab. 4). We therefore wondered whether the GNSR could be linked to certain metabolite features.
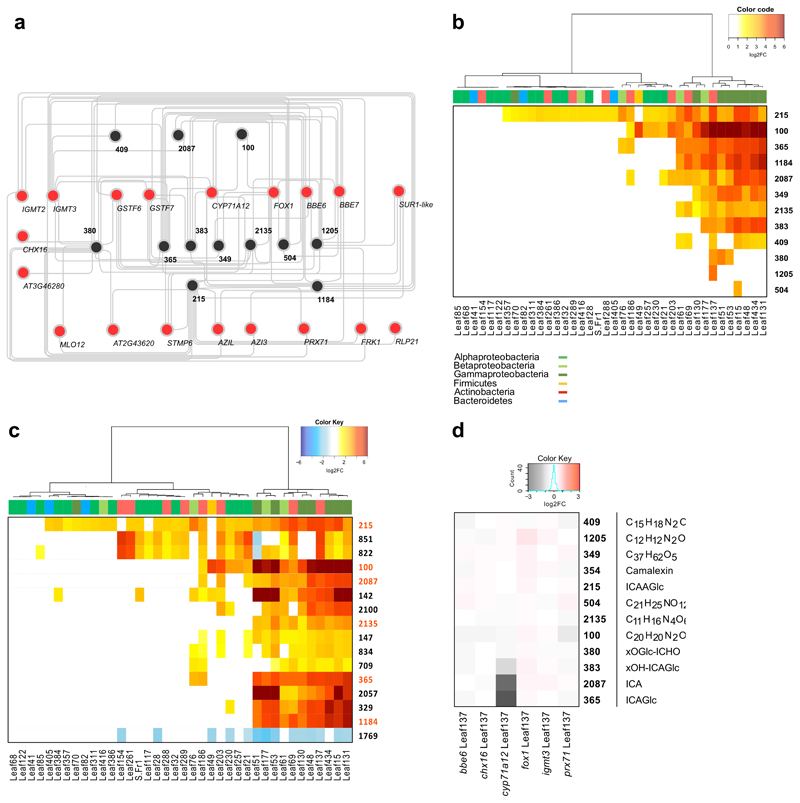
To identify such features we performed a Spearman correlation between the transcript abundances of each of the GNSR genes (log2-transformed normalized count data, see Methods) and metabolite feature abundances (log2-transformed peak area, normalized to total ion current (TIC) and dry weight) of all 2361 metabolite features across all biological replicates. We then filtered the resulting correlations using a Top-N approach, accepting the best two correlations between each GNSR gene and the metabolite feature, provided that the rho value was |ρ| > 0.85 and the FDR < 0.01. This approach allowed us to identify 12 metabolites that significantly correlated with the GNSR (Fig. 3a, Supplementary Information Tab. 5).
Figure 3. Correlation-analysis of GNSR and metabolome.
a, Correlation network of GNSR genes (red) with metabolites (black). Edges signify the top 2 positive correlations (Spearman’s ranked correlation, ρ > 0.85, p-value < 0.01, p-value adjustment: Benjamini-Hochberg) between the log2-transformed normalized count data against the log2-transformed normalized peak area for each independent biological replicate (n = 5). b-c, Heat-map showing significant changes (log2FC > 1, FDR < 0.05) of compounds (as crids) against wild-type (Col-0) control plants within the dataset (n = 5 independent biological replicates). Strains clustered by Ward’s method. Strain phylogeny is depicted by top color bar. (b) depicts GNSR associated compounds, (c) shows the most abundant compounds in the entire data set, with GNSR associated compounds marked orange (y-axis) d, Heat-map of log2-transformed fold changes of metabolite abundances in GNSR gene mutants inoculated with Arthrobacter Leaf137 against equally treated wild-type plants. (n = 10 technical replicates of 3 plants). For each crid, either the compound name or the predicted molecular formula is provided.
Next, we analyzed the occurrence of these 12 metabolites across all treatments and visualized the significant fold-changes (Fig. 3b). Among them, a single metabolite (215) was particularly conspicuous as it showed a similar broad frequency as the GNSR genes. In terms of fold-change increments, 100 was the most striking; it showed significant increases in ≥ 40% of the treatments, with up to 30 times the abundance levels observed in axenic control plants (Fig. 3b).
In a complementary analysis and irrespective of the GNSR, we conducted a global analysis of DAMs that were most consistently regulated among all treatments. Notably, there was a high overlap between metabolites identified via the correlation of GNSR gene expression and those that were identified in a direct untargeted approach (Fig. 3c). This finding confirms a convergent plant reprogramming both at the transcriptional and metabolic level in response to bacteria.
The tryptophan derived secondary metabolism
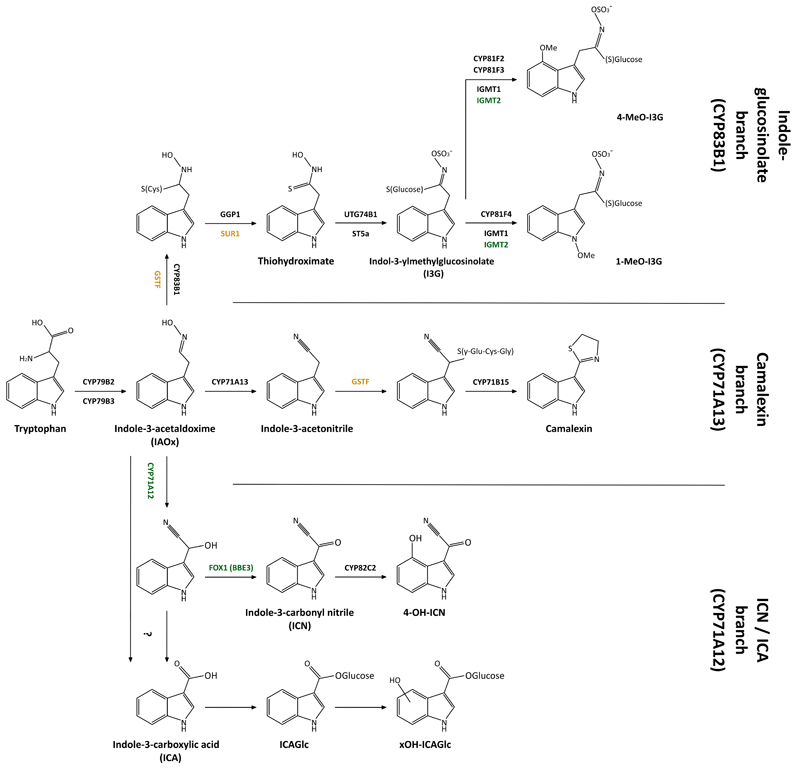
Next we sought to identify the 12 GNSR associated metabolites. Initial, automated database searches for the predicted masses were often too ambiguous and inconclusive. Based on the GO associations of GNSR genes (Extended Data Fig. 6), however, we suspected a link to the tryptophan derived secondary metabolism (TDSM). The TDSM involves indolic metabolites that stem from the initial conversion of tryptophan to indole-3-acetaldoxime (IAOx)34, which is then channeled into one of three known biosynthetic branches (Extended Data Fig. 7), all of which are associated with plant defense16, 35, 36.
The GNSR genes CYP71A12 and FOX1 are known members of the TDSM pathway18, and IGMT2, IGMT3 and SUR1L are either implicated in or paralogous to other components of the TDSM (Extended Data Fig. 7). We thus wondered whether some of the metabolites identified via the GNSR (Fig. 3a) are part of TDSM and would thus provide further evidence for the defensive nature of the response.
To confirm our hypothesis, we performed targeted liquid chromatography tandem mass-spectrometry (tandem LC-MS, MS2) on these GNSR associated metabolites (Fig. 3a) to generate data about their structural composition.
The analysis of this data suggested that several features are indeed indolic (Supplementary Fig. 1-10). We identified known indole based secondary metabolites, such as indole carboxylic acid (ICA, 2087), ICA glucose (ICAGlc, 365) and a hydroxylated derivative thereof (xOH-ICAGlc, 383) as well as a O-glucoside indole-3-carbaldehyde (xOGlc-ICHO, 380)35. We could also assign a putative structure to 215, which seems to be a novel indole-3-carboamide O-glucose ester (Supplementary Information Fig. 2). For 409, 504 and 1205, we found some evidence for the presence of an indole ring upon fragmentation but could not surmise the complete structure with certainty (Supplementary Information Fig. 6-8).
To investigate the role of the GSNR in the biosynthesis of these metabolites, we selected homozygous transfer-DNA (T-DNA) insertion lines of GNSR genes that we suspected could be involved in TDSM (bbe6, cyp71a12, fox1, gstf6, igmt3, prx71) and a putative anti-porter (chx16) for targeted metabolomics. We treated plants of these lines with Arthrobacter Leaf137, a representative strain that caused a strong GNSR response (Fig. 2b) and induced essentially all of the 12 GNSR associated metabolites (Fig. 3b). We then used axenic plants of the same lines as a controls. The cyp71a12 background showed a striking decrease of three metabolites compared to inoculated wild-type plants in response to Leaf137 (Fig. 3d). Two of these metabolites, ICA (2087) and ICAGlc (365) have been reported previously to decrease in the cyp71a12 background15, 35, and 383 is a hydroxylated derivative of ICAGlc (xOH-ICAGlc). Because CYP71A12 and CYP71A13 were reported to be involved in camalexin biosynthesis36, we also analyzed this metabolite; however, we did not detect significant differences (Fig. 3d). Notably, none of the other GNSR genes tested had an impact on the abundance of the 12 associated metabolites.
To ensure that the significant changes of ICA and derivatives in the cyp71a12 background were not due to properties of Arthrobacter Leaf137, we tested two additional strains, Pseudomonas Leaf15 and Burkholderia Leaf177. The previous results could be confirmed and an additional metabolite, 349, was also found to be downregulated (Extended Data Fig. 8).
The GNSR in defense against bacterial pathogens
The finding that the GNSR represented a convergent set of plant genes, that was triggered by endogenous microbiota members as well as phytopathogens, and can be linked to the plant defense related TDSM (Fig. 3a, Extended Data Fig. 6)15, provoked the question of whether the GNSR genes actually contribute to plant defense upon pathogen challenge. For AZIL, AZI3, CYP71A12, EXT4 and PRX71, this link had already been established18, 37, 38, and for STMP6 it was implied39.
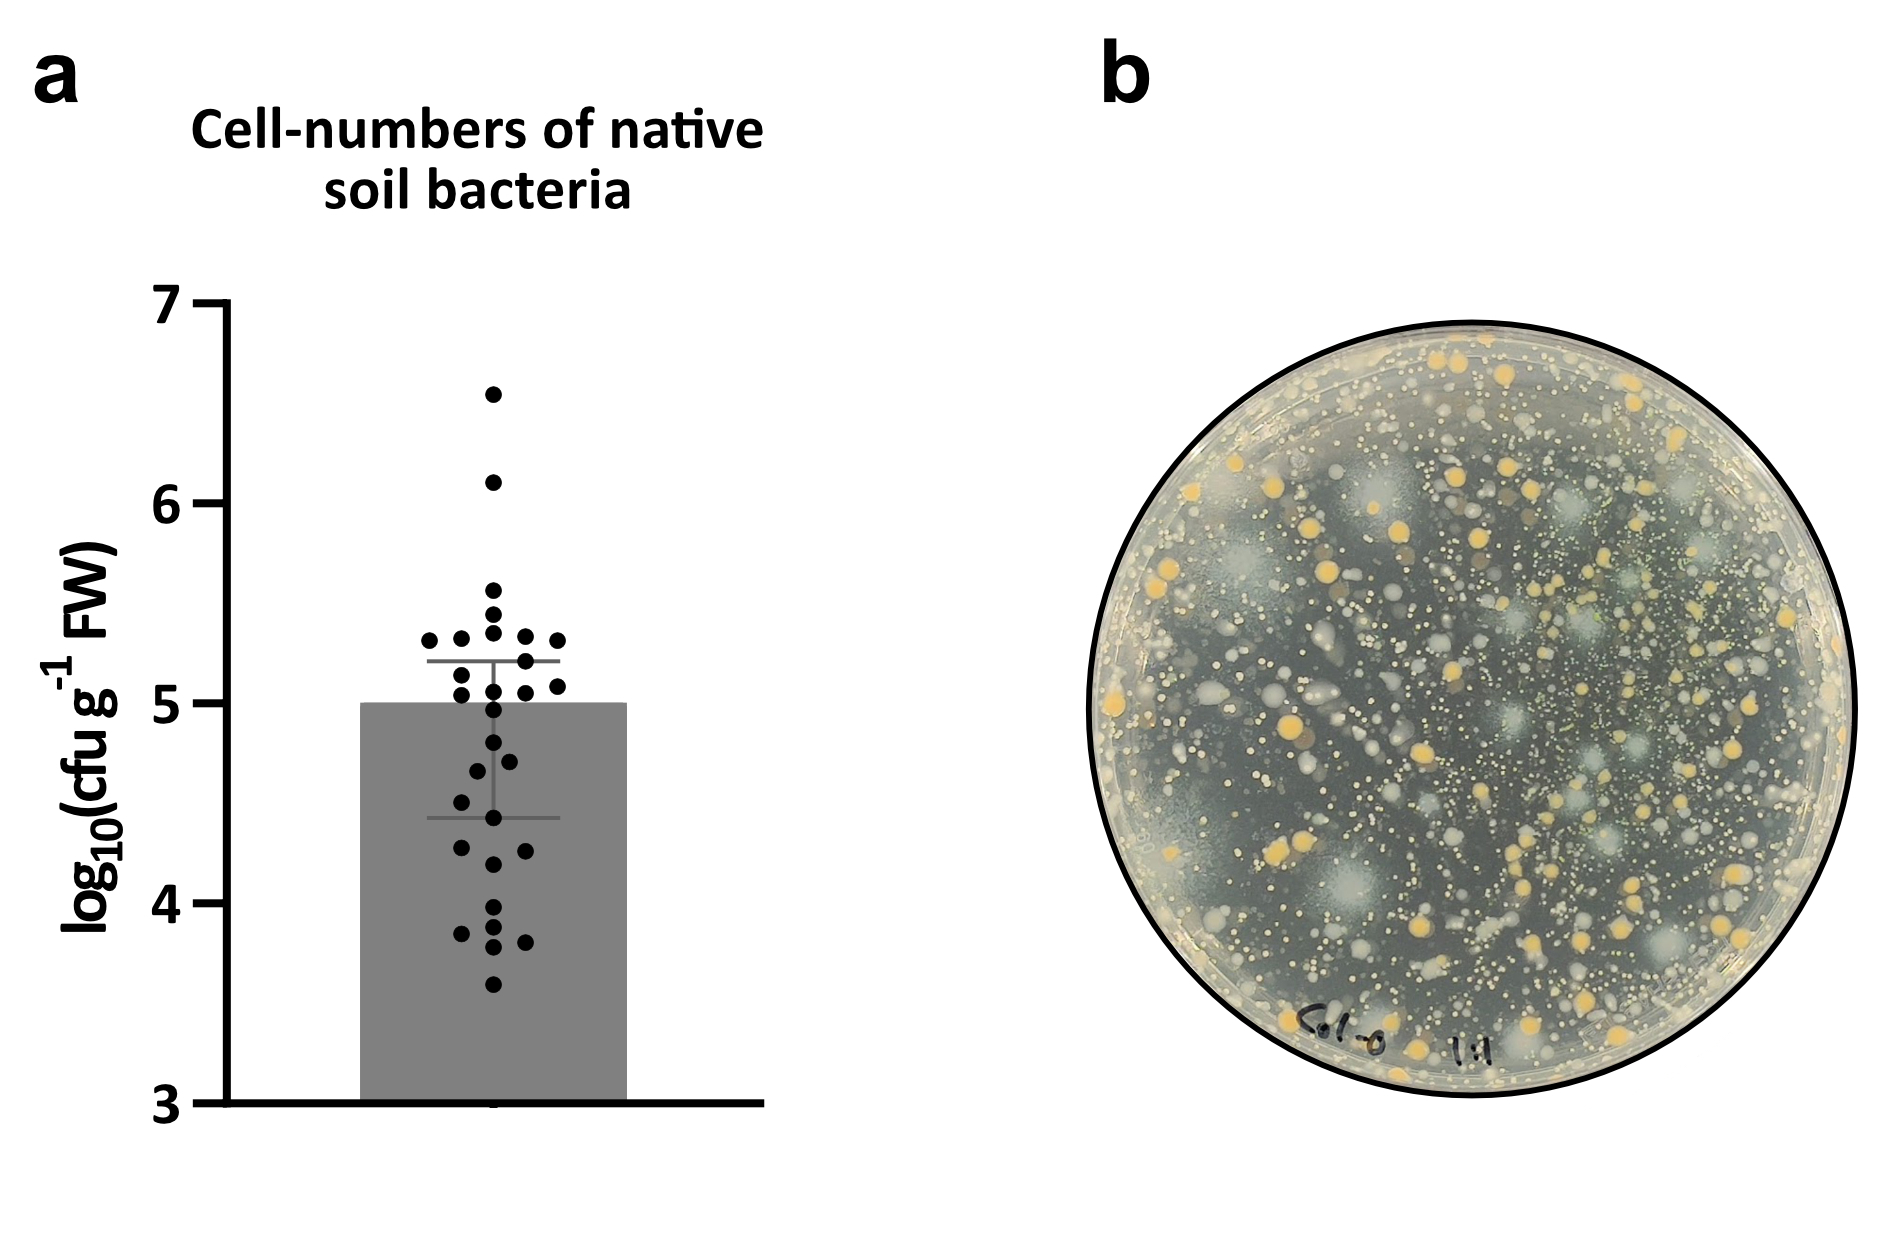
To investigate the impact of the loss of GNSR genes we tested five week old plants of T-DNA insertion lines for nine GNSR genes (prx71, chx16, gstf6, bbe6, mlo12, at2g43620, igmt3, fox1, cyp71a12) with the foliar plant pathogen Pst and compared their susceptibility to the known immunocompromised bak1/bkk1 mutant40. To ensure that the plants were colonized by a natural microbiota prior to pathogen exposure, we grew the plants in soil and confirmed the presence of bacteria by bacterial enumeration (Extended Data Fig. 9).
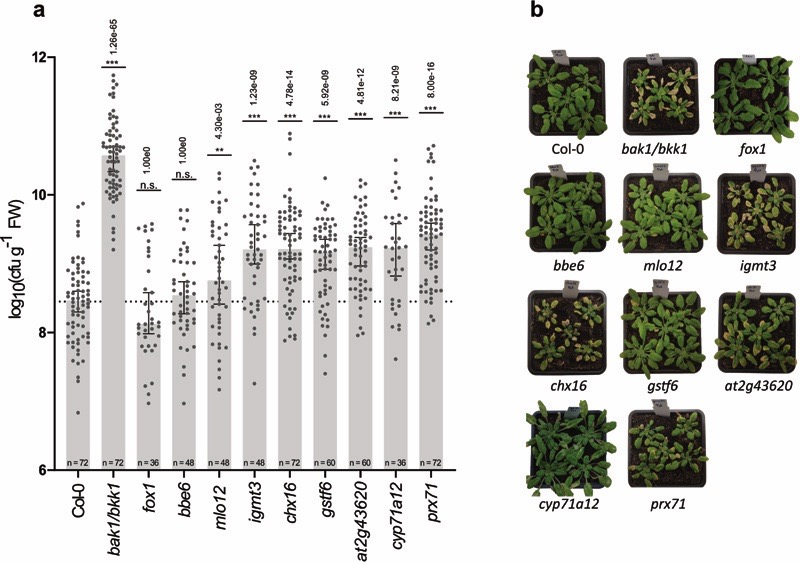
While to a lesser extent than the immunocompromised bak1/bkk1 line that we used as a control, mutants of seven individual GNSR genes were indeed significantly more susceptible to Pst compared to wild-type Col-0 plants (Fig. 4ab). These were mutants of genes encoding a chitinase family protein (AT2G43620), a putative Na+/H+ anti-porter (CHX16, AT1G64170), an O-methyltransferase family protein (IGMT3, AT1G21110), a cell-wall bound peroxidase (PRX71, AT5G64120), mildew resistance locus 12 (MLO12, AT2G39200), and a glutathione S-transferase (GSTF6, AT1G02930) as well as CYP71A12 (AT2G30750). With the exception of mlo12, where susceptibility varied strongly (Fig. 4a), the remaining GNSR mutants supported 5-8x higher Pst populations. With these findings we could confirm the previously reported roles of CYP71A12 and PRX71 in plant immunity and establish new roles for CHX16, AT2G43620, IGMT3 and GSTF6. This further confirms the distinct role of the GNSR in plant defense.
Figure 4. Disease susceptibility phenotypes of GNSR mutants.
a, Cell numbers (cfu*gfw−1) of Pst on GNSR gene mutant plant lines. Data combined from at least three independent experiments. Number of data points is indicated in each bar (each experiment: n = 12). Bars depict median with 95 % confidence interval. Significance against the infected wild-type control (Col-0) is indicated above the bars by asterisks. Displayed p-values derive from the summary statistic of R’s linear model (Pearson’s correlation, batch adjusted) of mutant genotypes against the respective control (see Methods) and were adjusted by Bonferroni correction of p-values (*: adj. p-value < 0.01, **: adj. p-value < 0.01, ***: p-value < 0.001.) b, Representative plant phenotypes 7 days after infection with Pst.
Discussion
Our data of plant responses showed that Arabidopsis mounts an individualized response to 39 phylogenetically diverse phyllosphere bacteria (Fig. 1; Extended Data Fig. 2ab). The observed correlation of the plant response strength (nDEGs) with colonization density (Extended Data Fig. 3bc), might be explained by the higher probability of the plant detecting bacterial epitopes, plant damage or nutrient scavenging. From an ecological and evolutionary perspective, this correlation is intriguing, as it may suggest that detection could be mutually beneficial. A selection for non-pathogenic bacteria that are resistant towards plant defenses could increase the competitiveness of both the host and the bacteria, as the combination of induced immunity and niche occupation by commensals would thwart pathogen infection. The hypothesis that the plant uses its immune system to shape its microbiota has been put forward4, 41, 42 and host-microbe interactions such as the ones we observed are in agreement with this model.
The plant responses were not only individualized but also strikingly hierarchical with each level of response strength containing most of the DEGs of the previous level (Fig. 2a). This increase in nDEGs was steep and could indicate that the plant perceives some of the strains as potential pathogens and therefore triggers increasingly strong but convergent anti-bacterial defenses. Indeed, several of the genera causing the most intense host responses are known to contain phytopathogens, such as Acidovorax, Arthrobacter, Burkholderia, Erwinia, Pseudomonas, Serratia and Xanthomonas 43, 45.
Leading the observed expression hierarchy, we identified a core set of 24 genes (Fig. 2b), which we termed the GNSR based on their common upregulation in response to biotic stressors. The GNSR genes were among the most differentially regulated features in each treatment, and their fold changes were highly predictive of the overall intensity of the plant response. We hypothesize that these genes, or some of them, integrate perception signals from the microbiota to regulate the strength of the host response. Their association with plant defense was further underscored by functional enrichment analysis (Extended Data Fig. 6), by their link to the TDSM (Fig. 3d, Extended Data Fig. 7), and the increased pathogen susceptibility of GNSR gene mutants (Fig. 4a).
In terms of biological function the GNSR provokes a number of intriguing questions on its role. Three GNSR genes encode cell-wall-associated proteins, EXT4 (Extensin 4), AGP5 (Arabinogalactanprotein 5) and PRX71 (cell-wall-bound peroxidase 71). Extensins and Arabinogalactanproteins are both hydroxyproline-rich cell-wall glycoproteins with a potential ability for oxidative cross-linking. It has been demonstrated that overexpression of EXT4 leads to increased stem thickness and resistance towards Pst37 while overexpression of PRX71 has been reported to grant increased resistance towards Botrytis cinerea 38. Loss of PRX71 on the other hand leads to altered lignin structure46 and, as demonstrated in this study, increased susceptibility to Pst (Fig. 4a). A possible mode of action for the two glycoproteins might therefore be to reinforce and tighten the cell-wall and PRX71 could act as the enzyme required for their oxidative cross-linking.
Despite the significant correlation between the GNSR and the TDSM, the analysis of plant mutants showed that only the cyp71a12 line had a detectable effect on the metabolome. We assume that this might be due to the conspicuous presence of paralogs among the potentially TDSM associated genes, including BBE3 (FOX1), BBE6 and BBE7, GSTF6 and GSTF7 as well as IGMT2 and IGMT3. Redundancies in the TDSM have been observed before, such as the roles of CPY79B2 and CYP79B3 in IAOx biosynthesis34 and TGG1 and TGG2 in breakdown of IMGs47 or the partial redundancies of CYP71A12 and CYP71A13 in camalexin biosynthesis48. Built-in redundancy for the GNSR might contribute significantly to the robustness of the plant’s ability to respond to biotic stressors and could also explain the rather mild disease susceptibility phenotypes of GNSR mutants compared to the immunocompromised double mutant line bak1/bkk1 (Fig. 4). Some GNSR genes might also be involved in transport rather than biosynthesis of these compounds. GSTF6, for example, has a high affinity for heterocyclic compounds, including indole-3-carbaldehyde and camalexin and is strongly induced in response to external application of breakdown products of the TDSM product indol-3-ylmethyl-glucosinolate (IMG)49.
Several GNSR-associated compounds did not match any known TDSM products. A recent study reported that a triple mutant with defects in all three major TDSM branches still retained a higher level of pathogen resistance compared to the cyp79b2/b3 double mutant, which is devoid of all TDSM products15. This may indicate the existence of yet unknown TDSM branches for which theses novel GNSR-associated metabolites could be promising targets.
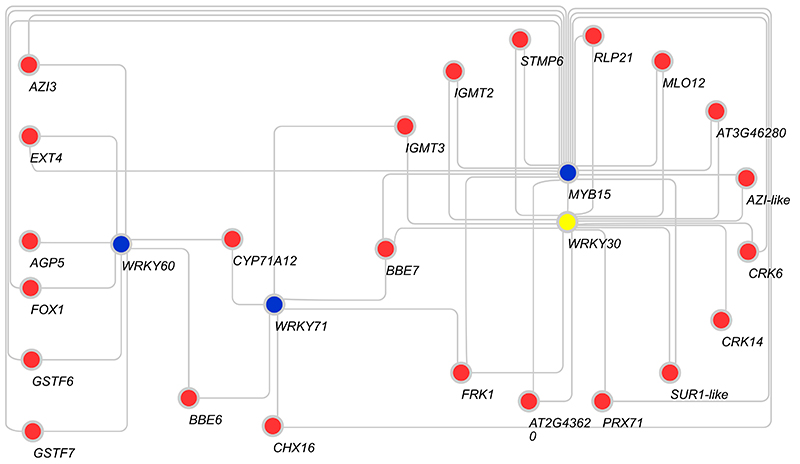
In terms of signal integration, the GNSR includes three plant receptor genes (CRK6, CRK14 and RLP21). Two additional components of the GNSR, AZI3 and AZIL, are closely related to systemic signaling component AZI150, 51, with identities in their coding sequences of 76 % and 78 %, respectively. We speculate that these two genes might be involved in the systemic coordination of the GNSR in a way analogous to AZI1, which is required for pathogen-induced systemic resistance signaling. Evidence for their involvement in pathogen defense was found by Chassot et al.38, where overexpression of AZI3, as well as AZIL and PRX71, results in increased resistance towards Botrytis cinerea. For more localized signaling, the peptide STMP6 represents an interesting candidate. It is part of a defense associated peptide family39, and its overexpression leads to severely growth delayed phenotypes reminiscent of hyper-immunity lines such as cpr5 52 and snc1 53. A candidate for a key master transcriptional regulator is GNSR member WRKY30, a transcription factor that is co-expressed with 15 out of 24 GNSR genes. In addition, we identified the transcription factors genes WRKY60, WRKY71 and MYB15, which are not part of the GNSR but are co-correlated to it and could be involved in their regulation (Extended Data Fig. 10).
Finally, the microbiome is increasingly coming into focus as an untapped potential for modern agricultural applications54 and the involvement of the GNSR in both biotic and abiotic stress responses55, 56 (Extended Data Fig. 5), further highlights the importance of microbiome-plant interaction studies for future research.
Methods
Plant material and growth conditions
T-DNA insertion lines bbe6 (SALK_054180C), chx16 (SALK_083993C), gstf6 (SALK_065940C), igmt3 (SAIL_679_H07), mlo12 (SAIL_50_C10), at2g43620 (SALK_056680) and prx71 (SALK_123643C) were obtained from the Nottingham Arabidopsis Stock Center (NASC, http://arabidopsis.info/), the bak1-5/bkk1-1 line from Cyril Zipfel40 (University of Zurich, Zurich, Switzerland) the lines for cyp71a12 (GABI_127H03) and fox1 (GABI_813E08) from Elisabeth Sattely (Stanford University, CA, USA)18.
Plants for all experiments were grown in climate controlled growth chambers (CU-41L4, Percival) fitted with full spectrum lights (Philips Alto II 17W/841 for gnotobiotic assays, Philips Master TL-D, 18W/840 for soil assays).
For gnotobiotic assays, surface sterilized (according to Schlesier et. al57) seeds were placed in 24 well cell-culture plates (TPP Techno Plastic Products AG, Switzerland) on full strength Murashige and Skoog (MS) medium agar (Duchefa; pH5.8, including vitamins, 3% w/v sucrose). Plants received a 16 h : 8 h light:dark cycle for the first 7 days and were then switched to a 9 h : 15 h cycle for the remainder of the experiment. All plates were sealed with parafilm for the first 14 d. Growth temperature was maintained at 24°C during light and 22 °C during dark cycles at a relative humidity of 65 %rh.
For soil assays, seeds were surface sterilized (70% ethanol, 1 min), placed on soil (Klasmann-Deilmann GmbH, Substrat 1) and vernalized for 4 days at 4°C in the dark before being placed in a growth chamber. Growth conditions were set to a 11 h : 13 h light : dark cycle at 60 %rh. After 14 d, seedlings were transferred into gardening pots (9x9x9.5 cm), with 4-5 plants per pot.
Bacterial strains and growth conditions
Bacterial strains were selected from the At-LSPHERE collection20 based on their ability to reach high cell-numbers in the phyllosphere. A luxCDABE-tagged, kanamycin and rifampicin resistant Pseudomonas syringae pv. tomato DC3000 (Pst)58 was provided by Thomas Kroj (UMR BGPI, Montpellier, France). All At-LSPHERE strains were grown on R-2A-agar (Sigma-Aldrich) supplemented with 0.5% v/v methanol and allowed to grow for 5d at 22 °C. Pst was grown on King’s B-agar59 for 1-2 d at 22 °C.
Plant inoculation and infection
A sterile plastic loop was used to collect a cell material of each At-LSPHERE strain and cells were re-suspended in 1 ml of 10 mM MgCl2. Tubes containing the resuspended strains were vortexed for 5 min and adjusted to an optical density (OD600) of roughly 0.02 for inoculation. Axenic, 10 d old plants were inoculated with 10 μL of bacterial suspension by pipetting. Axenic control plants were mock-inoculated with 10 μL of 10 mM MgCl2.
Pst for infection was obtained by re-suspending cell material in 10 mL of 10 mM MgCl2 and adjusting the concentration to OD600 = 0.1 in 10 mM MgCl2 supplemented with 0.04% v/v Silwet L-77 (Chemtura AgroSolutions).
For infection of soil grown plants, the pathogen suspension was applied to 5 week old plants by spray inoculation (until “run-off’) using a perfume-dispenser. Control plants were mock-infected with 10 mM MgCl2 supplemented with 0.04% v/v Silwet L-77.
Harvest of plant material for transcriptomics and metabolomics
For each condition, 24 single plants per biological replicate were harvested 9 d after inoculation (plant age: 19 d) by removing the rhizosphere from the phyllosphere using flame sterilized scalpels and forceps and shock-freezing only the phyllosphere in liquid nitrogen. The 24 plants were pooled, six plants each in 5 mL screw cap tubes (Sarstedt AG, Switzerland) containing two 5 mm stainless-steel beads (QIAGEN) and stored at -80 °C. Plants not harvested for the OMICs experiments were used for bacterial enumeration and to verify the gnotobiotic status of the batch as described previously21 by leaf washing in phosphate buffer (pH 7, 100 mM) with added surfactant (Silwet L-77, 0.2% v/v). If no contaminations were found, tubes containing material from the same inoculation condition were pooled again to create one biological replicate consisting of up to 24 plants. Five independent biological experiments were performed.
Harvest for bacterial enumeration from soil-grown plants
Two mature rosette leaves of five-week-old plants were harvested to create one replicate. In total, a minimum of 12 technical replicates per condition were harvested. The leaves were separated using a scalpel and the bacteria were retrieved by leaf washing as described above. For enumeration of native soil bacteria, plant material was instead homogenized by bead beating (5mm stainless steel beads, QIAGEN) in phosphate buffer (pH 7, 100 mM) with a QIAGEN TissueLyser II for 10 s at 30 hz. The leaf wash or homogenized tissue was plated as a dilution series (100 – 10-8) on either R-2A-agar plates containing cycloheximide (50 ng/mL), rifampicin (50ng/mL) and kanamycin (50 ng/mL) for Pst or R-2A-agar with 0.2% methanol and cycloheximide for native bacteria. Plates were incubated at room temperature and colony-forming units were counted 2-5d after harvest.
To discern differences in susceptibility to Pst between infected wild-type (Col-0) and mutant plants, a linear model was fitted on genotype and log10-transformed cell-numbers (lm, R 3.5.1). The resulting p-values of the summary statistic were adjusted for multiple comparisons by Bonferroni p-value correction.
RNA sequencing
RNA was prepared from frozen plant material using the Zymo Quick-RNA Plant kit. The RNA quality was verified on an Agilent TapeStation System using the RNA ScreenTape Analysis kit. Poly-A enriched libraries were prepared using the Illumina TruSeq RNA sample prep kit. RNA sequencing was performed on an Illumina NovaSeq with 100 cycles of single-end sequencing (100 bp) using the TruSeq SBS Kit v3-HS. The processing of fluorescent images into sequences, base-calling and quality value calculations were performed using the Illumina data processing pipeline. The resulting raw reads were cleaned by removing adapter sequences, low-quality-end trimming, and removal of low-quality reads (phred score < 20). Sequence alignment of the resulting reads to the Arabidopsis reference genome (TAIR10) and quantification of gene level expression was carried out using RSEM60. With the exception of the RNA preparation, all steps were performed by the Functional Genomics Center Zurich (https://fgcz.ch/).
Differential gene expression analysis
Genes with > 0.5 counts per million in > 4 samples were used for differential expression analysis using the Bioconductor R package edgeR (v.3.22.1)61. Counts were normalized by trimmed mean of M values method (TMM). The gene-wise dispersions were estimated by Cox–Reid approximate conditional maximum-likelihood. To shrink the dispersions towards trended values based on expression levels, we used an empirical Bayes procedure. The differential expressions were calculated using likelihood ratio tests on a fitted generalized linear model (glm) while considering batch-effect, using the appropriate contrasts62.
Genes showing an absolute fold change (FC) > 2 with a false discovery rate (FDR, Benjamini-Hochberg p-value correction method) < 0.01 were considered as differentially expressed. For heat-maps, log2 FCs (log2FC) of differentially expressed genes (DEGs) were used.
GNSR genes were subjected to functional enrichment analysis in the category “Biological Process” using AgriGO2v263 against Arabidopsis with TAIR genome locus (TAIR10) as reference. Results were valued by Fisher test, adjusted for multiple testing according to Yekultieli, and subsequently filtered by significance (FDR < 0.05) for a minimal number of mapping entries of five.
To search for other treatments that resulted in an upregulation of GNSR genes, all 24 genes were subjected to Genevestigator’s “perturbation” search. This tool searches curated, high-quality data sets for matches to user queries. Results from both micro-array and RNA sequencing experiments were used. Data from both methods was subsequently filtered fold-change and p-value (Micro-array: |FC| > 1.5, p-value < 0.001, RNAseq: |FC| > 2, p-value < 0.01)
To determine the predictive power of single genes for the intensity of the plant’s overall response, a linear model was fitted on the number of DEGs in each condition against the log2FC of each individual gene. Only genes that were differentially regulated in at least 5 out of 39 conditions were used. To remove noise, fold-changes below log2(1.25) or with FDRs > 0.01 were set to 0. The resulting R2 values were adjusted by Wherry’s method.
Metabolite extraction
An approximate volume of 20 μL of ground, frozen plant material was lyophilized for 24h to dryness and the resulting plant dry-weight (PDW) determined. To extract the metabolites, 800 μL of a chilled (4°C) 80:20 methanol/water solution was added to each sample and homogenized with a QIAGEN TissueLyser II at 20 Hz for 1 min. After homogenization, the samples were heat-treated at 65°C for 10 min on a heated rotary shaker. The samples were pelleted by centrifugation and the extract (supernatant) transferred into a fresh tube. The finished extract was diluted to a final concentration of 0.5 μg*μL−1 (dry weight per volume) with the buffer solution required for the respective liquid chromatography (LC) method.
LC-MS analysis
LC separation was performed with a Thermo Ultimate 3000 UHPLC system (Thermo Scientific, CA) applying two different separation methods. Hydrophilic interaction (HILIC) based separation was carried out using an Aquity UHPLC BEH Amide column (100 x 2.1 mm, 1.7 μm particle sizes, Waters, Milford, MA, USA) as described previously64, at a flow rate of 500 μL min-1. C18 reversed phase (RP) separation was achieved using a Kinetex XB-C18 column (particle size 1.7 μm, pore size 100 Å; dimensions 50 mm x 2.1 mm, Phenomenex). Briefly, solvent A was 0.1% (v/v) formic acid and solvent B was acetonitrile at a flow rate of 400 μL*min−1. Solvent B was varied as follows: 0 min, 1 %; 7.5 min, 95%; 10 min, 95%; subsequently, the column was equilibrated for 3 min at the initial conditions prior to the next sample analysis. For untargeted analysis, LC instrument was hyphenated to an LTQ Orbitrap XL mass spectrometer (Thermo Fisher Scientific, Waltham, MA, USA). MS analysis was carried out in positive (HILIC, C18RP) and negative FTMS mode (HILIC) at mass resolution of 30’000 (m/z = 400). Targeted and tandem mass analysis were carried out with a Thermo QExactive plus instrument (Thermo Fisher Scientific, Waltham, MA, USA) at mass resolution of 35’000 (m/z = 200). A ramped collision energy of 15, 30 and 45 eV was applied in all tandem MS experiments applying high energy C-trap collision dissociation. For both instrument the same heated ESI probe was used applying following LC method dependent source parameters (first value: HILIC, second value C18-RP): vaporizer temperature, (350, 380)°C, ; aux gas, (20, 5); ion spray voltage, (+3.5, + 2.75) kV. Ion spray voltage in the negative FTMS mode was set to -3.0 kV. For both LC methods, following parameters were set to identical values: sheath gas, 50; sweep gas, 0; RF level, 50.0; capillary temperature, 275°C. Lastly, injected sample amount on columns was adapted to instrument sensitivity. 2.5 μg PDW equivalent was injected when using the LTQ Orbitrap instrument and 0.6 μg PDW when QExactive plus was used.
LC-MS data analysis
Raw files were processed using an untargeted LC-MS data analysis workflow implemented in the Python based emzed2 framework (http://emzed.ethz.ch/). In a first step, individual peak libraries were constructed for each acquisition mode (same LC-method and electro spray ionization (ESI)-mode). Briefly, after individual subtraction of blank measurements from samples, LC-MS peaks were detected and extracted sample-wise using the emzed2 implemented Metabo Feature Finder from OpenMS65. Individual peaks of all samples were grouped based on instrument specific tolerance levels by their m/z and retention time (RT) values into unique consensus peaks and unique peak id (pID) was assigned, where each peak was represented by its mean m/z and RT value. Since compound elemental composition and applied ESI result in a multitude of signals, peak deconvolution was required. To this end, consensus peaks were further grouped by isotopologues (consensus feature IDs, fID) and subsequently, by adducts (adduct IDs, aID) taking into account peak RTs and their specific m/z differences.
Next, we merged the individual consensus libraries and further grouped adducts measured with the same LC-Method in positive and negative ESI mode based on RT and specific adduct m/z differences into cross-referring IDs (crid, used as continuous numbering system, indicated by bold numbers). To reduce the number of low quality entries, we removed all features on the crid level that were not detected in at least 4/5 biological replicates in at least one treatment. Remaining crid were used to perform a targeted peak extraction on samples with missing values to update missing at random “MAR” peaks (peaks missed by feature finding algorithm). In case of complete absence (MNAR), random values were assigned from a Gaussian distribution using mean and standard values determined from sample-specific spectral baseline and noise. Finally, to each crid monoisotopic mass value(s) were assigned and crid were grouped by their masses and to each mass a unique massID was assigned to simplify database searching and possible compound overlaps between applied LC-Methods. The resulting mass library was used to search publically available databases (KEGG66–68, PubChem69, PMN70) to identify compounds with matching monoisotopic mass. Manual curation was used to eliminate unlikely data base matches.
Next, averaged group area (weighted by individual peak area) were calculated for each crid and treatment. Prior to averaging, peak areas were normalized to their individual sample total ion current (TIC) area. Normalization to biomass was not required since all samples were diluted to the same biomass concentration prior to analysis. Differential analysis was performed by comparing the weighted average group area of crids in a treatment against those in axenic control plants (Student’s t-test, Benjamini-Hochberg p-value correction) and filtering for significant changes (|log2FC| > 2, FDR < 0.05).
Correlation analysis
Gene expression count data was normalized in R 3.5.1 with the libraries edgeR 3.24.3 (ref61) and limma 3.38.3 (ref71). Spearman correlation values were calculated for each pair of genes between their normalized expression counts across all samples. Spearman was the preferred method as it was observed that many genes showed distinct ‘on’ or ‘off’ states that produced misleading Pearson correlation values corresponding to the correlation of only the two states. Similarly, Spearman correlation values were calculated between each gene-metabolite pair between the normalized expression count and log2-normalized crid area respectively.
Network Construction
For each WRKY gene, the two highest correlating genes above a cutoff of 0.85 were identified as WRKY targets. A network was constructed using the R library igraph 1.2.4.1 (ref72) with edges between each WRKY target and the two highest correlating metabolites above a cutoff of 0.85. Two additional networks were constructed in the same way with edges between GNSR genes and metabolites, and between GNSR genes and WRKY genes. All networks were exported to graphml format for manipulation in Cytoscape 3 (ref73).
Ordination
Both datasets, gene expression count data and metabolite count data, were reduced to the 2000 genes and 1000 metabolites with the highest variance across all other samples. If all genes or metabolites were included, downstream calculations became numerically unstable, which we assume was due to sensitivity to the large number of zeroes in the data. For each dataset, each condition was paired with the first set of five control samples and principal component analysis (PCA) was used to determine the transformed axes that explained the most variance in the data. The data was then tested for effect size and significance using PERMANOVA, via the adonis function of the R library vegan 2.5-674. A second set of ordinations was created for each dataset on all sample conditions together using PCA and multidimensional scaling of the Euclidean distance matrix between samples – a principal coordinate analysis – via the vegdist and monoMDS functions of vegan.
Secondary structure elucidation
Data generated from MS2 was filtered to obtain the most intensive fragment spectra peaks for each compound of interest. Information about parent ion properties, such as predicted adducts and isotope patterns were added to create files compatible with downstream analysis techniques (.ms ITS40 instrument data format or .mgf Mascot generic format) (Supplementary Information Tab. 6-16).
Based on this data, we created fragmentation trees with SIRIUS 4.0.1 (https://bio.informatik.unijena.de/software/sirius/ 75, 76) and compared MS/MS spectra to public databases using the SIRIUS included CSI:FingerID tool77 and the Global Natural Products Social Molecular Networking platform78 (GNPS, https://gnps.ucsd.edu/ProteoSAFe/static/gnps-splash.jsp) as well as databases PubChem69 and MONA (https://mona.fiehnlab.ucdavis.edu/). Identical structures found in different LC-Methods or ionization modes were grouped under the name of the lower-number crid. These are 1168 (365), 1227 (380) and 1199 (383).
Extended Data
Extended Data Figure 1. Phenotype of Arabidopsis inoculated with the 39 bacterial strains.
Representative phenotypes of 3-week-old Arabidopsis wild type plants (Col-0), 9 days after inoculation with individual bacterial strains.
Extended Data Figure 2. Cluster analysis of DEGs and DAMs of Arabidopsis in response to bacterial treatments.
a-b, Heat-maps of total DEGs (|log2FC| > 1. FDR < 0.01) (a) and DAMs (|log2FC| > 1, FDR < 0.05) (b). Strains and DEGs/DAMs are clustered using Ward’s method. Top color bars indicate phylogeny. c-d, Principle component analysis (PCA) plot depicting distances based on gene expression counts (for DEGs) or metabolite areas under the curve (for DAMs). Colors represent bacterial phyla/classes. Selected treatments are annotated with strain name and replicate number. Data from five independent biological replicates (R1-R5), each representing 18-24 plants.
Extended Data Figure 3. Correlation between phyllosphere colonization and host response intensity.
a-c, Linear regression of cfu*gfw−1 against nDEGs or nDAMs and nDEGs against nDAMs in the respective conditions. Axis scaled to log10 for improved readability. Dots are annotated by the strain used in the treatment. Colors represent bacterial phyla/class analogous to Fig. S2. Coefficients of variation from the linear regression (R2) value and Spearman’s ranked correlation values (ρ) are provided. Data from five independent biological replicates, each representing 18-24 plants.
Extended Data Figure 4. Hierarchy heat-map of DAMs.
Sorted heat-maps of total DAMs (log2FC < 1, FDR < 0.05). Conditions were sorted by strains causing the weakest to strongest host-response based on the number of DAMs (x-axis, left to right) and amount of times a metabolite feature was differentially regulated from most frequent to least frequent (y-axis, top to bottom). Top color bars indicate bacterial phyla/classes analogous to Extended Data Fig. 2. Data from five independent biological replicates, each representing 18-24 plants.
Extended Data Figure 5. Genevestigator analysis of GNSR genes.
Selected query results for GNSR genes in Genevestigator category “Perturbations’. Names adjusted to match names used in this study a, Results for mRNA seq datasets from various experiments (|FC| > 2, p-value < 0.01)) for biotic, chemical, hormonal, nutritional, photoperiod, temperature or other abiotic perturbations. b, Results for microarray datasets from various experiments (|FC| > 1.5, p-value < 0.001) for biotic, chemical, elicitor, light intensity, nutritional and other abiotic stress perturbations.
All p-values were computed by two-sided t-test implemented in limma (for micro-array data) and by Voom’s algorithm (two-sided) for RNAseq data and are adjusted by Benjamini-Hochberg in order to compute the threshold under which the p-values are considered sufficiently small22 (https://genevestigator.com/userdocs/manual/GENEVESTIGATOR_UserManual.pdf).
Extended Data Figure 6. Functional enrichment and subcellular location analysis.
Analysis of subcellular locations using SUBA4 prediction scores (left, colored) and summarized associated GO analysis of GNSR genes based on AgriGO2 functional enrichment (right, grey).
Extended Data Figure 7. Tryptophan-derived secondary metabolism in Arabidopsis.
Simplified version of the TDSM with the three main branches, important intermediates and enzymes. GNSR genes are highlighted in green, genes homologous to GNSR genes are highlighted in yellow.
Extended Data Figure 8. Targeted metabolomics on the cyp71a12 mutant.

Heat-map of log2-transformed metabolite fold-changes in the cyp71a12 mutant against the respective wild-type conditions. Only changes in 349, 365 and 383 are significant (two-sided t-test, Benjamini-Hochberg adjusted p-value < 0.05). Data from ten technical replicates, each representing 1 plant.
Extended Data Figure 9. Phyllosphere colonization by bacteria native to the potting soil used in this experiment.
a, Median cfu*gfw−1 with 95% confidence interval of 30 different plants (n = 30) in one experiment. b, Representative picture of bacterial colonies extracted from leaves, grown on R2-A agar with 0.5% (v/v) methanol and supplemented with cycloheximide to prevent fungal growth.
Extended Data Figure 10. Gene expression correlation of GNSR and transcription factor encoding genes.
Network graph showing significant, positive correlations (Spearman correlation, ρ ≥ 0.85, best two correlations) between GNSR genes and transcription factors of the defense associated MYB and WRKY families. GNSR genes are displayed in red, transcription factor genes in blue. WRKY30 in yellow as it is both a GNSR and a transcription factor gene.
Supplementary Material
Acknowledgements
We thank Cyril Zipfel, Wilhelm Gruissem and Clara Sánchez-Rodríguez for helpful discussions and Andre Imboden for reproduction of plant lines. We thank Elisabeth Sattely for providing the cyp71a12 and fox1 mutant lines. We also than Lennart Opitz and Catharine Aquino Fournier from the Functional Genomics Center Zurich (FGCZ) for their work on the RNAseq part of the experiment. This work was funded through a European Research Council Advanced Grant (PhyMo; no. 668991), ETH Zurich, a grant from the German Research Foundation (DECRyPT, no. SPP2125) and the NCCR Microbiomes, funded by the Swiss National Science Foundation.
Footnotes
Author contributions
B. A.M., C.M.V. and J.A.V. designed the study; B.A.M. led and conducted the experimental work; P.K. designed the metabolomics pipeline; P.K. and C.M.F carried out OMICs raw data analysis; B.A.M., C.M.F. and S.S. performed the data analysis; L.H., M.B., B.E. and M.S. contributed to the generation of the plant material for the transcriptomics and metabolomics experiments; S.P. helped with the design of the pathogen assays; B.A.M. and J.A.V. wrote the manuscript with input from all authors.
The authors declare no competing interests.
Data availability
Transcriptomics raw data is available at the European Bioinformatics Institute (EBI) under the following identifier: EBI PRJEB40488. Metabolomics raw data, together with relevant metadata is available at: Metabolights79 under the following identifier: MTBLS2522. Source data are provided with this paper. Code availability The code used in the analysis of the data can be found in the following repositories. The scripts for RNA-seq raw data analysis according to the standard operating procedure of the (FGCZ) is availible at their GitHub repository: https://github.com/uzh/ezRun. The code used for Mmetabolomics raw data analysis based on the in-house pipeline can be found at: https://gitlab.ethz.ch/emzed2-plant-metabolomics-workflows. The scripts for all major downstream Downstream data processing/figure generation are available at the projects GitLab repository: https://gitlab.ethz.ch/emzed2-plant-metabolomics-workflows.
References
- 1.Vorholt JA. Microbial life in the phyllosphere. Nat Rev Microbiol. 2012;10:828–840. doi: 10.1038/nrmicro2910. [DOI] [PubMed] [Google Scholar]
- 2.Lindow SE, Brandl MT. Microbiology of the phyllosphere. Appl Environ Microbiol. 2003;69:1875–1883. doi: 10.1128/AEM.69.4.1875-1883.2003. [DOI] [PMC free article] [PubMed] [Google Scholar]
- 3.Müller DB, Vogel C, Bai Y, Vorholt JA. The plant microbiota: systems-level insights and perspectives. Annu Rev Genet. 2016;50:211–234. doi: 10.1146/annurev-genet-120215-034952. [DOI] [PubMed] [Google Scholar]
- 4.Hacquard S, Spaepen S, Garrido-Oter R, Schulze-Lefert P. Interplay between innate immunity and the plant microbiota. Annu Rev Phytopathol. 2017;55:565–589. doi: 10.1146/annurev-phyto-080516-035623. [DOI] [PubMed] [Google Scholar]
- 5.Ditt RF, et al. The Arabidopsis thaliana transcriptome in response to Agrobacterium tumefaciens . Mol Plant Microbe Interact. 2006;19:665–681. doi: 10.1094/MPMI-19-0665. [DOI] [PubMed] [Google Scholar]
- 6.Thilmony R, Underwood W, He SY. Genome-wide transcriptional analysis of the Arabidopsis thaliana interaction with the plant pathogen Pseudomonas syringae pv. tomato DC3000 and the human pathogen Escherichia coli O157:H7. Plant J. 2006;46:34–53. doi: 10.1111/j.1365-313X.2006.02725.x. [DOI] [PubMed] [Google Scholar]
- 7.Verhagen BW, et al. The transcriptome of rhizobacteria-induced systemic resistance. Arabidopsis Mol Plant Microbe Interact. 2004;17:895–908. doi: 10.1094/MPMI.2004.17.8.895. [DOI] [PubMed] [Google Scholar]
- 8.van de Mortel JE, et al. Metabolic and transcriptomic changes induced in Arabidopsis by the rhizobacterium Pseudomonas fluorescens SS101. Plant Physiol. 2012;160:2173–2188. doi: 10.1104/pp.112.207324. [DOI] [PMC free article] [PubMed] [Google Scholar]
- 9.Vogel C, Bodenhausen N, Gruissem W, Vorholt JA. The Arabidopsis leaf transcriptome reveals distinct but also overlapping responses to colonization by phyllosphere commensals and pathogen infection with impact on plant health. New Phytol. 2016;212:192–207. doi: 10.1111/nph.14036. [DOI] [PubMed] [Google Scholar]
- 10.D’Auria JC, Gershenzon J. The secondary metabolism of Arabidopsis thaliana: growing like a weed. Curr Opin Plant Biol. 2005;8:308–316. doi: 10.1016/j.pbi.2005.03.012. [DOI] [PubMed] [Google Scholar]
- 11.Sato F. Encyclopedia of Life Sciences (ELS) 2014 [Google Scholar]
- 12.Huang AC, et al. A specialized metabolic network selectively modulates Arabidopsis root microbiota. Science. 2019;364 doi: 10.1126/science.aau6389. [DOI] [PubMed] [Google Scholar]
- 13.Voges M, Bai Y, Schulze-Lefert P, Sattely ES. Plant-derived coumarins shape the composition of an Arabidopsis synthetic root microbiome. Proc Natl Acad Sci USA. 2019;116:12558–12565. doi: 10.1073/pnas.1820691116. [DOI] [PMC free article] [PubMed] [Google Scholar]
- 14.Badri DV, Chaparro JM, Zhang R, Shen Q, Vivanco JM. Application of natural blends of phytochemicals derived from the root exudates of Arabidopsis to the soil reveal that phenolic-related compounds predominantly modulate the soil microbiome. J Biol Chem. 2013;288:4502–4512. doi: 10.1074/jbc.M112.433300. [DOI] [PMC free article] [PubMed] [Google Scholar]
- 15.Pastorczyk M, et al. The role of CYP71A12 monooxygenase in pathogen-triggered tryptophan metabolism and Arabidopsis immunity. New Phytol. 2020;225:400–412. doi: 10.1111/nph.16118. [DOI] [PubMed] [Google Scholar]
- 16.Clay NK, Adio AM, Denoux C, Jander G, Ausubel FM. Glucosinolate metabolites required for an Arabidopsis innate immune response. Science. 2009;323:95–101. doi: 10.1126/science.1164627. [DOI] [PMC free article] [PubMed] [Google Scholar]
- 17.Schlaeppi K, Abou-Mansour E, Buchala A, Mauch F. Disease resistance of Arabidopsis to Phytophthora brassicae is established by the sequential action of indole glucosinolates and camalexin. Plant J. 2010;62:840–851. doi: 10.1111/j.1365-313X.2010.04197.x. [DOI] [PubMed] [Google Scholar]
- 18.Rajniak J, Barco B, Clay NK, Sattely ES. A new cyanogenic metabolite in Arabidopsis required for inducible pathogen defence. Nature. 2015;525:376–379. doi: 10.1038/nature14907. [DOI] [PMC free article] [PubMed] [Google Scholar]
- 19.Nongbri PL, et al. Indole-3-acetaldoxime-derived compounds restrict root colonization in the beneficial interaction between Arabidopsis roots and the endophyte Piriformospora indica . Mol Plant Microbe Interact. 2012;25:1186–1197. doi: 10.1094/MPMI-03-12-0071-R. [DOI] [PubMed] [Google Scholar]
- 20.Bai Y, et al. Functional overlap of the Arabidopsis leaf and root microbiota. Nature. 2015;528:364–369. doi: 10.1038/nature16192. [DOI] [PubMed] [Google Scholar]
- 21.Vogel C, Innerebner G, Zingg J, Guder J, Vorholt JA. Forward genetic in planta screen for identification of plant-protective traits of Sphingomonas sp. strain Fr1 against Pseudomonas syringae DC3000. Appl Environ Microbiol. 2012;78:5529–5535. doi: 10.1128/AEM.00639-12. [DOI] [PMC free article] [PubMed] [Google Scholar]
- 22.Hruz T, et al. Genevestigator v3: a reference expression database for the meta-analysis of transcriptomes. Adv Bioinformatics. 2008;2008:420747. doi: 10.1155/2008/420747. [DOI] [PMC free article] [PubMed] [Google Scholar]
- 23.Bethke G, et al. Arabidopsis PECTIN METHYLESTERASEs contribute to immunity against Pseudomonas syringae . Plant Physiol. 2014;164:1093–1107. doi: 10.1104/pp.113.227637. [DOI] [PMC free article] [PubMed] [Google Scholar]
- 24.Maekawa T, Kracher B, Vernaldi S, Ver Loren van Themaat E, Schulze-Lefert P. Conservation of NLR-triggered immunity across plant lineages. Proc Natl Acad Sci USA. 2012;109:20119–20123. doi: 10.1073/pnas.1218059109. [DOI] [PMC free article] [PubMed] [Google Scholar]
- 25.Liu S, Kracher B, Ziegler J, Birkenbihl RP, Somssich IE. Negative regulation of ABA signaling by WRKY33 is critical for Arabidopsis immunity towards Botrytis cinerea 2100. Elife. 2015;4:e07295. doi: 10.7554/eLife.07295. [DOI] [PMC free article] [PubMed] [Google Scholar]
- 26.Hacquard S, et al. Survival trade-offs in plant roots during colonization by closely related beneficial and pathogenic fungi. Nat Commun. 2016;7:11362. doi: 10.1038/ncomms11362. [DOI] [PMC free article] [PubMed] [Google Scholar]
- 27.Hiruma K, et al. Root endophyte Colletotrichum tofieldiae confers plant fitness benefits that are phosphate status dependent. Cell. 2016;165:464–474. doi: 10.1016/j.cell.2016.02.028. [DOI] [PMC free article] [PubMed] [Google Scholar]
- 28.Stotz HU, et al. Role of camalexin, indole glucosinolates, and side chain modification of glucosinolate-derived isothiocyanates in defense of Arabidopsis against Sclerotinia sclerotiorum. Plant J. 2011;67:81–93. doi: 10.1111/j.1365-313X.2011.04578.x. [DOI] [PubMed] [Google Scholar]
- 29.Howard BE, et al. High-throughput RNA sequencing of Pseudomonas-infected Arabidopsis reveals hidden transcriptome complexity and novel splice variants. PLoS One. 2013;8:e74183. doi: 10.1371/journal.pone.0074183. [DOI] [PMC free article] [PubMed] [Google Scholar]
- 30.Li B, et al. Phosphorylation of trihelix transcriptional repressor ASR3 by MAP KINASE4 negatively regulates Arabidopsis immunity. Plant Cell. 2015;27:839–856. doi: 10.1105/tpc.114.134809. [DOI] [PMC free article] [PubMed] [Google Scholar]
- 31.Zhan X, et al. An Arabidopsis PWI and RRM motif-containing protein is critical for pre-mRNA splicing and ABA responses. Nat Commun. 2015;6:8139. doi: 10.1038/ncomms9139. [DOI] [PMC free article] [PubMed] [Google Scholar]
- 32.Hooper CM, Castleden IR, Tanz SK, Aryamanesh N, Millar AH. SUBA4: the interactive data analysis centre for Arabidopsis subcellular protein locations. Nucleic Acids Res. 2017;45:D1064–D1074. doi: 10.1093/nar/gkw1041. [DOI] [PMC free article] [PubMed] [Google Scholar]
- 33.Tanz SK, et al. SUBA3: a database for integrating experimentation and prediction to define the SUBcellular location of proteins in Arabidopsis . Nucleic Acids Res. 2013;41:D1185–1191. doi: 10.1093/nar/gks1151. [DOI] [PMC free article] [PubMed] [Google Scholar]
- 34.Hull AK, Vij R, Celenza JL. Arabidopsis cytochrome P450s that catalyze the first step of tryptophan-dependent indole-3-acetic acid biosynthesis. Proc Natl Acad Sci USA. 2000;97:2379–2384. doi: 10.1073/pnas.040569997. [DOI] [PMC free article] [PubMed] [Google Scholar]
- 35.Muller TM, Bottcher C, Glawischnig E. Dissection of the network of indolic defence compounds in Arabidopsis thaliana by multiple mutant analysis. Phytochemistry. 2019;161:11–20. doi: 10.1016/j.phytochem.2019.01.009. [DOI] [PubMed] [Google Scholar]
- 36.Glawischnig E. Camalexin. Phytochemistry. 2007;68:401–406. doi: 10.1016/j.phytochem.2006.12.005. [DOI] [PubMed] [Google Scholar]
- 37.Wei G, Shirsat AH. Extensin over-expression in Arabidopsis limits pathogen invasiveness. Mol Plant Pathol. 2006;7:579–592. doi: 10.1111/j.1364-3703.2006.00363.x. [DOI] [PubMed] [Google Scholar]
- 38.Chassot C, Nawrath C, Metraux JP. Cuticular defects lead to full immunity to a major plant pathogen. Plant J. 2007;49:972–980. doi: 10.1111/j.1365-313X.2006.03017.x. [DOI] [PubMed] [Google Scholar]
- 39.Yu Z, et al. The Brassicaceae-specific secreted peptides, STMPs, function in plant growth and pathogen defense. JIntegr Plant Biol. 2019 doi: 10.1111/jipb.12817. [DOI] [PubMed] [Google Scholar]
- 40.Roux M, et al. The Arabidopsis leucine-rich repeat receptor-like kinases BAK1/SERK3 and BKK1/SERK4 are required for innate immunity to hemibiotrophic and biotrophic pathogens. Plant Cell. 2011;23:2440–2455. doi: 10.1105/tpc.111.084301. [DOI] [PMC free article] [PubMed] [Google Scholar]
- 41.Teixeira PJP, Colaianni NR, Fitzpatrick CR, Dangl JL. Beyond pathogens: microbiota interactions with the plant immune system. Curr Opin Microbiol. 2019;49:7–17. doi: 10.1016/j.mib.2019.08.003. [DOI] [PubMed] [Google Scholar]
- 42.Lebeis SL. The potential for give and take in plant-microbiome relationships. Front Plant Sci. 2014;5:287. doi: 10.3389/fpls.2014.00287. [DOI] [PMC free article] [PubMed] [Google Scholar]
- 43.Hu FP, Young JM. Biocidal activity in plant pathogenic Acidovorax, Burkholderia, Herbaspirillum, Ralstonia and Xanthomonas spp. J Appl Microbiol. 1998;84:263–271. doi: 10.1046/j.1365-2672.1998.00340.x. [DOI] [PubMed] [Google Scholar]
- 44.van der Wolf J, De Boer SH. In: Principles of plant-microbe interactions: Microbes for sustainable agriculture. Lugtenberg B, editor. Springer International Publishing; Cham: 2015. pp. 65–77. [Google Scholar]
- 45.Bull CT, et al. Comprehensive list of names of plant pathogenic bacteria, 1980-2007. J Plant Pathol. 2010;92:551–592. [Google Scholar]
- 46.Shigeto J, et al. Simultaneously disrupting AtPrx2, AtPrx25 and AtPrx71 alters lignin content and structure in Arabidopsis stem. JIntegr Plant Biol. 2015;57:349–356. doi: 10.1111/jipb.12334. [DOI] [PubMed] [Google Scholar]
- 47.Barth C, Jander G. Arabidopsis myrosinases TGG1 and TGG2 have redundant function in glucosinolate breakdown and insect defense. Plant J. 2006;46:549–562. doi: 10.1111/j.1365-313X.2006.02716.x. [DOI] [PubMed] [Google Scholar]
- 48.Muller TM, et al. TRANSCRIPTION ACTIVATOR-LIKE EFFECTOR NUCLEASE-mediated generation and metabolic analysis of camalexin-deficient cyp71a12 cyp71a13 double knockout lines. Plant Physiol. 2015;168:849–858. doi: 10.1104/pp.15.00481. [DOI] [PMC free article] [PubMed] [Google Scholar]
- 49.Hara M, Yatsuzuka Y, Tabata K, Kuboi T. Exogenously applied isothiocyanates enhance glutathione S-transferase expression in Arabidopsis but act as herbicides at higher concentrations. J Plant Physiol. 2010;167:643–649. doi: 10.1016/j.jplph.2009.11.006. [DOI] [PubMed] [Google Scholar]
- 50.Yu K, et al. A feedback regulatory loop between G3P and lipid transfer proteins DIR1 and AZI1 mediates azelaic-acid-induced systemic immunity. Cell Rep. 2013;3:1266–1278. doi: 10.1016/j.celrep.2013.03.030. [DOI] [PubMed] [Google Scholar]
- 51.Cecchini NM, Steffes K, Schlappi MR, Gifford AN, Greenberg JT. Arabidopsis AZI1 family proteins mediate signal mobilization for systemic defence priming. Nat Commun. 2015;6:7658. doi: 10.1038/ncomms8658. [DOI] [PubMed] [Google Scholar]
- 52.Bowling SA, Clarke JD, Liu Y, Klessig DF, Dong X. The cpr5 mutant of Arabidopsis expresses both NPR1-dependent and NPR1-independent resistance. Plant Cell. 1997;9:1573–1584. doi: 10.1105/tpc.9.9.1573. [DOI] [PMC free article] [PubMed] [Google Scholar]
- 53.Li X, Clarke JD, Zhang Y, Dong X. Activation of an EDS1-mediated R-gene pathway in the snc1 mutant leads to constitutive, NPR1-independent pathogen resistance. Mol Plant Microbe Interact. 2001;14:1131–1139. doi: 10.1094/MPMI.2001.14.10.1131. [DOI] [PubMed] [Google Scholar]
- 54.Schlaeppi K, Bulgarelli D. The plant microbiome at work. Mol Plant Microbe Interact. 2015;28:212–217. doi: 10.1094/MPMI-10-14-0334-FI. [DOI] [PubMed] [Google Scholar]
- 55.El-Esawi MA, Al-Ghamdi AA, Ali HM, Ahmad M. Overexpression of AtWRKY30 transcription factor enhances heat and drought stress tolerance in wheat (Triticum aestivum L.) Genes (Basel) 2019;10 doi: 10.3390/genes10020163. [DOI] [PMC free article] [PubMed] [Google Scholar]
- 56.Scarpeci TE, Zanor MI, Mueller-Roeber B, Valle EM. Overexpression of AtWRKY30 enhances abiotic stress tolerance during early growth stages in Arabidopsis thaliana . Plant Mol Biol. 2013;83:265–277. doi: 10.1007/s11103-013-0090-8. [DOI] [PubMed] [Google Scholar]
- 57.Schlesier B, Breton F, Mock HP. A hydroponic culture system for growing Arabidopsis thaliana plantlets under sterile conditions. Plant Mol Biol Rep. 2003;21:449–456. [Google Scholar]
- 58.Fan J, Crooks C, Lamb C. High-throughput quantitative luminescence assay of the growth in planta of Pseudomonas syringae chromosomally tagged with Photorhabdus luminescens luxCDABE. Plant J. 2008;53:393–399. doi: 10.1111/j.1365-313X.2007.03303.x. [DOI] [PubMed] [Google Scholar]
- 59.King EO, Ward MK, Raney DE. Two simple media for the demonstration of pyocyanin and fluorescin. J Lab Clin Med. 1954;44:301–307. [PubMed] [Google Scholar]
- 60.Li B, Dewey CN. RSEM: accurate transcript quantification from RNA-Seq data with or without a reference genome. BMC Bioinformatics. 2011;12:323. doi: 10.1186/1471-2105-12-323. [DOI] [PMC free article] [PubMed] [Google Scholar]
- 61.Robinson MD, McCarthy DJ, Smyth GK. edgeR: a Bioconductor package for differential expression analysis of digital gene expression data. Bioinformatics. 2010;26:139–140. doi: 10.1093/bioinformatics/btp616. [DOI] [PMC free article] [PubMed] [Google Scholar]
- 62.McCarthy DJ, Chen Y, Smyth GK. Differential expression analysis of multifactor RNA-Seq experiments with respect to biological variation. Nucleic Acids Res. 2012;40:4288–4297. doi: 10.1093/nar/gks042. [DOI] [PMC free article] [PubMed] [Google Scholar]
- 63.Tian T, et al. agriGO v2.0: a GO analysis toolkit for the agricultural community, 2017 update. Nucleic Acids Res. 2017;45:W122–W129. doi: 10.1093/nar/gkx382. [DOI] [PMC free article] [PubMed] [Google Scholar]
- 64.Mulleder M, Bluemlein K, Ralser M. A high-throughput method for the quantitative determination of free amino acids in Saccharomyces cerevisiae by hydrophilic interaction chromatography-tandem mass spectrometry. Cold Spring Harb Protoc. 2017;2017 doi: 10.1101/pdb.prot089094. pdb prot089094. [DOI] [PubMed] [Google Scholar]
- 65.Rost HL, et al. OpenMS: a flexible open-source software platform for mass spectrometry data analysis. Nat Methods. 2016;13:741–748. doi: 10.1038/nmeth.3959. [DOI] [PubMed] [Google Scholar]
- 66.Kanehisa M, Goto S. KEGG: kyoto encyclopedia of genes and genomes. Nucleic Acids Res. 2000;28:27–30. doi: 10.1093/nar/28.1.27. [DOI] [PMC free article] [PubMed] [Google Scholar]
- 67.Kanehisa M, Sato Y, Furumichi M, Morishima K, Tanabe M. New approach for understanding genome variations in KEGG. Nucleic Acids Res. 2019;47:D590–D595. doi: 10.1093/nar/gky962. [DOI] [PMC free article] [PubMed] [Google Scholar]
- 68.Kanehisa M. KEGG bioinformatics resource for plant genomics and metabolomics. Methods Mol Biol. 2016;1374:55–70. doi: 10.1007/978-1-4939-3167-5_3. [DOI] [PubMed] [Google Scholar]
- 69.Kim S, et al. PubChem 2019 update: improved access to chemical data. Nucleic Acids Res. 2019;47:D1102–D1109. doi: 10.1093/nar/gky1033. [DOI] [PMC free article] [PubMed] [Google Scholar]
- 70.Schlapfer P, et al. Genome-wide prediction of metabolic enzymes, pathways, and gene clusters in plants. Plant Physiol. 2017;173:2041–2059. doi: 10.1104/pp.16.01942. [DOI] [PMC free article] [PubMed] [Google Scholar]
- 71.Ritchie ME, et al. limma powers differential expression analyses for RNA-sequencing and microarray studies. Nucleic Acids Research. 2015;43 doi: 10.1093/nar/gkv007. [DOI] [PMC free article] [PubMed] [Google Scholar]
- 72.Csardi G, Nepusz T. The igraph software package for complex network research. InterJournal, complex systems. 2006;1695:1–9. [Google Scholar]
- 73.Shannon P, et al. Cytoscape: a software environment for integrated models of biomolecular interaction networks. Genome Res. 2003;13:2498–2504. doi: 10.1101/gr.1239303. [DOI] [PMC free article] [PubMed] [Google Scholar]
- 74.Oksanen J, et al. Package ‘vegan’. Community ecology package, version. 2013;2:1–295. [Google Scholar]
- 75.Bocker S, Letzel MC, Liptak Z, Pervukhin A. SIRIUS: decomposing isotope patterns for metabolite identification. Bioinformatics. 2009;25:218–224. doi: 10.1093/bioinformatics/btn603. [DOI] [PMC free article] [PubMed] [Google Scholar]
- 76.Bocker S, Duhrkop K. Fragmentation trees reloaded. J Cheminform. 2016;8:5. doi: 10.1186/s13321-016-0116-8. [DOI] [PMC free article] [PubMed] [Google Scholar]
- 77.Duhrkop K, Shen H, Meusel M, Rousu J, Bocker S. Searching molecular structure databases with tandem mass spectra using CSI:FingerID. Proc Natl Acad Sci USA. 2015;112:12580–12585. doi: 10.1073/pnas.1509788112. [DOI] [PMC free article] [PubMed] [Google Scholar]
- 78.Wang M, et al. Sharing and community curation of mass spectrometry data with Global Natural Products Social Molecular Networking. Nat Biotechnol. 2016;34:828–837. doi: 10.1038/nbt.3597. [DOI] [PMC free article] [PubMed] [Google Scholar]
- 79.Haug Kenneth, et al. MetaboLights: a resource evolving in response to the needs of its scientific community. Nucleic acids research. 2020;48(D1):D440–D444. doi: 10.1093/nar/gkz1019. [DOI] [PMC free article] [PubMed] [Google Scholar]
Associated Data
This section collects any data citations, data availability statements, or supplementary materials included in this article.
Supplementary Materials
Data Availability Statement
Transcriptomics raw data is available at the European Bioinformatics Institute (EBI) under the following identifier: EBI PRJEB40488. Metabolomics raw data, together with relevant metadata is available at: Metabolights79 under the following identifier: MTBLS2522. Source data are provided with this paper. Code availability The code used in the analysis of the data can be found in the following repositories. The scripts for RNA-seq raw data analysis according to the standard operating procedure of the (FGCZ) is availible at their GitHub repository: https://github.com/uzh/ezRun. The code used for Mmetabolomics raw data analysis based on the in-house pipeline can be found at: https://gitlab.ethz.ch/emzed2-plant-metabolomics-workflows. The scripts for all major downstream Downstream data processing/figure generation are available at the projects GitLab repository: https://gitlab.ethz.ch/emzed2-plant-metabolomics-workflows.


