Abstract
Immune checkpoint blockade (ICB) of PD-1 and CTLA-4 to treat metastatic melanoma (MM) has variable therapeutic benefit. To explore this in peripheral samples we characterized CD8+ T cell gene expression across a cohort of MM patients receiving anti-PD-1 alone (sICB) or in combination with anti-CTLA-4 (cICB). Whereas CD8+ transcriptional responses to sICB and cICB involve a shared gene set, the magnitude of cICB response is over four-fold greater, with preferential induction of mitosis and interferon related genes. Early samples from patients with durable clinical benefit demonstrated over-expression of T cell receptor (TCR) encoding genes. By mapping TCR clonality we find responding patients have more large clones (those occupying >0.5% of repertoire) post-treatment than non-responding patients or controls, and this correlates with effector memory T cell percentage. Single-cell RNA-sequencing of eight post-treatment samples demonstrates large clones over-express genes implicated in cytotoxicity and characteristic of effector memory T cells including CCL4, GNLY, and NKG7. The six-month clinical response to ICB in MM patients is associated with the large CD8+ T cell clone count 21 days after treatment and agnostic to clonal specificity, suggesting that post-ICB peripheral CD8+ clonality can provide information regarding long-term treatment response and potentially facilitate treatment stratification.
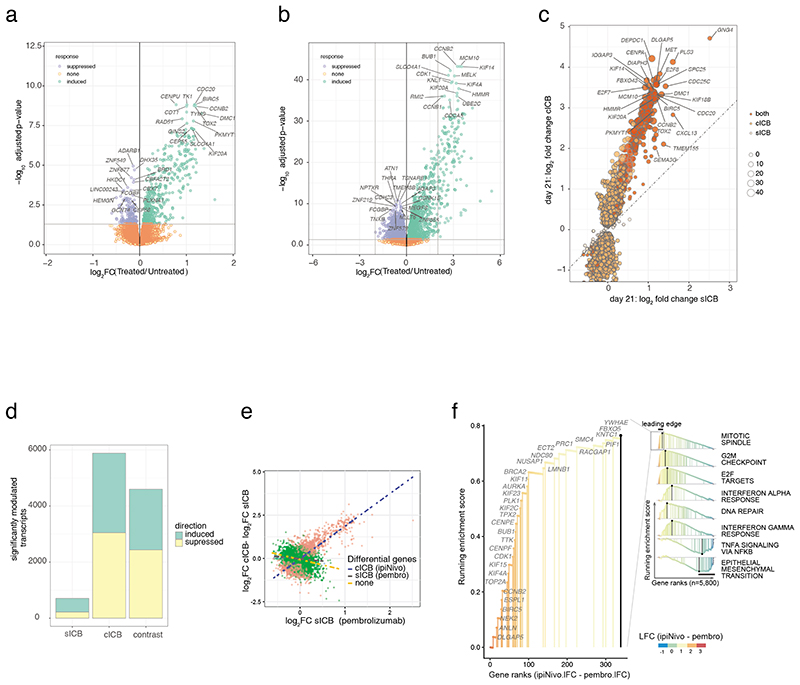
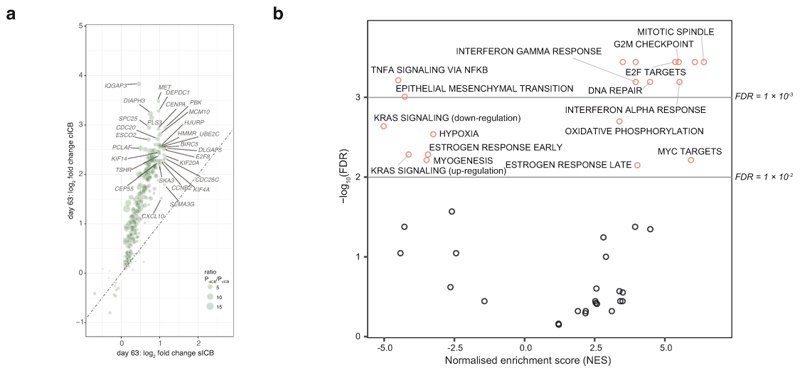
Predictive markers of sensitivity to ICB can be inferred from attributes of the tumour, including mutation burden and infiltrating lymphocytes1–5. However, peripheral markers of on-treatment assessment of efficacy are lacking6–8. Numerous factors independent of the tumour potentially impact the response to ICB9–11. We reasoned large-scale transcriptomic analysis of peripheral immune subsets may identify conserved features of the response to ICB, including markers predictive of clinical outcome. We analysed transcript expression in CD8+ T cells, which play a key role in the immune response to melanoma12, across an initial cohort of 55 patients treated with sICB (n=40) or cICB (n=15, Supplementary Table 1). By comparing baseline expression profiles (day 0) with those post-treatment (day 21) we identified 707 and 5,885 transcripts (FDR<0.05) modulated by sICB and cICB respectively (Figure 1a,b, Supplementary Table 2). Comparing sICB response to cICB response revealed 4,601 transcripts (FDR<0.05) differentially regulated by cICB versus sICB (Figure 1c, Supplementary Table 2) with both treatments almost invariably eliciting the same directional effect, hence regulating a shared geneset, but with a marked difference in effect size (Figure 1d). Most transcriptional changes resolved by the fourth cycle of treatment post-sICB, whereas 877 transcripts remained differentially expressed versus baseline post-cICB (Extended Figure 1a), illustrating cICB leads to a more sustained effect on transcription. Gene set enrichment analysis (GSEA) identified 25 pathways (FDR<0.01) either preferentially upregulated by cICB, such as genes involved in mitotic spindle formation and G2M checkpoint, or downregulated, including TNF signalling via NFκB (Figure 1e,f, Extended Figure 1b), reflecting relatively enhanced cellular proliferation and suppressed inflammation.
Figure 1. Transcriptomic response to ICB.
1a) Transcripts differentially regulated between pre-treatment and 21 days post-sICB (n=40 paired samples, negative binomial Wald test, Benjamini Hochberg corrected P values); 1b) cICB 21 day response (n=15 paired samples, statistics as per a); 1c) log2 fold change effect of sICB (x-axis) versus cICB for all transcripts significantly regulated in either treatment at day 21, size of point indicates – PsICB/PcICB; 1d) summary of transcript number modulated by each treatment and genes differentially expressed comparing the response of cICB to sICB; 1e,1f) Rank based Gene set enrichment analysis of genes significantly more modulated by cICB identifies pathways preferentially induced or suppressed by combination treatment.
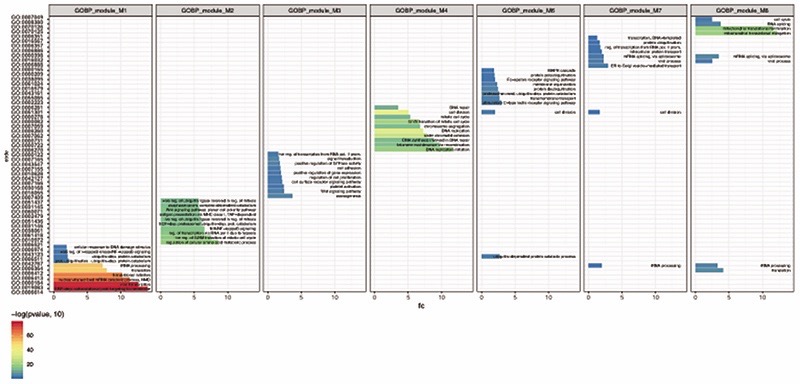
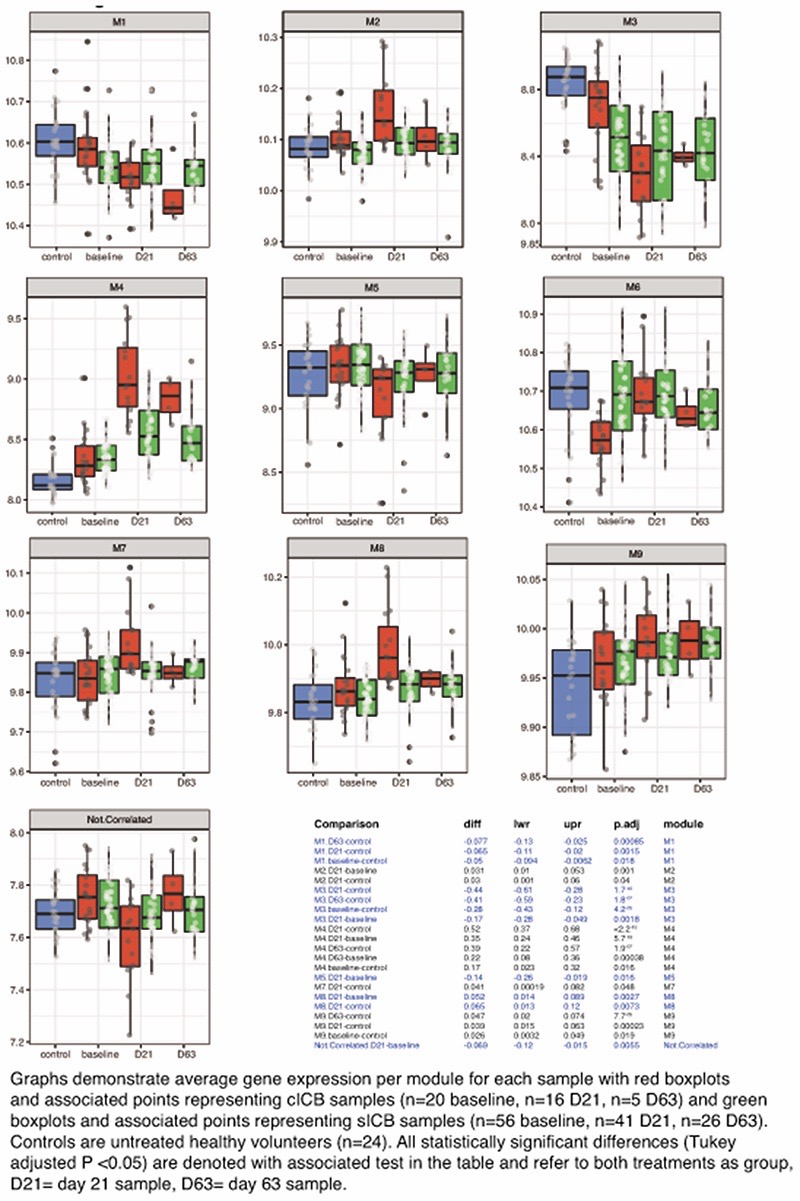
The use of RNA sequencing and the number of paired samples across the cohort significantly advance previous transcriptomic descriptions of ICB response in humans, which have observed few associations robust to multiple-testing correction12–14. To further dissect individual variation in ICB response we performed weighted-gene centric network analysis to identify modules of co-expressed ICB regulated transcripts15,16. This approach resolved nine independently correlated modules (modules M1-M9, Table 3) with specific hub genes, of which seven were highly enriched for genes from 59 distinct pathways annotated using Gene Ontology Biological Processes (GOBP, Extended Figure 2). Notably, for several modules, the average expression significantly differed in pre-treated patients from healthy controls, between treatment types, and across treatment timepoints (Extended Figure 3). Between baseline patient and control samples this difference was most significant in modules M3 and M4, indicating suppression of signal transduction and higher cell division in patient samples respectively, consistent with induction of cell-cycle genes in exhausted T cells in MM patients12. ICB robustly upregulated several modules with larger effects in cICB, foremost of which being M4 and M8, reflecting induction of cell division and mitochondrial translation (Extended Figure 3).
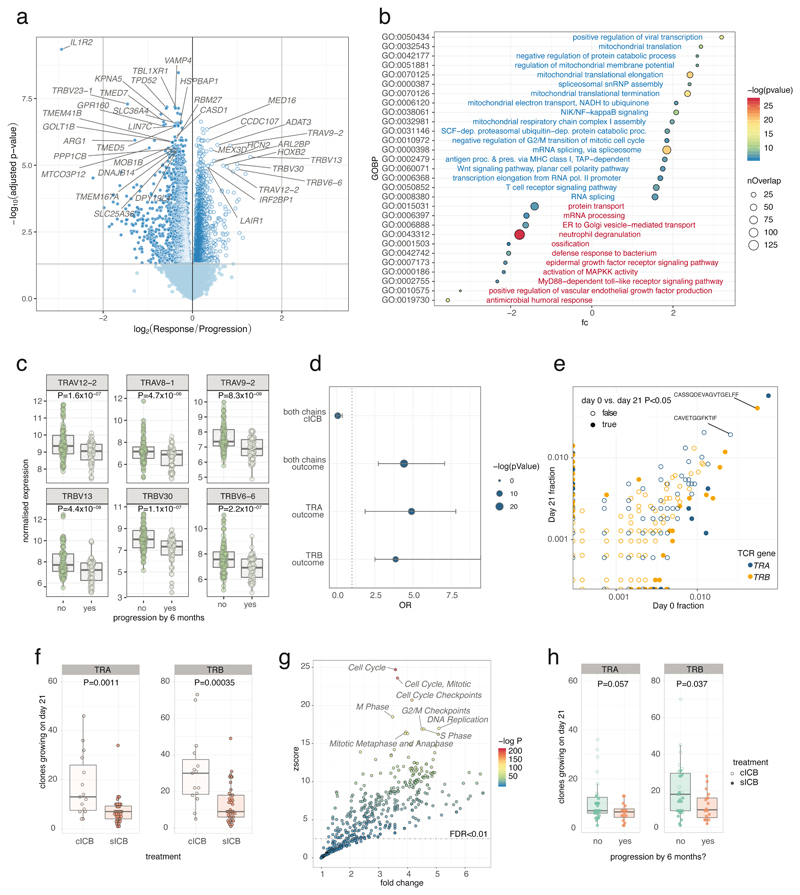
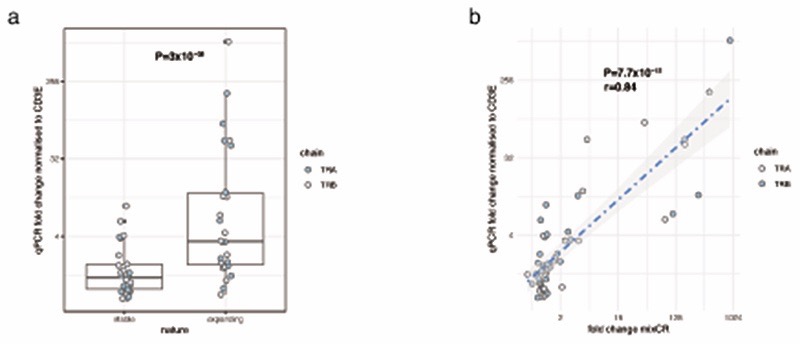
To identify markers potentially informative for response to treatment we performed differential expression analysis on CD8+ cell expression profiles on pre- and post-treatment samples from patients with cutaneous MM (144 samples from 69 patients, 67 pre-treatment and 77 post-treatment), controlling for age, treatment status and dichotomising by six-month clinical outcome. We identified 4,762 transcripts differentially expressed (FDR<0.05) according to six-month outcome (Figure 2a, Supplementary Table 4). Genes associated with ongoing clinical response were distinct to those associated with ICB treatment, and induced pathways included positive regulation of viral transcription, mitochondrial translation, negative regulation of G2/M transition, and T cell receptor (TCR) signalling. Durable clinical response was conversely associated with suppression of numerous pathways including MAPKK activity and Toll-like receptor signalling (Figure 2b). Given the wealth of transcript associations, we determined to define the role of a robustly associated group of genes in depth. We found 34 TRAV and TRBV transcripts, encoding TCR α and β chains, to be over-expressed in responder samples (Figure 2c). Furthermore, TCR encoding genes were significantly over-represented amongst transcripts upregulated in responders, but not by ICB (Odds Ratio 4.4, P=1.4x10⁻⁹, Figure 2d). Thus differential expression of TCR encoding genes is not a generalised response following ICB but instead corresponds with clinical outcome. To further understand this association we mapped unbiased TCR repertoires from RNA-sequencing data using MiXCR17 to identify temporal changes in clonal composition (Figure 2e). We found cICB was associated with more expanding clones on day 21 (Figure 2f); after taking treatment into account there was no association with age (P=0.92) or sex (P=0.18). To validate the accuracy of MiXCR in these samples we performed qPCR of PBMC cDNA from 13 samples with TRA and TRB CDR3 specific primers designed to both stable and expanding clones (total =52, Supplementary Table 5). This supported the MiXCR results, demonstrating a strong correlation between the inferred clonal frequency from RNA sequencing and that derived from qPCR of PBMC (Extended Figure 4). Modelling the transcriptional correlates of expanding clones in treated samples, using the number of expanding clones per sample as a continuous variable, identified 3,502 transcripts associated with clonal growth (Supplementary Table 6). Genes linked to cell division and nucleic acid synthesis dominated those correlated to the number of expanding clones (Figure 2g), validating the measure of clonal expansion by tracking TCR clones.
Figure 2. Identification of transcriptomic correlates of long term response.
2a) Transcripts differentially regulated between responders and progressors with direction showing relative expression in responders (n=144 samples from 69 patients, 67 pre-treatment and 77 post-treatment, negative binomial Wald test, Benjamini Hochberg corrected P values); 2b) GOBP pathway analysis of genes preferentially up-regulated (blue) and down-regulated (red) in responders (hypergeometric test); 2c) Boxplots of the most differentially regulated TCR genes between responders and progressors (144 samples, P values are uncorrected negative binomial Wald test returned from Deseq2); 2d) Results from Fisher’s exact test of enrichment of up-regulated TCR encoding versus all transcripts demonstrating no enrichment of TCR encoding genes in those regulated by cICB, whereas both TRAV and TRBV encoding genes are highly enriched amongst those up-regulated in responders (dotted line: OR=1, error bars represent 95% confidence interval); 2e) representative example of day 0 vs. day 21 clones from one patient showing both chains with filled points representing clones showing significant change in frequency; 2f) number of clones increasing in size (P<0.05) was significantly greater in cICB patients (n= 15 cICB, 30 sICB, two-sided Wilcoxon signed-rank Test); 2g) Reactome pathway analysis of genes positively associated with number of clones growing at day 21 (n=54, d21 samples) demonstrated increase in clone size to be strongly linked to expression of genes involved in mitosis (one-sided hypergeometric of genes correlated with clone growth, Supplementary Table 6); 2h) number of clones growing at day 21 (P<0.05) and outcome at six months (n=49 cutaneous melanoma patients, two-sided Wilcoxon signed-rank Test). Lower and upper hinge of box on boxplots represent 25-75th percentiles, central line the median and the whiskers extend to largest and smallest values no greater than 1.5x interquartile range).
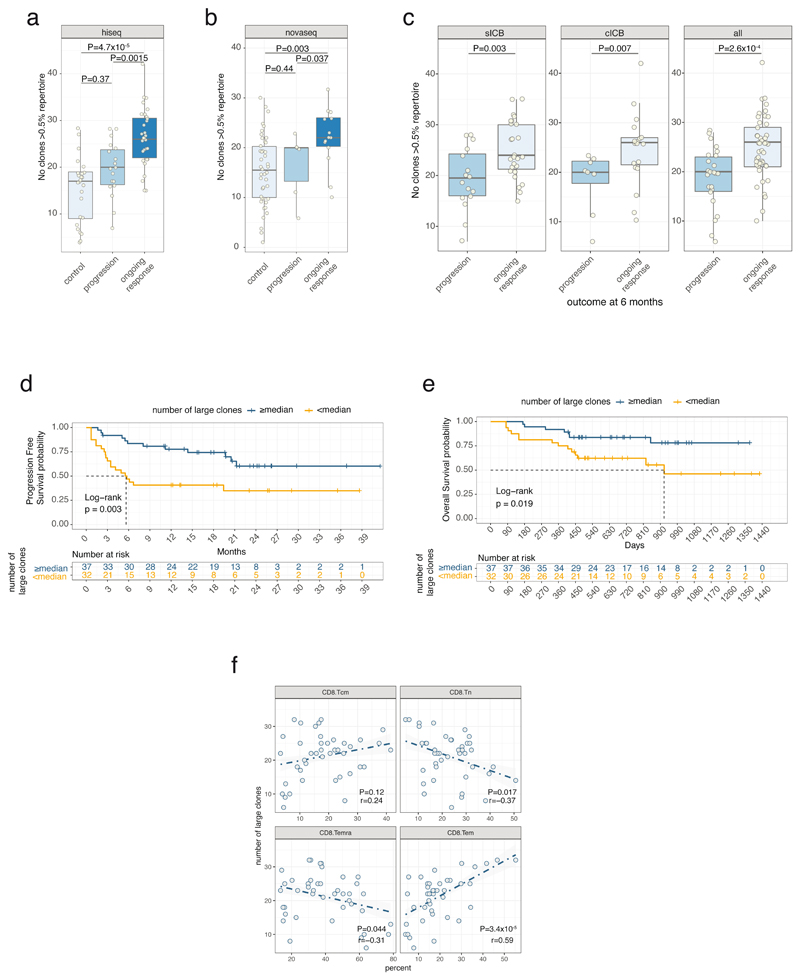
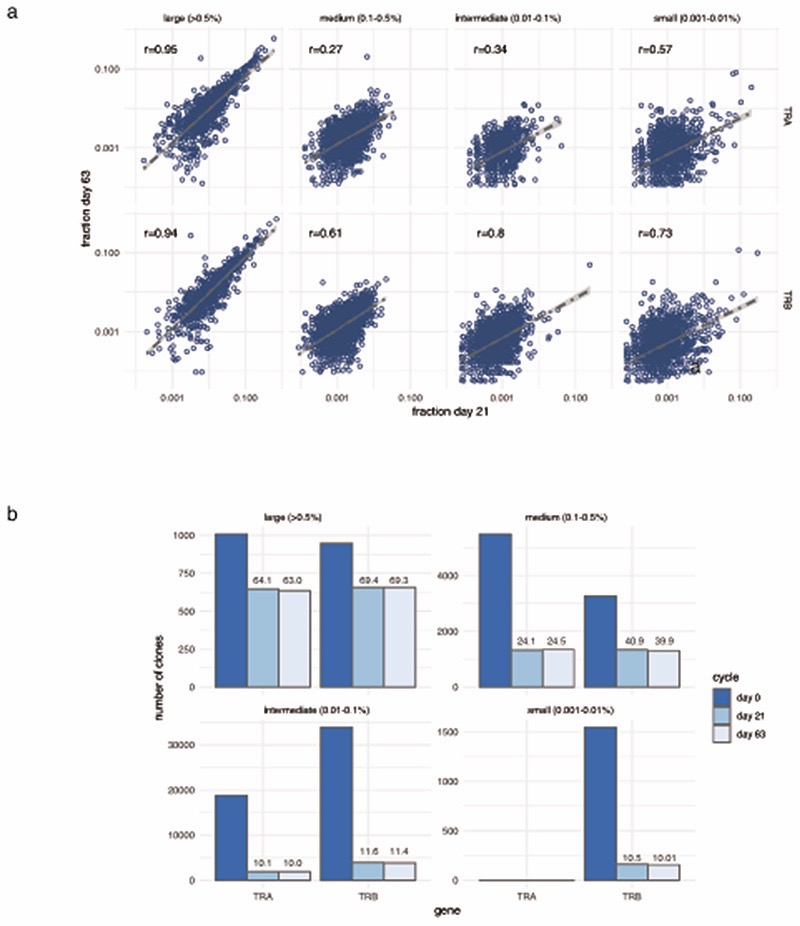
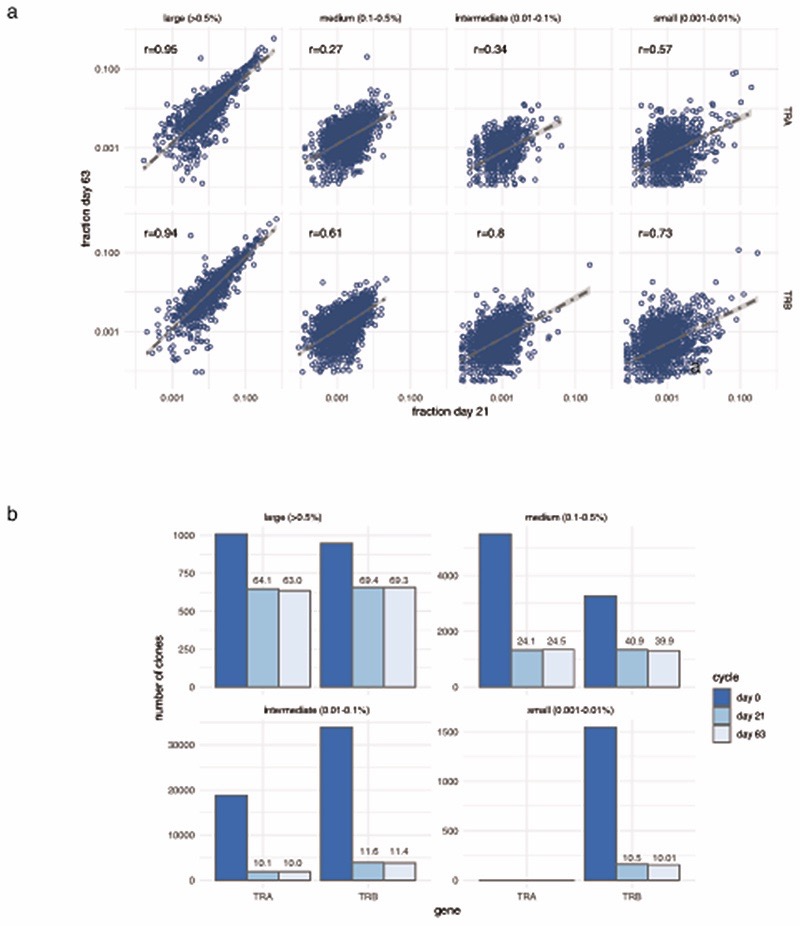
We further explored properties of the peripheral TCR repertoire, including clonal diversity, richness and clone size, for association with clinical outcome. We found no association with day 21 clonal diversity and clinical outcome at 6 months (Extended Figure 5a), whilst the total number of expanding clones on day 21 was only marginally associated with oncological outcome at 6 months (Figure 2h). These observations suggest that the associated TCR signal was instead contributed by a subset of cells. We noted that post-treatment, responders tended to have more expanded clones than non-responders. Exploring this formally, we designated clones with count numbers >0.5% total number of clones per chain to be ‘large’. We found the number of large clones to be specifically higher on day 21 in responding patients compared to either samples from control subjects or non-responding patients (Pvs. Control= 4.7 ×10⁻⁵, Pvs. non-responders= 0.0015, Figure 3a). This observation held true if clones were identified by TRA or TRB gene (Extended Figure 5b). To explore the robustness of this observation we recruited another cohort of 20 patients with MM and 43 healthy controls. With this group we similarly found responding patients had more circulating large CD8+ clones than healthy controls (Pvs. Control= 0.003, Pvs. non-responders= 0.037, Figure 3b; combined P-Values: Control vs. Responder P=2.4x10⁻⁶, Responder vs. Non-responder P=6x10⁻⁴). Across all day 21 cutaneous melanoma samples we found the association between large clone count and six-month outcome was independently significant across both sICB and cICB patients (Figure 3c). To explore the effect of other covariates on this observation, namely age, total number of TCR identified (a reflection of sequencing depth), treatment type and sequencing run, we used a random effects model to test the relationship between day 21 large clone count and six-month outcome18. This confirmed a highly significant association between day 21 large clone count and six-month outcome, with responders having on average 5.7 more large clones on day 21 (95% CI: 2.6 - 8.87, P=4.8×10⁻⁴, Supplementary Figure 1). The 0.5% threshold size was most sensitive to differences between the two groups in both the original and replication cohorts and showed suggestive association in baseline samples (Extended Figure 5c). Kaplan-Meier estimates of both progression-free (Figure 3d) and overall survival (Figure 3e) were significantly different between patients with day 21 large clone count below and above the median for the cohort. Analysis across all samples demonstrated no association between clinical outcome and the number of expanding clones (Extended Figure 5d), or the cumulative clonal space occupied by large clones (Extended Figure 5e), demonstrating that the absolute number of large clones, as opposed to the total proportion of the repertoire occupied, is of importance to outcome. Whilst this effect was most evident post-treatment, when we increased power by pooling baseline samples across both cohorts and including those for which we did not have post-treatment samples (n=89), we found pre-treatment large clone count similarly associated with outcome (P=0.006, TRA, Extended Figure 5f). Analysis of samples from 41 patients with data at baseline and two further timepoints (taken at day 21 and prior to the fourth cycle of treatment – typically day 63) - demonstrated large clones show higher stability than other clone sizes (69.3% of those >0.5% repertoire size remaining at day 63, vs. 39.9% of clones 0.1-0.5% repertoire size, Extended Figure 6), illustrating a persistent presence in patient samples.
Figure 3. Number of large clones is of prognostic importance.
3a) Number of clones >0.5% repertoire at day 21 is significantly greater in responding patients than in control samples (clones identified by TRA chain, n=25 controls, 49 patients, two-sided Wilcoxon signed-rank Test, lower and upper hinge of box on boxplots represent 25-75th percentiles, central line the median and the whiskers extend to largest and smallest values no greater than 1.5x interquartile range); 3b) replication cohort (n=43 controls, 20 patients, one-sided Wilcoxon signed-rank Test, boxplot as per 3a); 3c) Day 21 large clone count associates with 6 month outcomes after sICB (left panel, n=42), cICB (centre panel, n=27), when considering all ICB (right panel, n=69, P values all one-sided Wilcoxon-signed rank Test, boxplot as per 3a); 3d) Shorter progression-free survival in patients with day 21 large clone count below median versus those with count above (P=0.003, two-sided Log-rank test, n=69); 3e) Kaplan-Meier survival curve demonstrates reduced overall survival in patients with day 21 large clone count below median versus those with count above (P=0.01, two-sided Log-rank test, n=69); 3f) correlation between large clone count and cell subset percentages from flow cytometry (72 samples, 19 patients, r reflects Pearson correlation, P value obtained from two-sided T-statistic).
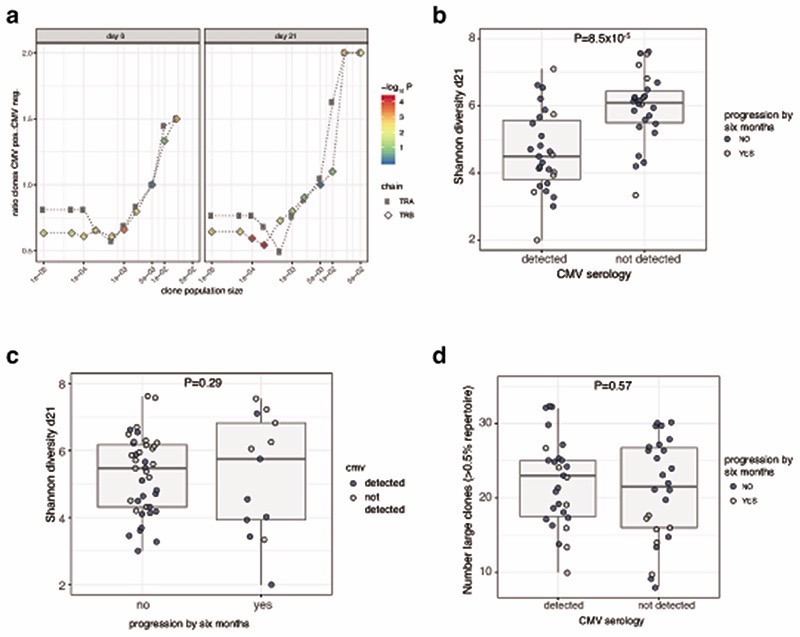
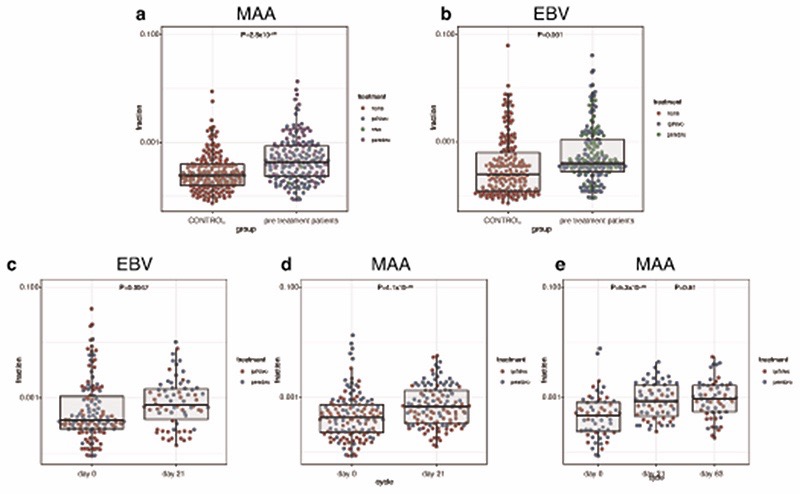
Human cytomegalovirus (CMV) leads to latent infection with profound effects on immune subset composition19 and hyper-expansion of memory T cell clones20,21. Although prevalence of CMV seropositivity markedly increases with age, any impact on ICB response is unknown. Given the association between early clone size and outcome, we examined for a relationship with CMV seropositivity in 68 patients with available samples for serotyping. In keeping with memory cell inflation to a small number of antigens20, CMV seropositivity was associated with increased counts of hyper-expanded clones (>2% repertoire, P=1.1x10⁻³, TRB, day 21 sample), with a concurrent depletion of smaller clones (<0.01%, P=8x10⁻⁵, TRB, day 21 sample, Extended Figure 7a). This led to reduced TCR diversity per sample22,23, but interestingly no effect on large clone count or ICB outcomes was observed (Extended Figure 7b–d). We examined public clonotypes reactive to either Epstein Barr Virus (EBV), which shows ~95% seropositivity24, or melanoma-associated antigens (MAA, Supplementary Table 7) to explore the effect of ICB treatment on clonotypes potentially related to, and independent of melanoma. Whereas we found CD8+ TCR matching those recognising MAA across patients and controls, clone sizes were larger in patients (P=2.8x10⁻⁹, Extended Figure 8a). The median clone size of EBV public clonotypes was also greater in MM patients (P=0.001) in keeping with observations of enlarged bystander clones in cancer25 (Extended Figure 8b). Consistent with specific and generalised effects of ICB, treatment was associated with both larger EBV reactive clones (P=0.0047), and MAA reacting clones (P=4.1x10⁻⁵, Extended Figure 8c,d). Where we had paired samples on day 21 and at day 63, we found this increase to persist at the later timepoint (Extended Figure 8e). It should be noted that most clonotypes have been characterised on HLA-A2 restricted antigens and our analysis was independent of HLA type. However, the analysis of clonal expansion was paired and significant variation between control and patient HLA status is unanticipated. Notably, 8 patients had one or more large clones matching known MAA clonotypes from this small subset of public clonotypes, indicating that large clones frequently recognise known melanoma antigens.
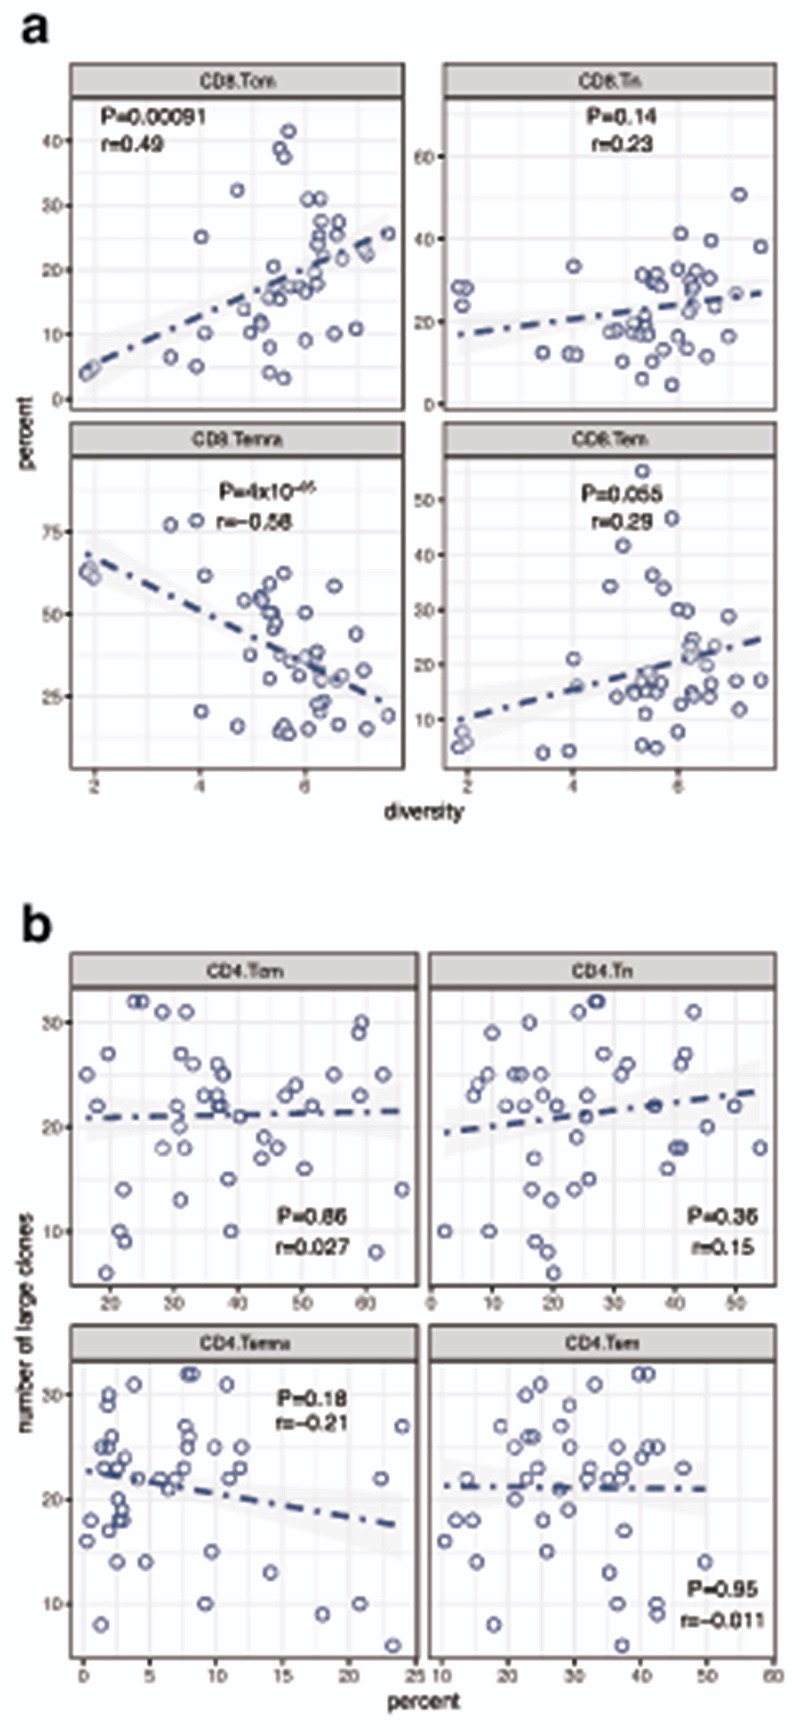
To explore associations between large clone count and CD8+ T cell subset composition we performed flow cytometry on PBMC samples taken before and during treatment (72 samples, 19 patients), assessing the number of naïve (TN), central (TCM) and effector memory (TEM) and effector memory re-expressing CD45RA cells (TEMRA), in CD3+CD8+ cells gated according to expression of CD27 and CD45RA (Supplementary Figure 2). Integrating these data demonstrated clonal diversity was highly correlated with TCM counts and anti-correlated with TEMRA counts (Extended Figure 9a). We found a strong association between large clone count and CD8 TEM counts from the same samples (r=0.59, P=3.4×10⁻⁵). Large clone count was conversely weakly anti-correlated with counts of both CD8+ TN and TEMRA (Figure 3f). However, there was no association between CD4+ T cell subset percentages and large clone count, confirming the specificity of our findings to CD8+ T cells (Extended Figure 9b).
Finally, we explored whether combining module gene expression data, patient baseline haematology parameters and large clone count can predict patient outcomes. We identified 10 variables that can be incorporated through linear discriminant analysis to build a predictive model of six-month clinical outcome with favourable ROC characteristics (AUC=0.823, Supplementary Figure 3a). Our findings highlight the potential importance of these observations for patient care and crucially substantiated large clone count as the most important informative predictor (Supplementary Figure 3b). Given this, and the cytometry data which inferred large clones have an effector-like phenotype, we used 5’ single cell RNA sequencing to further dissect the transcriptional properties of large clones.
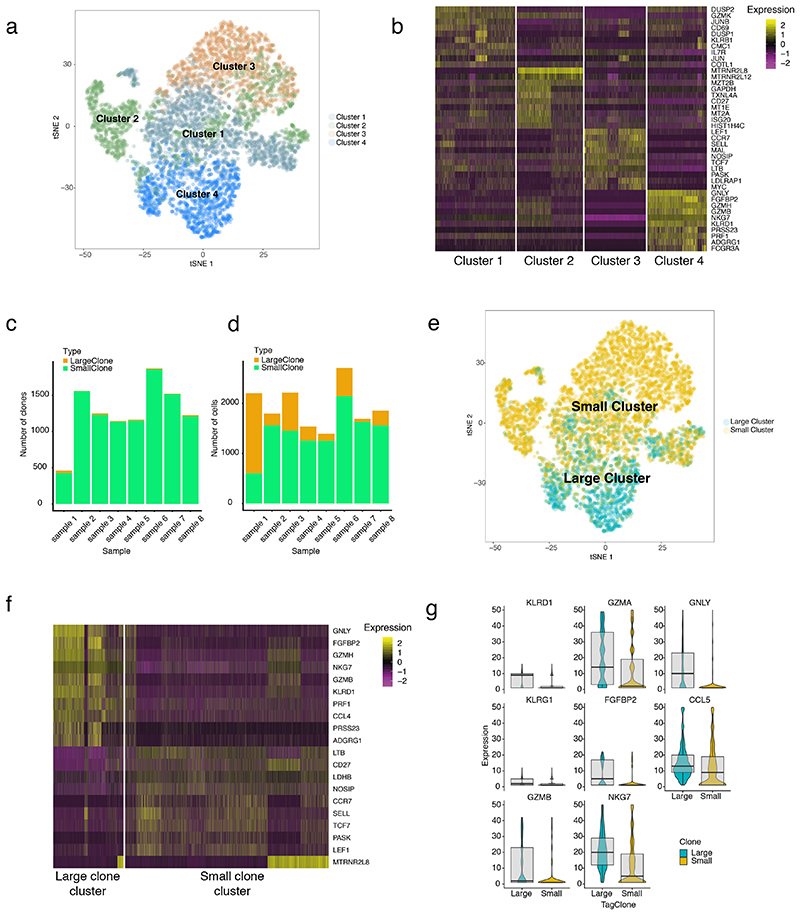
Clustering of expression profiles from post-ICB CD8+ T cells (4 sICB, 4 cICB patients) identified four distinct subsets. The first two of these, Cluster 1 and 2, displayed effector-like patterns and both strongly expressed GZMK, a marker of early-exhaustion12,26. Cluster 1 additionally had other markers of activation, cytotoxicity and exhaustion (e.g. CD69, KLRB1, TIGIT), whilst Cluster 2 was further distinguished by expression of CD27 and markers of active mitosis (e.g. MZT2A, MZT2B) (Figure 4a,b, Supplementary Table 8). The other clusters displayed expression profiles indicative of naïve (Cluster 3: LEF1,TCF7,CCR7) and effector memory (Cluster 4: GNLY, FGFBP2, GZMH) phenotypes.
Figure 4. Single cell sequencing demonstrates large clones have a distinct cytotoxic expression profile.
4a) t-SNE plot of post-treatment CD8+ cell expression profiles from n=8 individuals (4 sICB, 4cICB patients, 12,699 cells total) with colours indicating cell clusters identified by Canonical Correlation Analysis; 4b) Heatmap of genes differentially expressed according to cluster identity as per 4a); 4c) barplot demonstrates total number of clones per sample with those coloured in orange representing large clones (>0.5% repertoire); 4d) number of cells that belong to small (green) and large clones per sample; 4e) t-SNE as per a) but cells are now coloured as to whether they belong to large or small clones; 4f) heatmap and boxplots (4g) demonstrating most significantly differentially expressed genes between large and small clones (lower and upper hinge of box on boxplots represent 25-75th percentiles, central line the median and the whiskers extend to largest and smallest values no greater than 1.5x interquartile range, violin component refers to kernel probability density and encompasses all cells)
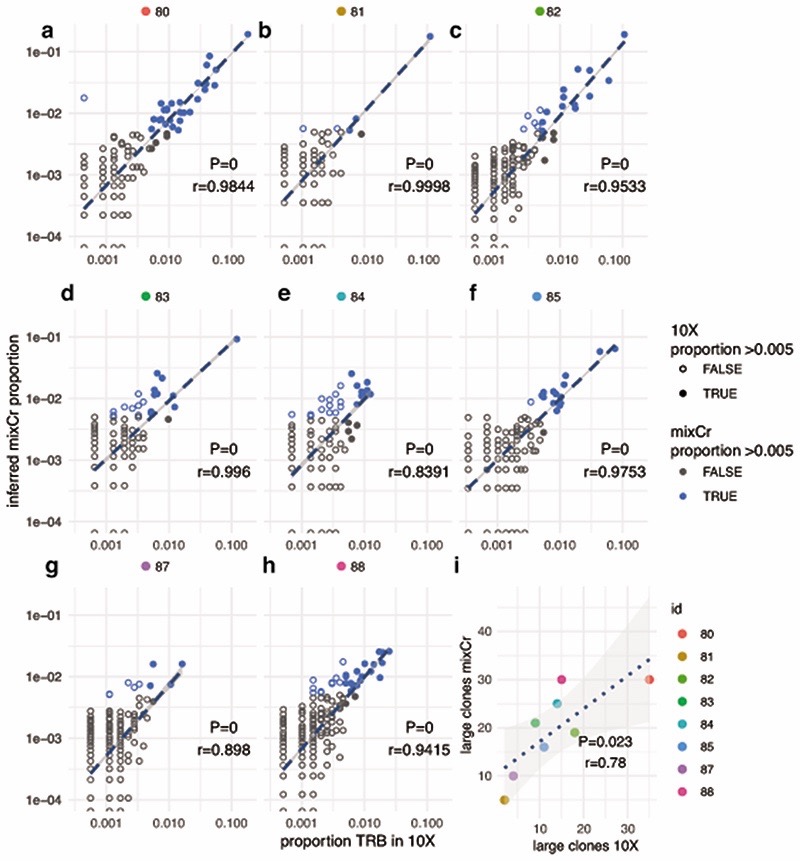
After defining clone sizes by the number of copies of distinct β chains, we explored how gene expression profiles at the single-cell level differ as a function of clonal size post-ICB. The inferred clonal frequency was remarkably similar to that from the matched clones for these samples from bulk (Extended Figure 10a-h). Clones were labelled as large or small according to the 0.5% repertoire threshold per individual, with a significant correlation between the number of large clones identified in single cell and bulk data (Extended Figure 10i). The number of large clones per individual, and their respective contribution to the clonal space was highly variable (Figure 4c,d). Strikingly, we found large clones clustered together, being predominantly composed of cells from Cluster 4, with a contribution from Cluster 1, indicating a shared expression profile (Figure 4e). Performing differential expression analysis on large clones versus all others revealed cells from large clones have a uniquely cytotoxic profile, with high expression of CCL4, PRF1 and GNLY amongst other genes (Figure 4f, Supplementary Table 9). It has recently been demonstrated that expression of ITGB1, encoding CD29, defines a uniquely cytotoxic subset of CD8+ T cells with enhanced cytolytic activity27 and we note that ITGB1 is a key marker gene for large clones in our dataset.
In summary, we present the largest-to-date transcriptomic analysis of peripheral CD8+ lymphocytes across a cohort of MM patients receiving ICB. We show that treatment results in induction of distinct modules of genes, most notably those involved in cell division, but this does not directly correlate with patient outcome. Instead, early samples from responding patients demonstrate over-expression of TCR encoding genes and this is associated with having a greater number of discrete large clones in the circulating repertoire. A strength of the observed novel relationship between day 21 large clone count and outcome is that it is agnostic to the clone target. This is important because T cell clonal targets will vary markedly within and between individuals and thus a generalised peripheral marker is required for translation to patient care. Nonetheless, the precise specificity of T cell clones is of importance to immuno-oncology and understanding whether large clones are enriched for those that are specific for tumour antigens will be of interest. Notably, large clones have a distinct cytotoxic gene expression profile, inferring activity and the underlying basis with long term clinical response. Future work will explore association between HLA type and clonal architecture, as well as regulatory polymorphisms and ICB response. In addition to providing insights into the dynamics of the response to ICB, our study illustrates the power of combining transcriptomics with TCR analysis across large cohorts to determine long sought predictive markers of durable clinical benefit from ICB.
Methods
Sample collection
Patients provided written informed consent to donate samples for analysis to the Oxford Radcliffe Biobank (Oxford Centre for Histopathology Research ethical approval 16/A019, 18/A064) and 30-50ml blood was collected into EDTA tubes (BD vacutainer system) taken immediately pre-treatment, at day 21, and prior to the fourth cycle of treatment (day 63). Due to logistical issues and delays with treatment, some patients day 63 samples were taken later but prior to the fifth cycle (Supplementary Table 1). Control samples were collected via the Oxford biobank (www.oxfordbiobank.org.uk) with full ethical approval (REC 06/Q1605/55) and written informed consent from healthy volunteers of European ancestry between the ages of 24-61 (median age 49.5, IQR 34-54). Peripheral blood mononuclear cells were obtained by density centrifugation (Ficoll Paque). CD8+ cell isolation was carried out by positive selection (Miltenyi) according to the manufacturer’s instructions with all steps performed at 4°C or on ice.
Treatment outcomes
All samples were obtained from patients receiving standard of care treatment within the NHS and outcomes were defined clinically or using radiological assessment according to irRECIST.1.1. performed approximately 12 & 24 weeks post-initiation of treatment. Progressors were defined as those with radiographic disease progression at either of these two-time points or who had unequivocal rapid disease progression necessitating cessation of ICB treatment. Outcomes were dichotomised according to evidence of radiological disease stability or response for the minimum duration of 24 weeks as per Roh et al 28. 78 samples had pre and post-treatment data for analysis of correlates of outcome, however mucosal, small cell and uveal melanoma display reduced sensitivity to immunotherapy and display dissimilar clinical behaviour, hence these samples (8 individuals) were excluded from analysis of clinical outcomes. In a further patient, a review of the radiology suggested disease was not-metastatic post-treatment and they were similarly excluded (Supplementary Table 1).
RNA extraction
Post-selection cells were spun down and re-suspended in 350μl of RLTplus buffer with 1% beta-mercaptoethanl and transferred to 2ml tubes. Samples were stored at -80°C for batched RNA extraction. Homogenization of the sample was carried out using the QIAshredder (Qiagen). The AllPrep DNA/RNA/miRNA kit (Qiagen) was used for RNA extraction. DNase I was used during the extraction protocol to minimise DNA contamination. RNA was eluted into 35μl of RNase- free water. The RNA amount was quantified by Qubit analysis and the RNA samples stored at - 80°C for storage until ready for sequencing.
RNA sequencing
Poly-A RNA was, for the original cohort, 75bp paired-end (PE) sequenced on Illumina Hiseq-4000 machines and for the replication cohort 150bp PE sequenced on an Illumina Novaseq, both at the Oxford Genome Centre, Wellcome Centre for Human Genetics. Reads were aligned to CRGh38/hg38 using HISAT229 and read count information were generated using HTSeq30. High mapping quality reads were selected based on MAPQ score using bamtools. Marking and removing duplicate reads were performed using picard (v 1.105) and samtools was used to pass through the mapped reads and calculate statistics31. 298 high-quality transcriptomes (properly paired = 14,124,434,934 reads, median per sample = 47,445,200) were selected and used for downstream analysis. We detected potential sample contamination and swaps using verifyBamID32 and 4 samples with >2.5% were excluded from outcome analysis (Supplementary Table 1). We applied DESeq2 (v 1.18.1) to produce normalized counts33.
TCR mapping
MiXCR was used to map reads on reference sequences of V, D, J genes, and quantitate TCR clonotypes from mapped reads using CDR3 gene regions17. The non-default partial alignments option (OallowPartialAlignments=true) was applied to preserve partial alignments for assembly step. We performed three iterations of reads assembling to increase the number of assembled reads containing CDR3 region using assemblePartial action. Positions quality scores were used to switch on the frequency-based correction of clonotypes assembling and clustering (ObadQualityThreshold=15). Clones were called according to the complementarity-determining region 3 (CDR3) nucleotide sequence. We identified a median of 1007α(IQR:635-1319) and 1619 β(IQR:957:2247) unique chains per sample from the Hiseq dataset and 1562α (IQR:889:1983) and 2159β (IQR:1310:2718) unique chains per sample from the Novaseq data. Information about clonotypes was extracted with default parameters and processed in R, clonal indices were calculated using the vegan package34. For each sample we determined the total number of clones mapped separately per TCR gene (TRA and TRB) and expressed individual clone sizes as a proportion of this total number.
Differential Gene Expression
DESeq233 was used for differential expression analysis. For comparison of baseline versus day 21 expression, we used a pairwise approach controlling for the individual. Only transcripts with a mean count number >10 were analysed using the binomial Wald test with 750 iterations after correcting for size factors and dispersion. To explore the significant differences between sICB and cICB response we tested for an interaction between treatment and type. To identify genes differentially expressed between progressors at 6 months and those with continued benefit of treatment we only looked at transcripts with >50 read counts and used age and whether the sample was pre or post-treatment as covariates. Identification of transcripts associated with clone growth was performed over n=54, d21 samples testing the number of transcripts associated with clone growth. Clones were defined by beta chain and were identified as growing if they were enlarged on baseline (P<0.001, Fisher exact test).
Identification of ICB regulated modules
To increase the observation of ICB responsive genes with higher inter-individual variation we analysed transcripts showing response to one or both treatments at FDR<0.05 (7329 transcripts total). Normalised expression data for all 191 samples (control samples from 22 individuals, 169 patient samples) were extracted for these genes and co-expressed modules discovered from the data matrix using CEMiTool in R16 with the following settings employed: filter = FALSE, merge_similar = TRUE, min_ngen = 80. Modules of genes were extracted and pathway analysis performed.
Pathway analysis and gene set enrichment
Pathway analysis was performed using the R package XGR35 using the GOBP and Reactome databases. Induced and suppressed transcripts were analysed separately against the background of all tested transcripts. The default ontology algorithm was used (“none”) and a hypergeometric test employed. To identify pathways most differentially regulated between sICB and cICB genes were ranked in order of differential induction and gene set enrichment analysis was performed with the R package Pi36 using the MsigdbH ontology and pathways containing 20-5000 genes, with 20,000 permutations used.
Quantitative PCR
1.25 million PBMCs were lysed in 350μl RLT buffer (Qiagen) supplemented with 1% beta-mercaptoethanol or DTT. RNA was extracted from PBMC samples using QIAshredder and AllPrep DNA/RNA/miRNA Universal Kits (Qiagen). 8μl of RNA was reverse transcribed using the SuperScript™ III First-Strand Synthesis System (ThermoFisher Scientific). MIXCR data was validated by correlating TCR clonal expansion 21 days post ICB treatment by qPCR with predicted clonal expansion using MIXCR data. TRA and TRB chains were targeted in both expanding and unchanged control clones in a patient-specific manner. Clones were selected based on clonal size and significance of expansion post-ICB treatment. Primers were designed to selectively amplify CD8+ TCR clones with the forward primer targeting the CDR3 region and the reverse targeting the TCR constant region. Melt curves were performed to optimise primer specificity. 10μl PCR reactions were performed in duplicate per sample using 5μl iTaq Universal SYBR Green Supermix (BIORAD), 0.8μl 5μM primers (forward and reverse) and 4.2μl cDNA (diluted in nuclease-free water) per reaction. A holding stage of 95°C for 10m was applied before PCR cycling: 95°C 15s, 63°C 60s for 40 cycles. The delta delta ct method was used to calculate relative expression and fold change of genes in paired untreated and day 21 samples. Ct values were normalised to CD3E to account for T cell proportion of PBMCs.
Flow cytometry
After processing, PBMCs were resuspended in freezing media (10% DMSO, 90% FBS) and stored in liquid nitrogen. For flow cytometry analysis, 1 × 10⁶ cells were stained in HBSS supplemented with 5% FBS in the dark on ice for 30 minutes prior to fixation in 2% formaldehyde. All samples were also stained using a fixable amine reactive viability dye (LIVE/DEAD™ Fixable Near-IR Dead Cell Stain Kit) at a dilution of 1/1000 in HBSS. Staining antibodies, clones and manufacturer are shown in Supplementary Figure 2. Flow cytometry was performed using an LSRII (Becton Dickinson) and FlowJo software (Treestar®) was used for analysis. When exploring association with large clone count the flow cytometry and FlowJo analysis was performed blinded to bioinformatic and clinical data.
Identification and combination of informative predictors in patient response prediction
Based on transcriptomic and clinical data obtained in this study, we constructed 3 types of predictors, consisting of (1) module hub genes (‘hub1’-‘hub9’; lead hub gene per module identified from transcriptome data), (2) clone-derived features, that is, large count on day 21 of treatment, and total large count (sum of pre-treatment and post-treatment), (3) cell counts of neutrophils and monocytes (‘neut’ and ‘mono’). We first applied random forest (RF, R package randomForest, version 4.6-14) to estimate the relative importance of predictors considered. For the model building, we used 5-fold cross-validation (repeated 10 times) to find the best model with optimal parameters tuned. Based on built RF model, we measured the importance for a predictor by the degree of decrease in accuracy removing that predictor (this measure is more robust than directly measuring a predictor by its predictive power). A high score in accuracy indicates a highly informative predictor. We next applied linear discriminant analysis (R package MASS, version 7.3-51.4) to combine all identified informative predictors. We calculated linear discriminant scores (LD scores) used for patient response prediction. LD scores are a linear combination of predictors (thus with better prediction explanations); the performance (measured by AUC) of such combination was compared to prediction using individual predictors alone.
sc-RNAseq
Samples were obtained after the first treatment cycle (day 21). Following isolation of PBMC subsets (see “sample collection”), CD8+ and CD14+ cells (~12000 total) were combined in suspension. Single cells were isolated using oil-droplet partitioning and tagged with a unique barcode as per the Chromium system (10x Genomics, Chromium Single Cell V(D)J and 5’ Library kits). Reverse transcription, amplification and library preparation of both 5’ transcriptome and V(D)J libraries was performed as per published protocols (10x Genomics). The library was sequenced using a HiSeq platform at a minimum of 50,000 reads per cell (data presented - 60,470 reads per cells).
Data processing
Cellranger (v 3.0.2) mkfastq was applied to the Illumina BCL output to produce FASTQ files. Cellranger count was then applied to each FASTQ file to produce a Feature Barcoding and Gene expression library. Cellranger aggr was used to combine samples for merged analysis.
Quality control
We applied scater package to filter out single cell profiles that were outliers for any metric, as low-quality libraries37. We used size factors for scaling normalization of cell-specific biases and used log-normalized expression values for downstream use38. Technical noise was modeled using the scran package39 based on the optimal number of principal components (PCs)40. Scran package was applied to detect and remove doublets using the expression profiles41.
Modeling and comparison of small and large TCR clonotypes
Sub-setting was performed to select cells expressing CD8A, CD8B, and CD3D. Further sub-setting excluded residual cells expressing CD14 or CD19. A canonical correlation analysis (CCA) was run with 20 canonical clusters selected for downstream analysis using the Seurat package42. An integrated analysis of all merged data was performed using defined canonical clusters. Following identification of cellular subgroups based on TCR clonotype, conserved markers defining the subgroups were identified using the FindMarkers function with a default two-sided Wilcoxon Rank Sum Test. Plots were generated using ggpubr (v0.2) and customizing ggplot2.
General Statistical analysis
Statistical tests performed are stated for each figure, the analysis was performed using R version 3.4.3 (Kite-Eating Tree) and figures made with ggplot2. Lme418 was used for linear random effects model. P-values were combined using Fisher’s method. Lower and upper hinge of box on boxplots represent 25-75th percentiles, central line the median and the whiskers extend to largest and smallest values no greater than 1.5x interquartile range).
Further information on experimental design and statistical analyses are available in the Nature Research Reporting Summary linked to this article.
Extended Data
Extended Data Fig.1. Extended transcriptomic response to ICB.
a, Comparison of differential induction of genes by cICB (log fold change y axis) and sICB (log fold change x-axis) at day 63 (n=46 paired samples, 35 sICB, 11 cICB). b, Pathways preferentially upregulated (NES score >0) or supressed by cICB versus sICB as identified by Gene Set Enrichment analysis depicted in Figure 1e,f
Extended Data Fig. 2. Module pathways.
Pathway analysis was performed using Gene Ontology Biological Processes across treatment response associated modules. For 7/9 modules, transcripts within the modules were significantly associated with discrete processes, with limited overlap between modules. These modules (M1:M4, M6:M8) and all associated pathways for them (FDR <0.05) are listed above. GO specific pathway codes are listed on the y-axis.
Extended Data Fig. 3. Module expression.
Graphs demonstrate average gene expression per module for each sample with red boxplots and associated points representing cICB samples (n=20 baseline, n=16 D21, n=5 D63) and green boxplots and associated points representing sICB samples (n=56 baseline, n=41 D21, n=26 D63). Controls are untreated healthy volunteers (n=24). All statistically significant differences (Tukey adjusted P <0.05) are denoted with associated test in the table and refer to both treatments as group, D21= day 21 sample, D63= day 63 sample.
Extended Data Fig. 4. TCR qPCR.
Validation of MiXCR results using quantitative PCR. For n=13 individuals, 2 TC R α and 2 β chains were identified according to whether or not MiXCR reported significant expansio n on day 21 versus baseline. Primers were designed to the complementarity determining region 3 (CDR3) sequences for each chain and quantitative PCR performed on pretreatment day 0 PBMC cDNA and PBMC cDNA from day 21. Ct values were normalised to total expression of CD3E. a, Clones identified as expanding in the MiXCR CD8+ RNA were found to show significantly more expansion (median 3.48 fold, IQR 1.85-12.79) than non expanding (median1.32 fold, IQR 0.97-1.88, Wilcoxo n signed-rank Test (two-sided) P=3x10⁻⁸). Lower and upper hinge of box on boxplots represent 25-75th percentiles, central line the median and the whiskers extend to largest and smallest values no greater than 1.5x interquartile range. b, MiXCR fold change per clone from CD8 cells was highly correlated with that determined from bulk PBMCs using quantitative PCR (Pearson correlation, two-sided T-statistic).
Extended Data Fig. 5. Extended clone size analysis.
a, Day 21 post ICB clonal diversity is similar in patients who have 6 month response versus those with disease progression by this timepoint (two-sided T-test, n=69). b, As per Figure 3a, but with unique clones defined by the beta chain, left panel two-sided Wilcoxon signed-rank Test (n=25 controls, 49 patients, right panel one-sided Wilcoxon signed-rank Test, n=43 controls, 20 patients). c, Threshold for clone size associating with outcome, x-axis indicates size of clone with test comparing number of clones above that size according to clinical outcome, y-axis: -log10(p-value) from test. The difference between responding patients and progressing patients being maximal at clone size of 0.5% (two-sided Wilcoxon test, n=69). d, Across all samples there is no association between number of clones growing on day 21 (P<0.05) and clinical outcome by treatment type. e, Proportion of repertoire contributed by large clones does not differ according to clinical outcome. f, When all cutaneous patients are grouped a significant association between pretreatment large clone count and outcome is seen observed (n=89,Wilcoxon rank-sum, one-sided test). For all boxplots lower and upper hinges of box represent 25-75th percentiles, central line the median and the whiskers extend to largest and smallest values no greater than 1.5x interquartile range.
Extended Data Fig. 6. Temporal stability of clones.
a, Clones from 42 individuals with samples at 3 timepoints were identified at day 0 pretreatment and classified according to size. The corresponding correlation for the same clones between day 21 and day 63 was assessed (Pearson correlation, two-sided T-statistic all P<2.2×10⁻¹⁶), demonstrating large clones show greater stability in proportion of clonal space occupied over time. b, Clones identified pretreatment were assessed at cycle 2 (day 21) and cycle 4 with bar plot values representing the number that were larger than the lower defining value of the bin (e.g. >0.01% for intermediate) at later timepoints, the values on top of bars represent percentage of day 0 recovery.
Extended Data Fig. 7. Effect of CMV.
For a subset of cutaneous melanoma patients with day 21 data we were able to measure unequivocal CMV serology. a, CMV seropositivity is associated with a depletion of small clones (ratio <1 for clones <0.05% repertoire) and increased numbers of large clones (>2% repertoire) (n=68 left panel, 53 right panel). b, Patients seropositive for CMV demonstrated significantly reduced CD8+ TCR diversity at day 21 (measured on TRB CDR3) (n=53, two-sided T-Test). c, Despite significant differences in diversity from CMV there was no difference in diversity between day 21 samples from progressing and responding patients (n=53, two-sided T-test). d, There is no association between CMV serology and number of large clones at day 21 (n=53, two-sided T-Test) For all boxplots lower and upper hinges of box represent 25-75th percentiles, central line the median and the whiskers extend to largest and smallest values no greater than 1.5x interquartile range.
Extended Data Fig. 8. Comparison of clonotypes to public clones.
a, The complete dataset of clones were screened for public clonotypes for melanoma antigens, demonstrating that the size of clones matching these clonotypes in untreated melanoma patients is significantly greater than those in controls (Wilcoxon Test, n=106 patients, 68 controls) b, Melanoma patients showed no difference in mean EBV reactive clone size from controls (P>0.05) although the distribution of clones was skewed in non-melanoma patients and median clone size greater in patients (two-way Wilcoxon-Test). c, Treatment led to an small increase in median EBV reactive clonotype clone size across all patients, but d, the significance of this effect was greater for MAA clonotypes e, for samples with data for clone sizes at day 63 as well as day 21 (n=41 individuals) there was no further change in clone size at the later timepoint (two-way Wilcoxon-Test). For all boxplots lower and upper hinges of box represent 25-75th percentiles, central line the median and the whiskers extend to largest and smallest values no greater than 1.5x interquartile range.
Extended Data Fig. 9. Investigating flow correlates of clonal indices.
a, for 72 samples from 19 patients, blinded flow cytometry data to assess CD8 subsets was integrated with the Shannon diversity index calculated for each sample. This demonstrated a strong positive association between TCM and diversity, whereas TEMRA was significantly anticorrelated with diversity (Pearson correlation, two way T-statistic). b, as per Figure 3e, except here large clone count was correlated with percentage CD4 subsets from each of the samples. Unlike for CD8 cells, there is no association between large clone count and percentage CD4 subset in the samples analysed (Pearson correlation, two way T-statistic).
Extended Data Fig. 10. Comparing MiXCR and 10X TCR data.
a-h, for 8 patients, indicated by number, CD8+ cell samples were subject to 10X chromium single cell 5’ RNA sequencing providing T cell receptor sequencing and standard bulk sequencing (see methods). Clones were identified by their β chain and for each productive β chain identified the relative clonal proportion (frequency) was calculated. Clones were matched via the CDR3 amino acid sequence with β chains from the same samples mapped from bulk CD8+ cell RNA using MiXCR. Where the clone fell below detection limit in MiXCR a value of 0 was attributed. MiXCR clones were identified for 92.1% clones >0.1% population in 10X (6990/7597) and 99.4% clones >0.2% size (5816/5852). x-axis= 10X proportion, y axis MiXCR proportion, r calculated using Pearson correlation coefficient, all P<2.2x10⁻¹⁶. i, Despite the different methods, the number of large clones (>0.5% total clonal population) identified from 10X and MiXCR approaches are correlated.
Supplementary Material
Acknowledgements
We are very grateful to all patients who have generously contributed samples and participated in the study. We thank all the staff of the Day Treatment Unit, Oxford Cancer Centre, Dr Nicholas Coupe and Dr Rubeta Matin for assistance in collecting patient samples. Thanks to Dr Robert Morgan for discussion and advice. This study was funded by a Wellcome Intermediate Clinical Fellowship to BPF [201488/Z/16/Z], additionally supporting EM and IN; RW was an NIHR Academic Clinical Fellow and was supported by a CRUK pre-doctoral Fellowship (ANR00740); RC is supported by a CRUK Clinical Research Training Fellowship; CT is funded by the EPSRC and by the Balliol Jowett Society (D4T00070); JCK is funded by a Wellcome Trust Investigator Award [204969/Z/16/Z]; PK is supported by a NIHR Senior Fellowship and Wellcome Trust Award WT109965MA; VW was supported by a CRUK CTAAC Clinical Trials Fellowship (C2195/A19716), and supported by the NIHR Oxford Biomedical Research Centre. The views expressed are those of the authors and not necessarily those of the NHS, the NIHR or the Department of Health.
Footnotes
Author contributions
Initiated cohort: M.R.M.; conceived study: B.P.F.; drafted paper and figures: B.P.F. with contributions from C.A.T., I.N., R.A.W., H.F., M.H.A.-M., P.K., M.M.; primary analysis: B.P.F., I.N.; recruited patients: M.P., V.W., B.P.F., M.R.M., R.A.W.; collected samples and purified cells: S.D., E.A.M., R.A.W., R.C., C.A.T., B.P.F.; extracted RNA: S.D., E.A.M.; RNAseq pipelines, QC, bioinformatic support: I.N.; flow cytometry, qPCR clones: C.A.T.; single cell sequencing: R.A.W., R.C., I.N., radiological reporting: Z.T., clinical data collation: R.A.W., B.P.F.; statistical support, machine learning: H.F., J.C.K., scientific, infrastructural support: J.C.K.. All authors reviewed and edited the final paper.
Data Availability
All sequencing data will be made freely available to organisations and researchers to conduct research in accordance with the UK Policy Framework for Health and Social Care Research via a Data Access Agreement. Sequence data has been deposited at the European Genome-phenome Archive (EGA), which is hosted by the EBI and the CRG, under accession number EGAS00001004081. Patient anonymized raw flow cytometry data will be promptly made freely accessible for download from the MRC WIMM server on application.
Code Availability
Scripts used in the analysis and figure synthesis are available upon request and will be uploaded to the Fairfax group bitbucket account: https://bitbucket.org/Fairfaxlab/identification-of-peripheral-cd8-t-cell-subsets-associated/src/master/
References
- 1.Tumeh PC, et al. PD-1 blockade induces responses by inhibiting adaptive immune resistance. Nature. 2014;515:568–571. doi: 10.1038/nature13954. [DOI] [PMC free article] [PubMed] [Google Scholar]
- 2.Pan D, et al. A major chromatin regulator determines resistance of tumor cells to T cell-mediated killing. Science. 2018;359:770–775. doi: 10.1126/science.aao1710. [DOI] [PMC free article] [PubMed] [Google Scholar]
- 3.Miao D, et al. Genomic correlates of response to immune checkpoint blockade in microsatellite-stable solid tumors. Nat Genet. 2018;50:1271–1281. doi: 10.1038/s41588-018-0200-2. [DOI] [PMC free article] [PubMed] [Google Scholar]
- 4.Davoli T, Uno H, Wooten EC, Elledge SJ. Tumor aneuploidy correlates with markers of immune evasion and with reduced response to immunotherapy. Science. 2017;355:eaaf8399. doi: 10.1126/science.aaf8399. [DOI] [PMC free article] [PubMed] [Google Scholar]
- 5.Daud AI, et al. Programmed Death-Ligand 1 Expression and Response to the Anti-Programmed Death 1 Antibody Pembrolizumab in Melanoma. J Clin Oncol. 2016;34:4102–4109. doi: 10.1200/JCO.2016.67.2477. [DOI] [PMC free article] [PubMed] [Google Scholar]
- 6.Brochez L, et al. Challenging PD-L1 expressing cytotoxic T cells as a predictor for response to immunotherapy in melanoma. Nat Commun. 2018;9 doi: 10.1038/s41467-018-05047-1. [DOI] [PMC free article] [PubMed] [Google Scholar]
- 7.Jacquelot N, et al. Predictors of responses to immune checkpoint blockade in advanced melanoma. Nat Commun. 2017;8 doi: 10.1038/s41467-017-00608-2. [DOI] [PMC free article] [PubMed] [Google Scholar]
- 8.Krieg C, et al. Author Correction: High-dimensional single-cell analysis predicts response to anti-PD-1 immunotherapy. Nat Med. 2018 doi: 10.1038/s41591-018-0094-7. [DOI] [PubMed] [Google Scholar]
- 9.McQuade JL, et al. Association of body-mass index and outcomes in patients with metastatic melanoma treated with targeted therapy, immunotherapy, or chemotherapy: a retrospective, multicohort analysis. Lancet Oncol. 2018;19:310–322. doi: 10.1016/S1470-2045(18)30078-0. [DOI] [PMC free article] [PubMed] [Google Scholar]
- 10.Kugel CH, et al. Age Correlates with Response to Anti-PD1, Reflecting Age-Related Differences in Intratumoral Effector and Regulatory T-Cell Populations. Clin Cancer Res. 2018;24:5347–5356. doi: 10.1158/1078-0432.CCR-18-1116. [DOI] [PMC free article] [PubMed] [Google Scholar]
- 11.Blank CU, Haanen JB, Ribas A, Schumacher TN. The ‘cancer immunogram’. Science. 2016;352:658–660. doi: 10.1126/science.aaf2834. [DOI] [PubMed] [Google Scholar]
- 12.Huang AC, et al. T-cell invigoration to tumour burden ratio associated with anti-PD-1 response. Nature. 2017;545:60–65. doi: 10.1038/nature22079. [DOI] [PMC free article] [PubMed] [Google Scholar]
- 13.Wang W, et al. Biomarkers on melanoma patient T Cells associated with ipilimumab treatment. J Transl Med. 2012;10:146. doi: 10.1186/1479-5876-10-146. [DOI] [PMC free article] [PubMed] [Google Scholar]
- 14.Das R, et al. Combination Therapy with Anti-CTLA-4 and Anti-PD-1 Leads to Distinct Immunologic Changes In Vivo. J Immunol. 2015;194:950–959. doi: 10.4049/jimmunol.1401686. [DOI] [PMC free article] [PubMed] [Google Scholar]
- 15.Langfelder P, Horvath S. WGCNA: an R package for weighted correlation network analysis. BMC Bioinformatics. 2008;9:559. doi: 10.1186/1471-2105-9-559. [DOI] [PMC free article] [PubMed] [Google Scholar]
- 16.Russo PST, et al. CEMiTool: a Bioconductor package for performing comprehensive modular co-expression analyses. BMC Bioinformatics. 2018;19 doi: 10.1186/s12859-018-2053-1. [DOI] [PMC free article] [PubMed] [Google Scholar]
- 17.Bolotin DA, et al. MiXCR: software for comprehensive adaptive immunity profiling. Nat Methods. 2015;12:380–381. doi: 10.1038/nmeth.3364. [DOI] [PubMed] [Google Scholar]
- 18.Bates D, Mächler M, Bolker B, Walker S. Fitting Linear Mixed-Effects Models using lme4. ArXiv14065823 Stat. 2014 [Google Scholar]
- 19.The Milieu Intérieur Consortium et al. Natural variation in the parameters of innate immune cells is preferentially driven by genetic factors. Nat Immunol. 2018;19:302–314. doi: 10.1038/s41590-018-0049-7. [DOI] [PubMed] [Google Scholar]
- 20.Weekes MP, Wills MR, Mynard K, Carmichael AJ, Sissons JG. The memory cytotoxic T-lymphocyte (CTL) response to human cytomegalovirus infection contains individual peptide-specific CTL clones that have undergone extensive expansion in vivo. J Virol. 1999;73:2099–2108. doi: 10.1128/jvi.73.3.2099-2108.1999. [DOI] [PMC free article] [PubMed] [Google Scholar]
- 21.Gillespie GMA, et al. Functional Heterogeneity and High Frequencies of Cytomegalovirus-Specific CD8+ T Lymphocytes in Healthy Seropositive Donors. J Virol. 2000;74:8140–8150. doi: 10.1128/jvi.74.17.8140-8150.2000. [DOI] [PMC free article] [PubMed] [Google Scholar]
- 22.Suessmuth Y, et al. CMV reactivation drives posttransplant T-cell reconstitution and results in defects in the underlying TCRβ repertoire. Blood. 2015;125:3835–3850. doi: 10.1182/blood-2015-03-631853. [DOI] [PMC free article] [PubMed] [Google Scholar]
- 23.Wang GC, Dash P, McCullers JA, Doherty PC, Thomas PG. T Cell Receptor Diversity Inversely Correlates with Pathogen-Specific Antibody Levels in Human Cytomegalovirus Infection. Sci Transl Med. 2012;4:128ra42. doi: 10.1126/scitranslmed.3003647. [DOI] [PMC free article] [PubMed] [Google Scholar]
- 24.Durovic B, et al. Epstein-Barr Virus Negativity among Individuals Older than 60 Years Is Associated with HLA-C and HLA-Bw4 Variants and Tonsillectomy. J Virol. 2013;87:6526–6529. doi: 10.1128/JVI.00169-13. [DOI] [PMC free article] [PubMed] [Google Scholar]
- 25.Simoni Y, et al. Bystander CD8+ T cells are abundant and phenotypically distinct in human tumour infiltrates. Nature. 2018;557:575–579. doi: 10.1038/s41586-018-0130-2. [DOI] [PubMed] [Google Scholar]
- 26.Zheng C, et al. Landscape of Infiltrating T Cells in Liver Cancer Revealed by Single-Cell Sequencing. Cell. 2017;169:1342–1356.:e16. doi: 10.1016/j.cell.2017.05.035. [DOI] [PubMed] [Google Scholar]
- 27.Nicolet BP, et al. CD29 marks superior cytotoxic human T cells. bioRxiv. 2019 doi: 10.1101/562512. [DOI] [Google Scholar]
- 28.Roh W, et al. Integrated molecular analysis of tumor biopsies on sequential CTLA-4 and PD-1 blockade reveals markers of response and resistance. Sci Transl Med. 2017;9:eaah3560. doi: 10.1126/scitranslmed.aah3560. [DOI] [PMC free article] [PubMed] [Google Scholar]
- 29.Kim D, Langmead B, Salzberg SL. HISAT: a fast spliced aligner with low memory requirements. Nat Methods. 2015;12:357–360. doi: 10.1038/nmeth.3317. [DOI] [PMC free article] [PubMed] [Google Scholar]
- 30.Anders S, Pyl PT, Huber W. HTSeq--a Python framework to work with high-throughput sequencing data. Bioinformatics. 2015;31:166–169. doi: 10.1093/bioinformatics/btu638. [DOI] [PMC free article] [PubMed] [Google Scholar]
- 31.Li H, et al. The Sequence Alignment/Map format and SAMtools. Bioinformatics. 2009;25:2078–2079. doi: 10.1093/bioinformatics/btp352. [DOI] [PMC free article] [PubMed] [Google Scholar]
- 32.Jun G, et al. Detecting and Estimating Contamination of Human DNA Samples in Sequencing and Array-Based Genotype Data. Am J Hum Genet. 2012;91:839–848. doi: 10.1016/j.ajhg.2012.09.004. [DOI] [PMC free article] [PubMed] [Google Scholar]
- 33.Love MI, Huber W, Anders S. Moderated estimation of fold change and dispersion for RNA-seq data with DESeq2. Genome Biol. 2014;15 doi: 10.1186/s13059-014-0550-8. [DOI] [PMC free article] [PubMed] [Google Scholar]
- 34.Dixon P. VEGAN, a package of R functions for community ecology. J Veg Sci. 2003;14:927–930. [Google Scholar]
- 35.Fang H, Knezevic B, Burnham KL, Knight JC. XGR software for enhanced interpretation of genomic summary data, illustrated by application to immunological traits. Genome Med. 2016;8 doi: 10.1186/s13073-016-0384-y. [DOI] [PMC free article] [PubMed] [Google Scholar]
- 36.The ULTRA-DD Consortium et al. A genetics-led approach defines the drug target landscape of 30 immune-related traits. Nat Genet. 2019;51:1082–1091. doi: 10.1038/s41588-019-0456-1. [DOI] [PMC free article] [PubMed] [Google Scholar]
- 37.McCarthy DJ, Campbell KR, Lun ATL, Wills QF. Scater: pre-processing, quality control, normalization and visualization of single-cell RNA-seq data in R. Bioinformatics. 2017:btw777. doi: 10.1093/bioinformatics/btw777. [DOI] [PMC free article] [PubMed] [Google Scholar]
- 38.LLun AT, Bach K, Marioni JC. Pooling across cells to normalize single-cell RNA sequencing data with many zero counts. Genome Biol. 2016;17 doi: 10.1186/s13059-016-0947-7. [DOI] [PMC free article] [PubMed] [Google Scholar]
- 39.Huber W, et al. Orchestrating high-throughput genomic analysis with Bioconductor. Nat Methods. 2015;12:115–121. doi: 10.1038/nmeth.3252. [DOI] [PMC free article] [PubMed] [Google Scholar]
- 40.Lun ATL, McCarthy DJ, Marioni JC. A step-by-step workflow for low-level analysis of single-cell RNA-seq data with Bioconductor. F1000Research. 2016;5:2122. doi: 10.12688/f1000research.9501.1. [DOI] [PMC free article] [PubMed] [Google Scholar]
- 41.Dahlin JS, et al. A single-cell hematopoietic landscape resolves 8 lineage trajectories and defects in Kit mutant mice. Blood. 2018;131:e1–e11. doi: 10.1182/blood-2017-12-821413. [DOI] [PMC free article] [PubMed] [Google Scholar]
- 42.Stuart T, et al. Comprehensive Integration of Single-Cell Data. Cell. 2019;177:1888–1902.:e21. doi: 10.1016/j.cell.2019.05.031. [DOI] [PMC free article] [PubMed] [Google Scholar]
Associated Data
This section collects any data citations, data availability statements, or supplementary materials included in this article.
Supplementary Materials
Data Availability Statement
All sequencing data will be made freely available to organisations and researchers to conduct research in accordance with the UK Policy Framework for Health and Social Care Research via a Data Access Agreement. Sequence data has been deposited at the European Genome-phenome Archive (EGA), which is hosted by the EBI and the CRG, under accession number EGAS00001004081. Patient anonymized raw flow cytometry data will be promptly made freely accessible for download from the MRC WIMM server on application.
Scripts used in the analysis and figure synthesis are available upon request and will be uploaded to the Fairfax group bitbucket account: https://bitbucket.org/Fairfaxlab/identification-of-peripheral-cd8-t-cell-subsets-associated/src/master/


