Abstract
Climate change affects human health; however, there have been no large-scale, systematic efforts to quantify the heat-related human health impacts that have already occurred due to climate change. Here, we use empirical data from 732 locations in 43 countries to estimate the mortality burdens associated with the additional heat exposure that has resulted from recent human-induced warming, during the period 1991-2018. Across all study countries, we find that 37.0% (range 20.5-76.3%) of warm-season heat-related deaths can be attributed to anthropogenic climate change and that increased mortality is evident on every continent. Burdens varied geographically but were of the order of dozens to hundreds of deaths per year in many locations. Our findings support the urgent need for more ambitious mitigation and adaptation strategies to minimize the public health impacts of climate change.
Human activity has already changed the climate1. The world is now an average of ~1°C above the pre-industrial era, although with substantial geographic heterogeneity; several high-population regions have warmed by >2 °C, while others have experienced relatively little change1. An immediate and direct impact of climate change is through human exposure to high outdoor temperatures, which is associated with morbidity and an increased risk of premature death (mortality)2–4. Although several studies have projected the impacts of heat exposure under different potential future climate scenarios5,6, there have been no systematic, large-scale studies quantifying the heat-related health burdens attributable to climate change that have already occurred.
Detection and attribution studies evaluate the contribution of different factors, including anthropogenic forcings, to observed changes in climate and weather7,8. These studies are often conducted in the climate science disciplines and rarely take the additional step of estimating associated human health impacts9–11. Here, we take that step and quantify the contribution of human-induced warming to the heat-related mortality burden in 732 locations from 43 countries over the period 1991–2018. We do so by applying state-of-the-art methods from climate change epidemiology to the largest database ever assembled on weather and health and the latest climate simulations carried out in support of attribution and detection studies. To our knowledge, this is the largest attribution study to date on the health impacts of climate change.
Attributing heat-related mortality to climate change
Our analysis proceeded in two steps. In the first step, we applied cutting-edge time-series regression techniques to observed temperature and mortality data from all 732 locations (Table 1 and Supplementary Tables 1 and 2) to estimate location-specific exposure-response functions12–15. These functions characterize the complex relationship between daily mean temperature and mortality from all causes (or non-external causes) by simultaneously accounting for the nonlinear and delayed dependencies typically found in this type of assessment2. The functions were estimated using an extension of the widely applied two-stage design that uses a mixed model approach to properly account for the hierarchical structure of the data (Methods)12–14. As described in detail in the Methods, a first-stage model estimates associations for each location, which are then pooled in a meta-analysis (the second stage). The observed temperature and mortality data were collected through the Multi-Country Multi-City (MCC) Collaborative Research Network, the largest weather and health data consortium to date (https://mccstudy.lshtm.ac.uk). Supplementary Table 1 provides a brief description of the observed MCC Collaborative Research Network temperature and mortality series, including the data sources and level of aggregation (city, metropolitan area or small region). The data used in the present study consisted of counts of daily mortality from all causes or non-external causes only (International Classification of Diseases, ICD-9: 0-799; ICD-10: A00-R99) and daily mean temperature (°C). The analysis was limited to the warm season, defined as the four warmest consecutive months in each location, to focus on heat-related mortality only (see Supplementary Table 2 for selected months in each location). The analysis included 29,936,896 deaths across all 732 locations from 43 countries in overlapping periods between 1991 and 2015 (Table 1). The study countries vary widely in terms of local climate, ranging from average warm-season temperatures of ~15 °C in countries of North and Central Europe and Canada to much hotter weather >25 °C in South Asia, the Middle East and parts of Central and South America.
Table 1. Summary of the observed temperature and mortality data for the 732 locations during the warm season.
| Region | Country | Locations (n) | Data period | Total deaths (n) | Daily deaths (median [IQR]) | Daily mean temperature (median [IQR]) |
|---|---|---|---|---|---|---|
| Australia | Australia | 3 | 1991–2009 | 311,185 | 45.3 [40.0; 51.0] | 21.8 [20.2; 23.9] |
| North America | Canada | 26 | 1991–2015 | 999,566 | 12.5 [10.1; 14.8] | 17.8 [15.1; 20.2] |
| North America | USA | 210 | 1991–2006 | 5,978,402 | 14.4 [12.2; 16.9] | 23.2 [20.9; 25.3] |
| Caribbean and Central America | Costa Rica | 1 | 2000–2016 | 9,485 | 4.0 [3.0; 6.0] | 23.3 [22.7; 24.0] |
| Caribbean and Central America | Guatemala | 1 | 2009–2016 | 20,826 | 21.0 [18.0; 25.0] | 20.5 [19.7; 21.2] |
| Caribbean and Central America | Mexico | 10 | 1998–2014 | 921,711 | 43.8 [38.1; 50.2] | 22.4 [20.9; 23.8] |
| Caribbean and Central America | Panama | 1 | 2013–2016 | 3,895 | 8.0 [6.0; 10.0] | 28.7 [27.9; 29.4] |
| South America | Argentina | 3 | 2005–2015 | 205,651 | 51.3 [46.1; 57.0] | 23.8 [21.7; 26.0] |
| South America | Brazil | 18 | 1997–2011 | 1,091,290 | 33.9 [29.8; 38.6] | 26.1 [25.2; 27.0] |
| South America | Chile | 4 | 2004–2014 | 98,028 | 27.5 [24.2; 31.2] | 18.3 [16.6; 19.7] |
| South America | Colombia | 5 | 1998–2013 | 322,750 | 32.8 [28.4; 37.0] | 23.9 [23.1; 24.6] |
| South America | Ecuador | 2 | 2014–2016 | 21,729 | 30.0 [26.0; 34.5] | 21.7 [21.0; 22.3] |
| South America | Paraguay | 1 | 2004–2016 | 12,665 | 8.0 [6.0; 10.0] | 27.2 [25.6; 28.9] |
| South America | Peru | 18 | 2008–2014 | 208,060 | 13.4 [11.0; 16.0] | 19.4 [18.6; 20.2] |
| South America | Uruguay | 1 | 2012–2016 | 45,487 | 75.0 [68.0; 81.0] | 24.3 [21.6; 26.3] |
| Northern Europe | Estonia | 5 | 1997–2015 | 46,094 | 3.8 [2.6; 5.2] | 15.4 [13.1; 17.8] |
| Northern Europe | Finland | 1 | 1994–2014 | 48,810 | 19.0 [16.0; 22.0] | 15.7 [13.2; 18.1] |
| Northern Europe | Ireland | 6 | 1991–2007 | 222,228 | 17.5 [15.0; 20.7] | 14.3 [12.9; 15.7] |
| Northern Europe | Norway | 1 | 1991–2016 | 40,054 | 13.0 [10.0; 15.0] | 13.6 [11.4; 15.7] |
| Northern Europe | Sweden | 3 | 1991–2016 | 215,611 | 22.3 [19.3; 25.7] | 16.3 [14.1; 18.4] |
| Northern Europe | UK | 70 | 1991–2016 | 1,781,605 | 7.8 [6.2; 9.6] | 15.8 [14.1; 17.5] |
| Western Europe | France | 18 | 2000–2014 | 512,911 | 15.3 [12.9; 17.8] | 19.2 [17.1; 21.4] |
| Western Europe | Germany | 12 | 1993–2015 | 975,429 | 28.5 [24.8; 32.6] | 17.2 [14.7; 20.0] |
| Western Europe | Netherlands | 4 | 1995–2016 | 953106 | 88.2 [81.5; 95.6] | 16.3 [14.5; 18.5] |
| Western Europe | Switzerland | 8 | 1995–2013 | 75,022 | 3.9 [2.5; 5.3] | 18.0 [15.4; 20.6] |
| Eastern Europe | Czech Republic | 4 | 1994–2015 | 226,645 | 20.8 [17.5; 24.0] | 17.4 [14.5; 20.3] |
| Eastern Europe | Moldova | 4 | 2001–2010 | 18,828 | 3.8 [2.8; 4.8] | 21.0 [18.1; 23.3] |
| Eastern Europe | Romania | 8 | 1994–2016 | 300,031 | 13.1 [10.8; 15.6] | 20.6 [18.0; 23.0] |
| Southern Europe | Greece | 1 | 2001–2010 | 90,845 | 73.0 [66.0; 82.0] | 27.6 [24.6; 29.6] |
| Southern Europe | Italy | 11 | 1991–2010 | 224,176 | 11.9 [9.7; 14.0] | 23.4 [20.9; 25.5] |
| Southern Europe | Portugal | 5 | 1991–2016 | 351,284 | 22.0 [18.6; 25.0] | 21.1 [19.3; 23.2] |
| Southern Europe | Spain | 52 | 1991–2014 | 884,307 | 5.6 [4.2; 7.1] | 22.4 [20.2; 24.5] |
| Eastern Asia | China | 14 | 1996–2015 | 336,900 | 38.4 [33.5; 44.6] | 25.0 [22.7; 27.1] |
| Eastern Asia | Japan | 47 | 1991–2015 | 7,864,627 | 53.8 [46.6; 62.5] | 24.8 [22.3; 27.1] |
| Eastern Asia | South Korea | 36 | 1997–2016 | 867,142 | 9.6 [7.9; 11.6] | 23.3 [21.2; 25.5] |
| Eastern Asia | Taiwan | 3 | 1994–2014 | 385,617 | 50.0 [44.0; 56.0] | 28.7 [27.6; 29.7] |
| Southern and Western Asia | Iran | 1 | 2004–2013 | 40,824 | 32.0 [26.0; 40.0] | 26.4 [24.0; 28.3] |
| Southern and Western Asia | Kuwait | 1 | 2000–2016 | 22,347 | 11.0 [8.0; 13.0] | 38.1 [36.3; 39.6] |
| Southeastern Asia | Philippines | 4 | 2006–2010 | 90,034 | 36.5 [32.2; 41.2] | 29.1 [28.4; 29.8] |
| Southeastern Asia | Thailand | 61 | 1999–2008 | 610,780 | 7.9 [6.1; 10.1] | 29.1 [28.1; 30.0] |
| Southeastern Asia | Vietnam | 2 | 2009–2013 | 37,677 | 37.5 [33.5; 42.5] | 29.5 [28.5; 30.4] |
| Africa | South Africa | 45 | 1997–2013 | 2,454,409 | 26.3 [20.7; 31.9] | 22.3 [20.6; 23.9] |
| Totala | 732 | 1991–2016 | 29,936,896 | 9.0 [4.0; 22.0] | 22.6 [18.9–25.6] |
IQR, interquartile range.
Estimates derived from the city-specific summaries.
In the second step, we used the estimated exposure-response functions to compute the heat-related mortality burden between 1991 and 2018 for each location under two scenarios: a factual scenario consisting of simulations of historical climate (all climate forcings) and a counterfactual scenario where climate simulations are driven by natural forcings only, thus approximating the climate that would have occurred in a world without human-induced or anthropogenic climate change16. A more detailed description of the scenarios and how the impacts were quantified is provided in the following paragraphs and Methods.
The factual and counterfactual scenarios
The two scenarios (factual and counterfactual) were based on simulation runs from the Detection and Attribution Model Intercomparison Project (DAMIP)17,18. DAMIP is the component of the Coupled Model Intercomparison Project Phase 6 (CMIP6) that aims to assess the individual contributions of different external factors, including anthropogenic forcings, on past and future changes in global and regional climate. We used pairs of factual–counterfactual ensemble runs of daily mean temperature between 1991 and 2018 from ten general circulation models (ACCESS-ESM1-5, CanESM5, CESM2, FGOALS-g3, GFDL-ESM4, HadGEM3-GC31-LL, IPSL-CM6A-LR, MIROC6, MRI-ESM2-0 and NorESM2-LM; Supplementary Table 3) for which suitable data were available at the time of the analysis. Specifically, for the factual scenario, we used CMIP6 historical simulations merged with SSP2-4.5 runs of each model which accounts for anthropogenic and natural forcings. The corresponding counterfactual consists of simulations of the historical climate driven with natural forcings only (that is, anthropogenic forcings are absent) derived from the ‘hist-nat’ experiment. Location-specific temperature series were extracted from the gridded products on the basis of the corresponding centroid and bias-corrected following a method described elsewhere19. The burden attributable to recent human-induced climate change is defined as the difference in heat-related mortality during the warm season between the two scenarios.
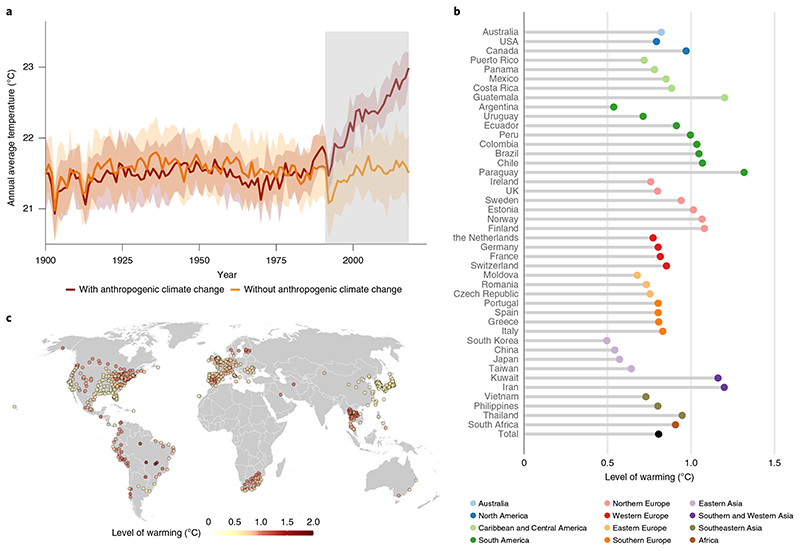
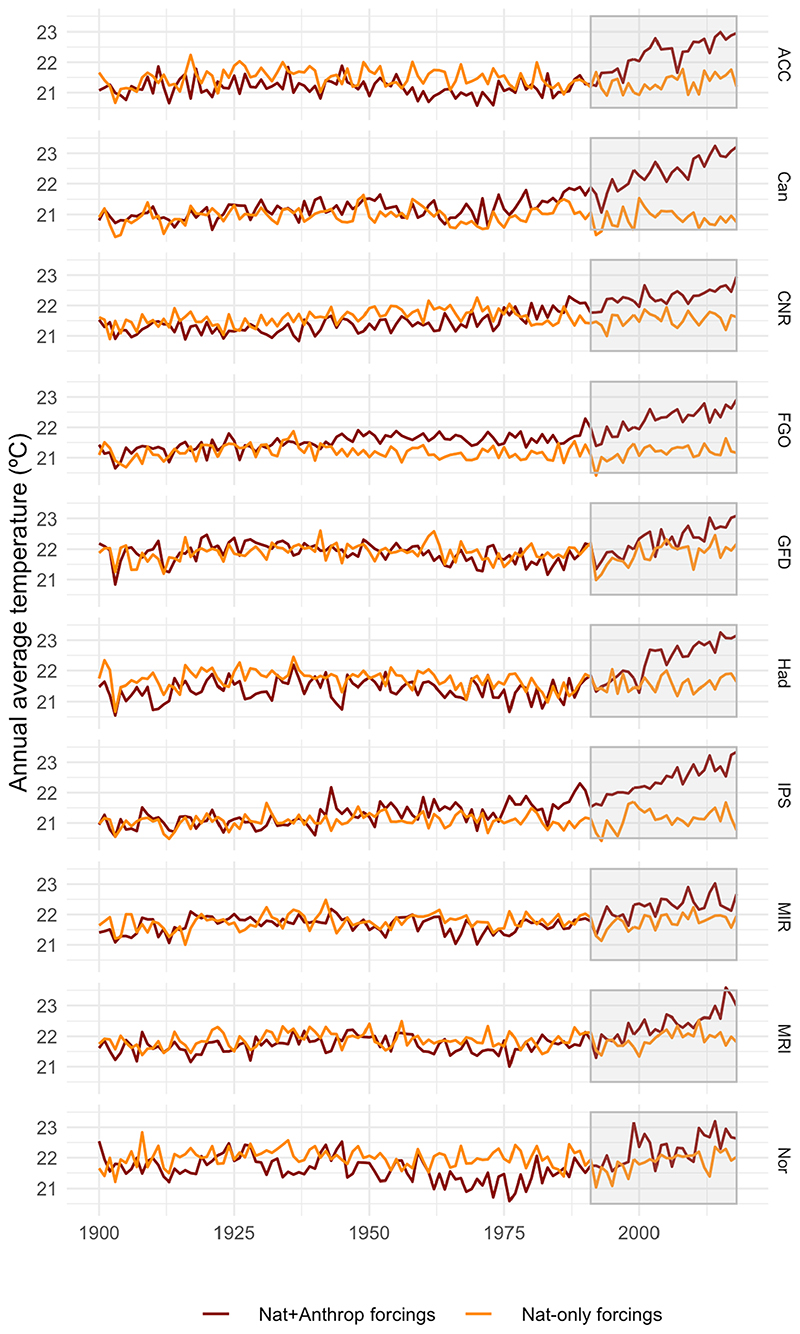
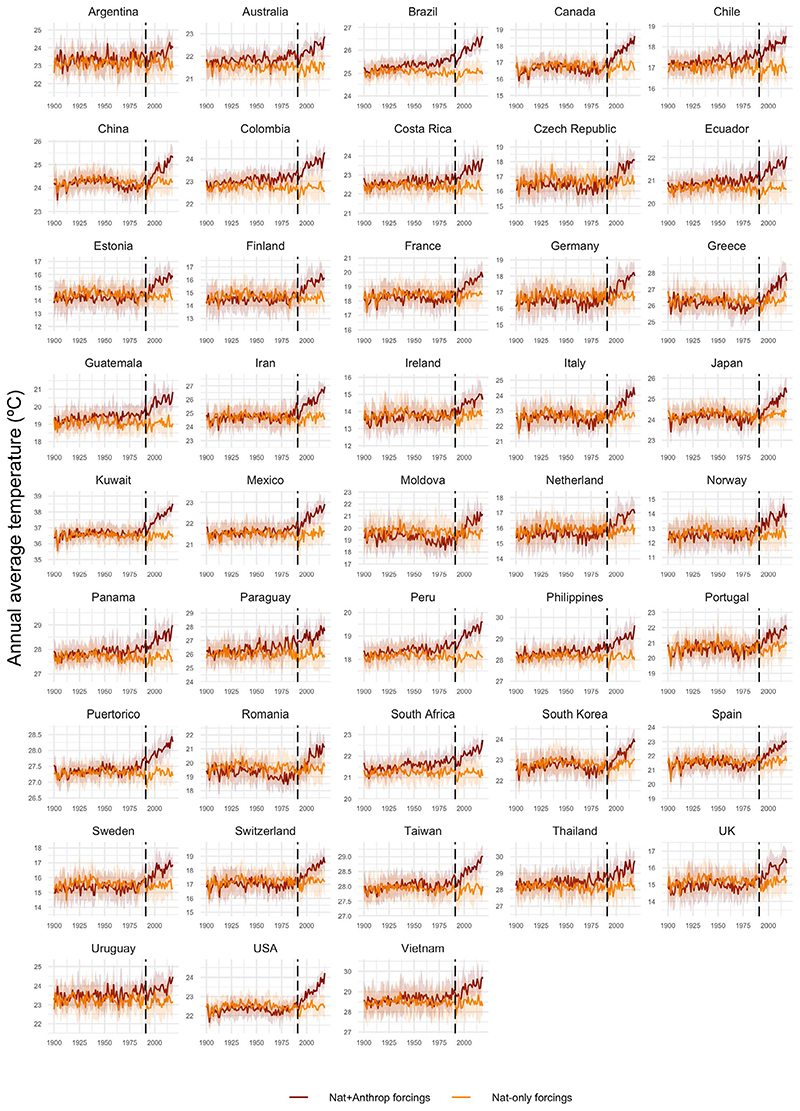
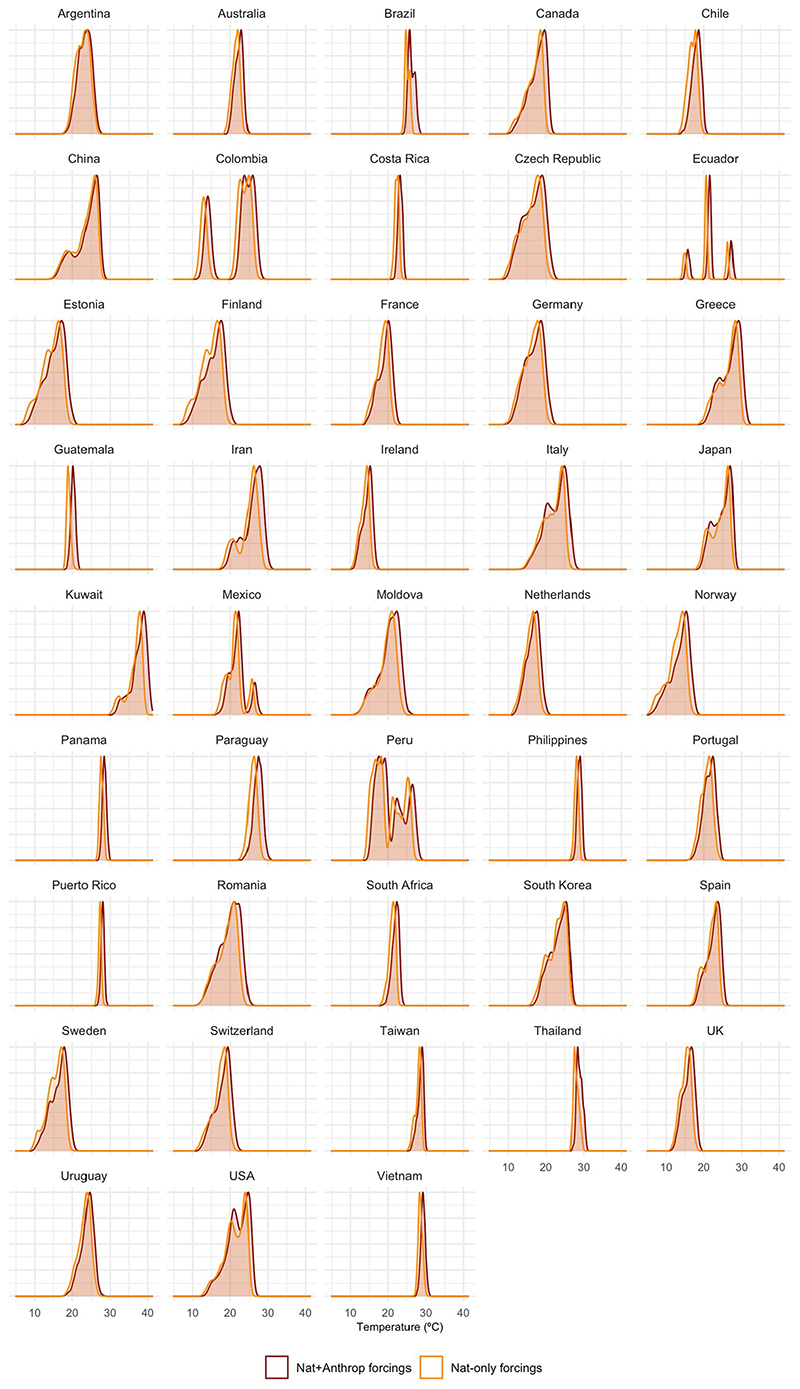
Figure 1 reports a summary description of the simulated warm-season mean temperatures in the factual (accounting for natural and anthropogenic forcings) and counterfactual (accounting for natural forcings only) scenarios. Across the 732 locations, the annual average temperature in the warm season in the factual scenario increased from nearly 21.5 °C at the end of the twentieth century to almost 23 °C in the 2010s, whereas in the counterfactual scenario, annual temperatures remained relatively stable at around 21.5 °C (Fig. 1a, model-specific time-series plots are shown in Extended Data Fig. 1). Similar patterns of warming over time can be observed across countries, although with variable magnitude (Extended Data Fig. 2). Warming is also reflected in the overall temperature difference between scenarios over the study period (1991–2018), with ~0.8 °C increase on average and strong differences across regions of the world (Fig. 1b and Extended Data Fig. 3). For example, the country-specific average temperature increase ranged from ~0.5 °C in Argentina to >1 °C in Iran, Kuwait, some countries in South and Central America and North of Europe (Fig. 1b). Figure 1c shows the temperature differences for each of the 732 study locations, with some of the largest effects seen in Brazil and western locations in South America, Southern Europe and Thailand.
Fig. 1. Temperature modelled under the factual (with both anthropogenic and natural forcings) and counterfactual (with only natural forcings) scenarios.
a, Warm-season average temperature since 1900, including the 1991–2018 study period (shaded) across the 732 locations. b, Temperature differences between scenarios in the 43 study countries, respectively, during the study period (warm season only). Country results are based on included locations only. c, Average temperature difference between scenarios during the study period in the 732 study locations (warm season only).
Location-specific temperature-mortality relationships
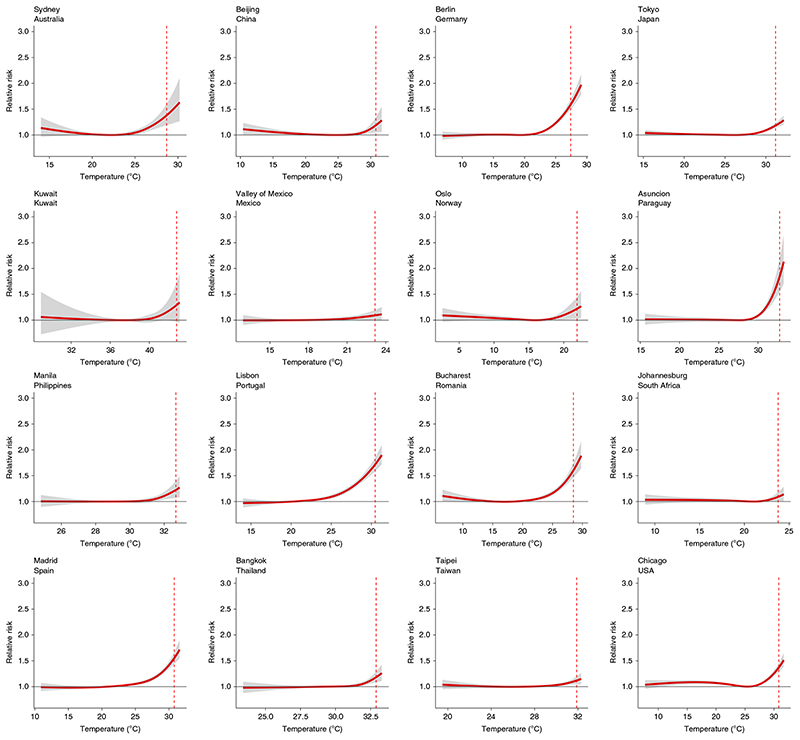
Exposure-response associations were estimated for all 732 locations. The curves for 16 representative locations—including at least one from each (inhabited) continent—are presented in Fig. 2. The functions represent the cumulative relative risk of death over a 10-d lag period for each temperature value in the observed range. Prior research has demonstrated that heat risks tend to occur quickly after exposure and then disappear within 10 d (ref. 20). Relative risk is a measure of association which represents the change in mortality risk at any given temperature compared with a reference temperature, which in this case corresponds to the point of minimum mortality (the temperature value for which the risk of death is lowest), often referred as the ‘optimum’. In Chicago, for example, a 31 °C day (corresponding to the 99th percentile temperature of the warm season) was associated with a 36% (95% confidence interval (CI): 28–47%) increase in mortality risk from all causes, whereas in Johannesburg the 99th percentile temperature (24 °C) was associated with a 9% (95% CI: 0.5–17%) increase and in Berlin (28 °C) a 57% (95% CI: 47–67%) increase.
Fig. 2. Heat-mortality associations in 16 representative locations.
Exposure-response associations are estimated as best linear unbiased predictions (BLUPs; Methods) and reported as relative risks (with 95% CI, shaded grey) for a cumulative 10-d lag of warm-season temperature, versus the optimum temperature (corresponding to the temperature of minimum mortality). For comparison across locations, vertical red dotted lines indicate the 99th percentile of location-specific warm-season temperature.
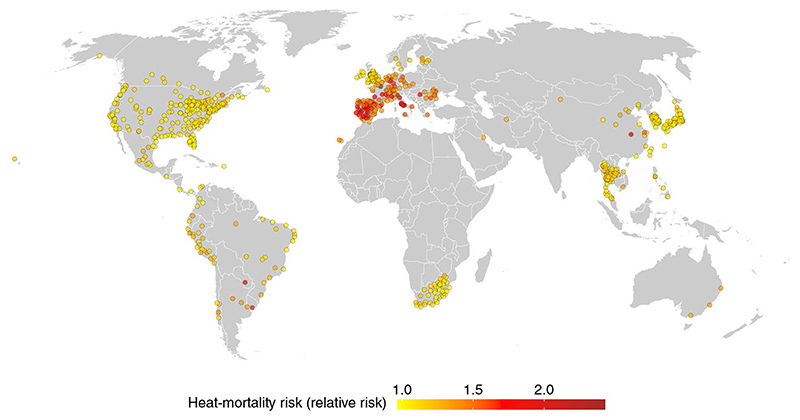
The displayed curves indicate potential geographical patterns in the heat-mortality relationship across and between regions, a finding particularly evident in Fig. 3, which summarizes the exposure-response functions for all 732 locations, again as the relative risk of death at the 99th percentile temperature versus the optimum. Heat-related mortality risks ranged from 0.97 to 2.47 but with only 28 of the 732 locations <1. Larger risks are observed in the European region, in particular the Western and Central area of the continent, while smaller estimates <1.5 were found in most locations in Asia and the Americas. All risks should be interpreted as an approximation of the average heat-mortality association in each location across the study period.
Fig. 3. Heat-related mortality associations in the 732 locations.
These are expressed as the estimated relative risk at the 99th percentile of the location-specific warm-season temperature distribution using the temperature of minimum mortality as reference. Estimates are represented by the location-specific BLUPs (Methods).
Heat-mortality impacts attributed to climate change
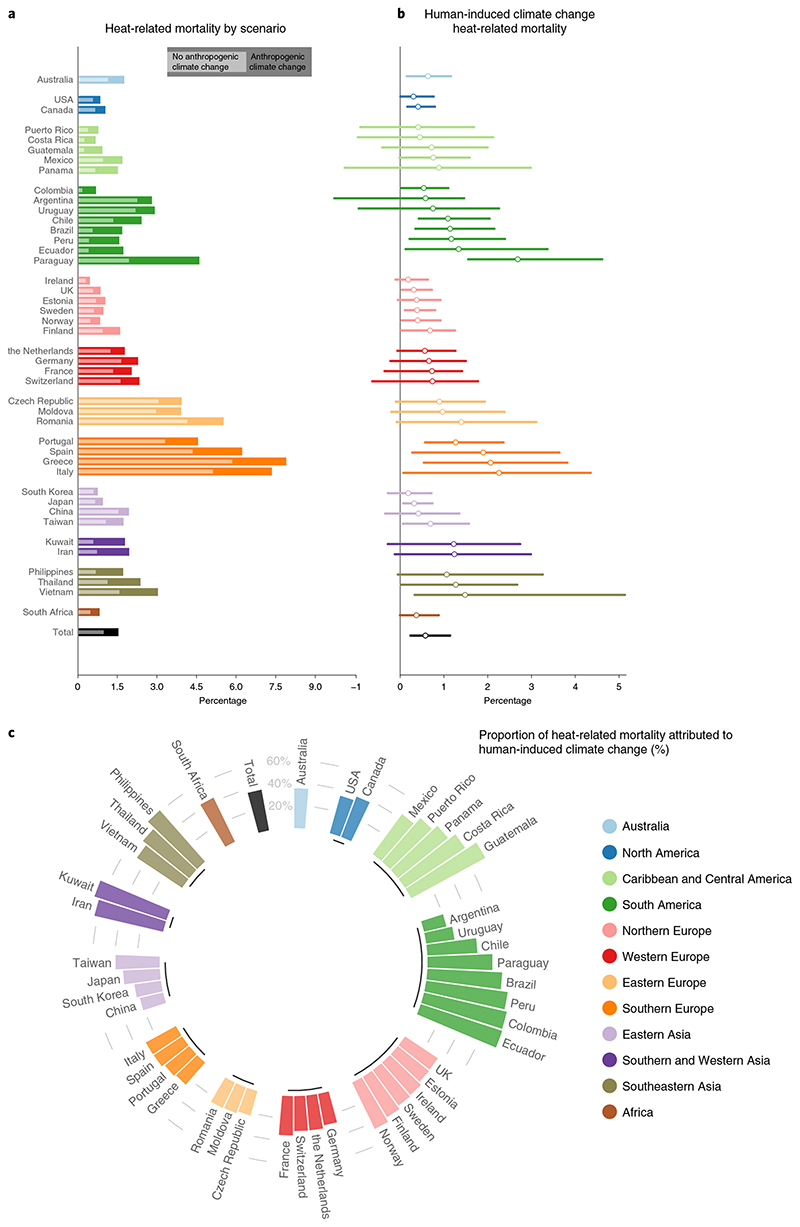
The estimated heat-related mortality burden by country for each scenario is derived by applying the location-specific exposure-response functions to the corresponding modelled location-specific daily mean warm-season temperature series and average baseline mortality between 1991 and 2018 (see Methods for further details on the estimation of mortality burden). Results are reported as heat-related mortality fractions estimated as the number of deaths attributed to heat (days above the optimum) divided by the total number of deaths during the warm season in each location. The level of uncertainty of the impact estimates is expressed in terms of 95% CI, which account for both the statistical uncertainty when estimating the exposure-response function and the variability in the temperature series across model-specific simulations (see Methods section for further details on the quantification of uncertainty). Across all locations, heat-related mortality in the factual scenario amounted to an average of 1.56% (95% CI, 0.62–2.41) of all warm-season deaths (Fig. 4a). The country-specific estimates ranged from <1% (for example, the USA, Colombia, Sweden, Norway, UK, Japan and South Korea) to >5% in countries of Southern Europe (Supplementary Table 4). As expected, there was less heat-related mortality in all countries under the counterfactual scenario, with an average estimate of 0.98% (95% CI, 0.26–1.80) across all locations.
Fig. 4. Heat-related mortality and the contribution of human-induced climate change, 1991–2018.
a, Heat-related mortality as a percentage of total mortality during warm season (mortality fraction (%)) estimated in the 43 countries under the factual (all anthropogenic and natural forcings (shaded)) and counterfactual (natural forcings only (unshaded)) climate scenarios. b, Percentage of total deaths during warm season attributable to heat-related human-induced climate change, estimated as the difference in heat-related mortality in the factual compared to the counterfactual scenario, with the corresponding 95% CI. c, Proportion of heat-related mortality attributable to human-induced climate change estimated as the fraction of heat-related mortality in the factual scenario that results from the contribution of anthropogenic forcings.
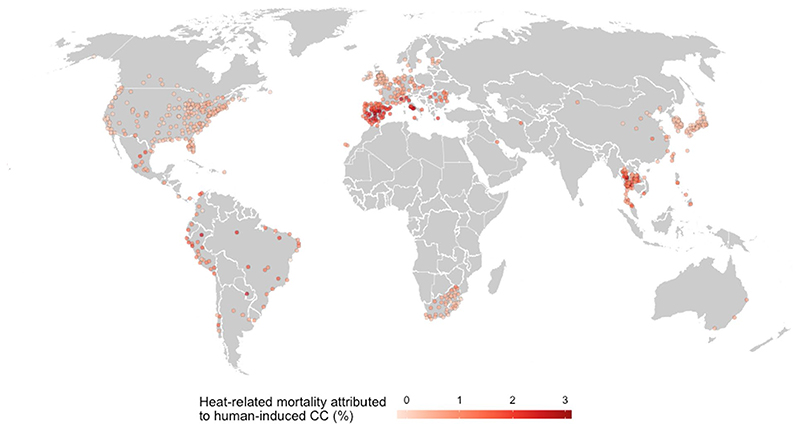
The difference between the factual and counterfactual scenarios is interpretable as the proportion of total deaths during the warm season attributable to human-induced climate change. The overall estimate that 0.58% (95% CI: 0.24–1.14) of all warm-season deaths are attributable to climate change translates to an average of 9,702 (95% CI, 4,005–19,135) deaths across the 732 locations (see Supplementary Table 5 for location-specific estimates). Country-specific estimates (Fig. 4b) show a clear north-south pattern within regions; human-induced climate change attributable deaths are <1% of total deaths for countries in northern subregions of America, Europe and Asia, while larger contributions were observed in southern Europe, southern and western Asia and some countries in southeast Asia and South America. This geographical gradient can be also observed in Extended Data Fig. 4 that displays the location-specific estimates.
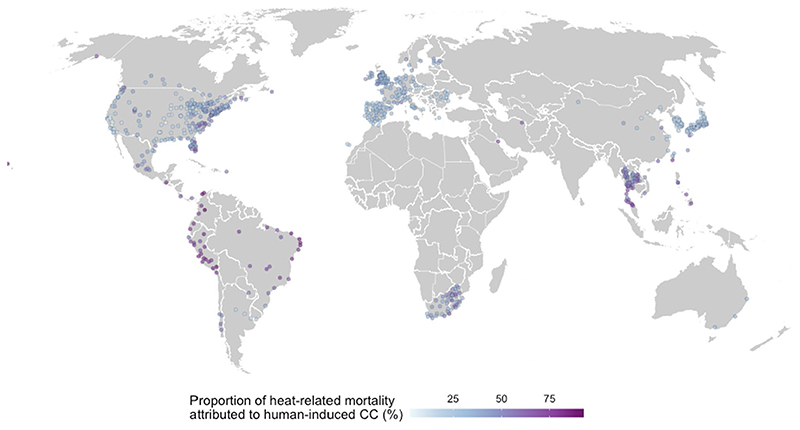
To further contextualize the results, Fig. 4c displays the percentage of warm-season heat-related mortality (as opposed to total mortality) that is attributable to human-induced climate change. The overall estimate is 37.0% but this percentage varied widely across subregions and countries. The largest climate change-induced contributions (>50%) were in southern and western Asia (Iran and Kuwait), southeast Asia (Philippines and Thailand) and several countries in Central and South America (see Supplementary Tables 4 and 5 and Extended Data Fig. 5 for location-specific estimates).
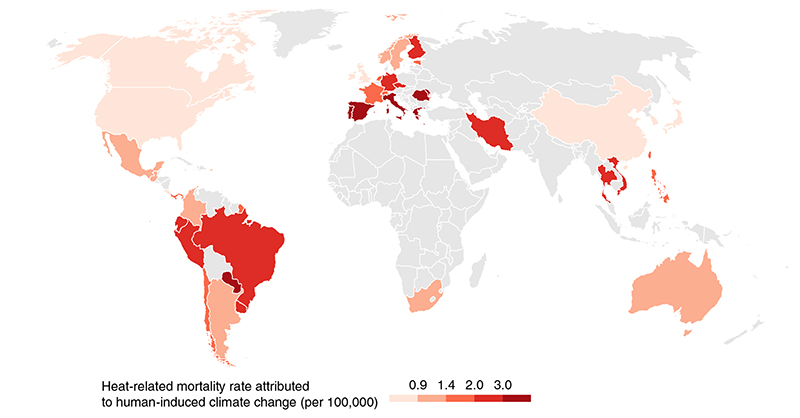
Fig. 5. Heat-related mortality rate attributable to human-induced climate change, 1991–2018.
The estimated rate in each country is based on the attributable fractions for the location(s) within the country. The rates indicate the total burden in the population and are thus a complementary measure of impact to that of Fig. 4b, which reports the attributable fraction. For example, the rate shown here for Brazil is relatively modest, whereas the fraction is high; the opposite is true in a country like Greece.
Taken together, our findings demonstrate that a substantial proportion of total and heat-related deaths during our study period can be attributed to human-induced climate change, which is in line with the small number of existing attribution studies on this topic, mainly from Europe10,21. Unlike those studies, however, the wide and heterogeneous geographical scope of our dataset allowed us to assess spatial patterns in the estimated impacts and to identify areas that have already been disproportionately affected. Impacts were evident in all of our study countries, which included locations on every inhabited continent (Fig. 4 and Extended Data Figs. 4 and 5). As locations differ in size, Fig. 5 displays the heat-related deaths attributable to human-induced climate change as a mortality rate, indicating a relatively heavy population-level burden in southern and eastern Europe, where rates in several countries are >6 per 100,000 population over the 1991–2018 period compared to the study average of 2.2 per 100,000.
Some limitations of this study should be acknowledged. Despite the extensive spatial extent of our study, we were not able to include locations in all world regions—for example, large parts of Africa and South Asia—due to a lack of the empirical data needed to estimate the exposure-response functions. For reference, our overall estimate that heat exposure from human-induced climate change is responsible for ~0.6% of total warm-season deaths would translate to more than a hundred thousand deaths per year if applied globally. However, we caution against this sort of crude extrapolation considering the variation we observed in location-specific estimates of attributable fractions (Fig. 4, Extended Data Fig. 4 and Supplementary Table 5). Whether the excluded regions would have high or low heat-related mortality burdens is difficult to predict and may depend on factors including the level of warming, the built environment and the age structure and underlying health status of the population (amongst other factors)11,22,23. Additionally, estimates should not necessarily be considered representative of country-specific average effects, as the study included a sample of locations which, in some cases, were restricted to one or two cities (for example, Finland and Iran). Another limitation is the use of a single, time-invariant exposure-response function in each location. This approach can be interpreted as an approximation of the average effect across the study period in each location but would not capture the precise dynamics of any potential attenuation in heat-related risks, which has been reported in some locations24,25.
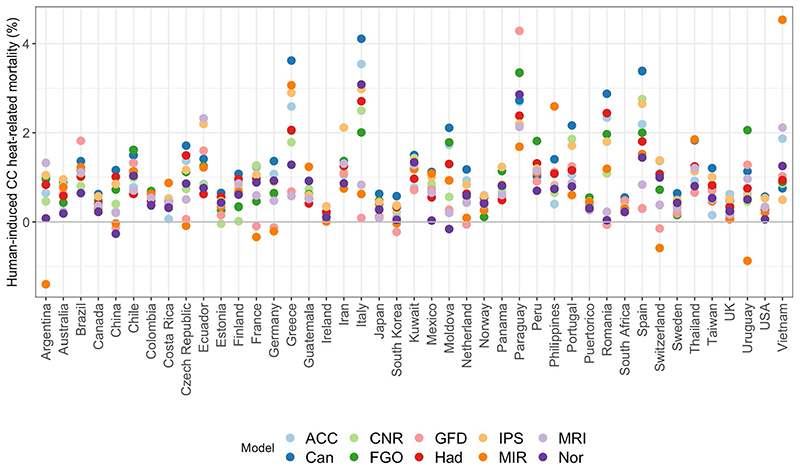
We have conducted this large attribution study on the health impacts of climate change by applying cutting-edge epidemiological modelling techniques to the most expansive database ever assembled on weather and health (the MCC Collaborative Research Network database) and the latest temperature simulations developed for climate change attribution and detection studies (DAMIP data). The methodology allowed us to properly account for the uncertainty that arose from estimating the exposure-response functions and the variability across climate models (see Extended Data Fig. 6 for the model-specific estimates for heat-related mortality). We have demonstrated that health burdens from anthropogenic climate change are occurring, are geographically widespread and are non-trivial; in many locations, the attributable mortality is already on the order of dozens to hundreds of deaths each year (Supplementary Table 5). This has occurred with average global temperature increase of only ~1 °C, which is lower than even the strictest climate targets outlined in the Paris Agreement (1.5–2 °C) and a fraction of what may occur if emissions are left unchecked26. As a result, our findings provide further evidence of the potential benefits of adopting strong mitigation policies to reduce future warming and of enacting adaptation interventions to protect populations from the adverse consequences of heat exposure.
Online content
Any methods, additional references, Nature Research reporting summaries, source data, extended data, supplementary information, acknowledgements, peer review information; details of author contributions and competing interests; and statements of data and code availability are available at https://doi.org/10.1038/s41558–021-01058-x.
Methods
Observed temperature and mortality data: the MCC Collaborative Research Network database
We extracted observed daily temperature and mortality data for the 732 locations from the MCC Collaborative Research Network database (http://mccstudy.lshtm.ac.uk/). Supplementary Table 1 provides information on data collection for each country, while descriptive statistics for each location are reported in Supplementary Table 2. Data used in the present study consisted of counts of daily mortality from all causes or non-external causes (ICD-9: 0-799; ICD-10: A00-R99) and daily mean temperature (°C). The length of the observed data varied by location but included part or all of our study period (1 January 1991 to 31 December 2018). As we were interested in heat-related mortality, we restricted the data series to the warmest four consecutive months in each location (Supplementary Table 2).
Description of the factual and counterfactual climate datasets
We defined two scenarios, one representing the historical (factual) climate and an alternative (counterfactual) that approximates a hypothetical world without anthropogenic climate change. The temperature series for these scenarios were extracted from the DAMIP (http://damip.lbl.gov) climate database. DAMIP is part of the CMIP6 and was specifically designed to allow for the assessment of the individual contributions of various external factors to past and future changes in global and regional climate17,18. This study included the ensemble member simulations of ten general circulation models included in CMIP6 from two different experiments for which relevant data were available at the time of the analysis. Information about the models and selected simulations are shown in Supplementary Table 3. For the factual scenario, we used historical climate simulations (‘hist’) of mean daily temperature available up to 2014 merged with simulations of ssp2rcp45 for the remaining years until 2018. These simulations are driven by all types of natural and anthropogenic forcings, which mimics the actual historical climate. The corresponding counterfactual climate data consisted of the simulations of the ‘hist-nat’ experiment, for which only natural forcings are considered (solar irradiance and stratospheric aerosols). The counterfactual climate dataset approximates a hypothetical climate with no human influences (that is, an absence of anthropogenic climate change) since the beginning of the twentieth century where only natural forcings were present. This approach allows for a formal distinction between natural and anthropogenic climate change. Location-specific series of daily mean temperature (near surface air temperature—tas) were extracted from the globally gridded datasets (https://esgf-node.llnl.gov/search/cmip6/) and bias-corrected using local weather station data (MCC Collaborative Research Network database) following a method described elsewhere15,27,28. In brief, observed temperature series were used to bias-correct the temperature series in the factual scenario and apply the same correcting factors to the modelled series of the counterfactual scenario.
Description of the epidemiological analysis
We estimated the association between heat and mortality using observed data in each location through a two-stage approach widely applied in multilocation time-series studies.
First stage
To estimate location-specific heat-mortality associations, we performed separate time-series analyses with generalized linear models using observed temperature and mortality data over the four warmest consecutive months in each location (see Supplementary Table 2 for the selected months in each location). We applied a quasi-Poisson regression in which a quasi-likelihood was used to scale the standard deviation of the coefficients proportionally to the potential overdispersion. We modelled the nonlinear and delayed association using distributed-lag nonlinear models (DLNMs), a class of models that can describe the complex nonlinear and lagged dependencies typically found in temperature-mortality studies12. DLNMs account for delayed effects of time-varying exposures and quantify net effects over a predefined lag period. Following the DLNM methodology, we modelled the bidimensional exposure-lag-response association through the combination of two functions defined within a cross-basis term. Specifically, we selected a natural spline function with two internal knots at the 50th and 90th percentile of the warm-season temperature distribution to model the exposure-response curve and a natural spline function with two internal knots at equally spaced values in the log scale over 10 d of lag for the lag-response dimension. Seasonality was modelled with a natural spline with 4 degrees of freedom (d.f.) of day of the year. We introduced an interaction between this spline term and year to allow different seasonal trends across the study period. The model also included a natural spline function of time with aproximately one knot every 10 years to control for long-term trends and an indicator for day of the week. These choices that specify the cross-basis and model terms used to control for long-term and seasonal trends were based on related studies from the MCC Collaborative Research Network20,24. The resulting bidimensional set of coefficients from each location was then reduced across the lag dimension into the overall cumulative exposure-response curve representing the association between heat and mortality across the 10 d of lag13.
Second stage
The location-specific set of reduced coefficients estimated in the first stage were then pooled in a multivariate metaregression model14. This approach provides improved estimates of heat-mortality associations at the location level, defined as best linear unbiased predictions (BLUPs). BLUPs borrow information across units within the same hierarchical level and can offer more accurate estimates, especially in locations with small daily mortality counts or short series. We also included, as metapredictors, country-level gross domestic product, location-specific average temperature and interquartile range and indicators of climatic classification29. We tested the presence of heterogeneity using multilevel extensions of the Cochran Q test and I 2 statistic30. The location-specific associations defined by the BLUPs were used in the quantification of the heat-related mortality impacts. All the analyses were performed in the R software environment (v.3.5.2) using the packages dlnm and mixmeta, which were developed by the authors14,31.
Quantification of heat-related mortality
Finally, we quantified the heat-related mortality in each location during the warm season in each location during the study period of 1991–2018 under both scenarios, following a method we describe in previous work15. For each location-scenario-model-day combination, we computed the number of heat-related deaths on the basis of the corresponding modelled temperature series, daily baseline mortality and the estimated heat-mortality association represented by the location-specific BLUPs16. The daily baseline mortality corresponds to the annual series of total mortality counts derived as the average number of deaths per day of the year in each location. The annual series was then replicated along the study period of 1991–2018. We then estimated the total number of heat-related deaths in each location/scenario for each model and ensemble across the study period by summing the daily mortality contributions when the temperature on a specific day was higher than the location-specific reference temperature. This reference value corresponds to the minimum point of the BLUP curve and represents the optimal temperature value with the lowest mortality risk, often referred to as the minimum mortality temperature. We quantified the uncertainty of the estimates by generating 1,000 samples of the coefficients of the BLUPs (representing the association) through Monte Carlo simulations, assuming a multivariate normal distribution for the estimated spline model coefficients and then generating results for each of the ten models4. We obtained empirical confidence intervals corresponding to the 2.5th and 97.5th percentiles of the empirical distribution of the heat-related mortality impacts across coefficients and models. In this way, the derived empirical confidence intervals account for both the imprecision of the exposure-response function and the inherent variability of the temperature simulations across models in each scenario.
To obtain the contribution of climate change, we subtracted the heat-related mortality estimates in the counterfactual scenario from those in the factual scenario. Finally, we computed the mortality fractions in both scenarios and the estimated difference using the related total number of deaths as the denominator. Climate change attributable heat-related mortality rates for each country were estimated by multiplying the attributable fraction(s) by the corresponding crude mortality rate for each country. These were computed as the average crude mortality rates in each country between 1991 and 2017 (https://datacatalog.worldbank.org/dataset/world-development-indicators) and multiplied by a factor corresponding to the warm-season mortality divided by the total annual mortality in each country.
Extended Data
Extended Data Fig. 1. Time series plots of the warm-season mean daily temperatures in each scenario provided by each model.
The time series plots depict the temporal trends in average warm-season temperatures across the 732 locations included in the study. Factual scenario (with natural and anthropogenic forcings) is depicted in brown, while counterfactual scenario (with natural forcings only) in orange. The grey dark area corresponds to the study period 1991–2018. (ACC: ACCESS-ESM1–5, CAN: CanESM5, CNR: CESM2, FGO: FGOALS-g3, GFD: GFDL-ESM4, HAD: HadGEM3-GC31-LL, IPS: IPSL-CM6A-LR, MIR: MIROC6, MRI: MRI-ESM2–0, Nor: NorESM2-LM).
Extended Data Fig. 2. Time series plots of the warm-season mean daily temperatures in each scenario in the 43 countries included in the study.
As Fig.1, factual scenario (with natural and anthropogenic forcings) is depicted in brown, while counterfactual scenario (with natural forcings only) in orange. The shaded area corresponds to 1 standard deviation across model-specific average estimates. The dashed line shows the start of the study period (1991–2018).
Extended Data Fig. 3. Country-averaged warm-season temperature distributions modelled in each scenario.
As Fig.1, factual scenario (with natural and anthropogenic forcings) is depicted in brown, while counterfactual scenario (with natural forcings only) in orange.
Extended Data Fig. 4. Location-specific heat-related mortality attributed to human-induced climate change (CC) between 1991–2018.
Map with the location-specific estimates of heat-related mortality fractions attributed to human-induced climate change (expressed in %). Estimates ranged between 0.2% and 0.8%, corresponding to the interquartile range, with a maximum value of 3.8%, and 23 locations reported an estimate below 0 (minimum value of −0.1%).
Extended Data Fig. 5. Proportion of heat-related mortality attributed to human-induced climate change (CC), between 1991–2018.
Map with the location-specific estimates of the proportion of heat-related mortality attributed to human-induced climate change (expressed in %). Estimates ranged between 28.6% and 54.2%, corresponding to the interquartile range, with a maximum value of 92%, and 1 location with estimates below 0 (minimum value of −0.1%).
Extended Data Fig. 6. Model-specific estimates of the heat-related mortality attributed to human-induced climate change (CC) for each country, expressed as mortality fraction (%).
The plot shows the model-specific estimates of heat-related mortality fraction attributed to human-induced climate change for each country (1991–2018). ACC: ACCESS-ESM1-5, CAN: CanESM5, CNR: CESM2, FGO: FGOALS-g3, GFD: GFDL-ESM4, HAD: HadGEM3-GC31-LL, IPS: IPSL-CM6A-LR, MIR: MIROC6, MRI: MRI-ESM2-;0, Nor: NorESM2-LM.
Supplementary Material
Acknowledgements
We thank the participants of the ISIMIP Health workshop in Barcelona in November 2018 where this work was discussed for the first time. This study was supported by the Medical Research Council UK (grant no. MR/M022625/1), the Natural Environment Research Council UK (grant no. NE/R009384/1) and the European Union’s Horizon 2020 Project Exhaustion (grant no. 820655). N.S. was supported by the NIEHS-funded HERCULES Center (P30ES019776). Y.H. was supported by the Environment Research and Technology Development Fund of the Environmental Restoration and Conservation Agency, Japan (JPMEERF15S11412). J.J.J.K.J. was supported by Academy of Finland (grant no. 310372). V.H. was supported by the Spanish Ministry of Economy, Industry and Competitiveness (grant no. PCIN-2017-046) and the German Federal Ministry of Education and Research (grant no. 01LS1201A2). J.K. and A.U. were supported by the Czech Science Foundation (grant no. 20-28560S). J.M. was supported by the Fundação para a Ciência e a Tecnologia (FCT) (SFRH/BPD/115112/2016). S.R. and F.d.R. were supported by European Union’s Horizon 2020 Project EXHAUSTION (grant no. 820655) M.H. was supported by the Japan Science and Technology Agency as part of SICORP, grant no. JPMJSC20E4. Y.G. was supported by the Career Development Fellowship of the Australian National Health and Medical Research Council (APP1163693). S.L. was support by the Early Career Fellowship of the Australian National Health and Medical Research Council (APP1109193). Y.L.L.G. was supported by the Taiwan Ministry of Science and Technology (MOST110-2918-I-002-007) as a visiting academic at the University of Sydney.
Footnotes
Author contributions
A.M.VC., A.G., A.T., C.A., Y.G., D.H., M.M. and V.H. were involved in conceptualization. A.M.V.C., A.G. and F.S. designed the methodology. A.M.VC. conducted the formal analysis. A.M.VC., N.G., N.S., F.S., D.R., R.S.D.S., A.T., C.A., Y.G., Y.H., R.A., S.T., M.S.Z.S.C., P.H.N.S., E.L., P.M.C., M.V.O., H.K., S.O., J.K., A.U., H.O., E.I., J.J.J.K.J., N.R., M.P., A.S., K.K., A.A., F.M., A.E., P.G., A.Z., P.M., F.D., M.H., B.A., M.H.D., C.D.V., A.O., D.H., C.A., S.R., F.d.R., G.C.E., X.S., S.S., J.M., I.H.H., S.F., F.A., H.K., W.L., C.I., B.F., M.S.R., Y.L.L.G., B.Y.C., S.L., B.A., A.A., A.Z., J.S., T.N.D., D. V.D. and M.M. were involved in resources and data curation. A.M.V.C., D.R. and N.S. undertook visualization. A.M.V.C., A.G. and N.S. wrote the draft manuscript. A.H., A.M.V.C., N.S., F.S., D.R., R.S.D.S., A.T., C.A., Y.G., Y.H., R.A., S.T., M.S.Z.S.C., P.H.N.S., E.L., P.M.C., M.V.O., H.K., S.O., J.K., A.U., H.O., E.I., J.J.J.K.J., N.R., M.P., A.S., K.K., A. A., F.M., A.E., P.G., A.Z., P.M., F.D., M.H., B.A., M.H.D., C.D.V., A.O., D.H., C.A., S.R., F. d.R., G.C.E., X.S., S.S., J.M., I.H.H., S.F., F.A., H.K., W.L., C.I., B.F., M.S.R., Y.L.L.G., B. Y.C., S.L., B.A., A.A., A.Z., J.S., T.N.D., D.V.D., M.M. and D.H. were involved in revising the manuscript. A.G. supervised the project.
Competing interests
The authors declare no competing interests.
Additional information
Extended data is available for this paper at https://doi.org/10.1038/s41558–021-01058-x.
Supplementary information The online version contains supplementary material available at https://doi.org/10.1038/s41558–021-01058-x.
Correspondence and requests for materials should be addressed to A.M.V.-C. or A.G.
Peer review information Nature Climate Change thanks Katrin Burkart, Daniel Mitchell and the other, anonymous, reviewer(s) for their contribution to the peer review of this work.
Reprints and permissions information is available at www.nature.com/reprints.
Data availability
An example dataset is made available from https://github.com/anavica/mcc_ccattr_NCC and archived in the open repository ‘BORIS’ of the University of Bern under https://doi.org/10.48350/155666.
Code availability
A sample of the code to reproduce the analysis is made available from https://github.com/anavica/mcc_ccattr_NCC and archived in the open repository ‘BORIS’ of the University of Bern under https://doi.org/10.48350/155666.
References
- 1.IPCCMasson-Delmotte V, et al., editors. Special Report on Global Warming of 1.5 °C. WMO; 2018. [Google Scholar]
- 2.Gasparrini A, et al. Mortality risk attributable to high and low ambient temperature: a multicountry observational study. Lancet. 2015;386:369–375. doi: 10.1016/S0140-6736(14)62114-0. [DOI] [PMC free article] [PubMed] [Google Scholar]
- 3.Hsiang S, et al. Estimating economic damage from climate change in the United States. Science. 2017;356:1362–1369. doi: 10.1126/science.aal4369. [DOI] [PubMed] [Google Scholar]
- 4.Ye X, et al. Ambient temperature and morbidity: a review of epidemiological evidence. Environ Health Perspect. 2012;120:19–28. doi: 10.1289/ehp.1003198. [DOI] [PMC free article] [PubMed] [Google Scholar]
- 5.Pachauri RK, Meyer LA, IPCC Core Writing Team . Climate Change 2014: Synthesis Report. IPCC; 2014. [Google Scholar]
- 6.Ebi KL, et al. Health risks of warming of 1.5 °C, 2 °C, and higher, above pre-industrial temperatures. Environ Res Lett. 2018;13:063007 [Google Scholar]
- 7.Bindoff NL, et al. In: Climate Change 2013: The Physical Science Basis. Stocker TF, et al., editors. Cambridge Univ.Press; 2013. pp. 867–952. [Google Scholar]
- 8.Cramer W, et al. In: IPCC Climate Change 2014: Impacts, Adaptation, and Vulnerability. Field CB, et al., editors. Cambridge Univ. Press; 2014. pp. 979–1037. [Google Scholar]
- 9.Ebi KL, Ogden NH, Semenza JC, Woodward A. Detecting and attributing health burdens to climate change. Environ Health Perspect. 2017;125:085004. doi: 10.1289/EHP1509. [DOI] [PMC free article] [PubMed] [Google Scholar]
- 10.Mitchell D, et al. Attributing human mortality during extreme heat waves to anthropogenic climate change. Environ Res Lett. 2016;11:074006 [Google Scholar]
- 11.Christidis N, Mitchell D, Stott PA. Anthropogenic climate change and heat effects on health. Int J Climatol. 2019;39:4751–4768. [Google Scholar]
- 12.Gasparrini A. Modeling exposure-lag-response associations with distributed lag non-linear models. Stat Med. 2014;33:881–899. doi: 10.1002/sim.5963. [DOI] [PMC free article] [PubMed] [Google Scholar]
- 13.Gasparrini A, Armstrong B. Reducing and meta-analysing estimates from distributed lag non-linear models. BMC Med Res Methodol. 2013;13:1. doi: 10.1186/1471-2288-13-1. [DOI] [PMC free article] [PubMed] [Google Scholar]
- 14.Sera F, Armstrong B, Blangiardo M, Gasparrini A. An extended mixed-effects framework for meta-analysis. Stat Med. 2019;38:5429–5444. doi: 10.1002/sim.8362. [DOI] [PubMed] [Google Scholar]
- 15.Vicedo-Cabrera AM, Sera F, Gasparrini A. Hands-on tutorial on a modeling framework for projections of climate change impacts on health. Epidemiology. 2019;30:321–329. doi: 10.1097/EDE.0000000000000982. [DOI] [PMC free article] [PubMed] [Google Scholar]
- 16.Gasparrini A, Leone M. Attributable risk from distributed lag models. BMC Med Res Methodol. 2014;14:55. doi: 10.1186/1471-2288-14-55. [DOI] [PMC free article] [PubMed] [Google Scholar]
- 17.Gillett NP, et al. The detection and attribution model intercomparison project (DAMIP v1.0) contribution to CMIP6. GeoSci Model Dev. 2016;9:3685–3697. doi: 10.5194/gmd-9-4521-2016. [DOI] [PMC free article] [PubMed] [Google Scholar]
- 18.Gillett NP, et al. Constraining human contributions to observed warming since preindustrial. Nat Clim Change. 2021;11:207–212. [Google Scholar]
- 19.Hempel S, Frieler K, Warszawski L, Schewe J, Piontek F. A trend-preserving bias correction—the ISI-MIP approach. Earth Syst Dynam. 2013;4:219–236. [Google Scholar]
- 20.Gasparrini A, et al. Changes in susceptibility to heat during the summer: a multicountry analysis. Am J Epidemiol. 2016;183:1027–1036. doi: 10.1093/aje/kwv260. [DOI] [PMC free article] [PubMed] [Google Scholar]
- 21.Åström DO, Forsberg B, Ebi KL, Rocklöv J. Attributing mortality from extreme temperatures to climate change in Stockholm, Sweden. Nat Clim Change. 2013;3:1050–1054. [Google Scholar]
- 22.Basu R. High ambient temperature and mortality: a review of epidemiologic studies from 2001 to 2008. Environ Health. 2009;8:40. doi: 10.1186/1476-069X-8-40. [DOI] [PMC free article] [PubMed] [Google Scholar]
- 23.Benmarhnia T, Deguen S, Kaufman JS, Smargiassi A. Vulnerability to heat-related mortality: a systematic review. Epidemiology. 2015;26:781–793. doi: 10.1097/EDE.0000000000000375. [DOI] [PubMed] [Google Scholar]
- 24.Gasparrini A, et al. Temporal variation in heat-mortality associations: a multicountry study. Environ Health Perspect. 2015;123:1200–1207. doi: 10.1289/ehp.1409070. [DOI] [PMC free article] [PubMed] [Google Scholar]
- 25.Vicedo-Cabrera AM, et al. A multi-country analysis on potential adaptive mechanisms to cold and heat in a changing climate. Environ Int. 2017;111:239–246. doi: 10.1016/j.envint.2017.11.006. [DOI] [PubMed] [Google Scholar]
- 26.Rogelj J, et al. Paris Agreement climate proposals need a boost to keep warming well below 2 °C. Nature. 2016;534:631–639. doi: 10.1038/nature18307. [DOI] [PubMed] [Google Scholar]
- 27.Gasparrini A, et al. Projections of temperature-related excess mortality under climate change scenarios. Lancet Planet Health. 2017;1:e360–e367. doi: 10.1016/S2542-5196(17)30156-0. [DOI] [PMC free article] [PubMed] [Google Scholar]
- 28.Vicedo-Cabrera AM, et al. Temperature-related mortality impacts under and beyond Paris Agreement climate change scenarios. Climatic Change. 2018;150:391–402. doi: 10.1007/s10584-018-2274-3. [DOI] [PMC free article] [PubMed] [Google Scholar]
- 29.Kottek M, Grieser J, Beck C, Rudolf B, Rubel F. World Map of the Köppen-Geiger climate classification updated. Meteorol Z. 2006;15:259–263. [Google Scholar]
- 30.Gasparrini A, Armstrong B, Kenward MG. Multivariate meta-analysis for non-linear and other multi-parameter associations. Stat Med. 2012;31:3821–3839. doi: 10.1002/sim.5471. [DOI] [PMC free article] [PubMed] [Google Scholar]
- 31.Gasparrini A. Distributed lag linear and non-linear models in R: the package dlnm. J Stat Softw. 2011;43:1–20. [PMC free article] [PubMed] [Google Scholar]
Associated Data
This section collects any data citations, data availability statements, or supplementary materials included in this article.
Supplementary Materials
Data Availability Statement
An example dataset is made available from https://github.com/anavica/mcc_ccattr_NCC and archived in the open repository ‘BORIS’ of the University of Bern under https://doi.org/10.48350/155666.
A sample of the code to reproduce the analysis is made available from https://github.com/anavica/mcc_ccattr_NCC and archived in the open repository ‘BORIS’ of the University of Bern under https://doi.org/10.48350/155666.


