Abstract
First-pass perfusion cardiac magnetic resonance (CMR) allows the quantitative assessment of myocardial blood flow (MBF). However, flow estimates are sensitive to the delay between the arterial and myocardial tissue tracer arrival time (t Onset) and the accurate estimation of MBF relies on the precise identification of t Onset. The aim of this study is to assess the sensitivity of the quantification process to t Onset at voxel level. Perfusion data were obtained from series of simulated data, a hardware perfusion phantom, and patients. Fermi deconvolution has been used for analysis. A novel algorithm, based on sequential deconvolution, which minimizes the error between myocardial curves and fitted curves obtained after deconvolution, has been used to identify the optimal t Onset for each region. Voxel-wise analysis showed to be more sensitive to t Onset compared to segmental analysis. The automated detection of the t Onset allowed a net improvement of the accuracy of MBF quantification and in patients the identification of perfusion abnormalities in territories that were missed when a constant user-selected t Onset was used. Our results indicate that high-resolution MBF quantification should be performed with optimized t Onset values at voxel level.
Index Terms: Myocardial perfusion quantification, tracer arrival time delay, voxel-wise
I. Introduction
FIRST-PASS perfusion cardiac magnetic resonance (CMR) allows the noninvasive and radiation-free assessment of myocardial blood flow (MBF) and enables a far better spatial resolution than nuclear medicine techniques [1]. Recently, the feasibility of quantitative voxel-wise analysis has been demonstrated by us and by others using a hardware perfusion phantom and microspheres in dogs, respectively [2], [3].
Voxel-wise quantification has the potential to combine the advantages of visual analysis with the objective and reproducible evaluation made possible by true quantitative assessment. However, before voxel-wise quantification becomes a robust clinical tool, there are several technical challenges to overcome. Voxelwise quantitative analysis involves lower signal-to-noise ratio (SNR) levels, which affect the accuracy of the MBF estimation [3].
Another source of error is the sensitivity of quantification methods such as Fermi function modeling to the delay between tracer arrival time into the arterial input and the tissue (t AIF and t Onset, respectively) and subsequently the data interval used for quantification [4]. Previously demonstrated for segmental analysis, this issue is likely to be even more important on a voxel-wise analysis due to the reduced SNR, which makes the selection of the real t Onset for each voxel even more difficult, and to significant variations of t Onset among different voxels within the same or different segments due to anatomical and physiological factors. Therefore, an optimization of these analysis parameters could potentially improve the accuracy of voxel-wise quantification. However, the individual optimization of t Onset for each voxel can be time consuming and warrants an automated method.
In the present study, we aimed to explore the latter issue systematically. In particular, we sought to demonstrate the importance of t Onset on voxel-wise MBF analysis and to propose a method for voxel-wise t Onset optimization. A preliminary version of this study has been reported [5], [6]
II. Theory
Prevalent available quantitative techniques for estimating MBF use the central volume principle and deconvolve the tissue signal during the first pass of a bolus of contrast agent with the arterial input function sampled from the LV or aorta. According to the central volume principle the concentration of the contrast agent in the tissue region C tiss(t) is related to the concentration of the contrast agent in the arterial input C aif (t) via the following convolution problem [7]:
| (1) |
where h(t) is the unknown tissue impulse response. Equation (1) needs to be deconvolved to estimate h(t) and, therefore, quantify the MBF according to h(t = 0).
The intensity values after arrival of the contrast agent into the blood pool and tissue will be used for quantification.
Assuming that the tissue residual curve C tiss(t) has been delayed by t rel dynamics respective to C aif (t), then (1) would be rewritten as
| (2) |
where t rel (relative t Onset) accounts for the delay time between the appearance of the signal in the LV blood pool and myocardial region of interest (ROI) (t rel = t Onset – t AIF).
This implies that the delayed tissue residue curve can be represented as convolution of the arterial input curve and a new impulse response (h*(t)), which is not equal to h(t) and results in a wrong estimation of MBF. If we line up the points in which the onset of contrast agent occurs in the left ventricular blood pool (t AIF) and tissue (t Onset), this delay will disappear and t rel = 0.
One of the most favorable and used deconvolution techniques is Fermi function modeling. Jerosch-Herold et al. [8] and Wilke et al. [9] fitted time curves for the tissue impulse response function h(t) to the Fermi function with the following analytical expression:
| (3) |
using a Marquardt-Levenberg nonlinear least-square algorithm by letting k, R, and τ 0 vary and keeping t rel fixed. In (3), u(t − t rel) is the unit step function; τ 0 characterizes the width of the shoulder of the Fermi function during which little or no contrast agent has left the ROI; R is the index of contrast agent influx parameter; and k represents the decay rate of h(t) due to contrast agent wash out.
Previous studies [10], [11] have fitted the h(t) to Fermi model, keeping t rel as a free global parameter and showed favorable results. However, Jerosch-Herold et al. [4] demonstrated sensitivity of Fermi to onset time of the curves at segmental level. At voxel level (i.e., high resolution), this sensitivity will be even higher due to low contrast-to-noise ratio (CNR) of the data and the significant variations of t Onset among different voxels. These factors might result in quantification errors at high resolution if not addressed correctly. It is therefore vital to evaluate the effects of using individual voxel’s onset time and appropriate interval of the data for high-resolution quantification.
Here, we developed an algorithm for the detection of individual voxel’s t Onset. The algorithm performs a sequential deconvolution to determine the dynamic with the smallest curve fit error (optimized t Onset).
The sequential deconvolution algorithm begins by using a starting t Onset equal to t AIF + 1dynamic. At each stage of the process, the residual curve fit error (i.e., x = ||C tiss(t) − C aif (t) ∗ h(t)||) for the obtained h(t) is calculated. This process continues by incrementing the t Onset by one dynamic, and it stops when the current dynamic residual error is greater than the 10 preceding dynamics. The dynamic with the smallest residual curve fit error is considered as the optimized t Onset. C tiss (t) and C aif (t) will be aligned in time based on the optimized t Onset, and it will be used for quantitative analysis.
III. Methods
In the first set of experiments, we used synthetic data to demonstrate the sensitivity of deconvolution and MBF estimation to the delay time between t AIF and t Onset.
Then we tested the accuracy of the t Onset detection algorithm and validated it against gold standard perfusion measurements using an MR-compatible perfusion phantom.
In both experiments, we evaluated the impact of CNR on the detection of the onset arrival time and, thus, on the accuracy of perfusion estimates. For this purpose, the original data were corrupted by adding Rician noise of variable amplitudes to both C aif (t) and C tiss(t) [12], [13]. The range of noise amplitude was chosen so that CNR in the both C aif (t) and C tiss(t) would be between 5 and 40. Equal noise amplitudes were added to both C aif (t) and C tiss(t) at each CNR level.
Finally, we compared the results of voxel-wise and segmental analysis performed with optimized t Onset with the results obtained from considering t Onset a free global parameter in phantom and in vivo.
All the analyses described in this study were performed using house-made software programmed with MATLAB (Mathworks, Natick, MA, USA, version R2010b). All data (phantom and patient) were acquired on a Philips Achieva 3T (TX) system, equipped with a 32-channel cardiac-phased array receiver coil (Philips Healthcare, Best, The Netherlands).
A. Simulated Data
Simulated data with known perfusion values [MBFGS = 1 to 5mL/(g · min)] have been generated using published methods [3].
For this propose, series of noiseless gold standard tissue impulse responses h GS(t) were constructed by using the following pharmacokinetic model, described by Lindsey et al. [14]:
| (4) |
where u(t) is the unit step function. The physiological parameters, i.e., λ 1, λ 2, and λ 3 were chosen to generate tissue responses of the same order as those obtained by the fitting of real series of DCE-CMR acquisitions [3].
C aif(t) used in this experiment is a convolution of many exponentials as suggested in [15] to model the propagation of an impulsive bolus injection through several compartments of the cardiovascular system
| (5) |
For simplicity, we assumed the same mean transit time (1/v > 0) and, thus, the same compartment kernel ve−vt for all compartments. Initial C tiss(t) was then obtained by convolving h GS (t) with the simulated C aif (t) [15].
Subsequently, Rician noise of different amplitudes (CNR = 5 to 30) was added to the data and sensitivity of the Fermi quantification method to the arrival time at different noise and flow rates was tested. The results of Fermi deconvolution with t Onset were compared with the outcome of quantification when τd is assumed to be free global parameter.
Moreover, simulated data were used to quantitatively evaluate the error in optimized t Onset estimation and efficiency of the automated t Onset detection algorithm. For this purpose, the actual t rel was kept fixed as 3 dynamics and the t Onset relative error (r trel) in synthetic data for the CNR levels of 5, 10, 20, and 30 and perfusion rates of 1, 2.5, and 5 mL/(g·min) was calculated as
| (6) |
At each flow rate and CNR level, an absolute error of (ea) was calculated as
| (7) |
where MBFGS is the gold standard perfusion value. The absolute error of the perfusion estimates at different flow and CNR levels was used to demonstrate the importance of time delay.
For the phantom and human data, the residual curve fit error is calculated as
| (8) |
B. Hardware Perfusion Phantom
The second experiment was performed on validated perfusion phantom data [3], [16], [17]. The perfusion phantom allows an efficient and reproducible simulation of myocardial perfusion acquisition, providing validated data suitable for quantification. Unlike the noiseless synthetic data, the phantom datasets are acquired using the same hardware, software, and similar sequence to those used in patients [17]. The perfusion phantom data were used to validate the sequential deconvolution algorithm at different levels of CNR and perfusion rate.
For this purpose, Rician noise of different amplitudes (CNR = 10 to 40) was added to the data. Sensitivity of the Fermi to t Onset and its accuracy at various flow rates [MBFGS = 1, 2.5, and 5 mL/(g·min)] under different CNR levels was tested. The results were compared with the outcome of quantification when τd is assumed to be a free global parameter.
Phantom data were acquired in one slice in a transverse geometry, visualizing the progression of the bolus of contrast agent in the large thoracic vessels and the myocardial compartments in the same image, with a saturation recovery gradient echo method (typical parameters: repetition time/echo time 3.0 ms/1.0 ms, flip angle 15°; effective k-t SENSE acceleration 3.8-fold, spatial resolution 1.2 × 1.2 × 10 mm, saturation delay 120 ms, matrix size 132 × 132, bandwidth 2.137 Hz, FOV 24 × 24 cm2) [18]–[20].
To avoid any confounding effects due to signal saturation, a universal dual-bolus injection scheme was performed in the perfusion phantom [21], similar to clinical data. In the phantom experiments, we used a dosage of Gadolinium of 0.001 mEq/kg of body weight as a prebolus and 0.01 mEq/kg of body weight as bolus (Gadobutrol Gadovist, Bayer Schering, Germany) [17]. The boluses were injected at 4 mL/s followed by a 20 mL saline flush. Here, the search for the inflection point in C tiss(t) starts from the dynamic in which the main bolus of contrast agent appears in the aorta of the phantom.
C. Clinical MR Data
The feasibility of automated t Onset detection algorithm and a comparison with using free global parameter for deconvolution were performed in a small group of healthy volunteers (n = 5) and patients (n = 5) with anginal symptoms and definite coronary artery disease on invasive coronary angiography. These patients were scanned using a clinical adenosine-stress perfusion protocol (140 μg/(kg·min) of adenosine for at least 3 min before the acquisition of the images). The study was performed at Guy’s and St Thomas’ Hospital London (U.K.). The institutional review board approved the study, and all subjects signed an informed consent to be included.
Patient’s perfusion data were acquired in three slices (apical, mid-cavity, and basal) in short-axis geometry with similar methods to the perfusion phantom experiment. Typical parameters for the saturation-recovery gradient echo method were: repetition time/echo time 3.0 ms/1.0 ms; flip angle 15°; effective k--t SENSE acceleration 3.8-fold; spatial resolution 1.2mm × 1.2mm × 10mm; saturation delay 120 ms; matrix size 251 × 251; bandwidth 724 Hz; FOV 31 × 31 cm2 [18]–[20].
Similarly to phantom experiments, a universal dual-bolus injection scheme was performed [21]. We used a dosage of Gadolinium of 0.0075 mEq/kg of body weight as a prebolus and 0.075 mEq/kg of body weight as bolus (Gadobutrol Gadovist). The boluses were injected at 4 mL/s followed by a 20 mL saline flush.
D. MR Image Processing
Accurate voxel-based MBF estimation requires respiratory motion correction and myocardial contour delineation. We developed an automated approach based on published methods [22], [23], in which respiratory motion was removed using affine image registration by maximization of the joint correlation between consecutive dynamics within an automatically determined region of interest. Then, a temporal maximum intensity projection was calculated to serve as a feature image for an automatic contour delineation method based on active contour models [22]–[25]. Signal intensities were then sampled using bilinear interpolation at a grid of 60 angular positions and 10 transmural positions (or layers). The transmural positions were located on chords perpendicular to the myocardial centerline [24], [26]. To maximize reproducibility of MBF quantification, care was taken to obtain C aif (t) in a robust and reproducible way. C aif (t) was obtained by sampling the trimmed median intensity within a region of interest in the blood pool of the basal slice. To be robust against the presence of papillary muscles, the region of interest was obtained by downscaling the endocardium contours. Furthermore, the trimmed median operator ignores 15% of outlier samples [25].
Prior to deconvolution analysis, baseline correction that includes scaling of the signal intensities proportional to coil sensitivity and correcting for an offset to shift the baseline signal to zero has been performed. The constrained least-square problems were solved using lsqnonlin in MATLAB [15], [27]. The perfusion estimates were computed by deconvolving the measured blood and tissue enhancement data during the first pass of contrast agent in myocardium.
Absolute error (ea) has been used to compare the outcome of the quantification in synthetic and phantom data where a standard reference was available. Analysis of variance (ANOVA) has been used in patients and phantom to compare the results of using optimized t Onset for quantification with assuming τd as a free global parameter.
IV. Results
A. Simulated Data
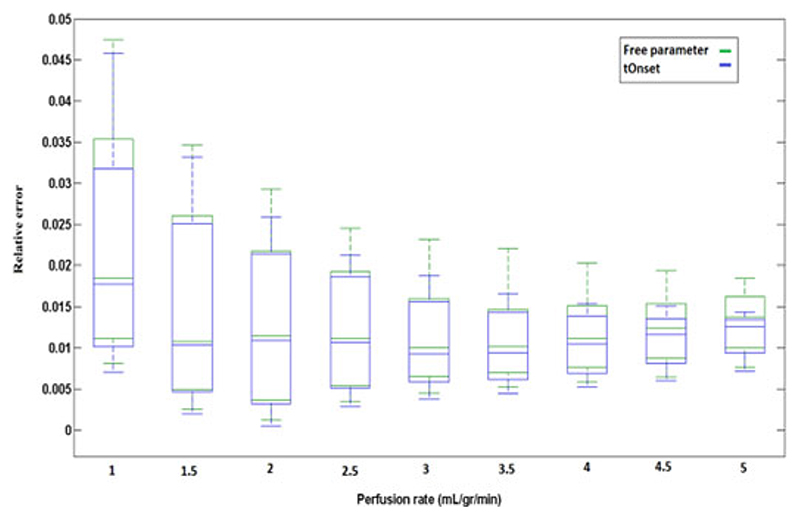
The box plots in Fig. 1 represent the relative error(r = ea/MBFGS) in estimation of MBF at different perfusion rates over a range of CNR level (CNR = 5 − −30). This figure compares the accuracy and performance of Fermi with onset (MBFonset) and Fermi model with τd as a free global parameter (MBFfree) and examines their robustness to CNR level. Both of the quantification approaches (i.e., Fermi with onset and Fermi with τd as a free global parameter) showed to be more sensitive to CNR level of the data at low flow rates. This sensitivity to noise is higher when τd has been kept as a free global parameter.
Fig. 1.
Box plot representing the relative error (r) in estimation of MBF using Fermi method when τd has been kept as a free global parameter (Green/Dashed box) and when optimized t Onset has been used at different flow rates (Blue/Solid box). At each flow rate the range of CNR varies from 5 to 30. Sensitivity of the quantification methods has decreased as the flow rates increased.
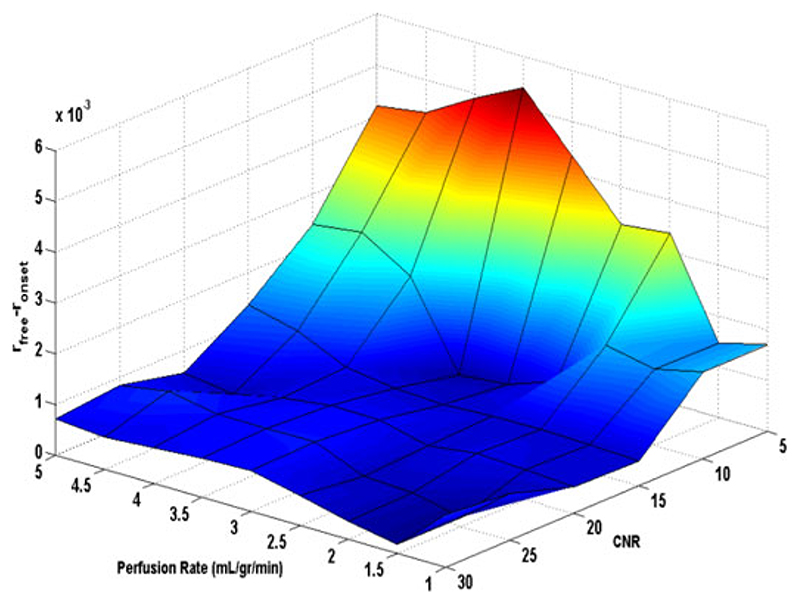
In Fig. 2, differences between relative error r onset and r free(|e afree − e aonset | /MBFGS = r free − r onset) at different noise (CNR levels ranging from 5 to 30) and perfusion rates [MBF ranging from 1 to 5 mL/(g·min)] is shown in a surface plot.
Fig. 2.
Surface plot representing the difference between estimated r onset and r free (|ea free − ea onset | /MBFGS) overflow rate of 1–5 mL/(g·min) and CNR level of 5–30 for simulated data.
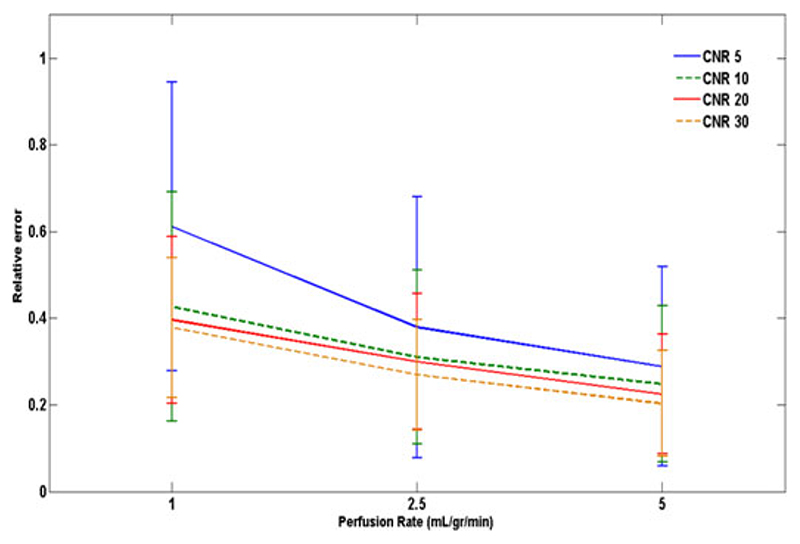
Fig. 3 represents the relative error in estimation of optimized t Onset (r trel) for the CNR levels of 5,10,20, and 30 and perfusion rates of 1,2.5, and 5 mL/(g·min). The automated t Onset detection algorithm showed to be sensitive to CNR level and perfusion rate. Best match to the actual onset of the data was achieved at CNR = 30 for all flow rates.
Fig. 3.
Error bars representing the relative error in estimation of optimized t Onset (r trel) in synthetic data for different levels of CNR and perfusion rates. Actual t rel here is equal to 3 dynamics.
B. Hardware Perfusion Phantom
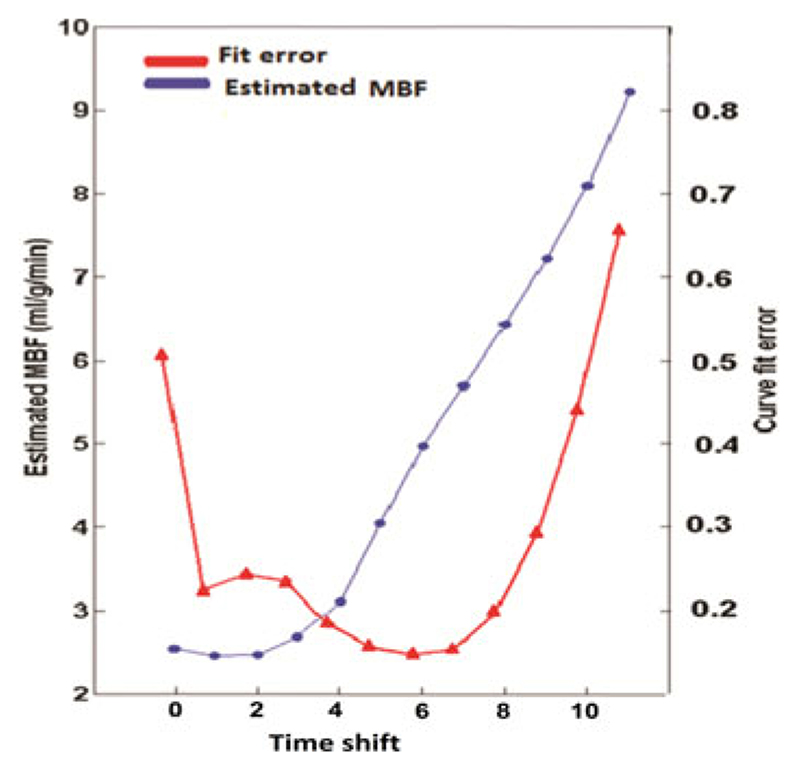
In order to validate the t Onset detection algorithm in the perfusion phantom with MBFGS = 5 mL/(g·min), the estimated MBF with its corresponding curve fit error at each step of the sequential deconvolution in a random voxel has been calculated and shown in Fig. 4. The deconvolution process has begun from the starting t Onset (t AIF + 1) and it has been repeated for 10 consecutive dynamics.
Fig. 4.
Estimated MBF (blue circles) with its corresponding curve fit error (red triangles) for a random voxel in perfusion phantom with MBFgs = 5 mL/(g·min). The horizontal axis shows the shift of the starting t Onset. The dynamic that gives the smallest curve fit error corresponds to the smallest absolute error. Here, t rel is equal to timeshift + 1 as the sequential process starts form t AIF + 1 (t rel = timeshift + 1). These results demonstrate that the sequential deconvolution algorithm can be used to detect the optimized t Onset.
The dynamic with the smallest curve fit error corresponded to the smallest absolute error (ea/x = 0.4/0.15). This dynamic was the optimal t Onset selected by the automatic t Onset detection algorithm. Here, a small shift from the optimized t Onset resulted in a significant error in estimated MBF value demonstrating sensitivity of the deconvolution algorithm into t Onset.
Fig. 5 is a scatter box plot of the estimated MBF values in the phantom with MBFGS = 5mL/(g · min), comparing MBFonset for voxel-wise quantification (low CNR) with MBFfree. A significant difference between the MBFfree and MBFonset for voxel-wise analysis was seen (P-values = 1.3E–98).
Fig. 5.
Scatter box plot representing the estimated voxel-wise MBF values in the phantom [average MBFGS = 5 mL/(g·min)], comparing the results obtained using an optimized t Onset with keeping τd as a free global parameter. Each individual green dot shows the estimated MBF at each voxel, and they have been spread for visualization reasons and clarity. On each blue box, the central red mark is the median; the edges of the box are the 25th and 75th percentiles. The CNR of the phantom data at voxel-wise analysis was equal to 19 ± 3.8.
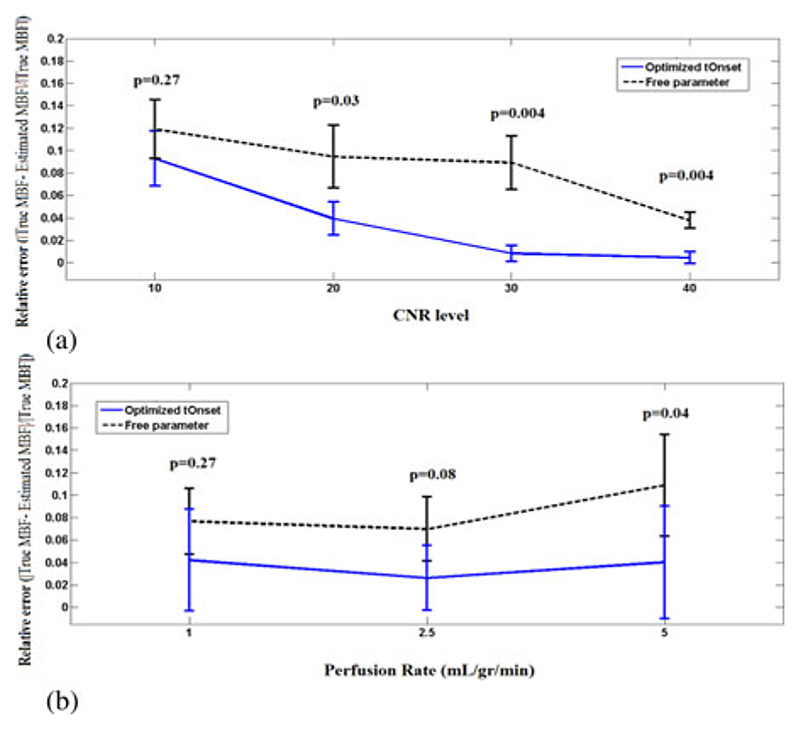
The error bars in Fig. 6(a) and (b) represent the mean and standard deviation of the relative error (r) for both MBFonset and MBFfree in the perfusion phantom at various CNR (10−40) and flow rates [1,2.5, and 5 mL/(g·min)], respectively. Here, in both figures, Fermi with optimized t Onset showed to have less error and be more accurate at all conditions.
Fig. 6.
Error bar plot representing the mean ± SD of MBF relative error r onset (solid line/blue) and r free (dashed line/back), under different CNR (a) and flow rates (b). Data in (a) are average over all flow rates (i.e. 1,2.5, and 5 mL/gr/min) at each CNR level and in (b) are averaged over all CNR levels (10, 20, 30, and 40) for each flow rates. At all flow and CNR levels Fermi with optimized t Onset performed favorably compared to Fermi with τd as a free global parameter. The difference between the two approaches is more apparent at CNR levels = 20 and 30 [see Fig. 6(a)] and high flow rates [see Fig. 6(b)].
Fig. 6 demonstrates that keeping τd as a free global parameter for deconvolution yields to a higher relative error compared to when an optimized t Onset has been used at all CNR levels and flow rates. This difference is more apparent at low CNR levels [see Fig. 6(a)] and high flow rates [see Fig. 6(b)].
In Fig. 6(a), a significant difference between the obtained values using optimized t Onset and with keeping τd as a free global parameter at low CNR levels (P < 0.05) was observed. These two approach, however, performed similarly at high CNR levels (P > 0.05).
At low flow rates [Fig. 6(b)] [i.e., MBF1 mL/(g·min)], there is not a significant difference between optimized t Onset and with keeping Td as a free global parameter due to low level of contrast enhancement, which has impaired the assessment of t Onset. Similar results were observed for synthetic data at low flow rates (see Fig. 2).
C. Clinical MR Data
In order to demonstrate the importance of tracer arrival time detection for myocardial perfusion estimation in clinical MR data, first we have examined the myocardial segmental analysis sensitivity to tracer arrival time. Then the t Onset detection algorithm has been applied to voxel-wise analysis and sensitivity of voxel-wise analysis to tracer arrival time has been tested. Voxel-wise results have been compared with the results obtained from segmental analysis.
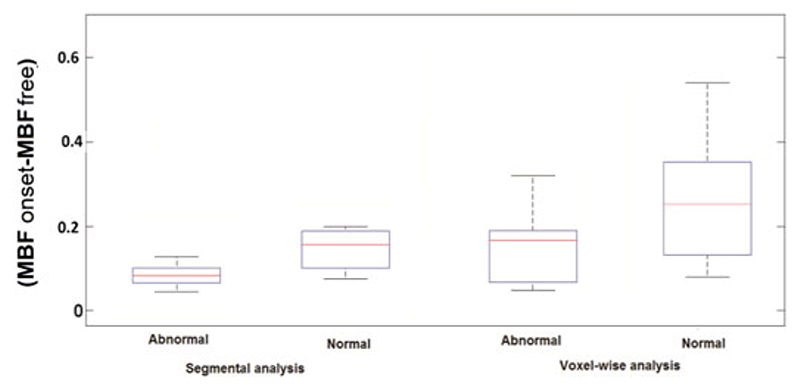
Fig. 7 compares (|MBFonset − MBFfree|) obtained from segmental analysis (high CNR) with voxel-wise analysis (low CNR) in normal and ischemic regions of a group of patients. The results show a high discrepancy between MBFonset and MBFfree in normal and ischemic regions in voxel-wise analysis compared to segmental analysis. This difference is more apparent in normal regions of the voxel-wise analysis.
Fig. 7.
Box plot representing the difference between MBFonset and MBFfree from quantification in segmental and voxel-wise analysis in a group of patients. The difference between the obtained MBF values in both normal and ischemic regions of myocardium in voxel-wise analysis (low CNR, CNR = 17 ± 5.2) is higher than found in segmental analysis (high CNR, CNR = 28 ± 3.7). This higher difference proves the sensitivity of voxel-wise analysis to tracer arrival times. No significant difference between the results obtained in segmental analysis with and without using optimized t Onset was observed.
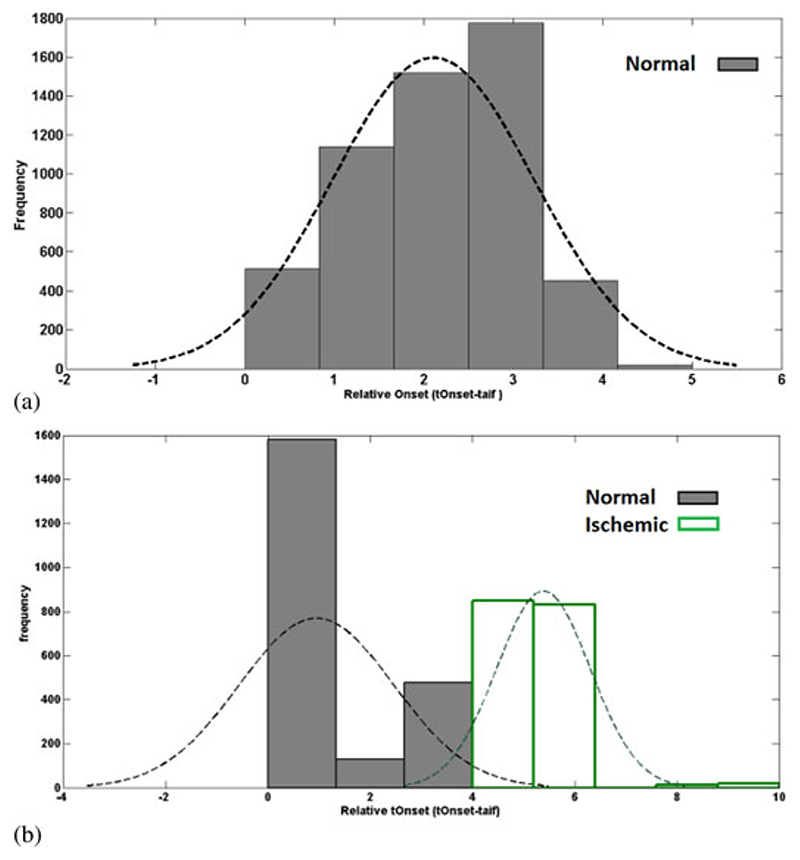
Histograms of relative t Onset (t rel) values in a group of healthy volunteers and patients are represented in Fig. 8(a) and (b), respectively. In healthy volunteers group, relative t Onset has a homogenous distribution with the majority of the values distributed between 1 and 4 s. This figure demonstrates that t Onset detection algorithm does not lead to tOnset variations.
Fig. 8.
Histogram of the relative t Onset data in a group of (a) healthy volunteers and (b) patients. In the healthy volunteers group, relative tOnset has a homogenous distribution. The distribution of the values in patient’s pool is divided into two groups. First one is between 0 and 4 s, which corresponds to normal areas. Second group of values that are between 4 and 10 s are associated with the ischemic areas in the patients.
On the other hand, as it can be seen from Fig. 8(b), the distribution of the values in patient’s pool is divided into two groups: first one is between 0 and 4 s; second one is between 4 and 10 s. Here, more than 80% of the values, which are related to normal voxels in this group, are distributed between 0 and 4 s. Voxels with relative t Onset between 5 and 10 s are associated with the ischemic areas in the group of patients.
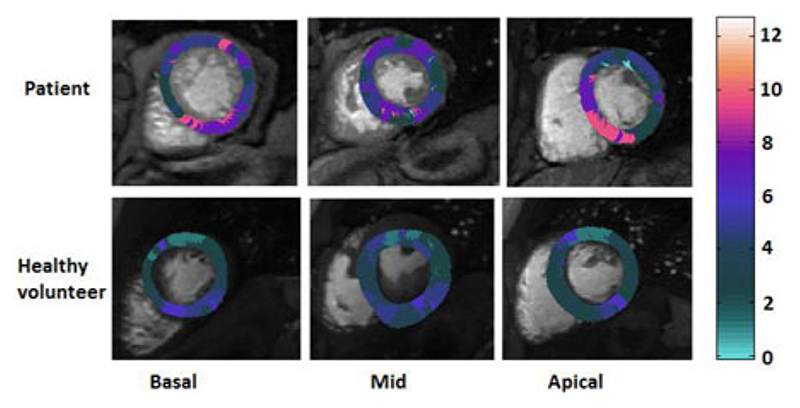
The relative t Onset (t rel) in myocardial basal, mid-cavity, and apical layers in a random patient with abnormal perfusion and a healthy volunteer is represented in Fig. 9. The inhomogeneity of the t Onset is apparent in the patient’s t Onset maps, whereas the healthy volunteer showed to have a relatively homogeneous distribution of t Onset, which is also shorter on average.
Fig. 9.
Delay maps illustrating the relative t Onset (t rel) in (top row) apatient with right coronary artery (RCA) disease and (bottom row) a healthy volunteer. The inhomogeneity of the t Onset in the tissue is apparent in the patient’s t Onset map. The healthy volunteer delay map showed to have a relatively homogenous distribution of t Onset. The difference between tOnset in voxels makes voxelwise quantification of MBF without using their real onset time inadequate.
On a 2.8 GHz PC, optimized t Onset approach takes around 1.8 min and free parameter approach just less than a minute to perform the analysis.
Table I represents the coefficient of variation of the tOnset value for the five patients and five volunteers. A significant difference between the CV in the patient group and healthy volunteer group was observed (P-value = 0.0004). Overall, patients had a higher CV compared to healthy volunteers.
Table I. tOnset Coefficient of Variation in the Five Patients and Five Volunteers.
| Subject | Patients | Healthy Volunteers |
|---|---|---|
| 1 | 0.59 | 0.45 |
| 2 | 0.62 | 0.24 |
| 3 | 0.55 | 0.31 |
| 4 | 0.78 | 0.19 |
| 5 | 0.53 | 0.27 |
V. Discussion
Based on the results obtained in vivo, in a hardware phantom and in computer simulations, we have shown that quantification of myocardial perfusion is sensitive to the delay between the arrival of contrast agent into the LV blood pool and myocardial tissue and consequently an inaccurate selection of tracer arrival time can cause a significant error in estimation of MBF.
As our results demonstrated, this issue becomes even more important in voxel-wise analysis as it is more sensitive to delay time compared with a segmental analysis due to its higher spatial detail and lower CNR level. Therefore, the use of an optimized t Onset for deconvolution is needed to improve the accuracy of MBF estimations.
This study proposes to improve flow estimates in voxel-wise analysis by automatically finding the delay between t AIF and t Onset in each voxel and use it for quantification of MBF.
In this study, the assessment of reconstructed tissue curve goodness of fit as a function of the time shift was the basis for determining the optimized t Onset and, consequently, improving the accuracy of flow estimates. The algorithm introduced here considers the interaction between the delay time and the fit error to obtain an optimal estimate of the t Onset.
Our results demonstrated that the proposed algorithm for detection of t Onset is highly sensitive to noise level and flow rate. The proposed method showed to be more accurate in estimating the onset time of contrast agent at high CNR levels and flow rates.
However, despite the hurdle in estimation of onset time, using the optimized t Onset approach for quantitative analysis at low CNR levels (i.e., voxel-wise analysis) results in a higher accuracy in estimation of MBF compared with when the delay between t AIF and t Onset has been assumed as a free global parameter. Moreover, optimized t Onset method showed to be more accurate in estimation of MBF at all flow rates compared with when t Onset is assumed as a free global parameter.
Similar results were reflected in our experiments and clinical data, where the use of optimized t Onset allowed a significant improvement in the accuracy of the voxel-wise perfusion maps.
Moreover, the difference between the delay times in arrival of contrast agent in myocardium normal and ischemic voxels allows for the evaluation of diseased areas of by estimating the time point of tracer arrival at a particular voxel. This parameter, which its estimation is less complex compared to deconvolution analysis, could also be used as an impaired flow reserve marker with the ability distinguish between the arrival time at endocardial and epicardial segments.
A. Limitations
The clinical findings presented here are preliminary and meant to demonstrate the feasibility of t Onset optimization on patients’ data. Additional studies involving a larger cohort of patients are necessary to better determine the predictive power of MBF maps.
To determine the impact of t Onset estimation on accurate quantitative flow estimation in patients, future prognostic studies testing the importance of voxel-wise MBF analysis in patients will be required. Moreover, a systematic study needs to be conducted to evaluate the impact of baseline correction on the t Onset estimation algorithm and, consequently, the accuracy of quantitative MBF assessment.
It is important to note that myocardium signal intensity curves should always be aligned with the bolus of arterial input function of interest, independent of the used method (i.e., main bolus when dual-sequence or single-bolus techniques are used and prebolus when dual bolus is used). This is, however, not shown by the data presented in this paper, and a further study evaluating effects of t Onset estimation on these techniques is required.
Also, it is expected to have longer relative t Onset at apical layer compared to basal and mid-cavity slice. However, due to the faster speed of blood at apical coronary arteries (200–500 cm/s at rest) and more importantly the relatively low temporal resolution of the perfusion CMR, the capacitance effects of epicardial vessels are masked. This issue has not been addressed in this study and requires further investigations.
VI. Conclusion
Voxel-wise perfusion estimates based on first pass perfusion CMR have many desirable characteristics including high sensitivity in identifying the tissue at risk. MBF estimates, however, are biased by several factors, including the tracer arrival time into myocardial tissue, and therefore attempts to quantify MBF without using the t Onset may be premature. An accurate estimation of MBF and thus clearer delineation of the ischemic region in the perfusion maps relies on the precise identification of t Onset.
Fig. 10.
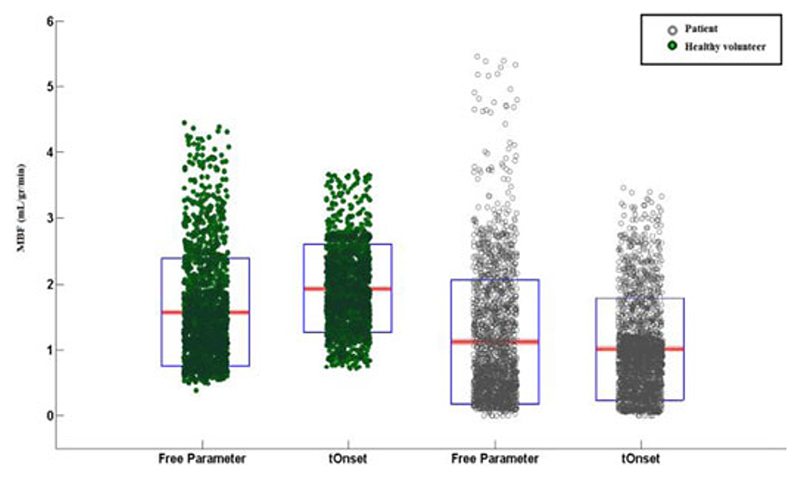
Scatter-box plot representing the estimated voxel wise MBF values in a patient with RCA disease (empty circle/grey) and a healthy volunteer (filled circles/green), comparing results obtained using an optimized tOnset with keeping as a free global parameter. Each individual green dot shows the estimated MBF at each voxel and they have been spread for visualization reasons and clarity. On each blue box, the central red mark is the median; the edges of the box are the 25th and 75th percentiles.
Acknowledgments
The work of the Medical Engineering Centre was funded by the Wellcome Trust and EPSRC under Grant WT 088641/Z/09/Z. This work was supported by the Department of Health via the National Institute for Health Research (NIHR) comprehensive Biomedical Research Centre award to Guy’s and St Thomas’ NHS Foundation Trust in partnership with King’s College London. The work of E. Nagel was supported by Philips Healthcare and Bayer Schering Healthcare. The work of A. Chiribiri was supported by Philips Healthcare.
Contributor Information
Niloufar Zarinabad, Division of Imaging Sciences and Biomedical Engineering, The Rayne Institute, St. Thomas’ Hospital, London, SE1 7EH, U.K.
Gilion L. T. F. Hautvast, Email: Gilion.Hautvast@Philips.Com, Philips Group Innovation-Healthcare Incubators, Philips Research High Tech Campus 34 5656 AE Eindhoven, The Netherlands.
Eva Sammut, Email: eva.sammut@kcl.ac.uk, Division of Imaging Sciences and Biomedical Engineering, The Rayne Institute, St. Thomas’ Hospital, London, SE1 7EH, U.K.
Aruna Arujuna, Email: aruna.arujuna@kcl.ac.uk, Division of Imaging Sciences and Biomedical Engineering, The Rayne Institute, St. Thomas’ Hospital, London, SE1 7EH, U.K.
Marcel Breeuwer, Email: marcel.breeuwer@philips.com, Philips Healthcare, Imaging Systems-MR 5680, DA Best, The Netherlands and is also with the Biomedical Engineering, Biomedical Image Analysis, Eindhoven University of Technology, PO Box 513 - NL-5600 MB Eindhoven, The Netherlands.
Eike Nagel, Email: eike.nagel@kcl.ac.uk, Division of Imaging Sciences and Biomedical Engineering, The Rayne Institute, St. Thomas’ Hospital, London, SE1 7EH, U.K.
Amedeo Chiribiri, Email: amedeo.chiribiri@kcl.ac.uk, Division of Imaging Sciences and Biomedical Engineering, The Rayne Institute, St. Thomas’ Hospital, London, SE1 7EH, U.K.
References
- [1].Ishida M, Morton G, Schuster A, Nagel E, Chiribiri A. Quantitative assessment of myocardial perfusion MRI. Curr Cardiovasc Imag Rep. 2010;3:8. [Google Scholar]
- [2].Hsu LY, Groves DW, Aletras AH, Kellman P, Arai AE. A quantitative pixel-wise measurement of myocardial blood flow by contrast-enhanced first-pass CMR perfusion imaging: Microsphere validation in dogs and feasibility study in humans. JACC Cardiovasc Imag. 2012 Feb;5(2):154–166. doi: 10.1016/j.jcmg.2011.07.013. [DOI] [PMC free article] [PubMed] [Google Scholar]
- [3].Zarinabad N, Chiribiri A, Hautvast GL, Ishida M, Schuster A, Cvetkovic Z, Batchelor PG, Nagel E. Voxel-wise quantification of myocardial perfusion by cardiac magnetic resonance. Feasibility and methods comparison. Magn Resonance Med. 2012 Dec;68(6):1994–2004. doi: 10.1002/mrm.24195. [DOI] [PMC free article] [PubMed] [Google Scholar]
- [4].Jerosch-Herold M, Hu X, Murthy NS, Seethamraju RT. Time delay for arrival of MR contrast agent in collateral-dependent myocardium. IEEE Trans Med Imag. 2004 Jul;23(7):881–890. doi: 10.1109/TMI.2004.827969. [DOI] [PubMed] [Google Scholar]
- [5].Zarinabad N, Hautvast G, Breeuwer M, Nagel E, Chiribiri A. Effect of tracer arrival time on the estimation of the myocardial perfusion in DCE-CMR. J Cardiovasc Magn Resonance. 2012;14(1):1. [Google Scholar]
- [6].Zarinabad N, Hautvast G, Breeuwer M, Chiribiri A, Nagel E. Sensitivity of quantification methods to tracer arrival time for myocardial perfusion estimation in DCE-MRI. Eur Heart J. 2012;33:192. [Google Scholar]
- [7].Zierler K. Indicator dilution methods for measuring blood flow, volume, and other properties of biological systems: A brief history and memoir. Ann Biomed Eng. 2000 Aug;28(8):836–48. doi: 10.1114/1.1308496. [DOI] [PubMed] [Google Scholar]
- [8].Jerosch-Herold M, Wilke N, Stillman AE. Magnetic resonance quantification of the myocardial perfusion reserve with a Fermi function model for constrained deconvolution. Med Phys. 1998 Jan;25(1):73–84. doi: 10.1118/1.598163. [DOI] [PubMed] [Google Scholar]
- [9].Wilke N, Jerosch-Herold M, Wang Y, Huang Y, Christensen BV, Stillman AE, Ugurbil K, McDonald K, Wilson RF. Myocardial perfusion reserve: Assessment with multisection, quantitative, first-pass MR imaging. Radiology. 1997 Aug;204(2):373–384. doi: 10.1148/radiology.204.2.9240523. [DOI] [PubMed] [Google Scholar]
- [10].Hsu LY, Rhoads KL, Holly JE, Kellman P, Aletras AH, Arai AE. Quantitative myocardial perfusion analysis with a dual-bolus contrast-enhanced first-pass MRI technique in humans. J Magn Reson Imag. 2006 Mar;23(3):315–22. doi: 10.1002/jmri.20502. [DOI] [PubMed] [Google Scholar]
- [11].Pack NA, DiBella EV. Comparison of myocardial perfusion estimates from dynamic contrast-enhanced magnetic resonance imaging with four quantitative analysis methods. Magn Reson Med. 2010 Jul;64(1):125–137. doi: 10.1002/mrm.22282. [DOI] [PMC free article] [PubMed] [Google Scholar]
- [12].Gudbjartsson H, Patz S. The Rician distribution of noisy MRI data. Magn Reson Med. 1995 Dec;34(6):910–914. doi: 10.1002/mrm.1910340618. [DOI] [PMC free article] [PubMed] [Google Scholar]
- [13].Rajan J, Poot D, Juntu J, Sijbers J. Noise measurement from magnitude MRI using local estimates of variance and skewness. Phys Med Biol. 2010 Aug 21;55(16):N441–N449. doi: 10.1088/0031-9155/55/16/N02. [DOI] [PubMed] [Google Scholar]
- [14].Lindsey JK, Byrom WD, Wang J, Jarvis P, Jones B. Generalized nonlinear models for pharmacokinetic data. Biometrics. 2000 Mar;56(1):81–88. doi: 10.1111/j.0006-341x.2000.00081.x. [DOI] [PubMed] [Google Scholar]
- [15].Keeling SL, Kogler T, Stollberger R. Deconvolution for DCE-MRI using an exponential approximation basis. Med Image Anal. 2009 Feb;13(1):80–90. doi: 10.1016/j.media.2008.06.011. [DOI] [PubMed] [Google Scholar]
- [16].Chiribiri A, Schuster A, Ishida M, Hautvast G, Zarinabadnooralipour N, Paul M, Hussain S, Batchelor P, Breeuwer M, Schaeffter T, Nagel E. Dynamic simulation of first pass myocardial perfusion MR with a novel perfusion phantom. J Cardiovasc Magn Reson. 2011;13:46. [Google Scholar]
- [17].Chiribiri A, Schuster A, Ishida M, Hautvast G, Zarinabad N, Morton G, Otton J, Plein S, Breeuwer M, Batchelor P, Schaeffter T, et al. Perfusion phantom: An efficient and reproducible method to simulate myocardial first-pass perfusion measurements with cardiovascular magnetic resonance. Magn Resonance Med. 2012 Apr 24; doi: 10.1002/mrm.24299. [DOI] [PMC free article] [PubMed] [Google Scholar]
- [18].Plein S, Ryf S, Schwitter J. Dynamic contrast-enhanced myocardial perfusion MRI accelerated with k-t sense. Magn Reson Med. 2007 Oct;58(4):777–785. doi: 10.1002/mrm.21381. [DOI] [PubMed] [Google Scholar]
- [19].Plein S, Schwitter J, Suerder D, Greenwood JP, Boesiger P, Kozerke S. k-Space and time sensitivity encoding-accelerated myocardial perfusion MR imaging at 3.0 T: Comparison with 1.5 T. Radiology. 2008 Nov;249(2):493–500. doi: 10.1148/radiol.2492080017. [DOI] [PMC free article] [PubMed] [Google Scholar]
- [20].Gebker R, Jahnke C, Paetsch I, Schnackenburg B, Kozerke S, Bornstedt A, Fleck E, Nagel E. MR myocardial perfusion imaging with k-space and time broad-use linear acquisition speed-up technique: Feasibility study. Radiology. 2007 Dec;245(3):863–871. doi: 10.1148/radiol.2453061701. [DOI] [PubMed] [Google Scholar]
- [21].Ishida M, Schuster A, Morton G, Chiribiri A, Hussain S, Paul M, Merkle N, Steen H, Lossnitzer D, Schnackenburg B, Alfakih K, et al. Development of a universal dual-bolus injection scheme for the quantitative assessment of myocardial perfusion cardiovascular magnetic resonance. J Cardiovasc Magn Reson. 2011 May 24;13(1):28. doi: 10.1186/1532-429X-13-28. [DOI] [PMC free article] [PubMed] [Google Scholar]
- [22].Breeuwer M, Quist M, Spreeuwers L. Automatic quantitative analysis of cardiac MR perfusion images; Proc SPIE Med Imag; San Diego, CA, USA. 2001. pp. 733–742. [Google Scholar]
- [23].Spreeuwers L, Breeuwer M. Automatic detection of myocardial boundaries in MR cardio perfusion images; Proc Med Image Comput Comput-Assisted Intervention; Utrecht, The Netherlands. 2001. pp. 1228–1231. [Google Scholar]
- [24].Hautvast GL, Chiribiri A, Lockie T, Breeuwer M, Nagel E, Plein S. Quantitative analysis of transmural gradients in myocardial perfusion magnetic resonance images. Magn Resonance Med Official J Soc Magn Resonance Med. 2011 Nov;66(5):1477–1487. doi: 10.1002/mrm.22930. [DOI] [PMC free article] [PubMed] [Google Scholar]
- [25].Hautvast G, Chiribiri A, Zarinabad N, Schuster A, Breeuwer M, Nagel E. Myocardial blood flow quantification from MRI by deconvolution using an exponential approximation basis. IEEE Trans Biomed Eng. 2012 Jul;59(7):2060–2067. doi: 10.1109/TBME.2012.2197620. [DOI] [PMC free article] [PubMed] [Google Scholar]
- [26].Chiribiri A, Hautvast GL, Lockie T, Schuster A, Bigalke B, Olivotti L, Redwood SR, Breeuwer M, Plein S, Nagel E. Assessment of coronary artery stenosis severity and location: Quantitative analysis of transmural perfusion gradients by high-resolution MRI versus FFR. JACC Cardiovasc Imag. 2013 May;6(5):600–609. doi: 10.1016/j.jcmg.2012.09.019. [DOI] [PMC free article] [PubMed] [Google Scholar]
- [27].Gill PE, Murray W, Wright MH. Practical Optimization. Academic Press; London, U.K./New York, NY, USA: 1981. [Google Scholar]


